Data Descriptor

System for Collecting, Processing, Visualization, and Storage of the MT-Monitoring Data

Research Station of the Russian Academy of Sciences in Bishkek, Bishkek 720049, Kyrgyzstan
*
Author to whom correspondence should be addressed.
Submission received: 20 May 2019 / Revised: 3 July 2019 / Accepted: 12 July 2019 / Published: 14 July 2019
(This article belongs to the Special Issue Overcoming Data Scarcity in Earth Science)

Abstract

:

Abstract

On the basis of the Research Station of the Russian Academy of Sciences in Bishkek, a unique scientific infrastructure—a complex geophysical station—is successfully functioning, realizing a monitoring of geodynamic processes, which includes research on the network of points of seismological, geodesic, and electromagnetic observations on the territory of the Bishkek Geodynamic Proving Ground located in the seismically active zone of the Northern Tien Shan. The scientific and practical importance of monitoring the geodynamical activity of the Earth’s crust takes place not only in seismically active regions, but also in the areas of the location of particularly important objects, mining, and hazardous industries. Therefore, it seems highly relevant to create new software and hardware to study geodynamic processes in the earth’s crust of seismically active zones, based on integrated monitoring of the geological environment in the widest possible depth range. The use of modern information technology in such studies provides an effective data management tool. The considering system for collecting, processing, and storing monitoring electromagnetic data of the Bishkek geodynamic proving ground can help overcome the scarcity of experimental data in the field of Earth sciences.

Dataset

For general use, a center for collective use of scientific equipment “Integrated geodynamic research” (CCU IGR) was created, on the basis of the Research Station of the Russian Academy of Sciences in Bishkek (RS RAS) (http://ckp-rf.ru/auth/). Through it, you can register and get access to data that is laid out for general use. In open access on the Internet, EDI-files on the MANAS profile are posted at http://ds.iris.edu/spud/emtf.

1. Summary

The complex of regional geophysical works, including magnetotelluric studies, is carried out in almost all major tectonic provinces worldwide. One of the tasks of such a complex is to study the geodynamic state of the regions and assess the development and distribution of hazardous geological processes. Tien Shan region is one of the most tectonically active. This paper discusses the information aspects of the developed technology of multidisciplinary geophysical monitoring of geodynamic processes in the Earth’s crust seismically active regions. The approach to the created technology is based on the integrated use of structural-functional and object-oriented information models. The developed structural-functional information model describes the processes of obtaining, storing and converting raw electromagnetic data, measured by magnetotelluric soundings method (MTS), and the object-oriented model used for describing the data itself (initial, intermediate, and final) and the relationships between them. The models are built using CASE tools All Fusion (Business Process Modeler—BPwin) and Power Designer, to define the boundaries and hierarchical structure of the developed system. The created technology provides an effective information system for integrated geophysical monitoring of geodynamic processes originating in the earth’s crust of the seismically active zone of the Northern Tien Shan (the territory of the Bishkek geodynamic polygon) [1,2,3]. The main element of the complex geophysical monitoring is electromagnetic observations with a natural source of electromagnetic fields, which include magnetotelluric (MT) continuous observations of changes in the electrical parameters of the geoelectric cross-section at stationary points, continuous geomagnetic observations of the full vector T of the geomagnetic field at stationary points of the network and periodic observations at controlled points served by mobile stations. MT observations are used to determine variations of electromagnetic parameters in the Tien Shan lithosphere to a depths of 100 km and to study their relationship with geodynamic processes, occurring at these depths.
This work represents the results of research related to the development of azimuthal magnetotelluric monitoring techniques, which consists of analyzing the obtained time series of electromagnetic parameters in order to determine the contribution of each of the components of the impedance tensor to the informativeness of monitoring studies [3]. On the basis of the correlation analysis of gravitational tidal effects and the results of magnetotelluric monitoring, an additional test is carried out, the previously identified azimuthal dependence of the environmental stress sensitivity. When performing modern monitoring studies, scientists have to face an unprecedented amount of data that is subject to orderly storage, processing, graphical visualization and analysis [4]. Both stations are located on the territory of the Bishkek geodynamic proving ground, which in turn is part of the Northern Tien Shan seismic zone (Figure 1), and data is recorded around the clock in the period of 0.01–1000 s. Over the years of research, a catalog of geoelectrical data based on magnetotelluric soundings (MTS) and magnetovariational soundings (MVS) made in a series of regional and local profiles in the range of periods from 0.06 to 1800 s, created in the Tien Shan region, has been constantly updated. The catalog also includes the results of deep magnetotelluric soundings (periods up to 10,000 s). Information characterizing the parameters of the network of magnetotelluric observations (observation points and their coordinates) is contained in the catalog of the regional network of MTS, MVS cost center. To date, the established regional network of MTS and MVS for stationary observation points and profiles covers almost the entire territory of Tien Shan, within Kyrgyzstan and the surrounding areas.
The data acquisition and information processing system of magnetotelluric monitoring allows collecting and accumulating data from a variety of monitoring observation points—stationary, regime, and profile (Figure 1). Monitoring was performed to study geodynamic processes in the Earth’s crust and upper mantle based on the calculation of the transfer functions between the components of the magnetotelluric field with high temporal resolution in order to study their temporal dynamics. The final result of such monitoring, from a formal point of view, is a set of time series of various data [5,6]. In the practice of monitoring geodynamical processes, statistical methods of data analysis are widely used. In particular, a correlation analysis is used to determine the degree of the interrelation of the observed data series. Time series are formed, which are used to study changes in the recorded parameters over time and to isolate anomalies associated with the preparation of strong earthquakes [7,8]. Programs are designed for visualization, processing, and analysis of time series. They have a convenient user interface. They implemented arithmetic, statistical, and other functions for working with time series. It is possible to edit drawings (graphs) on the screen, save, and print them.

2. Data Description

According to the results of continuous monitoring of electromagnetic, geomagnetic, GPS, gravimetric, and seismic observations, banks of primary data of the territory of the Bishkek geodynamic proving ground are formed and a catalog of earthquakes is compiled. As an example, consider the procedure for collecting data from magnetotelluric monitoring.

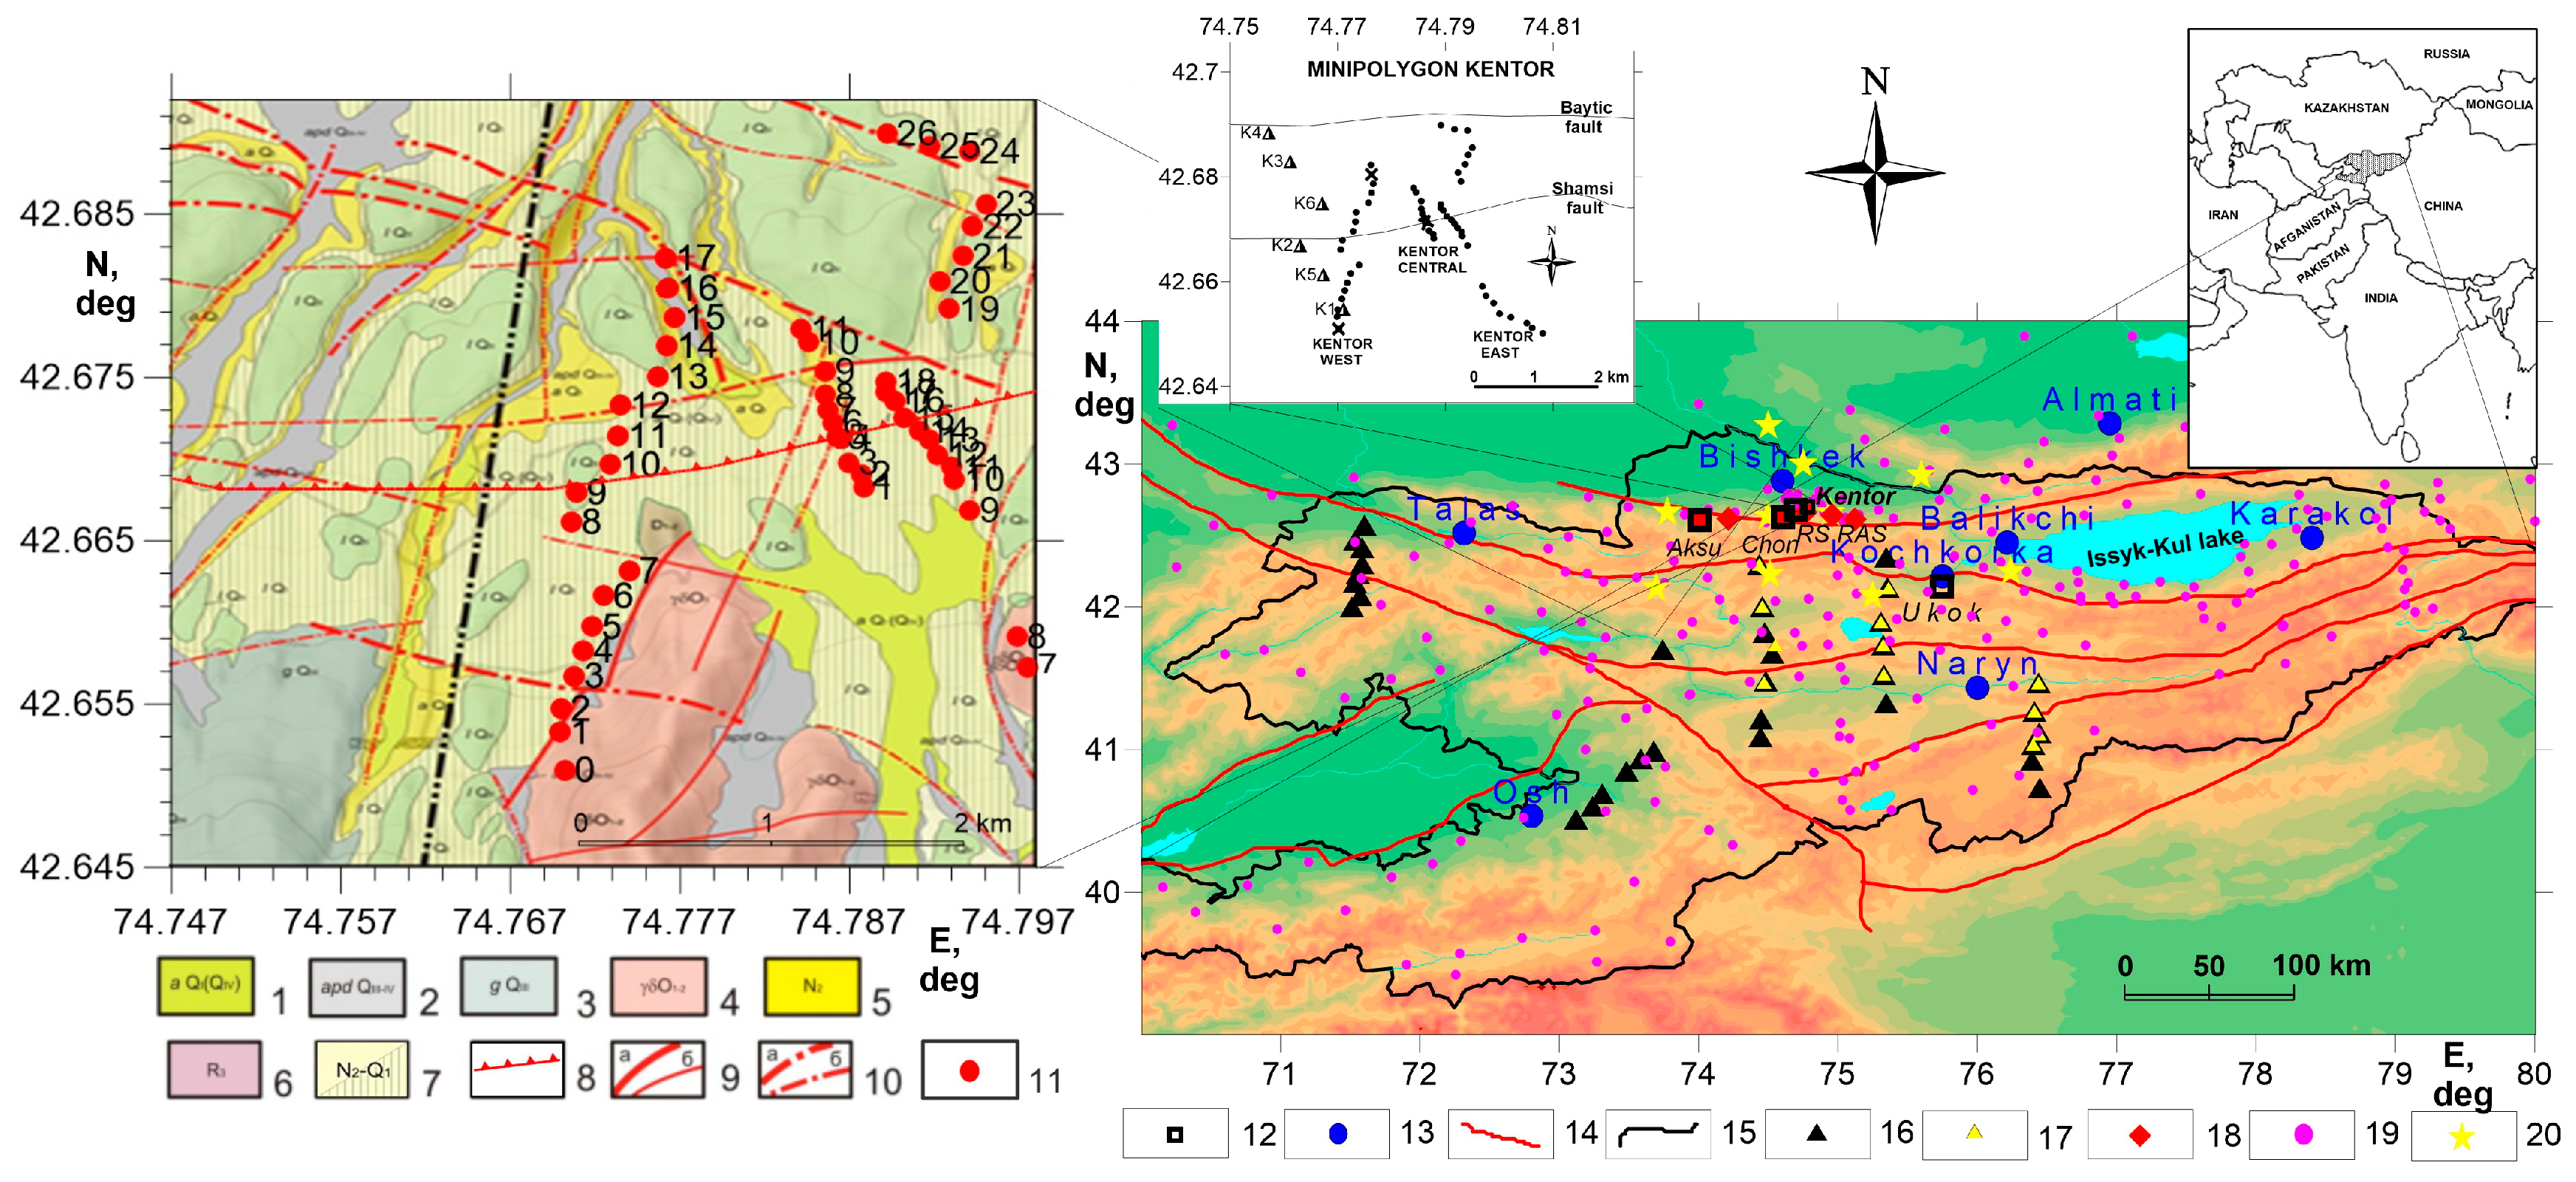
2.1. Data Collection Procedure

The monitoring network continuously records the MT field on the embedded flash memory of the Phoenix MTU-5D instrumentation. The duration of the recording depends on the amount of flash memory and registration parameters. The registration parameters indicate the polling frequency and the duration of the recording. At the maximum polling frequency, the recording time is about 20 days, after which data is copied from the flash memory to a laptop, and the equipment is serviced and restarted. When working on the MTS profile, the measurement mode depends on the objectives of the study and is seasonal. In an ordinary observation point on a profile, the duration of an MT-field recording is a time interval from several hours to several days, which is determined by the depth of soundings. To check the performance of the station, a test recording of about an hour is made. The most informative is the night registration.

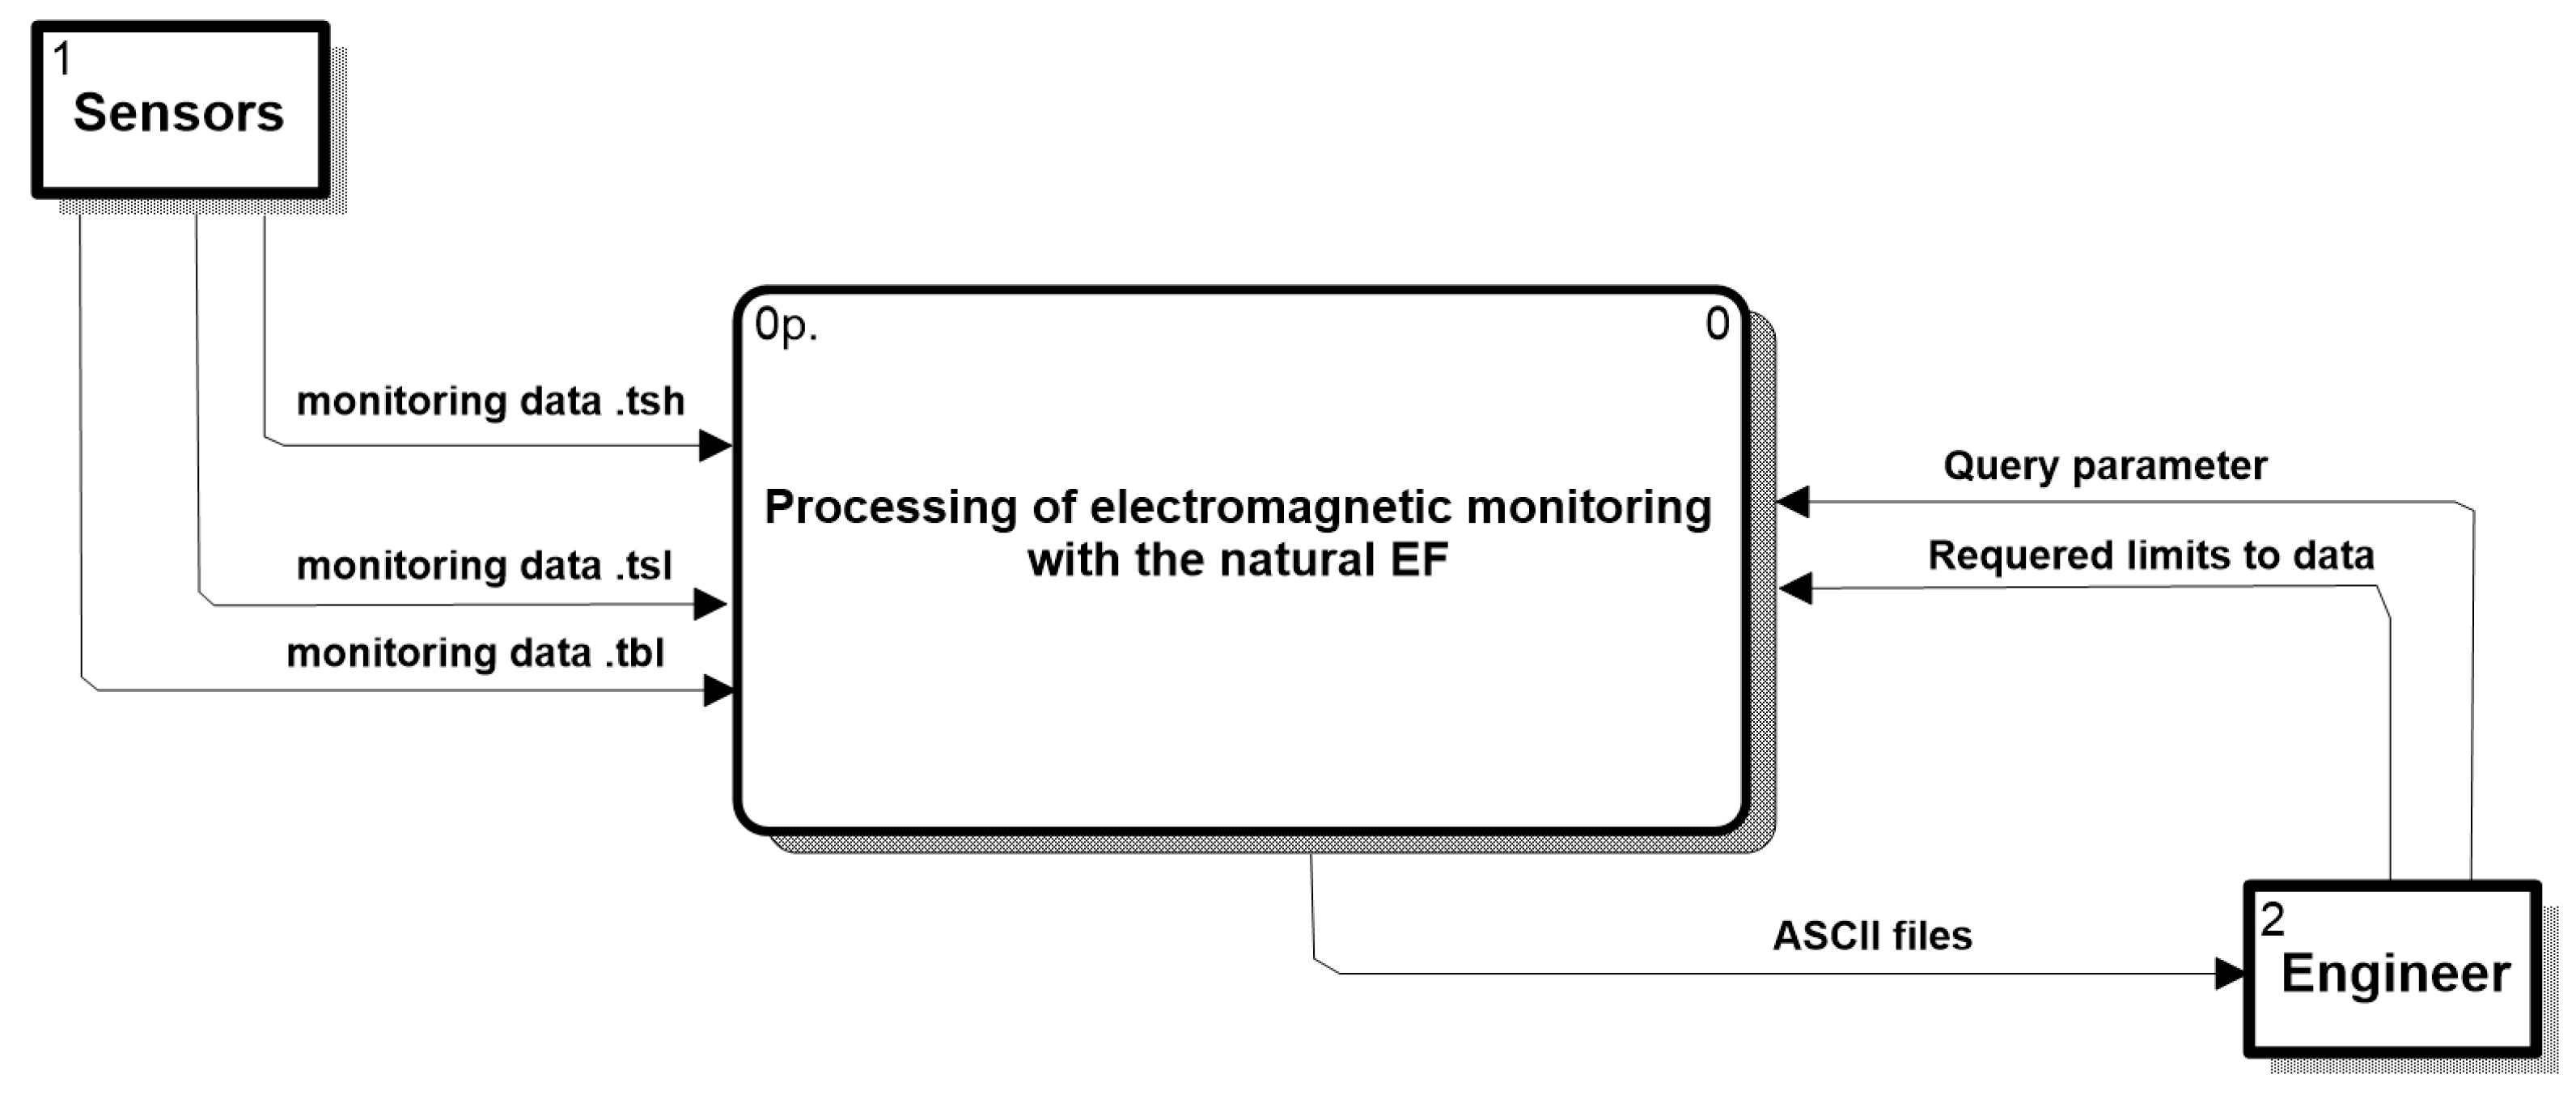
2.2. Structure and Data Processing of the Magnetotelluric Sounding (MTS) Method

The primary time series files of magnetotelluric data are stored in two binary files one of which saves the data of high and middle-frequency band (2400 and 150 Hz) at intervals of a few seconds from the beginning of the minute, while the second file continuously saves low-frequency data (24 Hz).
Time series are accompanied by a small binary file which saves registration parameters. To process time series data, use the SSMT 2000 program from the standard set of Phoenix software. As a result of this processing, average daily MT monitoring records are obtained stored as binary files. Work with these files is performed using the GSPlot (General Spectra Plot) program from the standard set of Phoenix software. The GSPlot program allows to visually view the transformants of the MT data and also presents them in a table form.
The data storage scheme of magnetotelluric soundings processing is based on the data storage scheme in the international data exchange standard MT. In this standard, sensing data at a point is written to a file with the extension EDI (Electrical Data Interchange). EDI files are obtained using the MT-Correct processing application program developed by the North-West geophysical company and saved in ASCII format, in contrast to the primary binary files.

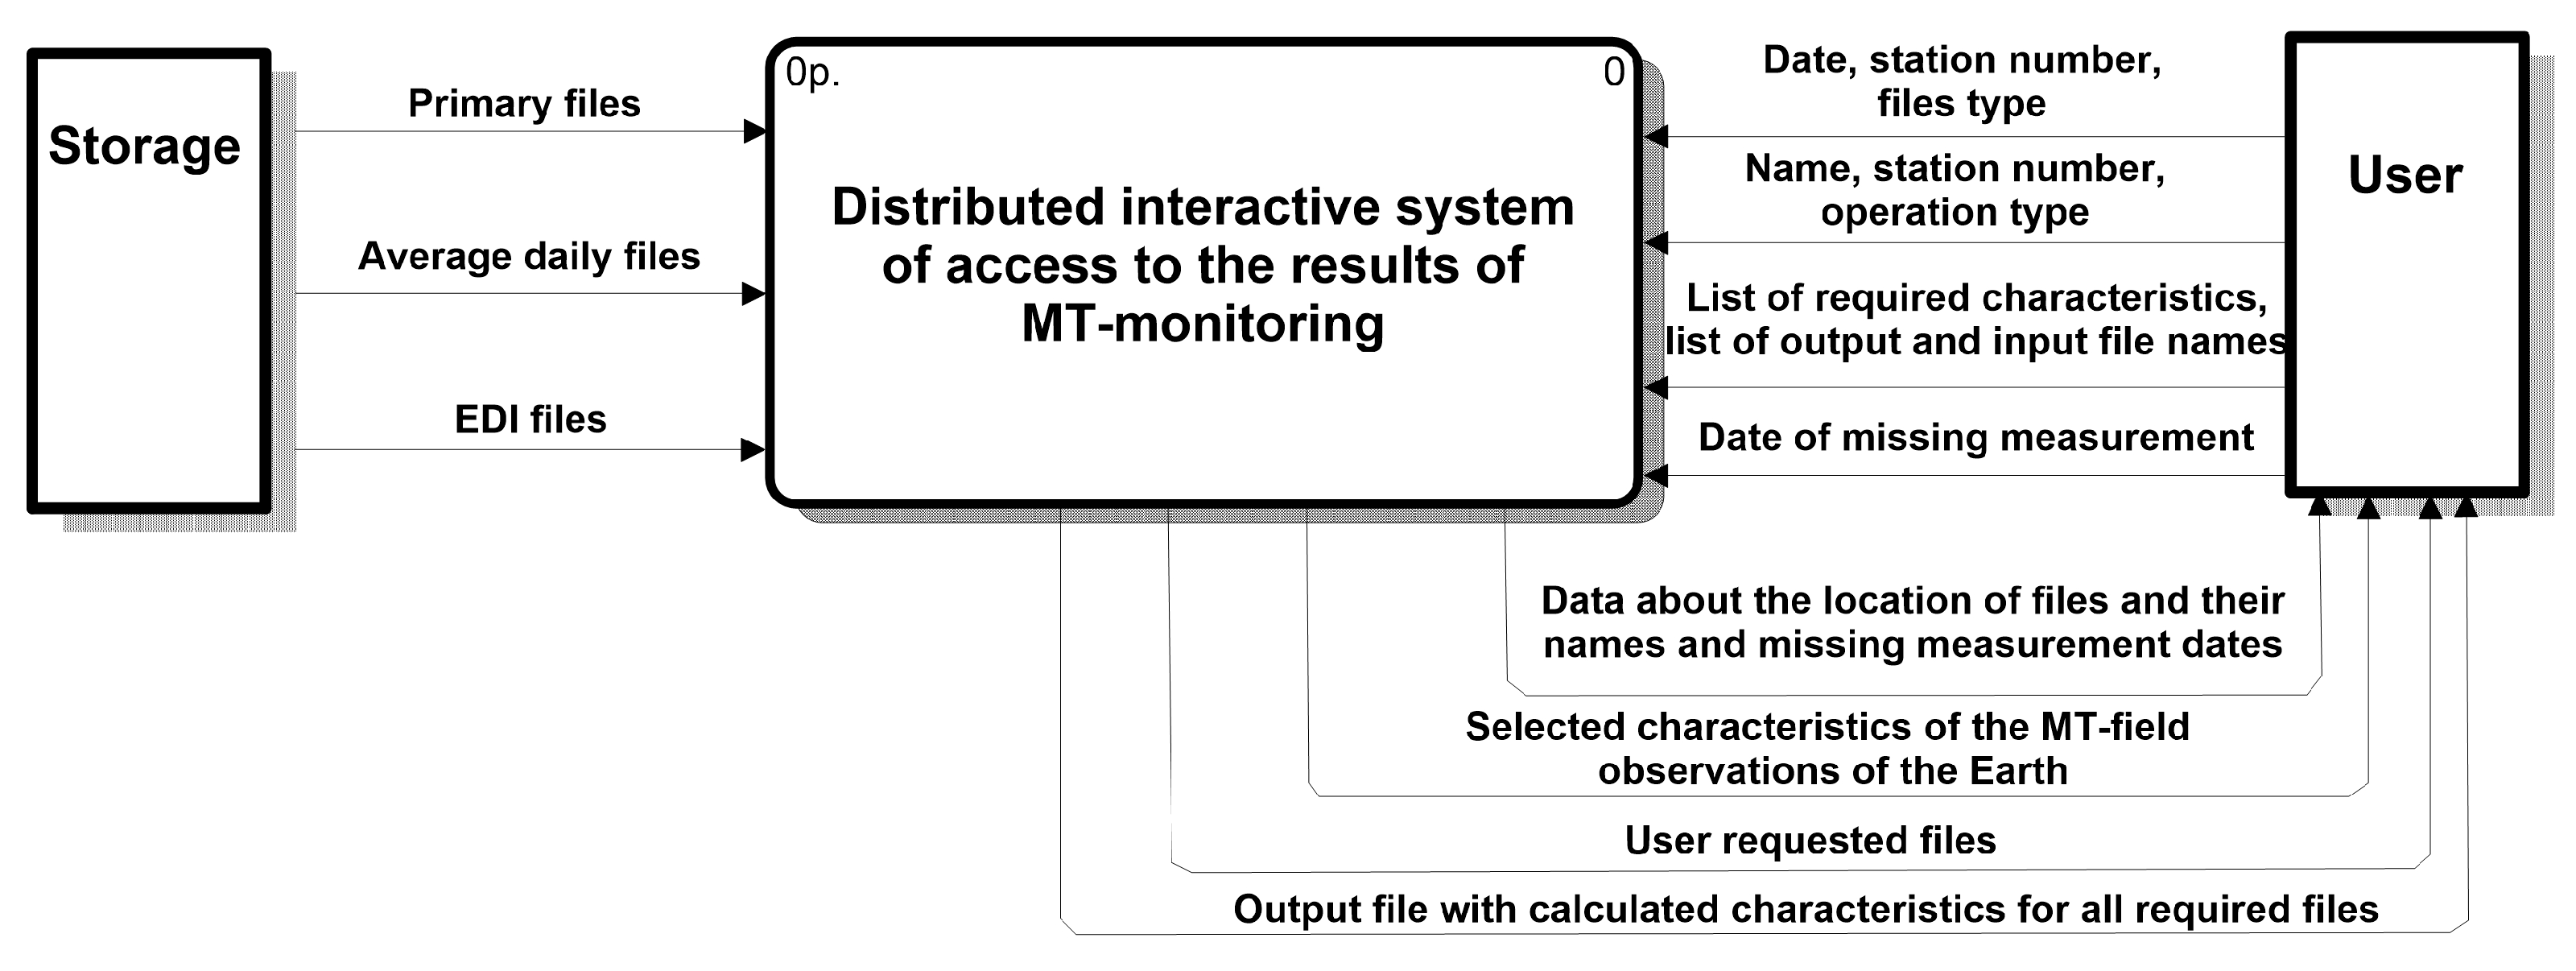
2.3. Structure and Storage of Magnetotelluric (MT) Data

All MT sounding material, both source material and processing results, are placed in archives on working computers, in a database and in an external archive on CDs. In the MT database, the material is classified by year of observation, by profiles and measurement points.
The data of the MT-monitoring are located in the directories corresponding to the names of the items—Aksu-mon and Chon-mon, in which folders with the number of years of monitoring are created.
The data on the MT-profiles are in the directories with the name of the profile and year of work.

3. Methods

The geophysical monitoring database (DB) of the RS RAS includes an electromagnetic observation database with an artificial source of electromagnetic field, electromagnetic observations with a natural source of electromagnetic field, geodetic GPS observations on a local network and geomagnetic observations and can be considered as a single distributed database (Distributed DataBase—DDB) [9] of geophysical monitoring. These databases play the role of local databases located in different nodes of the corporate and/or global computer network. DDB, as defined by Data [10], can be considered as a loosely coupled network structure whose nodes are local databases.
Local databases are autonomous, independent, and self-defined; access to them is provided through the DBMS. Connections between nodes are replicated data streams. DDB topology is a star structure.
For organizing the collection, storage of data, and processing of the results of MT monitoring, the As IS model was developed. The model was developed in the BPWin [11] environment in the form of data flow diagrams (DFD-diagrams) and is presented in Figure 2.
For on-line access to the results of MT monitoring, a model of a distributed interactive system of access to the results of magnetotelluric monitoring in the form of a data flow diagram (DFD diagrams) was developed. This model is essentially an As To Be model and is presented in Figure 3.
On the system model, the main process is allocated: distributed interactive system of access to the results of monitoring MT and two external entities: User and Storage. The repository is a storage medium on the external medium with respect to the system, on which the primary Phoenix station files, the average daily (processed) files, and EDI files are stored. Figure 4 shows an example of the MT data outputs that was obtained from the database.
The detailing of the main process is carried out in the form of a 1-level DFD, including 3 main subprocesses (Processing of primary files, Processing of daily average files, Processing of EDI files) and 2 auxiliary subprocesses (Construction of correlation diagrams and MT time-frequency monitoring), interacting with the Server.

Description of the Main Functions of the System

Based on the models discussed above, a logical database structure was developed in the ERwin environment [10]. Visual Basic .Net 2008 and SQL Server 2000 DBMS are selected as programming tools. The developed distributed interactive system of access to the results of magnetotelluric monitoring has the following functionalities.
1. Creating a database. To create a database of MT monitoring files, you must enter the name of the server on which the database will be created and the name of the future database, as well as select the type of authentication for the server on the local computer or to create a database on the remote computer.
2. Setting up the software system and filling the database. At this point, you can select or enter: the name of the server to which you want to connect, and the name of the database created by the program, in which the data about the MT monitoring files will be stored. In addition, you can choose the path to the files, up to folders with stations.
3. Database update.
4. Search for files by date and coordinates. The file search is possible by date, based on the type of the files you are looking for, the time period in which the necessary files are located, the station number from which the files were received. The search by coordinates implies the search for files by the latitude and longitude of the location of the stations.
5. Copying files.
6. Processing MT monitoring data.
7. Construction of time-frequency series of MT monitoring.
8. Construction of correlation diagrams.

4. User Notes

Usage: for collecting and processing geophysical information, in particular for measuring, recording, and processing the electrical and magnetic components of the natural electromagnetic field, in the study of geodynamic processes occurring in the Earth’s crust and upper mantle using electrical survey methods. Thus, the developed software system makes it possible to increase the efficiency of processing MT monitoring data by significantly reducing the time spent searching for the necessary information, the ability to quickly view the newly received data, and create a distributed database of monitoring MT observations over a period of about 15 years. Currently, the system is in the trial operation of the Research Station of the Russian Academy of Sciences.

5. Patents

As part of these studies, the database “Local database of magnetotelluric data in the system of geophysical monitoring of geodynamic processes in the Earth’s crust of seismically active regions” was registered. Certificate No. 2012621291, issued on 07.12.2012. Copyright holder FGBUN Research Station of the Russian Academy of Sciences in Bishkek. Authors: Rybin A.K., Matiukov V.E., Desyatkov G.A., Lychenko N.M., Manzhikova S.T. At the present, this database is actively used and developed.

Author Contributions

Conceptualization, E.B.; Data curation, A.R.; Investigation, A.R.; Methodology, E.B.; Project administration, A.R.; Software, V.M.; Visualization, V.M.; Writing—original draft, E.B.; Writing—review & editing, V.M.

Funding

The presented researches are carried out within the fulfilment of the State Assignment by the Research Station of the Russian Academy of Sciences (subject AAAA-A19-119020190063-2 (0155-2019-0001)) and with the financial support of the Russian Foundation for Basic Research (Project 17-05-00654).

Conflicts of Interest

The authors declare no conflict of interest.

References

  1. Rybin, A.; Fox, L.; Ingerov, O.; Schelochkov, G.; Safronov, I.; Batalev, V.; Bataleva, E. MT monitoring experiment in the Northern Tien Shan seismogenic zone/CD ROM: Abstracts. In Proceedings of the 10-th Scientific Assembly of the International Association of Geomagnetism and Aeronomy, Toulouse, France, 18–25 July 2005. [Google Scholar]
  2. Rybin, A.K.; Batalev, V.Y.; Bataleva, E.A.; Matiukov, V.E.; Desyatkov, G.A.; Lychenko, N.M.; Manzhikova, S.T.; Ten, V. Development of a distributed interactive system of access to the results of magnetotelluric monitoring. In Proceedings of the Problems of geodynamics and geoecology of intracontinental orogens VII International Symposium, Bishkek city, Kyrgyz Republic, 19–24 June 2011; pp. 179–187. [Google Scholar]
  3. Bataleva, E.A.; Batalev, V.Y.; Rybin, A.K. On the question of the interrelation between variations in crustal electrical conductivity and geodynamical processes. Izvestiya Phys. Solid Earth 2013, 49, 402–410. [Google Scholar] [CrossRef]
  4. Lyubushin, A.A. Multidimensional analysis of the time series of geophysical monitoring systems. Izvestiya Phys. Solid Earth 1993, 3, 103–108. [Google Scholar]
  5. Bataleva, E.A.; Batalev, V.Y. Development of Programs to Analyze the Data on Azimuthal Magnetotelluric Monitoring Part 1. Analysis of magnetotelluric monitoring data. Vestnik Kyrgyz-Slavic University 2014, 14, 3–7. [Google Scholar]
  6. Bataleva, E.A.; Batalev, V.Y. Development of Programs to Analyze the Data on Azimuthal Magnetotelluric Monitoring Part 2. Development of software for analysis of MT monitoring data. Vestnik Kyrgyz-Slavic University 2014, 14, 8–12. [Google Scholar]
  7. Bataleva, E.A.; Zabinyakova, O.B.; Batalev, V.Y. Software Development for Monitoring Electromagnetic Parameters of the Bishkek Geodynamic Providing Group. Vestnik Kyrgyz-Slavic University 2017, 17, 144–149. [Google Scholar]
  8. Bataleva, E.A.; Zabinyakova, O.B.; Batalev, V.Y. Development for Magnetotelluric Profile Monitoring Cantor’s Minipoligon. Vestnik Kyrgyz-Slavic University 2017, 17, 150–153. [Google Scholar]
  9. Date, C.J. What is distributed database? Available online: ftp://sohoftp.nascom.nasa.gov/pub/www/publications/chapter10.pdf (accessed on 3 March 2019).
  10. Infological modeling. Available online: http://www.rus-lib.ru/book/28/ps/01/027-044.html (accessed on 15 April 2019).
  11. Maklakov, S.V. BPwin and ERwin—CASE-development tools for information systems. M.: Dialog-MEPI. 1999. Available online: https://studfiles.net/preview/942930/page:10/ (accessed on 10 May 2019).
Figure 1. Location map of points of the geophysical monitoring, performed on the territory of the Central Tien Shan: 1—modern alluvial boulder-pebble deposits; 2—alluvial boulder-pebble deposits of the first above-flood terrace; 3—blocky-pebble glacial deposits; 4—Early and Middle Ordovician granodiorite; 5—Miocene pebble-crumbly-sandy strata; 6—Riphean complexes (undivided); 7—Pliocene–Pleistocene alluvial boulder deposits of the Sharpyldak series; 8—Shamsi fault; 9—activated faults and fracture zones of the basement: a—main; b—secondary; 10—activated faults assumed under the cover of modern sediments: a—main; b—secondary; 11—points of regime magnetotelluric soundings (MTS); 12—points of stationary and profile magnetotelluric observations; 13—settlements; 14—main fault structures; 15—the border of Kyrgyzstan; 16—points of regime deep MTS; 17—points of regime deep MTS of 2018; 18—points of electromagnetic monitoring; 19—points of the network of GPS observations; 20—KNET teleseismic network sites.
Data 04 00099 g001
Figure 2. Data streams in magnetotelluric (MT)-monitoring (Model As IS).
Data 04 00099 g002
Figure 3. Model of a distributed interactive system of access to the result of magnetotelluric (MT)-monitoring (Model As To Be).
Data 04 00099 g003
Figure 4. The example of the magnetotelluric (MT) data outputs that was obtained from database. The left side shows the time series source data—5 components of the electromagnetic field. In the right side sample processed data. Blue and green dots show processed curves that are obtained in binary format, red and yellow solid lines—smooth curves in EDI format.
Data 04 00099 g004

