Abstract
This paper shows the results of the refined locations for underground Peaceful Nuclear Explosions (PNEs). Peaceful nuclear explosions (PNEs) were made for industrial applications in the Soviet Union. This study is based on a comparison of PNEs’ parameters. These explosions were recorded by seismographic stations in Kazakhstan from 1966 to 1988. The monitoring/verification community generally utilizes PNE locations from Sultanov et al. (1999). In reality, there are errors and some PNEs are poorly located. Our locations were determined using an integrated approach encompassing published open literature sources and archive seismogram analysis from Borovoye Geophysical Observatory. Treated PNEs seismograms have been available to researchers since 2001. They became available after the cooperation between Russian and U.S. organizations. The first one was the Institute of Geosphere Dynamics of the Russian Academy of Sciences (IDG RAS), the organization that operated the Observatory in the Soviet era. The second one was the National Nuclear Center of the Republic of Kazakhstan (NNC since 1992). The third one, from the U.S. side, was the Lamont‒Doherty Earth Observatory of Columbia University (LDEO). We present two digital seismograms of old-style seismograms from a digitized archive in ASCII format. We provide travel times for P-waves, some seismograms, and additional source parameters.
Dataset License: license CC BY-NC.
1. Introduction
Peaceful Nuclear Explosions (PNEs) were carried out for non-military purposes during the 20th century. Over a period of 23 years, the Soviet Union carried out 122 USSR PNEs, 81 of which were on Russian territory. Soviet PNEs can be divided into three types of “underground” nuclear explosions: those that were effectively on the surface, those that were sub-surface, and truly deep underground explosions. Most Soviet PNEs took place at depths of 500–2000 m. The power of the charges was usually between 2 and 20 kilotons. One hundred twenty-four USSR PNEs were conducted: 80 in Russia, 39 in Kazakhstan, and five altogether in Ukraine, Uzbekistan, and Turkmenistan. [1]. The former Soviet Union conducted 39 PNEs for seismological purposes. PNEs are powerful controlled sources. Among the seismological community, PNEs are considered so-called Ground Truth (GT) events. Information of Earth’s structure can now be gathered from PNEs travel times. The data help us to define continental platform borders and obtain new data about the size of sediments on those platforms. This is still important in term of the Comprehensive Nuclear-Test-Ban Treaty verification and estimating Earth structure models. Kazakhstan (formerly the Kazakh Soviet Socialist Republic) was chosen as Training Test Site No. 2 of the USSR’s Ministry of Defense. Kazakhstan is the right place for acquiring teleseismic (long-distance) and regional (short-distance) seismic signals to monitor the Asian region [2,3]. The geological structures, particularly in Northern Kazakhstan, allow seismic waves to propagate very efficiently, with minimal attenuation and minimal scattering [4]. The Borovoye Geophysical Observatory (BRVK) is located at 53.05806° N, 70.28278° E coordinates. The Observatory was built in the Soviet era in Kazakhstan, near Lake Borovoye. The observations began operating in 1960 by the forces of Special Sector of the Schmidt Institute of Physics of the Earth of the USSR Academy of Sciences (SS IPE). Borovoye Observatory obtained the first digital recordings of PNEs.
It is important to understand the historical context. During the 1950s there was no digital registration of seismic signals. The first prototypes of digital-to-analog and analog-to-digital converters (ADC) for the seismic station were prepared in 1961 by the SS IPE group engineers. The first field test of a 10-channel digital system layout was carried out in October 1961 at the “Mikhnevo” seismic station (MHV), located at 54.960° N 37.766° E in the Moscow region. For the first time, a seismic signal from an underground nuclear explosion at the Semipalatinsk test site (STS) was recorded in digital format. The following field test of a 25-channel digital system layout was carried out at Ili station (ILI), located at 49.933° N 77.067° E in Kazakhstan (February 1962). The next field experiment took place at Borovoye station in October‒November 1962. The final check of the digital layout was carried out at the Lovozero station, located at 67.58° N 33.05° E (the Kola Peninsula), in November‒December 1963. As a result of laboratory and field tests, the five-channel digital system KOD was designed. After that, KOD started operating in Kyrgyzstan (also an Asian country). In 1964 KOD was installed at “Talgar” station (TLG), located at 43.267° N 77.383° E. Later, in 1965–1966, it was installed at “Frunze” seismic station (Bishkek, FRU), located at 42.833° N 74.617° E, and “Naryn” (NRN), located at 41.433° N 76.000° E [3].
Thus, after this work at the Borovoye Geophysical Observatory in 1966, continuous seismic signal recording on magnetic tapes started in a digital format. The digital system KOD at the Borovoye seismic station operated from 23 July 1966 to 13 November 1973. Digital system KOD operated with different types of seismometers depending on the gain levels [4]. There were two modifications: three-component high-gain (multiple by 10 times) and a vertical-component low-gain (KODb); three-component low-gain and a vertical-component high-gain system (KODm). The three components consisted of the vertical (Z), North‒South, and East‒West planes.
Another digital system was called STcR-SS. There were two modifications: STcR-SS and STsR-TSG [4]. STcR-SS was a 10-channel digital station. This system began operating in Borovoye on 7 March 1973. STsR-TSG was a 24-channel digital station. It began operating later, on 18 July 1974. STcR operated with three-component seismometers. The three components consisted of the vertical (Z), North‒South, and East‒West planes.
In the late 1990s, the digital recordings from about 8000 magnetic tapes of the Borovoye Observatory were reformatted into a modern format [2,5,6]. This work was part of a program sponsored by the USA-based Natural Resources Defense Council and the Soviet Academy of Sciences [2,3]. Currently, they are stored at the Institute of Geospheres Dynamics of the Russian Academy of Sciences (IDG RAS) and the Lamont‒Doherty Earth Observatory of Columbia University (LDEO).
2. Data Description
At the Borovoye Observatory (BRVK), from over 122 PNEs [7] 98 of them were registered in digital format (according to the archive of Expedition No. 4 SS IPE). However, when reformatting the archive of digital seismograms BRVK at the end of the last century, only 79 seismograms were saved [8]. These PNE tests convey information about different source conditions because they represent various regions and directions [9,10]. Table 1 presents the data of the 79 PNEs database from the Institute of Geosphere Dynamics (IDG RAS) of photographic recordings. The waveforms are available for the research community at IDG RAS database and at the LDEO site www.ldeo.columbia.edu/res/pi/Monitoring/Arch/BRV_arch_deglitched.html. The PNEs archive, described by Kim et al. (2010), is available today via www.ldeo.columbia.edu/Monitoring/Data/Brv_arch_ex/brv_text_table.pdf [11].

Table 1.
Time corrections for USSR PNEs at Borovoye Geophysical Observatory (BRVK: φ ° N = 53.05806, λ ° E = 70.28278) after [8,12].
Refined coordinates of Soviet Peaceful Nuclear Explosions are given in [8,11]. With regard to this, in the article, new epicentral distances and azimuths from the Borovoye Geophysical Observatory (BRVK), which has been digitally recorded during earthquakes’ monitoring since 1966, have been calculated [12,13]. KOD and STcR systems have errors in time registration. This happened because of the magnetic tapes’ replacement every 8 and 12 h. That is why we apply time corrections (δT). Time correction is calculated as follows: δT = t(GMT) − t(BRVK), where t(GMT) is the exact time of the USSR PNEs in Greenwich Mean Time, and t(BRVK) is the BRVK registration time. All time corrections are listed in Table 1. For example, the accuracy in time is ±0.001 s for the STcR-SS and STcR-TSG stations, within a ±0.5 s time window.
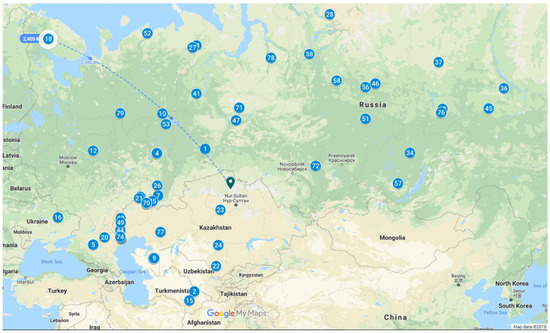
Table 2 gives information about PNEs’ distance (Δ°) and azimuth from BRVK and P-wave travel times (tp0 time of occurrence of primary body wave in solid earth after explosion origin time) to BRVK from [8], taking into account the time corrections (δT) of the digital registration stations [12]. PNE sites in Kazakhstan were visited in 2015, allowing GPS coordinates to be obtained in the field. The coordinates of 79 Peaceful Underground Explosions as a result of the analysis of satellite images (Google Earth images and a high resolution images was used from Geoportal Roscosmos), regional seismic data, and visits to epicenters (with radioactivity reports), are specified in [13]. PNEs locations after [13] are presented in Figure 1. Table 2 gives the following information about PNEs: (1) index number, (2) test name, (3) magnitude, calculated by body waves, mb, (4) date in Year‒Month‒Day format, (5) origin source time in hour:minute:second format, (6) geographical coordinates in degrees, (7) distance between source and BRVK in degrees (where 1 degree ≈ 111 km), (8) azimuth—angle between direction to the source and BRVK in degrees, (9) travel time tp0, registered at BRVK after time from row (5) in seconds, (10) instrument type [8]. The accuracy in geographical coordinate locations (row #6 in the table) differs because of the registration system and data quality. Bold type is used from [8], underlined text from IDG RAS database, plain type text from [13]. Refined PNEs locations are shown in Figure 2. All coordinates are available in KLM format in the Supplementary Materials.
Table 2.
Joint USSR Peaceful Nuclear Explosions database with additional information, registered by Borovoye Geophysical Observatory (BRVK: φ° N = 53.05806, λ° E = 70.28278) and included in the IDG RAS archive *.
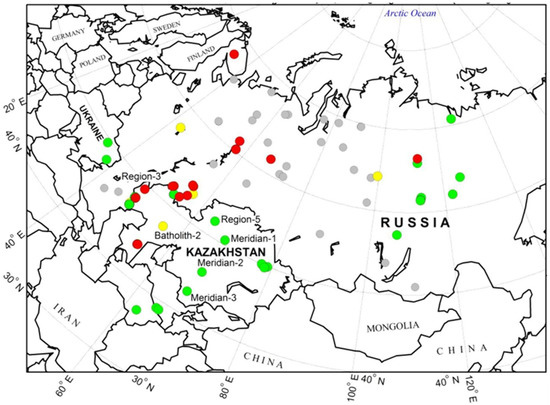
Figure 1.
USSR PNEs locations. Green events represent locations determined or verified within 1 km accuracy; red events indicate GT0-1 locations determined where the new coordinates exceed the location errors published by [8]; yellow events were studied but the locations could not be determined or verified, or evidence exists that the true location error is greater than that published by [8]; gray events have not yet been investigated [13].
An error was found in [8] in the travel time of the 22 August 1988 test named Ruby-2 (corrected in the table by the bold underline). In addition, we lined up travel‒time curves for all epicentral distances from Table 2, shown below.
3. Seismograms
The information restoration from magnetic tapes is a complex task. At Los Alamos National Laboratory, an automated algorithm was designed. It is an algorithm to repair wave form [10,11,13]. Timing information comes from the extraction and de-multiplexing. The information tag inside magnetic tape provides information on channel number, digitizing interval, date, record start time (to the nearest ms) and time correction. There are some signals of good quality and others that are badly clipped. Bad quality means that raw waveforms (traces) are contaminated with glitches on all seismometer channels and different gain levels. The following algorithms are applied to identify the glitches’ edge points at the poor data trace: trace differentiation, high pass Butterworth filtering, a fourth-order polynomial L1 minimization fit, the median removal and 10-point tapers to the beginning and end of the entire waveform (with a corner set to two-thirds the Nyquist frequency). The procedure matches five waveform points exactly. As a fine adjustment, this algorithm add a linear function to the polynomial to ensure that those edge points are matched exactly. Finally, we can obtain absolute values. The original glitch and repaired waveform are then displayed, whereupon the user may:
- accept the repair;
- pick one or more of the glitch edge points and window endpoints, and refit the waveform;
- expand the window, pick as above, and refit the waveform;
- skip the repair of that segment.
Due to this LDEO script, the seismograms were stored. Digital data from the magnetic tapes were mass stored on the hard drive in the IDG RAS archive as PostScript files. These files were converted into images (TIFF, JPEG, or BMP format). Then we applied the GetData Graph Digitizer program (http://www.getdata-graph-digitizer.com/index.php) for digitizing independent traces. GetData Graph Digitizer is a program for digitizing graphs and plots. We adjusted the X and Y axis in the image plot. GetData Graph Digitizer allows us to get the values in different formats (TXT (ASCII), XLS (MS Excel), XML, DXF (AutoCAD), or EPS (PostScript)). Because of that, we obtain ASCII files (Supplementary files S1–S6).
We show an example of seismic signals for Meridian-1 Test on 28 August 1973 (Figure 3). We mentioned that there were two registration systems, KOD and STsR, with different gain levels. In Figure 3a the KODm seismic station and in Figure 3b the STsR-SS seismic station data are shown. Both systems have spatially orientated components recorded at separate channels: SZ—vertical; SN, SE—horizontal.
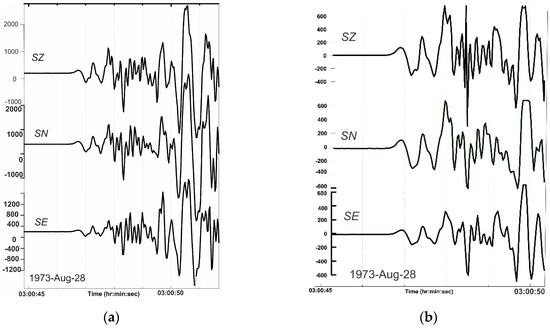
Figure 3.
Meridian-1 test on 28 August 1973: seismic traces that present primary body wave arrivals, detected from the paper recordings. Channels SZ—vertical; SN, SE—horizontal registered by: (a) KODm seismic station. Time correction is δT = +0.217 s [7]; (b) STsR-SS seismic station, 28 August 1973. Channels SZ—vertical; SN, SE—horizontal. Time corrections is δT = +0.055 s [8].
Figure 3 illustrates the signal from the primary body wave (P-wave arrival). The registration time is the same, 03:00:46.78. The signal shape is also similar to Figure 3a,b. P-arrivals are quite impulsive. Afterwards, the data from Table 2 could be used for P-wave velocity estimation. With the travel‒time P-wave, it is simple to construct a velocity propagation model. For this reason, we draw a plot. The distance between PNE and Borovoye is shown on the X axis (∆° in degrees). The travel time is shown on the Y axis (tp0). This is called the travel‒time curve plot tp0 = F (∆°). It helps us to find the local or regional velocity as a function of distance. Local and regional travel‒time curves are shown in Figure 4. If we put all the dots together, we obtain the full curve. This curve is suitable for linear equations. We approximate it with the equation Tp = 22.035 + (12.258 ± 3.175)·Δ.
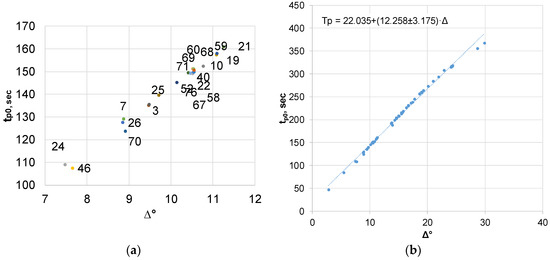
Figure 4.
Local (∆° = 7–12) (a) and regional (∆° = 0–30) (b) P-wave travel‒time curves (tp0 = F(∆°)) for the traces from USSR Peaceful Nuclear Explosions locations to observatory Borovoye.
4. Conclusions
We described the PNEs database from the IDG RAS archive. We compared PNEs’ parameters from different literature sources. We found some mistakes in the PNEs’ locations, time delays, and shifts according to the distance–explosion magnitude dependence. In addition, we corrected the information and made a refined table. Then, we made a map with the PNEs’ coordinates in KML format. We use P-wave travel-time from the seismograms to plot travel‒time curves. Propagating wave travel times make it possible to construct deep Earth models. PNEs’ locations are widespread across the Eurasian continent. Providing refined information is useful for Earth modeling within Eurasia. There are many more seismograms in the IDG RAS database, but there are no confirmed and controlled seismic events like explosions. We encourage scientists to work with such data.
Supplementary Materials
The following are available online at https://www.mdpi.com/2306-5729/4/2/56/s1, Files S1–S6 Meridian-1 Test seismic trace recorded by: File S1: channel (SZ) of KODm seismic station, File S2: channel (SN) of KODm seismic station, File S3: channel (SE) of KODm seismic station; File S4: channel (SZ) of STsR-SS seismic station, File S5: channel (SN) of STsR-SS seismic station, File S6: channel (SE) of STsR-SS seismic station; File S7: PNEs coordinates; Files Figure 3a KOD and Figure 3b SS seismogram Meridian-1 test in PostScript format.
Author Contributions
Head of Expedition No. 4 of the Special Branch of the Institute of Physics of the Earth of the USSR Academy of Sciences, participant in digital recording designing and restoration process, conceptualization, methodology, resources V.A.; formal analysis, data curation, visualization, K.N.; writing—original draft preparation, K.N.
Funding
This manuscript is funded by Russian State Governmental Task 0155-2019-0001. Previous research received funding by the Joint Seismic Program of the IRIS Consortium and by the International Science and Technology Centre (ISTC), based in Moscow and Russian Foundation of Basic Research Project K-063 (1997–2000 years).
Acknowledgments
The authors thank their colleagues at the Institute of Geosphere Dynamics of the Russian Academy of Sciences, Ludmila Godunova and Taisiya Cheluybeeva, for their constant attention and technical assistance in carrying out this study.
Conflicts of Interest
The authors declare no conflict of interest. The data storage was built due to the funders. The funders had no role in the interpretation of data; in the writing of the manuscript, or in the decision to publish the results.
References
- Larin, V.; Tar, E. Soviet PNEs: A Legacy of Contamination. Bull. At. Sci. 1999, 55, 18–20. [Google Scholar] [CrossRef]
- Adushkin, V.V.; An, V.A. Seismic Observations and Monitoring of Underground Nuclear Explosions at Borovoye Geophysical Observatory. Izv. Acad. Sci. USSR Phys. Solid Earth 1990, 12, 1023–1031. [Google Scholar]
- An, V.A.; Ovtchinnikov, V.M.; Kaazik, P.B.; Adushkin, V.V.; Sokolova, I.N.; Aleschenko, I.B.; Mikhailova, N.N.; Kim, W.-Y.; Richards, P.G.; Patton, H.J.; et al. A digital seismogram archive of nuclear explosion signals, recorded at the Borovoye Geophysical Observatory, Kazakhstan, from 1966 to 1996. Geo. Res. J. 2015, 6, 141–163. [Google Scholar] [CrossRef][Green Version]
- Kim, W.-Y.; Ekström, G. Instrument Responses of Digital Seismographs at Borovoye Kazakhstan by Inversion of Transient Calibration Pulses. BSSA 1996, 8, 61–91. [Google Scholar]
- An, V.A.; Kaazik, P.B.; Chelyubeyeva, T.V. The travel-time curves of “Borovoye” Geophysical Observatory constructed using underground nuclear tests. NNC RK Bull. 2016, 2, 90–95. [Google Scholar]
- An, V.A.; Bashilov, I.P.; Kaazik, P.B.; Konovalov, V.A. About normals of magnet digital records from the Geophysical Observatory, Borovoye. NNC RK Bull. 2010, 3, 62–69. [Google Scholar]
- Nordyke, M.D. The Soviet Program for Peaceful Uses of Nuclear Explosions. Lawrence Livermore National Laboratory Report; 2000; p. 99. Available online: https://e-reports-ext.llnl.gov/pdf/238468.pdf (accessed on 4 March 2019).
- Sultanov, D.D.; Murphy, J.R.; Rubystein, K.D. A Seismic Source Summary for Soviet Peaceful Nuclear Explosions. BSSA 1999, 89, 640–647. [Google Scholar]
- Murphy, J.R.; Sultanov, D.D.; Barker, B.W.; Kitov, I.O.; Marshall, M.E. Further Analyses of Regional Seismic Data Recorded from the Soviet PNE Program: Implications with Respect to CTBT Monitoring. Final report. PL-TR-97–2141. 1997. Available online: https://apps.dtic.mil/docs/citations/ADA341784 (accessed on 4 February 2019).
- Murphy, J.R.; Kitov, I.O.; Barker, B.W.; Sultanov, D.D. Seismic Source Characteristics of Soviet Peaceful Nuclear Explosions. Pure Appl. Geophys. 2001, 158, 2077–2101. [Google Scholar] [CrossRef]
- Kim, W.-Y.; Richards, P.G.; Adushkin, V.; Ovtchinnikov, V. Borovoye digital seismogram archive for underground nuclear tests during 1966–1996, A report of Lamont-Doherty Earth Observatory. Available online: http: www.ldeo.columbia.edu/Monitoring/Data/Brv_arch_ex/brv_text_table.pdf (accessed on 4 February 2019).
- An, V.A.; Kaazik, P.B.; Chelyubeyeva, T.V. Time corrections for digital seismograms at “Borovoye” Geophysical Observatory 1966–1995. NNC RK Bull. 2016, 3, 30–35. [Google Scholar]
- Mackey, K.G.; Fujita, K.; Abishev, A.; Bergman, E. Improvement of GT classification of Soviet PNEs. NNC RK Bull. 2016, 2, 123–127. [Google Scholar]
© 2019 by the authors. Licensee MDPI, Basel, Switzerland. This article is an open access article distributed under the terms and conditions of the Creative Commons Attribution (CC BY) license (http://creativecommons.org/licenses/by/4.0/).