Health Care, Medical Insurance, and Economic Destitution: A Dataset of 1042 Stories

 ,
,  ,
,  , ,
, , 
Abstract
:1. Summary
2. Data Description
3. Methods
3.1. Data Collection
3.2. Frequentist Analysis
| > library(nnet) |
| > library(stargazer) |
| > data1$Res<-relevel(data1$Res,ref=“Yes”) |
| > data1$Insured<-relevel(data1$Insured,ref=“Yes”) |
| > logit_burden<-multinom(Burden ~ Res + Insured, data=data1) |
| > stargazer(logit_burden,type = “text”, out = “logit_burden.htm”) |
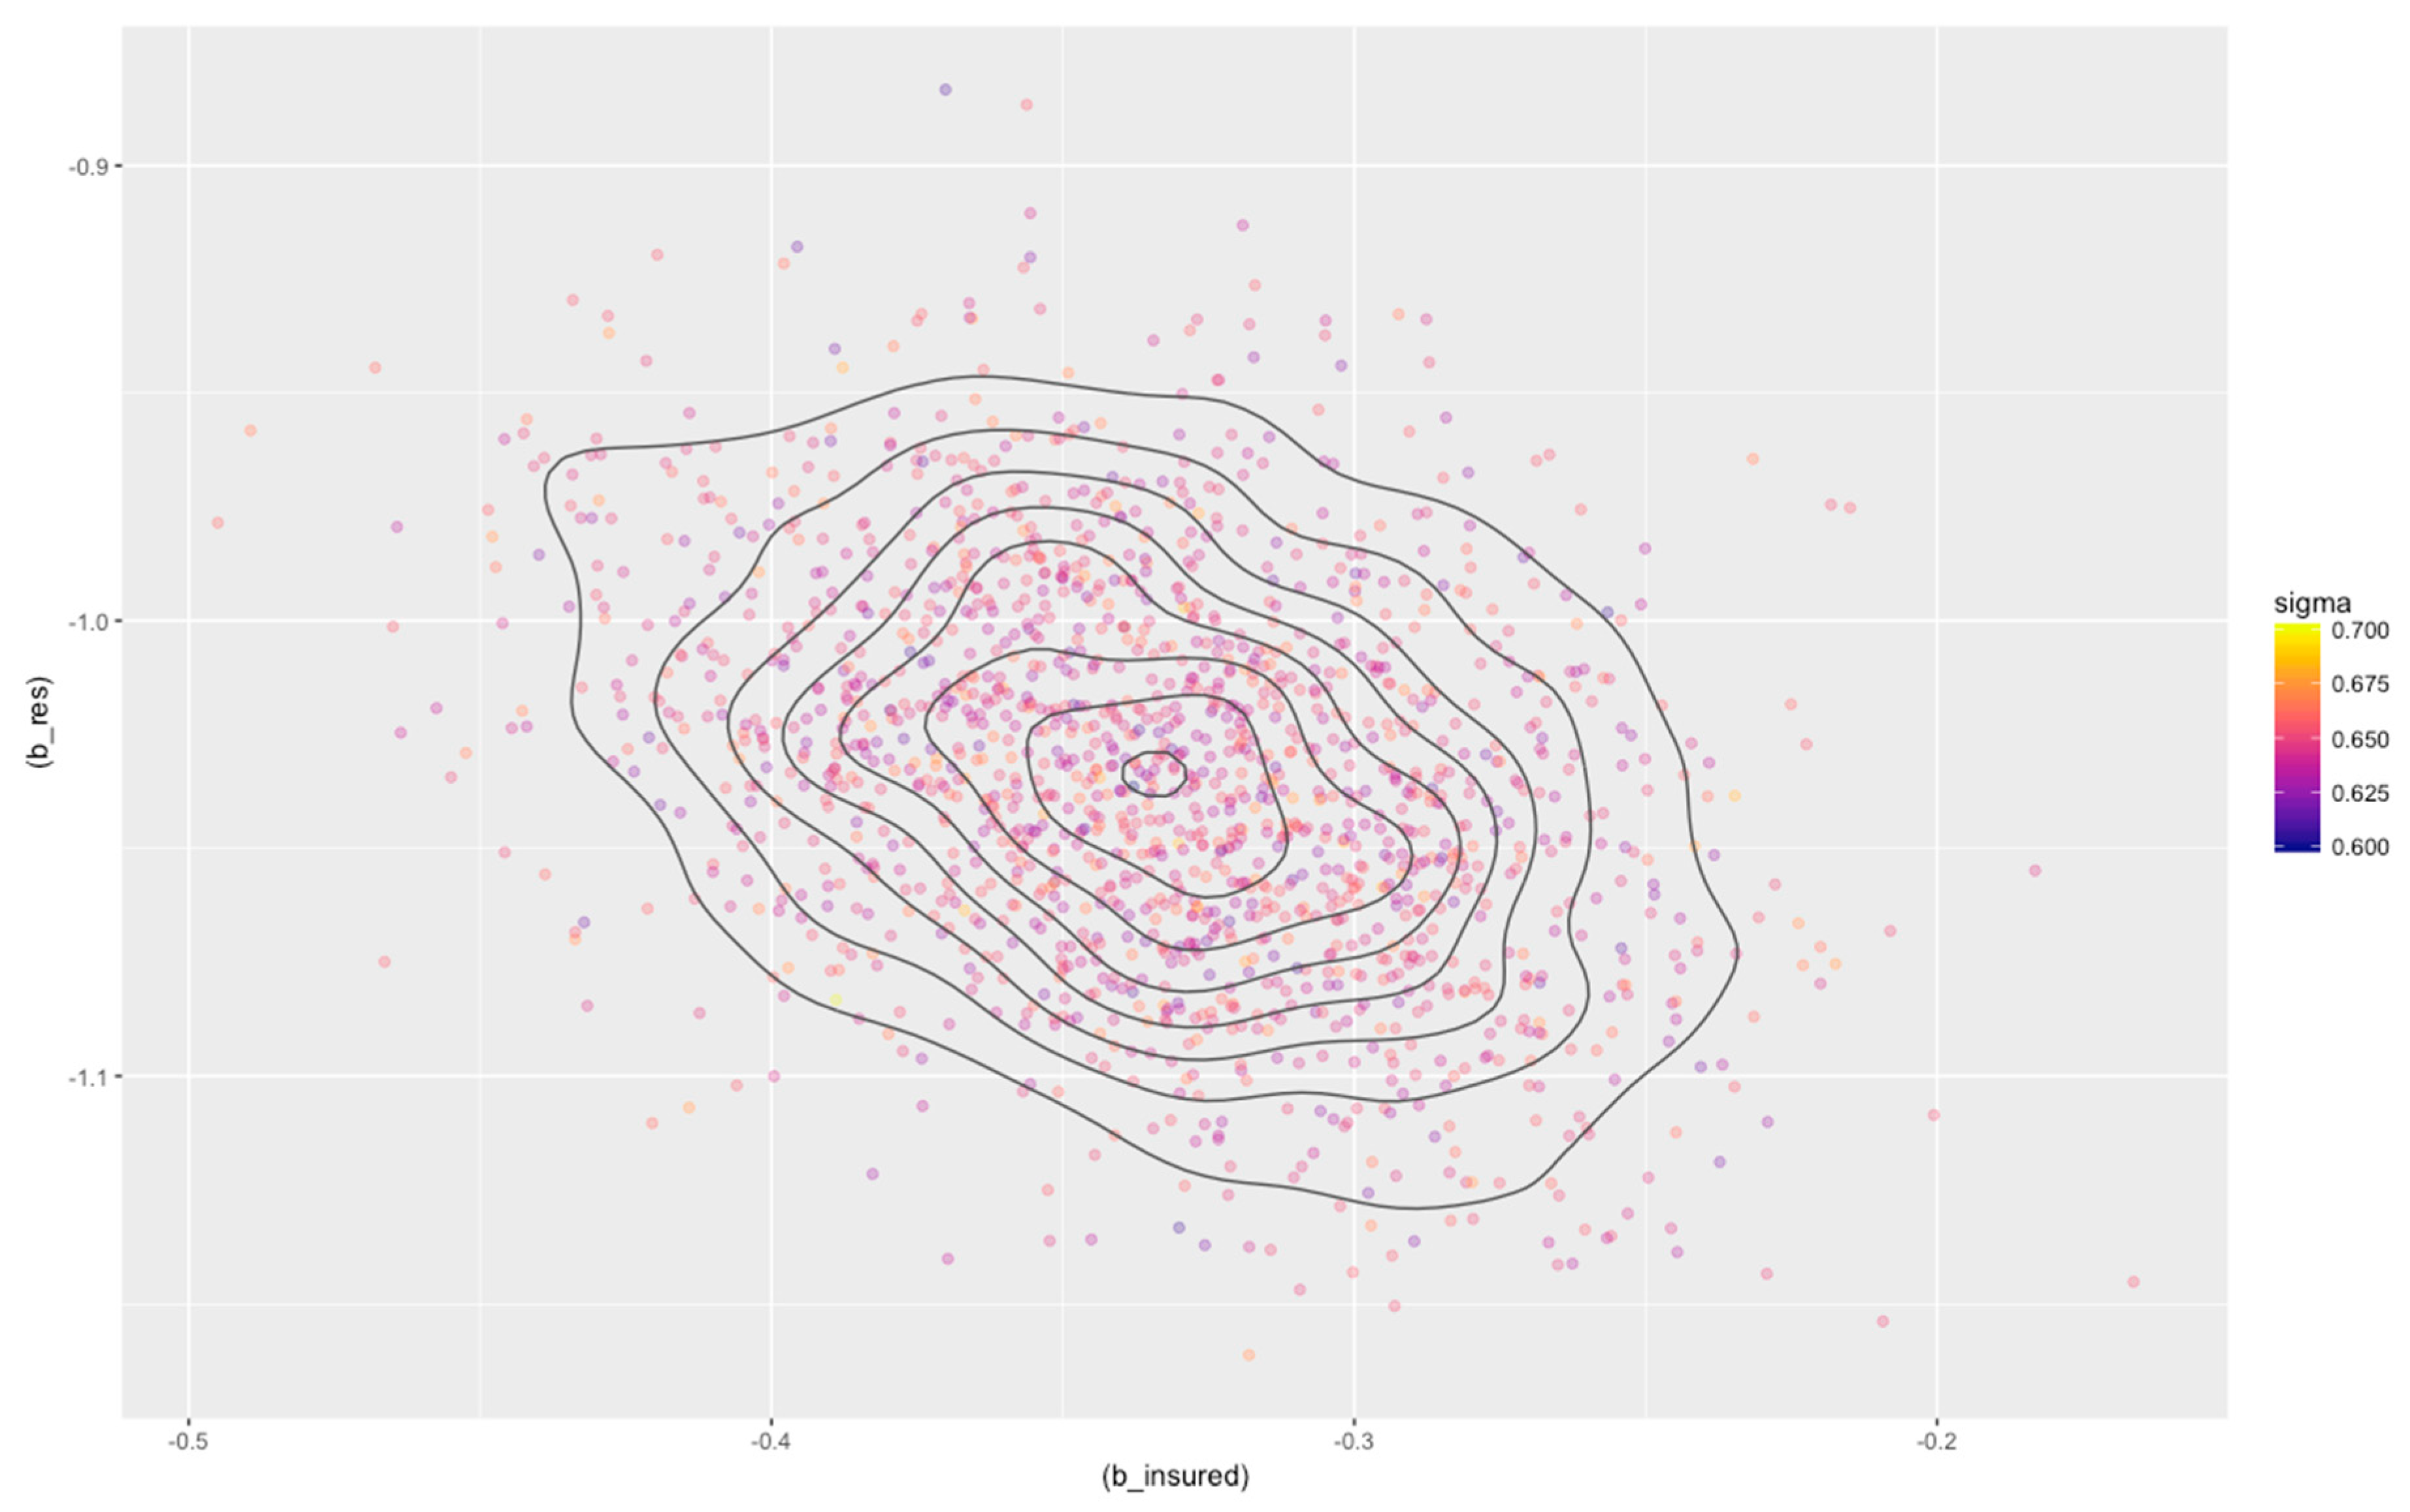
3.3. Bayesian Analysis
| # Design the model |
| model <- bayesvl() |
| model <- bvl_addNode(model, “burden”, “norm”) |
| model <- bvl_addNode(model, “res”, “norm”) |
| model <- bvl_addNode(model, “insured”, “norm”) |
| model <- bvl_addArc(model, “res”, “burden”, “slope”) |
| model <- bvl_addArc(model, “insured”, “burden”, “slope”) |
| # Generate the stan code for model |
| model_string <- bvl_model2Stan(model) |
| cat(model_string) |
| # Fit the model |
| fit <- bvl_modelFit(model, data1, warmup = 2000, iter = 20000, chains = 4, cores = 1) |
| data { |
| int<lower = 0> Nobs; //number of observations |
| vector[Nobs] y; |
| vector[Nobs] res; //independent variable 1 |
| vector[Nobs] insured; //independent variable 2 |
| } |
| parameters { |
| real alpha; //intercept |
| real b_res; //beta for educate, etc |
| real b_insured; |
| real sigma; |
| } |
| model { |
| alpha ~ normal(0,100); //priors for all betas |
| b_res ~ normal(0,100); // |
| b_insured ~ normal(0,100); |
| y ~ normal(alpha + b_res * res + b_insured * insured, sigma); //model |
| } |
| generated quantities { |
| vector[Nobs] log_lik; |
| for(i in 1:Nobs) { |
| log_lik[i] = normal_lpdf(y[i] | alpha + b_res * res[i] + b_insured * insured[i], sigma); |
| } |
| } |
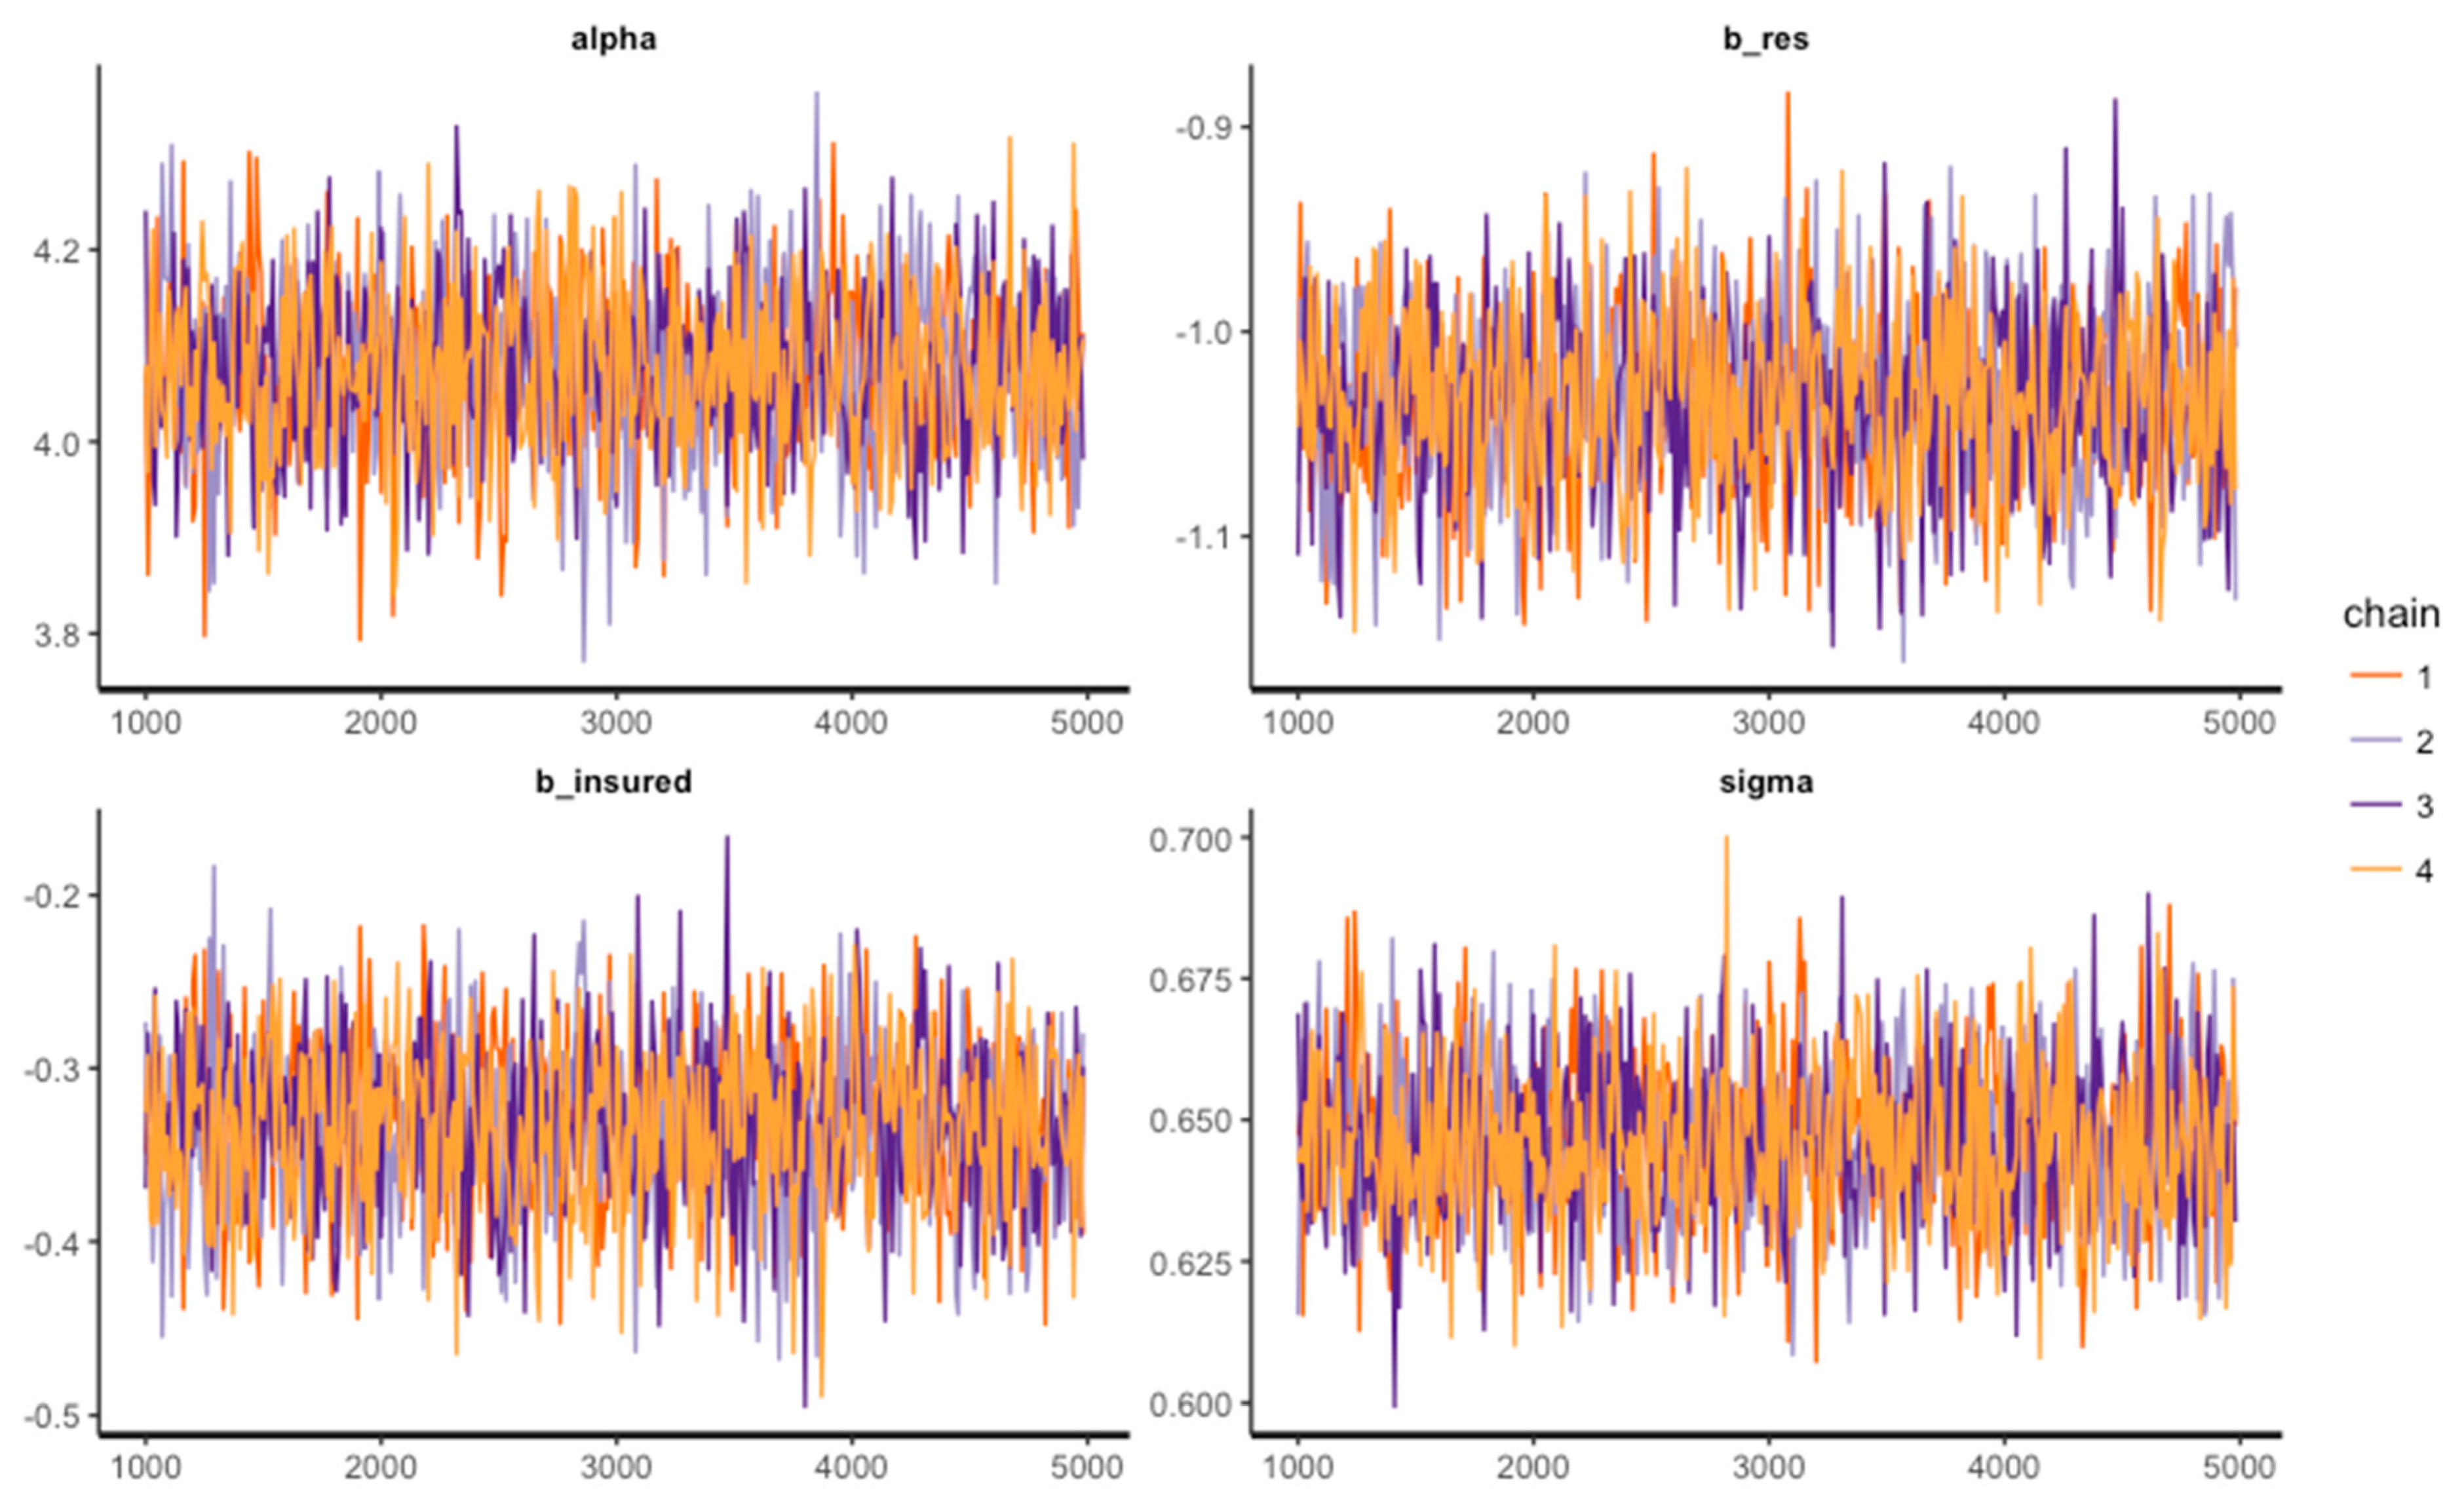
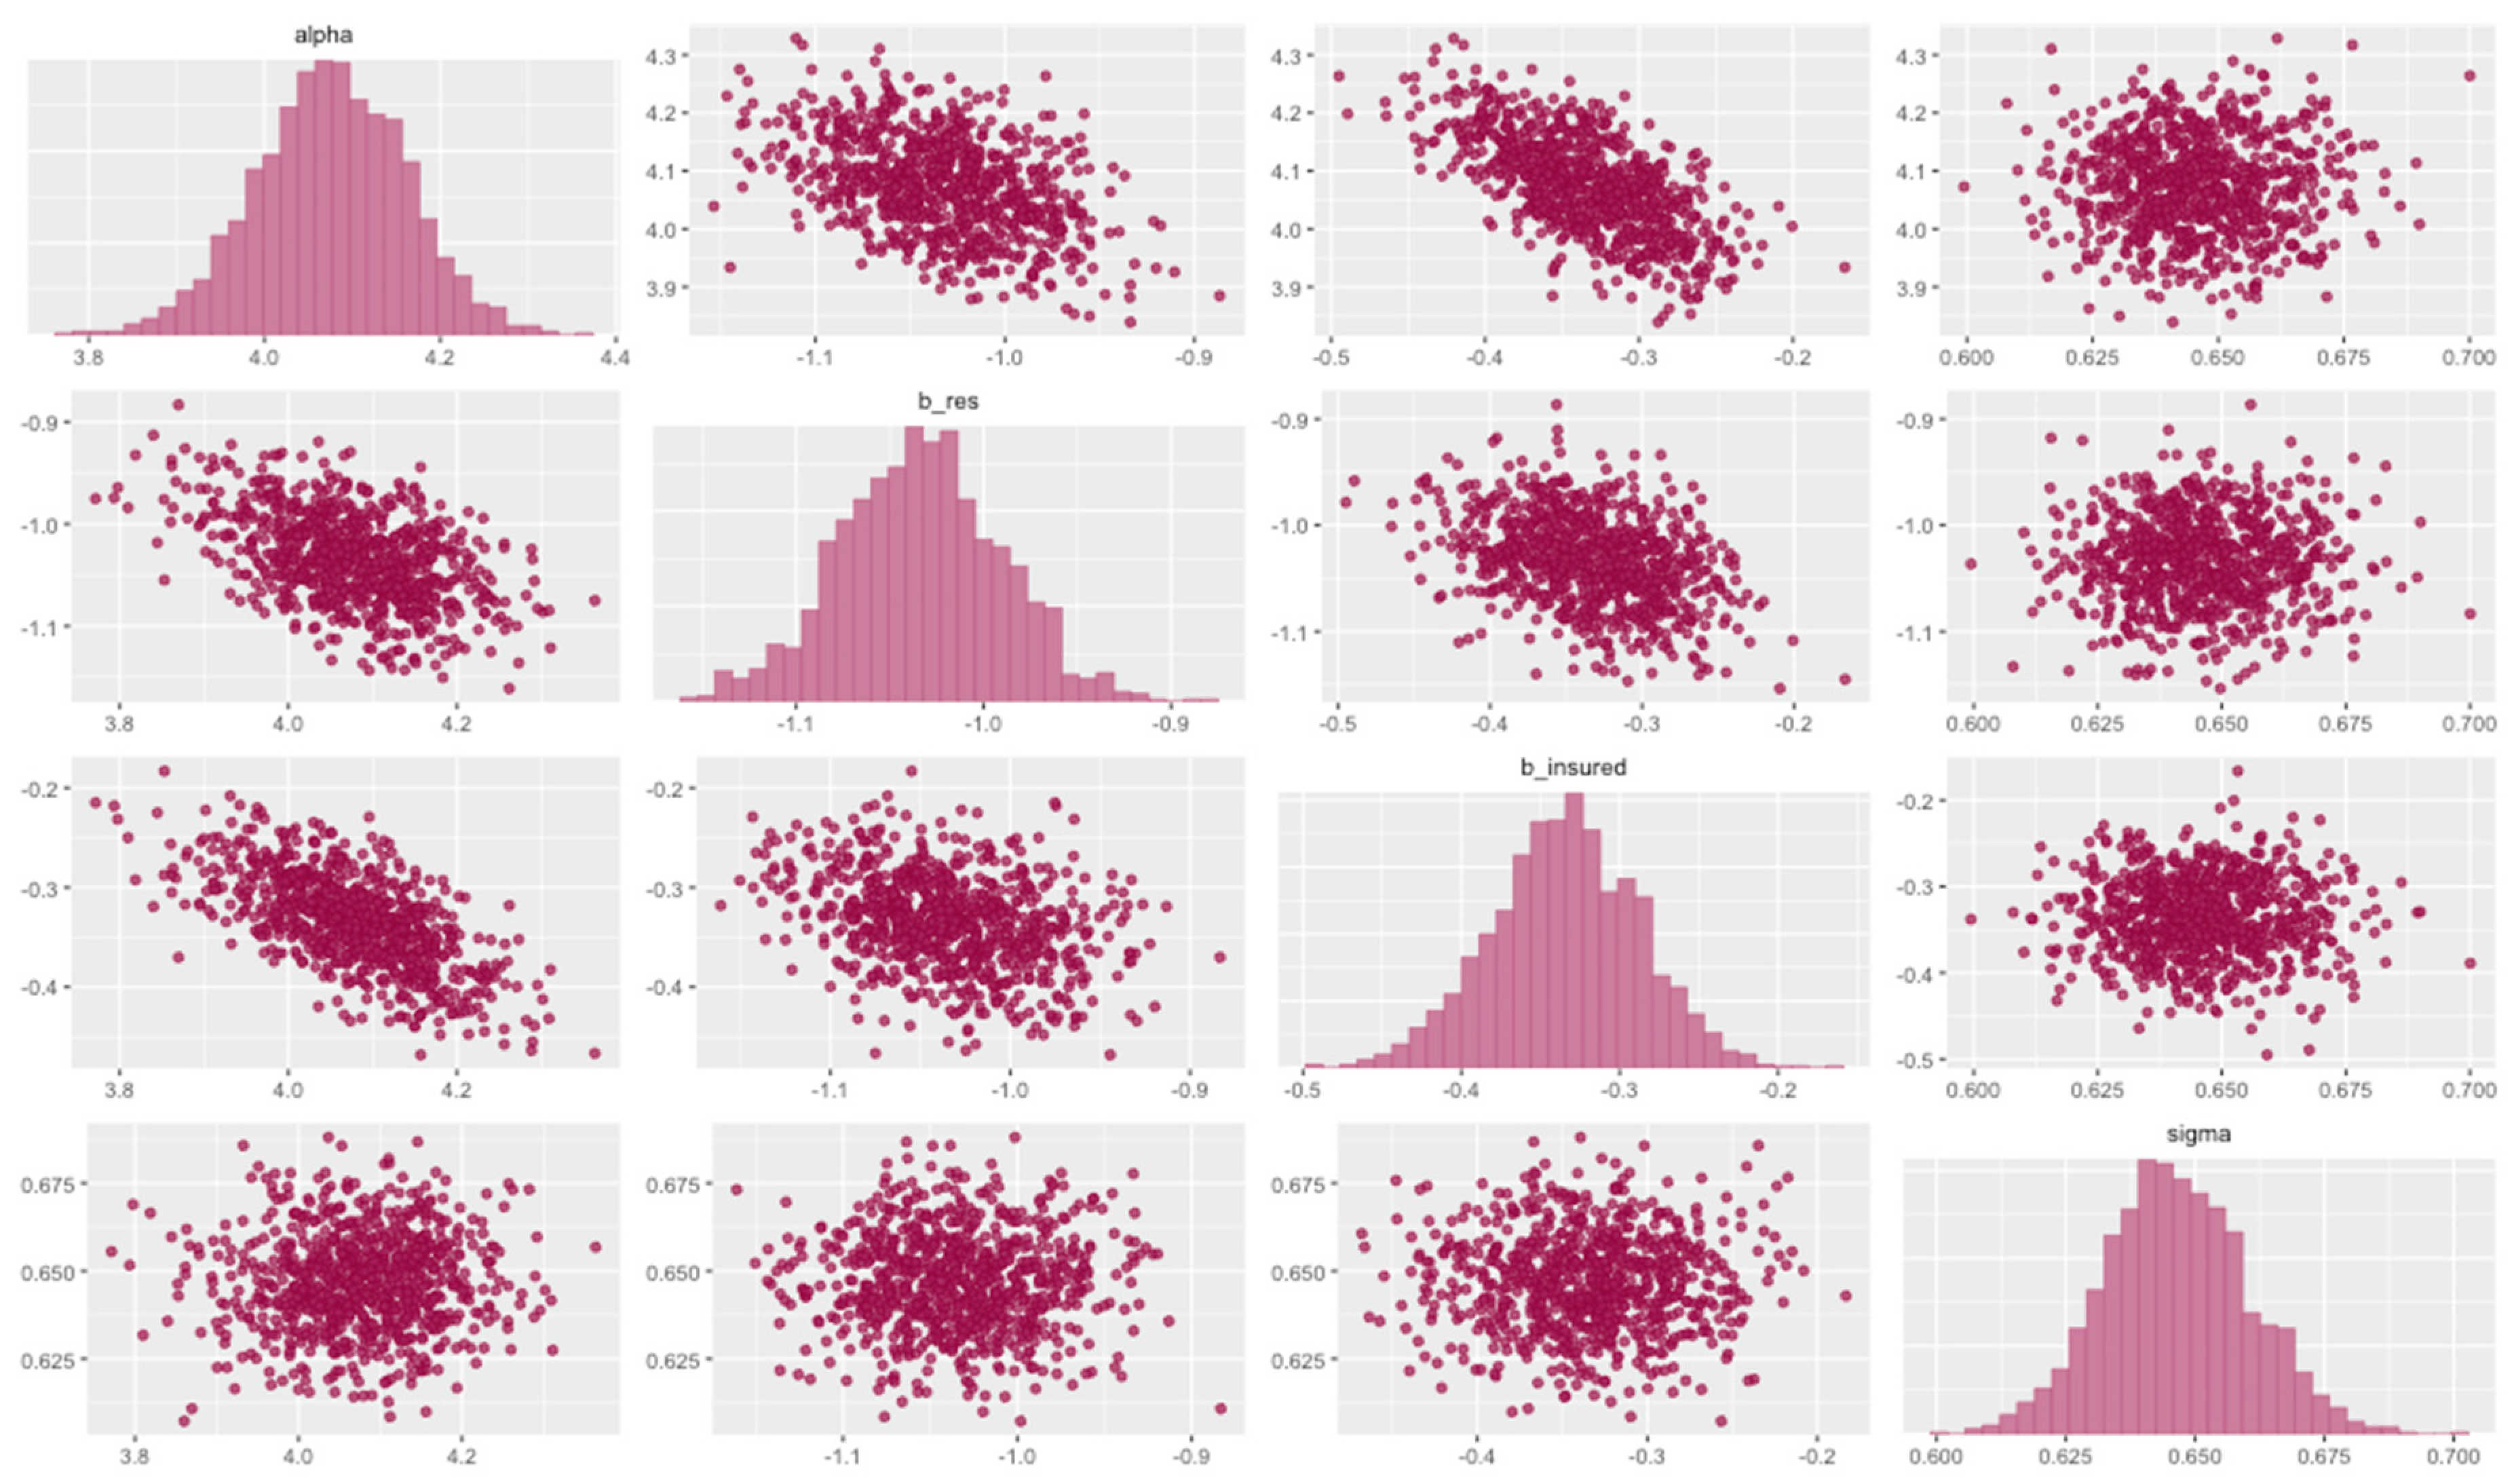
| 4 chains, each with iter = 5000; warmup = 1000; thin = 10; | ||||||||||
| post-warmup draws per chain = 400, total post-warmup draws = 1600. | ||||||||||
| mean | se_mean | sd | 2.5% | 25% | 50% | 75% | 97.5% | n_eff | Rhat | |
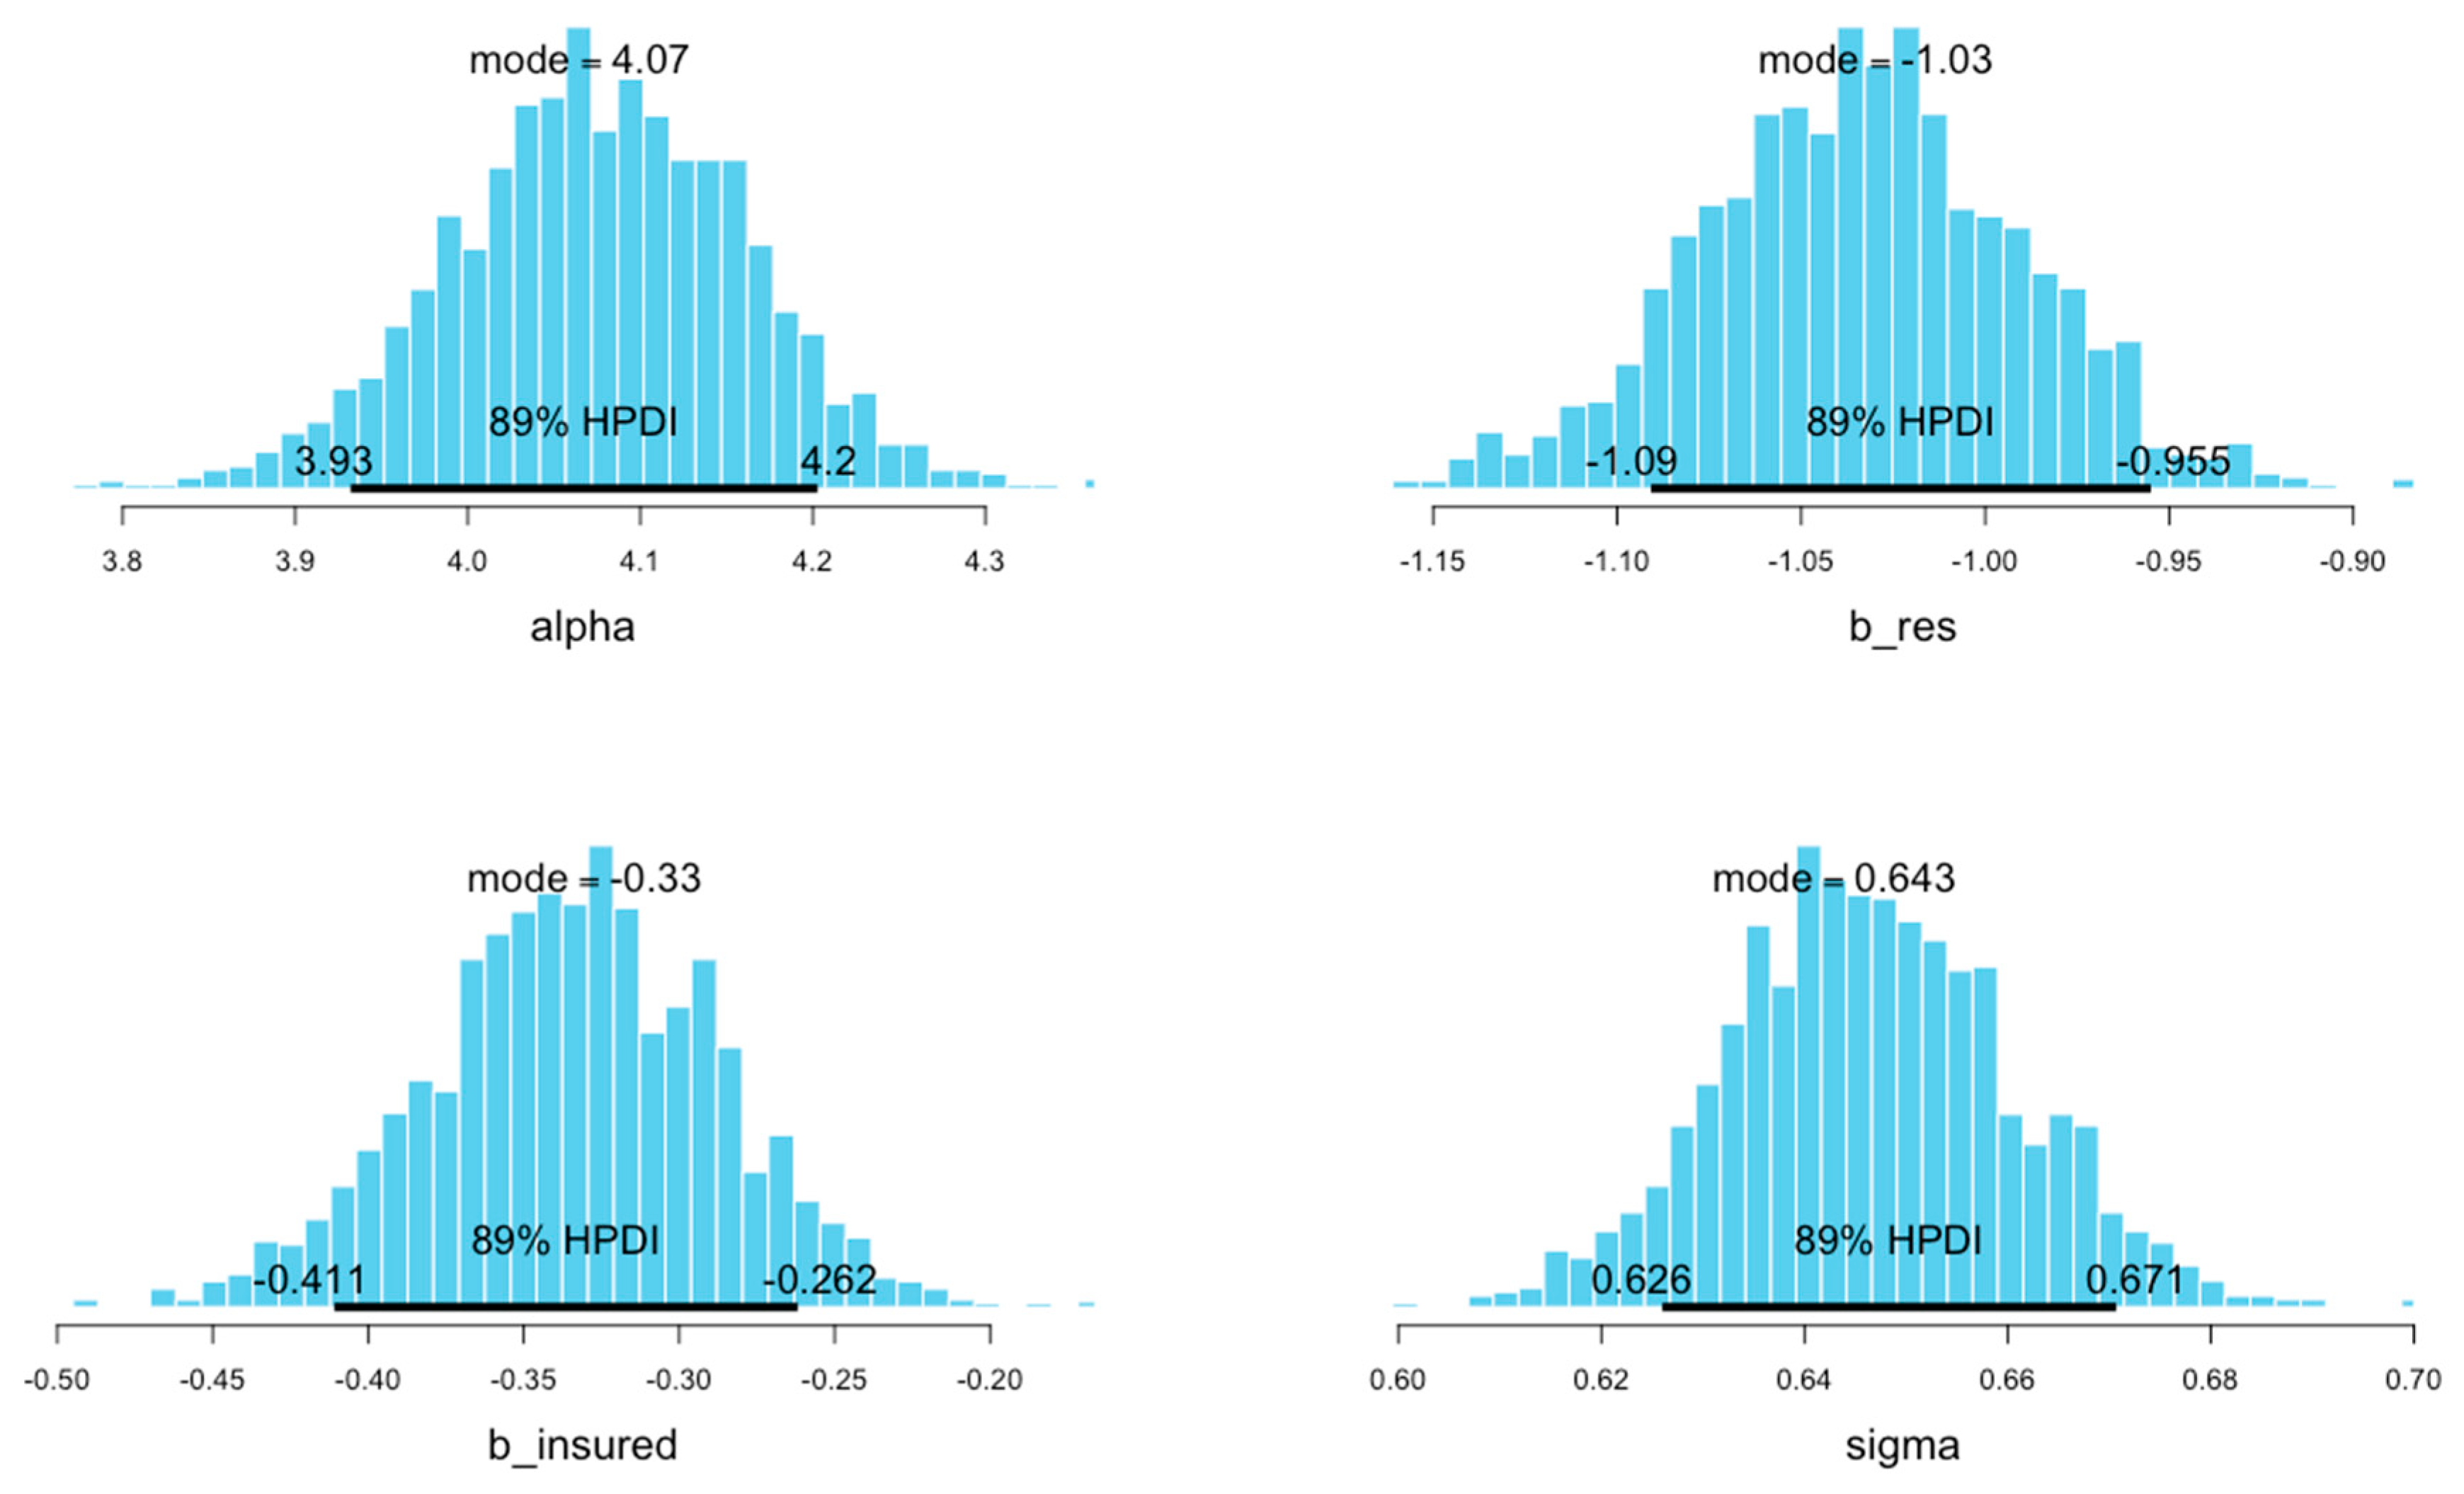
| alpha | 4.08 | 0 | 0.09 | 3.90 | 4.02 | 4.08 | 4.14 | 4.24 | 1485 | 1 |
| b_res | −1.03 | 0 | 0.04 | −1.12 | −1.06 | −1.03 | −1.01 | −0.95 | 1502 | 1 |
| b_insured | −0.33 | 0 | 0.05 | −0.43 | −0.37 | −0.33 | −0.30 | −0.24 | 1610 | 1 |
| sigma | 0.65 | 0 | 0.01 | 0.62 | 0.64 | 0.65 | 0.66 | 0.67 | 1763 | 1 |
4. Conclusions
Author Contributions
Funding
Acknowledgments
Conflicts of Interest
References
- Vuong, Q.H.; Nguyen, H.; Vuong, T.-T. Health insurance thresholds and policy implications: a Vietnamese medical survey in 2015. Biomed. Res. 2017, 28, 2432–2438. [Google Scholar]
- Vuong, Q.H. Be rich or don’t be sick: Estimating Vietnamese patients’ risk of falling into destitution. SpringerPlus 2015, 4, 529. [Google Scholar] [CrossRef] [PubMed]
- Pekerti, A.; Vuong, Q.-H.; Ho, M.T.; Vuong, T.-T. Health care payments in Vietnam: Patients’ quagmire of caring for health versus economic destitution. Int. J. Environ. Res. Public Health 2017, 14, 1118. [Google Scholar] [CrossRef] [PubMed]
- Vuong, Q.-H.; Nguyen, T.-K. Data on Vietnamese patients’ financial burdens and risk of destitution. Data Brief 2016, 9, 543–548. [Google Scholar] [CrossRef] [PubMed]
- Vuong, Q.H. Sociodemographic factors influencing Vietnamese patient satisfaction with healthcare services and some meaningful empirical thresholds. Iran. J. Public Health 2018, 47, 119–126. [Google Scholar] [PubMed]
- Sepehri, A.; Chernomas, R.; Akram-Lodhi, A.H. If they get sick, they are in trouble: health care restructuring, user charges, and equity in Vietnam. Int. J. Health Serv. 2003, 33. [Google Scholar] [CrossRef] [PubMed]
- Vuong, Q.-H.; Ho, T.-M.; Nguyen, H.-K.; Vuong, T.-T. Healthcare consumers’ sensitivity to costs: a reflection on behavioural economics from an emerging market. Palgrave Commun. 2018, 4, 70. [Google Scholar] [CrossRef]
- Lönnroth, K.; Tran, T.U.; Thuong, L.M.; Quy, H.T.; Diwan, V. Can I afford free treatment?: Perceived consequences of health care provider choices among people with tuberculosis in Ho Chi Minh City, Vietnam. Soc. Sci. Med. 2001, 52. [Google Scholar] [CrossRef]
- Segall, M.; Tipping, G.; Lucas, H.; Dung, T.V.; Tam, N.T.; Vinh, D.X.; Huong, D.L. Economic transition should come with a health warning: the case of Vietnam. J. Epidemiol. Community Health 2002, 56. [Google Scholar] [CrossRef]
- Agresti, A. Categorical Data Analysis, 3rd ed.; Wiley: Hoboken, NJ, USA, 2013. [Google Scholar]
- Vuong, Q.-H.; Bui, Q.-K.; La, V.-P.; Vuong, T.-T.; Nguyen, V.-H.T.; Ho, M.-T.; Nguyen, H.-K.T.; Ho, M.-T. Cultural additivity: Behavioural insights from the interaction of Confucianism, Buddhism, and Taoism in folktales. Palgrave Commun. 2018, 4, 143. [Google Scholar] [CrossRef]
- Vuong, Q.-H.; Bui, Q.-K.; La, V.-P.; Vuong, T.-T.; Ho, M.-T.; Nguyen, H.-K.T.; Nguyen, H.-N.; Nghiem, K.-C.P.; Ho, M.-T. Cultural evolution in Vietnam’s early 20th century: A Bayesian networks analysis of Franco-Chinese house designs. arXiv 2019, arXiv:1903.00817v1. [Google Scholar] [CrossRef]
- Kruschke, J. Doing Bayesian Data Analysis: A Tutorial with R, JAGS, and Stan, 2nd ed.; Academic Press: London, UK, 2014. [Google Scholar]
- McElreath, R. Statistical Rethinking: A Bayesian Course with Examples in R and Stan; Chapman and Hall/CRC: London, UK, 2018. [Google Scholar]
- Scutari, M.; Denis, J.-B. Bayesian Networks: With Examples in R; Chapman and Hall/CRC: London, UK, 2014. [Google Scholar]
- Lynch, S.M. Introduction to Applied Bayesian Statistics and Estimation for Social Scientists; Springer: New York, NY, USA, 2007. [Google Scholar]
- Vuong, Q.H.; La, V.-P. BayesVL Package for Bayesian Statistical Analyses in R. Github: BayesVL Package Version 0.6. 2019. Available online: https://github.com/sshpa/bayesvl (accessed on 20 April 2019).
- Vuong, Q.-H. The (ir)rational consideration of the cost of science in transition economies. Nat. Hum. Behav. 2018, 2, 5. [Google Scholar] [CrossRef] [PubMed]


| Coded Name | Explanation | Items | Total | Male | Female | |||
|---|---|---|---|---|---|---|---|---|
| Freq | % | Freq | % | Freq | % | |||
| Res | Whether the patient lives in the same region as the hospital. | Yes | 578 | 55.5 | 323 | 55.9 | 255 | 44.1 |
| No | 464 | 44.5 | 289 | 62.3 | 175 | 37.7 | ||
| Stay | How long the patient stays at the hospital: under 10 days (S) or more than 10 days (L). | Long | 289 | 27.7 | 175 | 60.6 | 114 | 39.4 |
| Short | 753 | 72.3 | 437 | 58.0 | 316 | 42.0 | ||
| Insured | Whether the patient has valid insurance or not. | Yes | 724 | 69.5 | 406 | 56.1 | 318 | 43.9 |
| No | 318 | 30.5 | 206 | 64.8 | 112 | 35.2 | ||
| Edu | The highest educational level of the patient: junior high school (JHS), high school (HS), university (Uni), or graduate school (Grad). | JHS | 141 | 13.5 | 79 | 56.0 | 62 | 44.0 |
| HS | 705 | 67.7 | 426 | 60.4 | 279 | 39.6 | ||
| Uni | 194 | 18.6 | 105 | 54.1 | 89 | 45.9 | ||
| Grad | 2 | 0.2 | 2 | 100.0 | 0 | 0.0 | ||
| SES | The socioeconomic status of the patient. This variable was based on IncRank (the ranking of the patient’s income) or that of the patient’s guardian(s) if required. | Hi | 38 | 3.6 | 20 | 52.6 | 18 | 47.4 |
| Med | 908 | 87.1 | 535 | 58.9 | 373 | 41.1 | ||
| Low | 96 | 9.2 | 57 | 59.4 | 39 | 40.6 | ||
| Illness | The seriousness of the patient’s illness or injury. In the dataset, the variable “Ill2” combined two values “ill” and “light” into one value “light” for analysis. | Emergency | 285 | 27.4 | 204 | 71.6 | 81 | 28.4 |
| Bad | 520 | 49.9 | 293 | 56.3 | 227 | 43.7 | ||
| Ill | 221 | 21.2 | 105 | 47.5 | 116 | 52.5 | ||
| Light | 16 | 1.5 | 10 | 62.5 | 6 | 37.5 | ||
| Jcond | The condition of the patient’s employment. | Stable | 513 | 49.2 | 300 | 58.5 | 213 | 41.5 |
| Unstable | 335 | 32.1 | 212 | 63.3 | 123 | 36.7 | ||
| Unemployed | 99 | 9.5 | 52 | 52.5 | 47 | 47.5 | ||
| IncRank | The ranking of the patient’s income. Unit: million VND (Vietnamese Dong). | High (>180) | 8 | 0.8 | 4 | 50.0 | 4 | 50.0 |
| Middle (48–180) | 241 | 23.1 | 139 | 57.7 | 102 | 42.3 | ||
| Low (<48) | 793 | 76.1 | 469 | 59.1 | 324 | 40.9 | ||
| AvgCost | The average cost that the patient spent daily during treatment. Unit: million VND (Vietnamese Dong). | High (>5.4) | 159 | 15.3 | 110 | 69.2 | 49 | 30.8 |
| Medium (1.5 to 5.4) | 432 | 41.5 | 255 | 59.0 | 177 | 41.0 | ||
| Low (≤1.5) | 451 | 43.3 | 247 | 54.8 | 204 | 45.2 | ||
| InsL | The categories of the amount that insurance covered. It is based on the numerical variable “Pins”, which is the portion of fees covered by insurance reimbursement. | A (>0.45) | 546 | 52.4 | 318 | 58.2 | 228 | 41.8 |
| B (>0.25 and ≤0.45) | 105 | 10.1 | 45 | 42.9 | 60 | 57.1 | ||
| C (≤0.25) | 65 | 6.2 | 35 | 53.8 | 30 | 46.2 | ||
| N.E. (=0) | 326 | 31.3 | 214 | 65.6 | 112 | 34.4 | ||
| EnvL | The portion of “extra thank-you money” that the patient had to include in the medical fees. | High (>15%) | 108 | 10.4 | 37 | 34.3 | 71 | 65.7 |
| Medium (7%–15%) | 158 | 15.2 | 99 | 62.7 | 59 | 37.3 | ||
| Low (<7%) | 464 | 44.5 | 294 | 63.4 | 170 | 36.6 | ||
| Nil (0) | 312 | 29.9 | 182 | 58.3 | 130 | 41.7 | ||
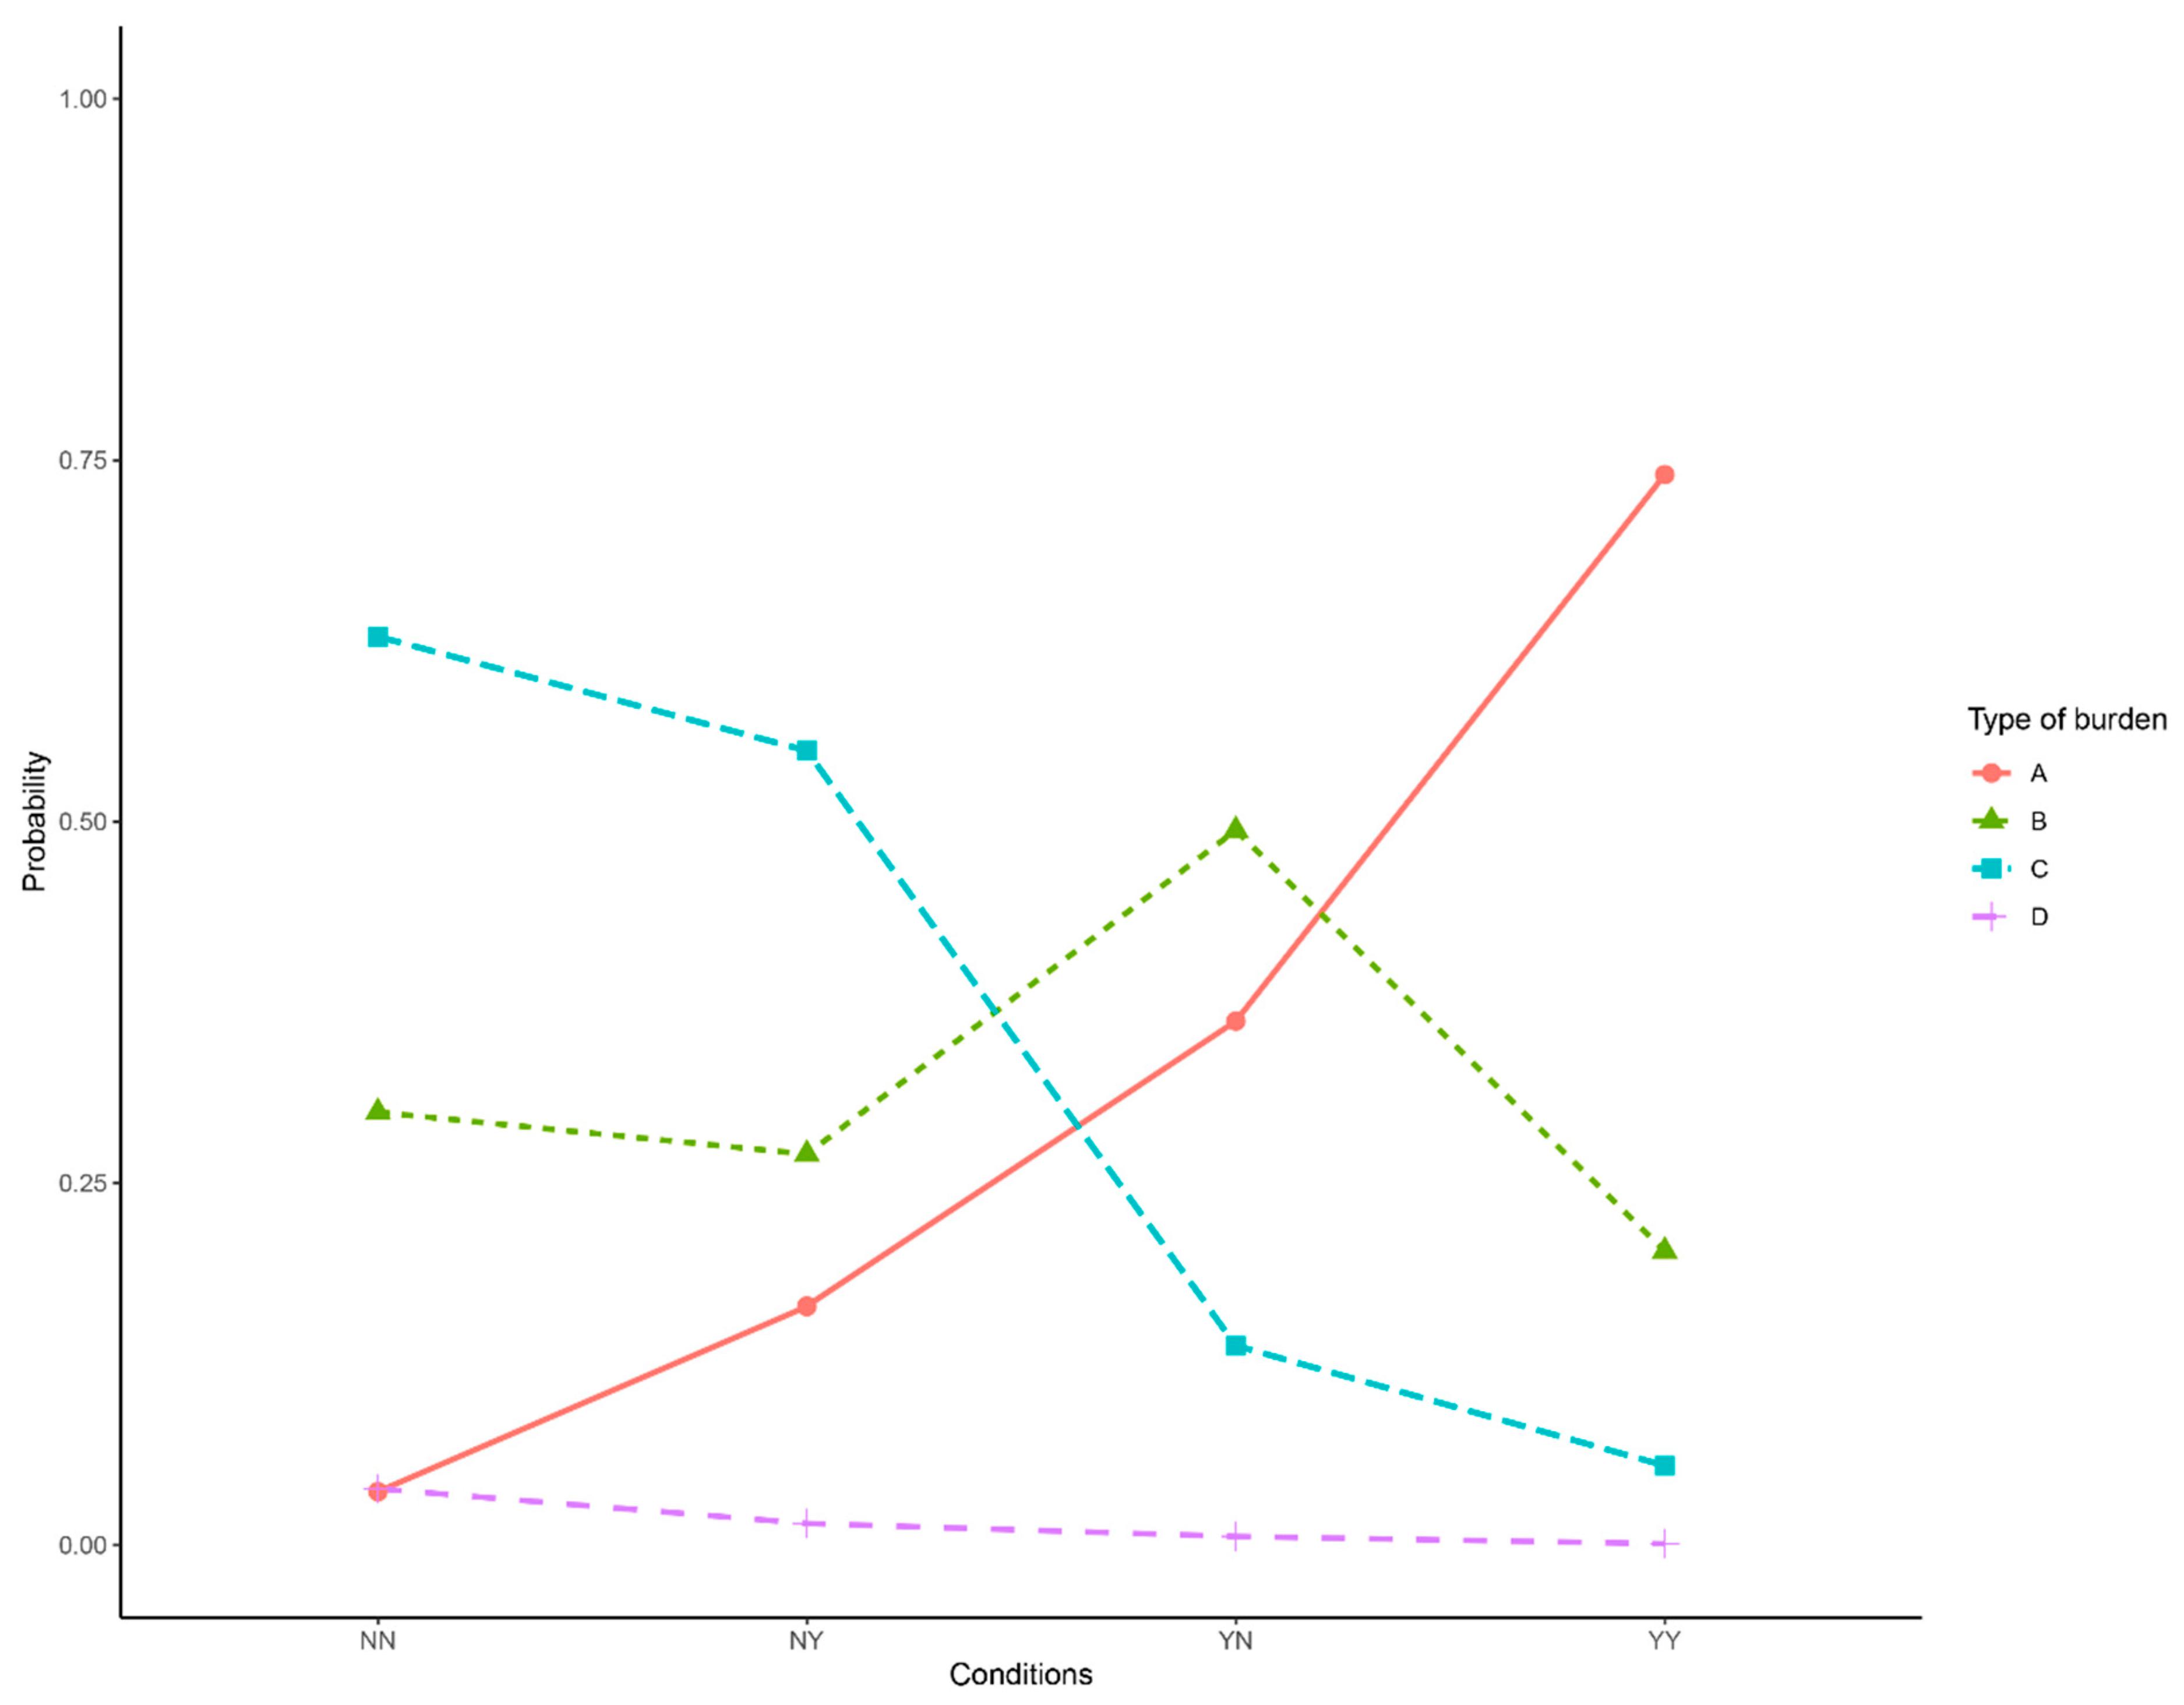
| Burden | The self-reported evaluation of the patient’s and family’s financial situation after paying treatment fees: minimally affected (A), adversely affected (B), destitute (C), adversely destitute (D). | A | 442 | 42.4 | 232 | 52.5 | 210 | 47.5 |
| B | 275 | 26.4 | 161 | 58.5 | 114 | 41.5 | ||
| C | 312 | 29.9 | 213 | 68.3 | 99 | 31.7 | ||
| D | 13 | 1.2 | 6 | 46.2 | 7 | 53.8 | ||
| End | The outcome of treatment: recovered (A), need follow-up treatment (B), stopped in the middle (C), and quit early (D). | A | 539 | 51.7 | 273 | 50.6 | 266 | 49.4 |
| B | 394 | 37.8 | 259 | 65.7 | 135 | 34.3 | ||
| C | 47 | 4.5 | 31 | 66.0 | 16 | 34.0 | ||
| D | 62 | 6.0 | 49 | 79.0 | 13 | 21.0 | ||
| SatIns | The patient’s satisfaction level regarding health insurance. | Satisfied | 118 | 11.3 | 61 | 51.7 | 57 | 48.3 |
| Average | 613 | 58.8 | 344 | 56.1 | 269 | 43.9 | ||
| Low | 1 | 0.1 | 1 | 100.0 | 0 | 0.0 | ||
| No Comment | 274 | 26.3 | 178 | 65.0 | 96 | 35.0 | ||
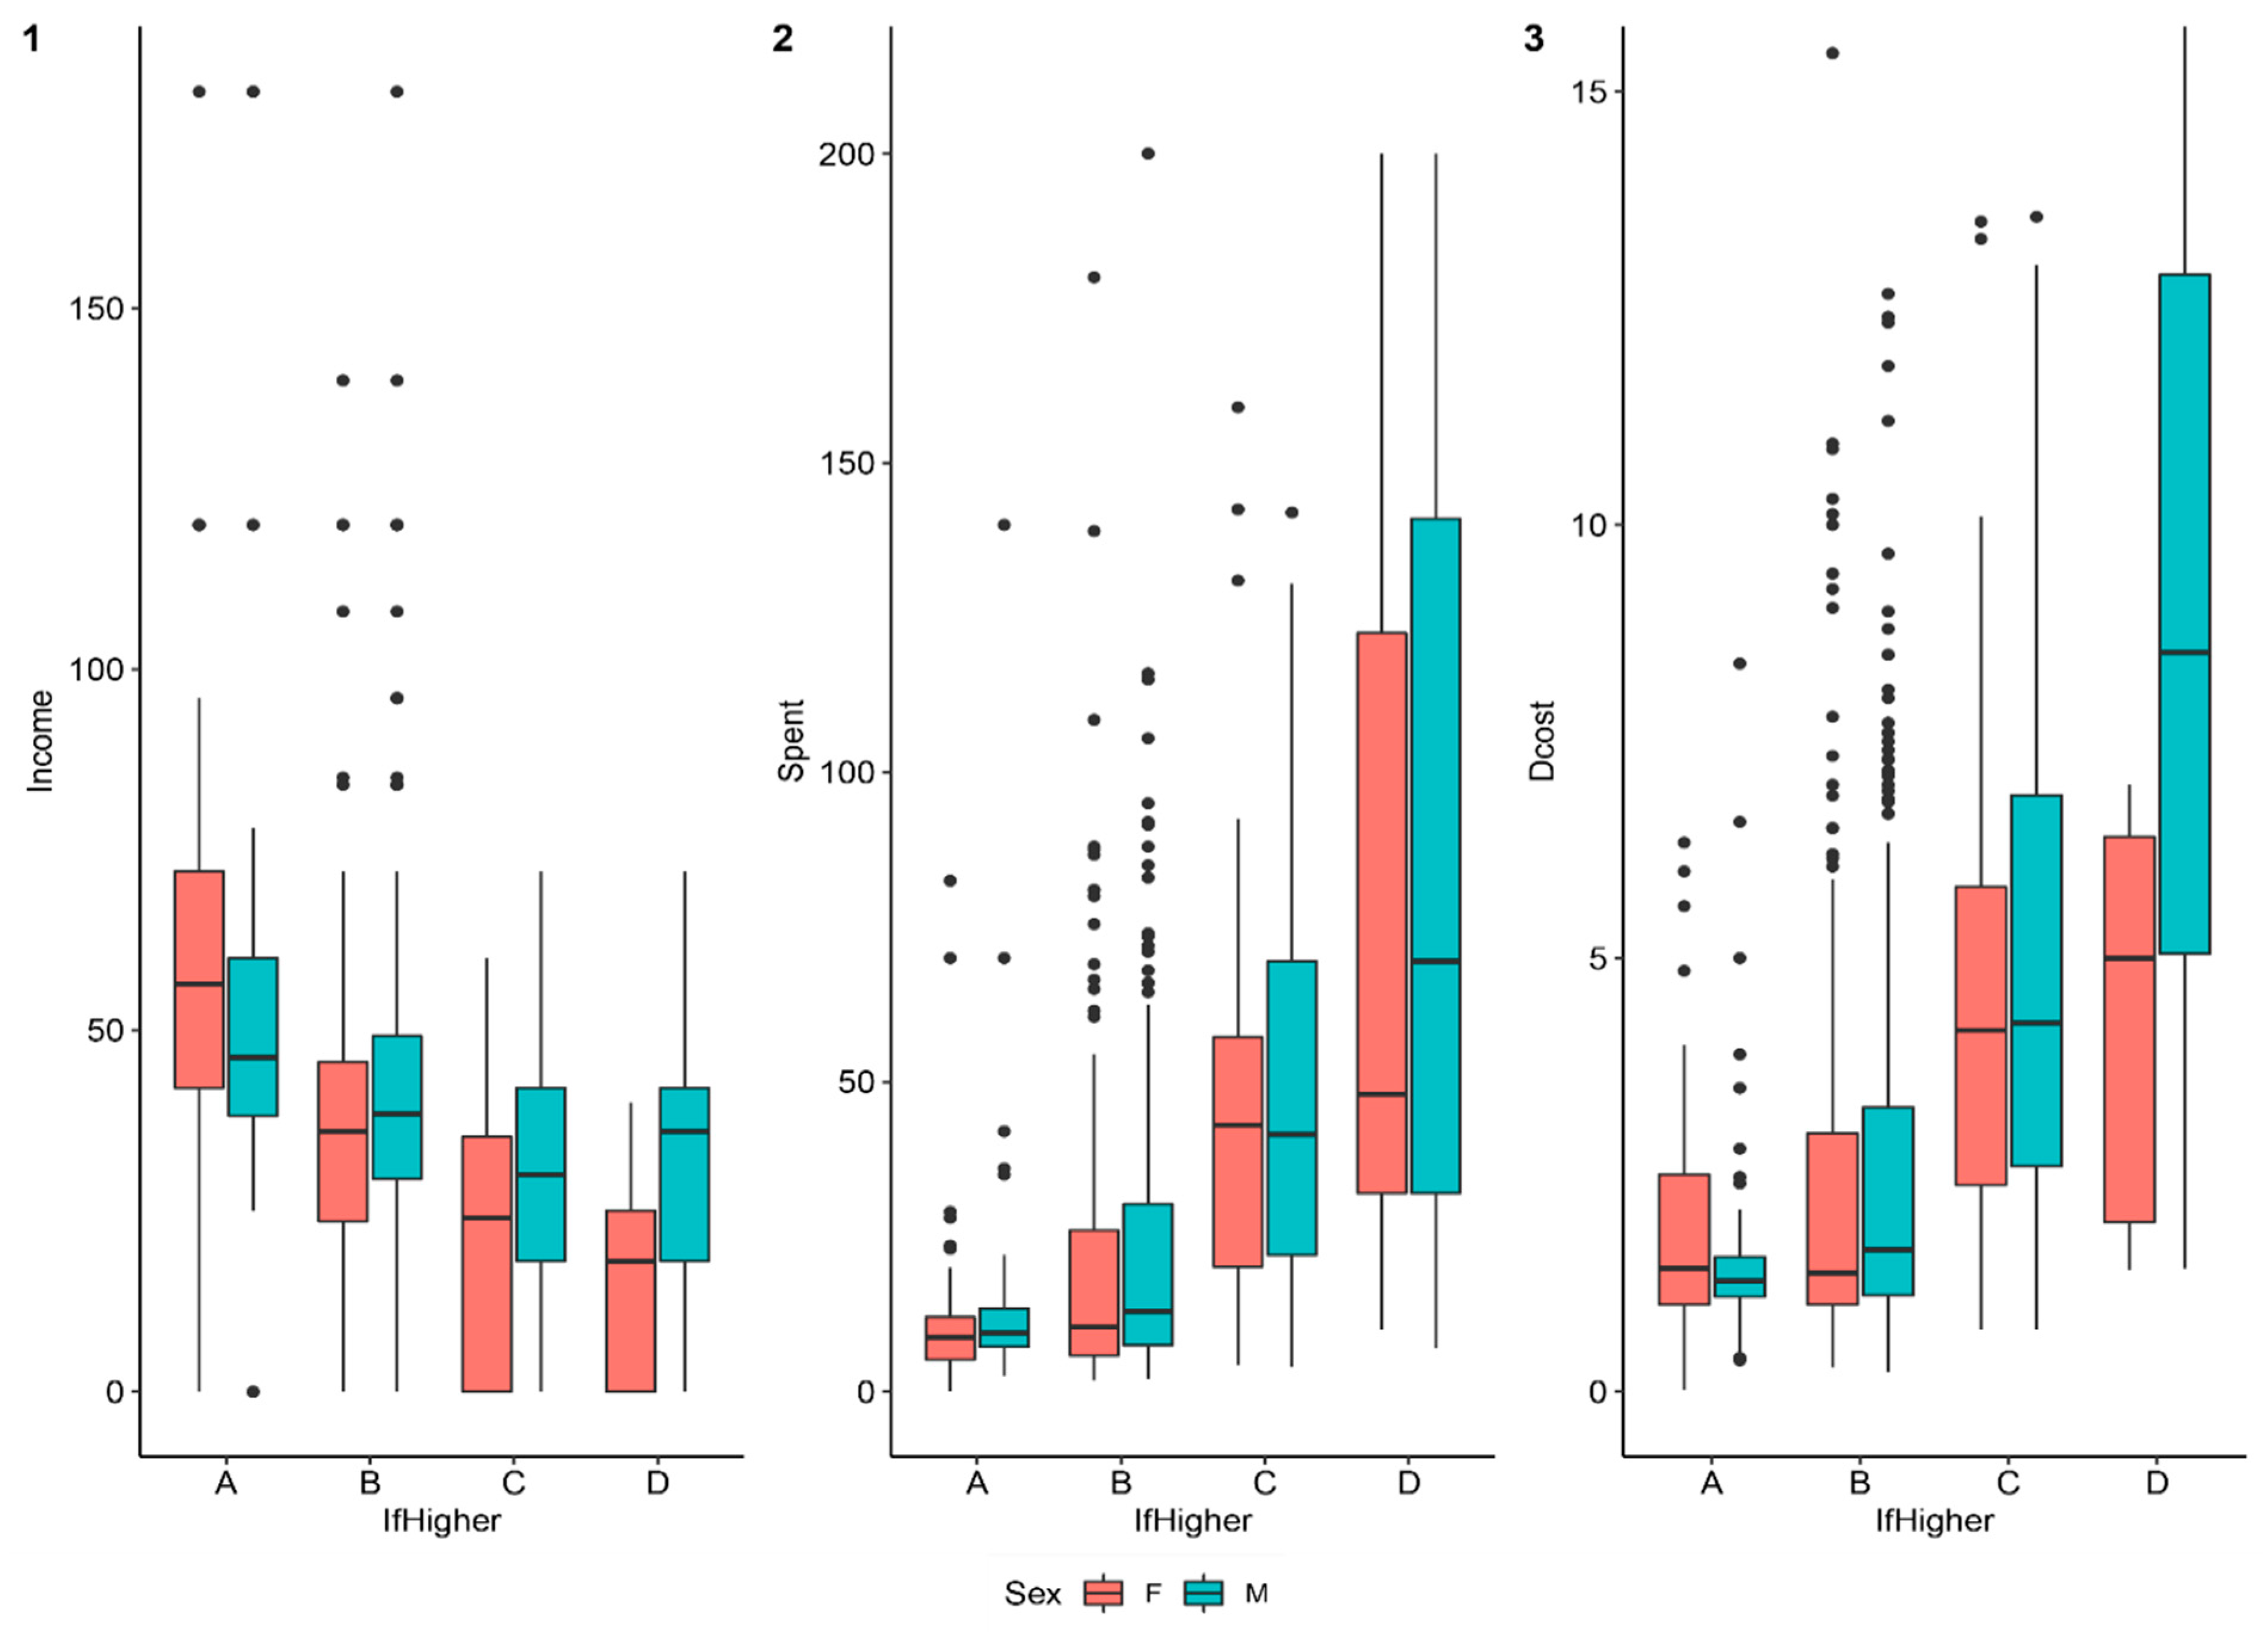
| IfHigher | The self-reported evaluation of the patient’s and family’s financial situation if the patient continues treatment. The values of this variable are the same as “Burden”. | A | 185 | 17.8 | 80 | 43.2 | 105 | 56.8 |
| B | 641 | 61.5 | 391 | 61.0 | 250 | 39.0 | ||
| C | 187 | 17.9 | 123 | 65.8 | 64 | 34.2 | ||
| D | 29 | 2.8 | 18 | 62.1 | 11 | 37.9 | ||
| Coded Name | Explanation | Unit | Mean | Standard Deviation | Min | Max |
|---|---|---|---|---|---|---|
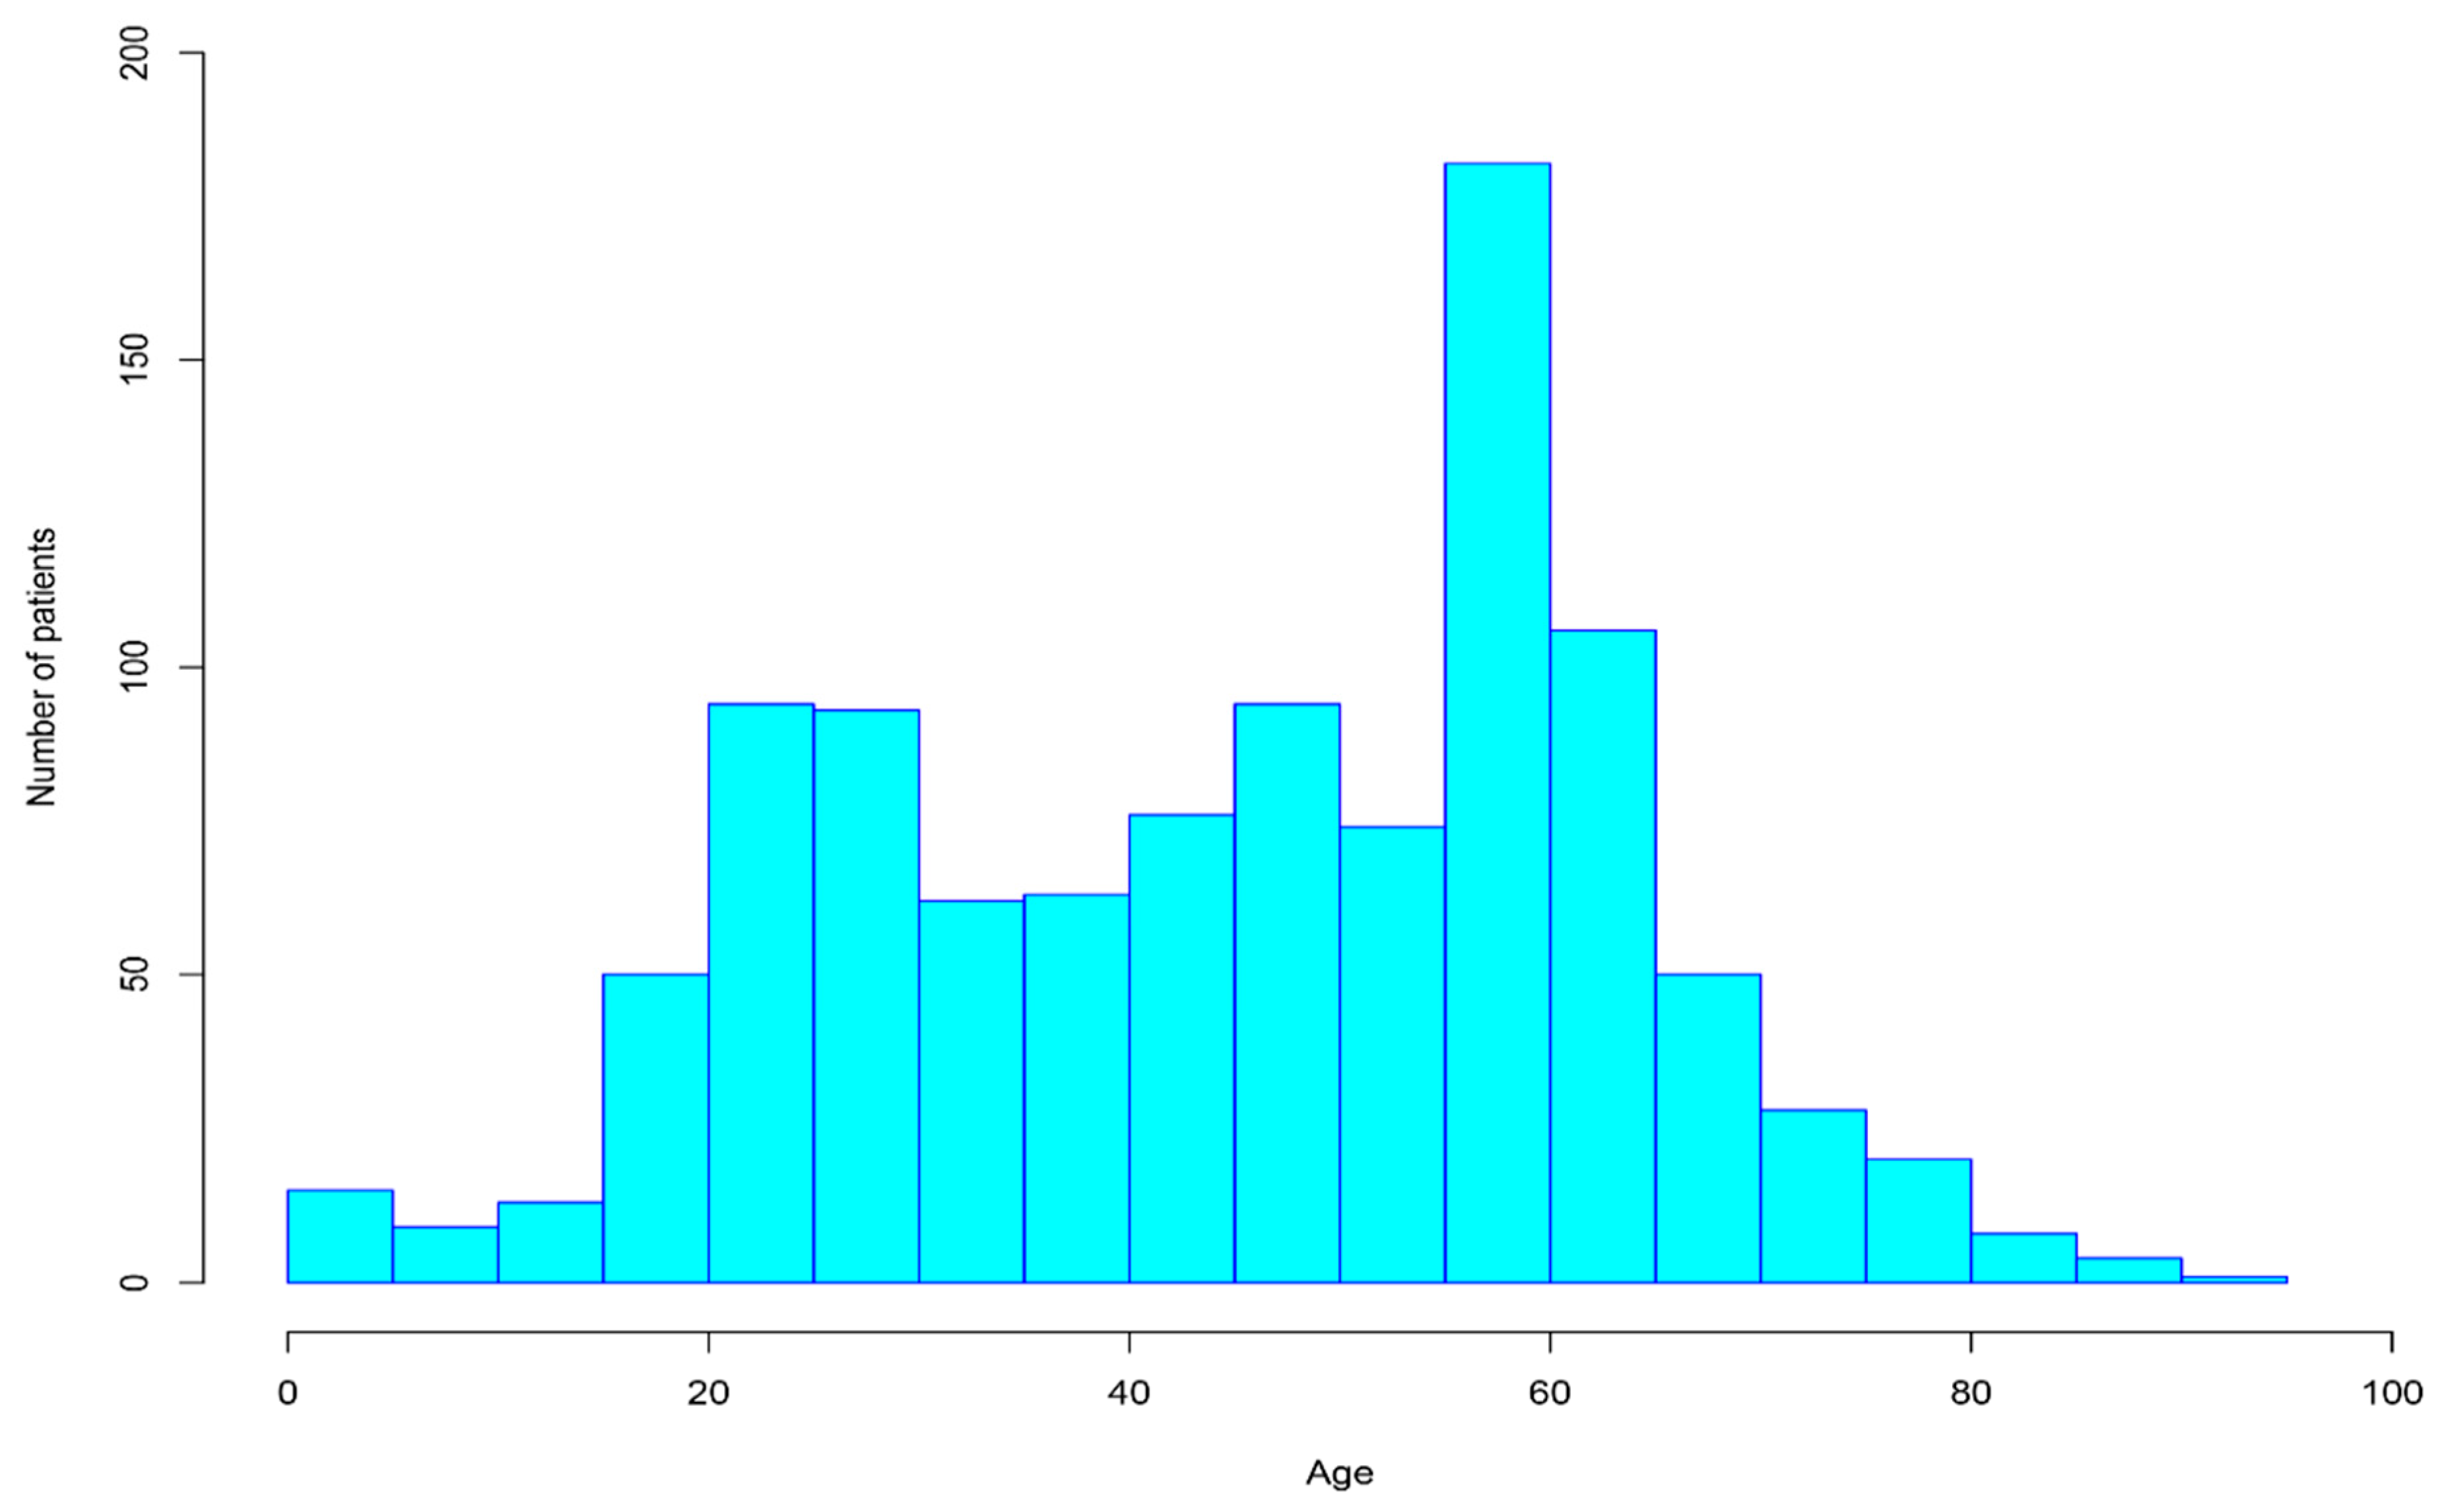
| Age | The patient’s age. | Age | 45.43 | 17.96 | 1 | 92 |
| Days | The number of days the patient stays in for treatment. | Day | 8.97 | 5.99 | 1 | 60 |
| MaxIns | The highest level of insurance coverage. | Percent | 0.60 | 0.42 | 0 | 1.00 |
| Saving | The portion of savings. | Percent | 0.18 | 1.99 | 0 | 60.00 |
| WkYrs | The number of years the patient has worked. | Year | 20.6 | 15.85 | 0 | 60 |
| Income | The annual income of the patient. | Million VND (Vietnamese Dong) | 40.67 | 39.04 | 0 | 550.00 |
| Dcost | The cost of staying at the hospital for a day. | 3.07 | 3.76 | 0.03 | 50.33 | |
| Spent | The amount of money the patient actually spent. | 27.85 | 42.40 | 0.10 | 665.00 | |
| Pins | The portion of fees financed by insurance reimbursement. | Percent | 0.41 | 0.33 | 0 | 0.90 |
| Pinc | The portion of fees financed by income. | 0.50 | 0.33 | 0 | 1.00 | |
| Pchar | The portion of fees financed by a charity. | 0.02 | 0.09 | 0 | 1.00 | |
| Ploan | The portion of fees financed by a loan. | 0.07 | 0.17 | 0 | 1.00 | |
| Streat | The portion of funds used for treatment. | Percent | 0.82 | 0.13 | 0.17 | 1.00 |
| Srel | The portion of funds used for paying relatives who came to help. | 0.12 | 0.10 | 0 | 0.83 | |
| Senv | The portion of funds used for “extra thank-you money” or for bribing doctor/staff. | 0.06 | 0.07 | 0 | 0.60 |
| • What are the effects of socio-demographic factors on the probability of being destitute? |
| • To what extent are socio-demographic factors the determinants of the degree of illness? |
| • What is the impact of hospitalization length on patients’ financial burden? |
| • How do the treatment costs and illness explain the end outcome of treatment? |
| • How does the amount of out-of-pocket “extra thank-you money” determine the end outcome of treatment? |
| Intercept | Resident | Insured | |
|---|---|---|---|
| No | No | ||
| Logit(B|A) | −1.291*** | 1.784*** | 1.601*** |
| Logit(C|A) | −2.599*** | 3.801*** | 1.635*** |
| Logit(D|A) | −6.561*** | 4.163*** | 2.401*** |
| Residual Deviance = 1777.9, Log-likelihood = −888.96 on 9 df, baseline = “A” | |||
© 2019 by the authors. Licensee MDPI, Basel, Switzerland. This article is an open access article distributed under the terms and conditions of the Creative Commons Attribution (CC BY) license (http://creativecommons.org/licenses/by/4.0/).
Share and Cite
Ho, M.-T.; La, V.-P.; Nguyen, M.-H.; Vuong, T.-T.; Nghiem, K.-C.P.; Tran, T.; Nguyen, H.-K.T.; Vuong, Q.-H. Health Care, Medical Insurance, and Economic Destitution: A Dataset of 1042 Stories. Data 2019, 4, 57. https://doi.org/10.3390/data4020057
Ho M-T, La V-P, Nguyen M-H, Vuong T-T, Nghiem K-CP, Tran T, Nguyen H-KT, Vuong Q-H. Health Care, Medical Insurance, and Economic Destitution: A Dataset of 1042 Stories. Data. 2019; 4(2):57. https://doi.org/10.3390/data4020057
Chicago/Turabian StyleHo, Manh-Toan, Viet-Phuong La, Minh-Hoang Nguyen, Thu-Trang Vuong, Kien-Cuong P. Nghiem, Trung Tran, Hong-Kong T. Nguyen, and Quan-Hoang Vuong. 2019. "Health Care, Medical Insurance, and Economic Destitution: A Dataset of 1042 Stories" Data 4, no. 2: 57. https://doi.org/10.3390/data4020057
APA StyleHo, M.-T., La, V.-P., Nguyen, M.-H., Vuong, T.-T., Nghiem, K.-C. P., Tran, T., Nguyen, H.-K. T., & Vuong, Q.-H. (2019). Health Care, Medical Insurance, and Economic Destitution: A Dataset of 1042 Stories. Data, 4(2), 57. https://doi.org/10.3390/data4020057