Data Descriptor

A Breast Cancer Histology and Immunohistochemistry Image Dataset with Linked Clinicopathological Metadata


1
Department of Computer Engineering, West Ukrainian National University, Lvivska Str., 11, 46000 Ternopil, Ukraine
2
Department of Pathologic Anatomy, Autopsy Course and Forensic Pathology, I. Horbachevsky Ternopil National Medical University of the Ministry of Health of Ukraine, Maidan Voli 1, 46001 Ternopil, Ukraine
*
Author to whom correspondence should be addressed.
Data 2026, 11(9), 214; https://doi.org/10.3390/data11090214
Submission received: 22 July 2026 / Revised: 24 August 2026 / Accepted: 25 August 2026 / Published: 27 August 2026

Abstract

Digital pathology and computational analysis of breast cancer require datasets that connect microscopic images with clinically meaningful diagnostic, morphological and immunohistochemical information. But images are often provided separately from pathomorphological reports, tumour profiles, biomarker assessments and segmentation masks, which limits their use for interpretable machine learning. This data descriptor presents a structured dataset of de-identified breast cancer cases that integrates H&E images, immunohistochemical images for ER, PR, HER2/neu and Ki-67, PNG cell segmentation masks and JSON-based clinical and morphological metadata. The dataset was formed from archival histological material, digitised microscopic fields of view and expert-verified diagnostic information. Each JSON record links the patient-level description, tumour profile, staining type, image file, mask file and marker-specific assessment, including Allred score fields for relevant immunohistochemical images. The proposed structure provides traceability from the diagnostic conclusion to individual image fields and associated masks. The dataset is intended to support research on tumour classification, cell segmentation, immunohistochemical marker quantification, HER2-related image analysis, Allred score modelling and explainable artificial intelligence in computational pathology.
Dataset License: CC BY-NC 4.0

1. Summary

Breast cancer remains one of the most common malignant diseases worldwide and a major cause of cancer-related mortality among women [1,2]. Its diagnosis and clinical interpretation rely on the combined assessment of tissue morphology, tumour grade, histological type, immunohistochemical biomarker expression, and molecular subtype [3,4]. In routine breast pathology, immunohistochemistry is essential for evaluating estrogen receptor (ER), progesterone receptor (PR), human epidermal growth factor receptor 2 (HER2), and the proliferation marker Ki-67 [5,6,7]. These markers are used to support tumour classification, prognosis, treatment selection, and the interpretation of clinically relevant subtypes. However, their assessment remains dependent on the quality of staining, the representativeness of the tissue sample, the diagnostic context, and the reproducibility of expert interpretation [5,6,7,8].
The rapid development of digital pathology has created new opportunities for the computational analysis of histological and immunohistochemical whole-slide images (WSIs). Deep learning methods are increasingly used for nuclear segmentation, tumour classification, biomarker prediction, HER2 scoring, Ki-67 quantification, virtual staining, and the extraction of spatial tissue features from WSIs [9,10,11,12,13,14]. Public histopathology datasets have played an important role in this progress by providing benchmark data for classification, segmentation, and image-level prediction tasks [15,16,17,18]. At the same time, many available datasets focus either on H&E images, isolated image patches, a single diagnostic task, or tabular clinical variables. As a result, immunohistochemical images are often analysed separately from the original pathomorphological report, clinical diagnosis, histological tumour type, tumour grade and molecular subtype [19,20]. This limits statistical processing, comparison between sample groups, construction of machine learning models, and interpretation of image analysis results within a clinically meaningful morphological context.
This work describes a structured dataset for the study of histological and immunohistochemical images of breast cancer. The dataset is designed for the integrated representation of diagnostic textual information, tumour profile, staining types, digital microscopic images and segmentation masks. The structure follows the logic of recent data-descriptor papers in digital pathology, where the dataset is presented not only as a collection of images, but also as a reproducible data resource with explicit metadata, acquisition context, preprocessing description, and potential machine learning applications [21,22].
The tumour profile includes clinically relevant morphological and immunohistochemical attributes, such as histological type, tumour grade, receptor status, HER2 status, Ki-67 expression, and molecular subtype. Expert-reviewed diagnostic and immunohistochemical information supports the consistency of tumour type, tumour grade, IHC-defined subtype, and Allred scores for the corresponding IHC images. This organization provides traceability from the primary diagnostic document to a specific image, local field of view, segmentation mask, and interpretive comment.
In contrast to datasets that contain only images, the proposed structure supports multilevel integration of data at the levels of the patient, diagnostic case, tumour profile, marker or staining type, image and segmentation mask [15,16,17,18,19,20,21,22]. This makes the dataset suitable for tasks of classification, segmentation, IHC marker expression assessment, Allred score modelling, HER2-related image analysis, comparison of textual conclusions with image-derived features, and preparation of training samples for computational pathology. The dataset may also support research on the relationship between diagnostic reports and image-level evidence, which is important for explainable and clinically interpretable artificial intelligence systems in digital pathology.
The authors of the article have many years of experience in the development of real and synthetic datasets and their application in CAD systems. Thus, in the article [23], GANs and diffusion models were used to generate synthetic biomedical image datasets. This study showed that diffusion models achieved better results according to the FID and IS metrics.
In another work [24] biomedical image datasets were analyzed, well-known datasets were compared, and key indicators were identified. The article describes the development of datasets containing real cytological, histological, and immunohistochemical images, and provides a detailed description of the processes of preparation, digitization, and storage.
The authors of the article [25] used biomedical images, including cytological, histological, and immunohistochemical images, for oncological diagnosis. Computational intelligence methods such as CNNs, GANs, and U-Net were used for the classification, generation, segmentation, and clustering of biomedical images.
The article [26] investigated the problem of automatic diagnosis based on the immunohistochemical analysis of images.
In the works [27,28] U-Net architectures were developed and tested for immunohistochemical image segmentation tasks. The results of immunohistochemical image segmentation were used in CAD systems.
The authors of the article [29] developed methods for the automatic diagnosis of breast cancer subtypes based on the analysis of immunohistochemical images.

2. Data Description

2.1. Data Source

The dataset [30] includes 55 images with total volume of approximately 497 MB. The dataset was obtained from tumor research materials from 11 patients with breast cancer. The histological specimens were provided by the Interdepartmental Educational and Scientific Laboratory Center of I. Horbachevsky Ternopil National Medical University. The images and metadata were derived from an archival collection, and their use was approved by the Bioethics Commission, protocol 85 from 1 April 2026.
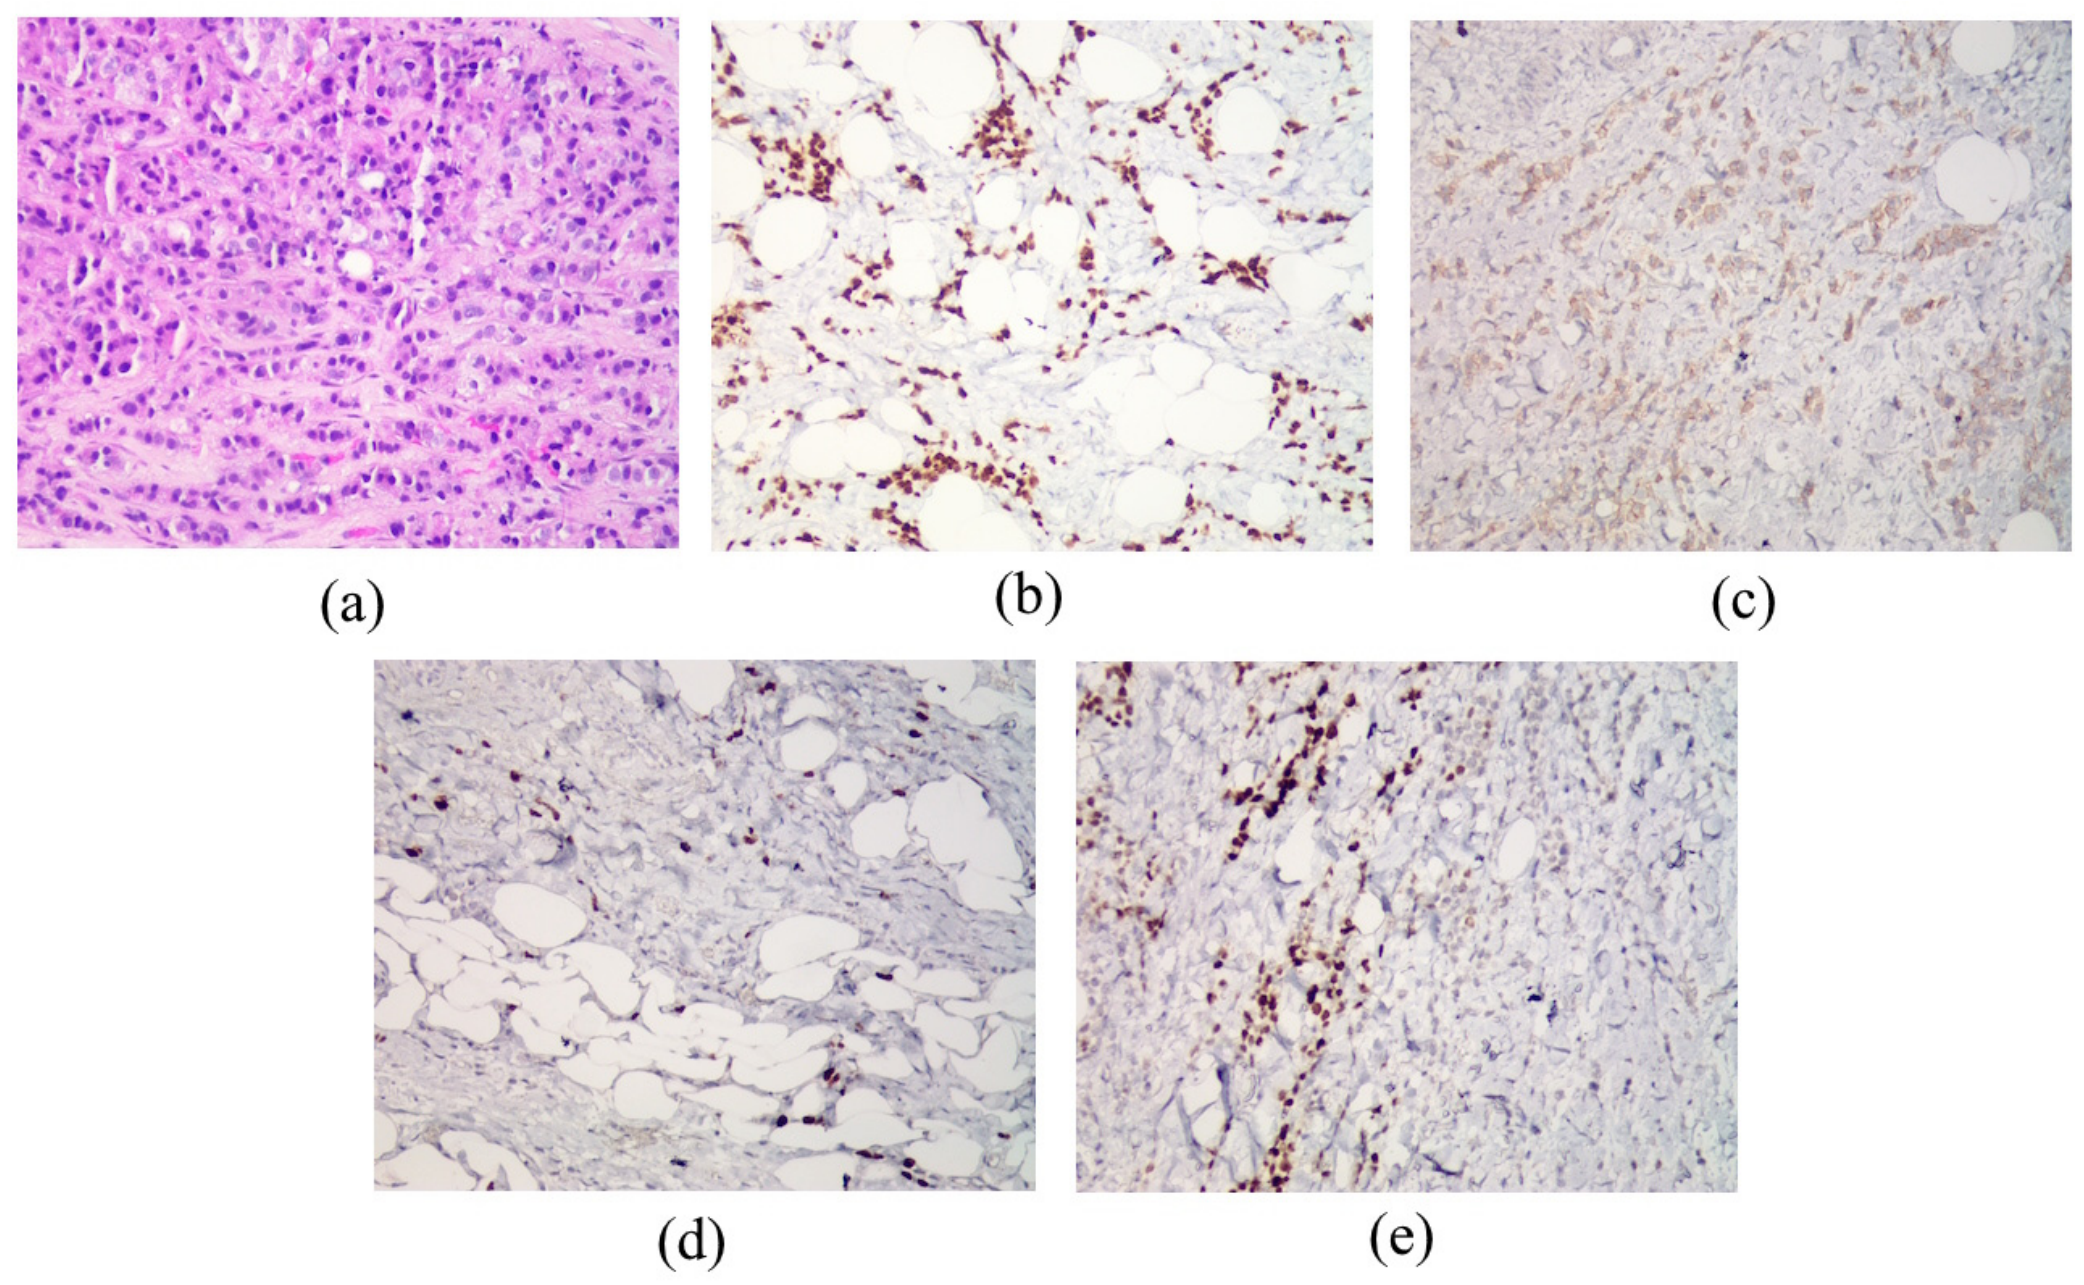
The image archive consists of 11 directories, one for each case, named according to the case numbers. The dataset includes images of individual fields of view with an image size of 4096 × 3286 pixels, together with corresponding masks. Examples of histological images are shown in Figure 1.
All images are provided in JPEG format and named according to the following convention: IDXXXX_TTTT_N.jpg, where XXXX is the case number, TTTT is the image type, and N is the image number. According to this convention, TTTT may take one of five values: H&E for histological images, and ER, HER2, KI67, or PR for immunohistochemical images of the corresponding biomarkers.
Table 1 shows the purpose of each image type specified in the metadata.

2.2. Clinical Data

The clinical level of the dataset contains depersonalized characteristics of the patient and the diagnostic case. These include gender, age, a formalized tumor profile, a structured diagnostic assessment derived from the pathomorphological report, digital images, and corresponding segmentation masks.
Each JSON record describes one diagnostic case generated on the basis of a pathomorphological report. The record stores the morphological and molecular characteristics of the tumor, the case-level assessment of ER, PR, HER2/neu, and Ki-67, and references to the associated H&E and IHC images and their segmentation masks. The main source of the diagnostic context is the pathomorphological conclusion.
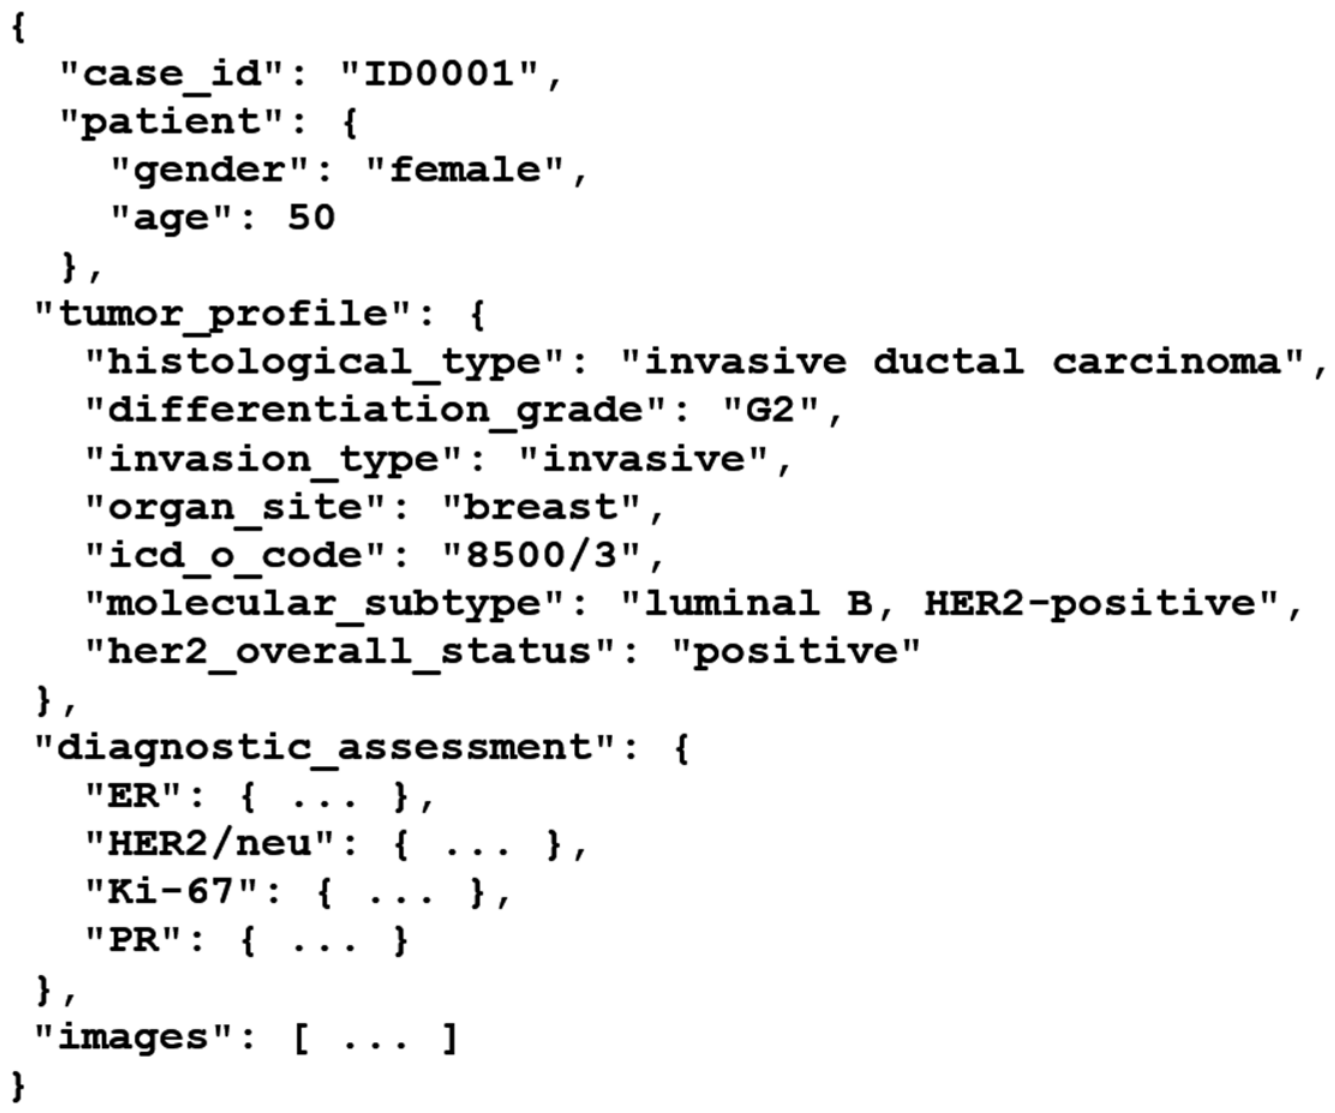
An example of the JSON structure for one record is provided on Figure 2.
The JSON record structure consists of a top-level dictionary and nested dictionaries describing the patient, tumor profile, diagnostic assessment, digital images, and segmentation masks. This organization separates case-level diagnostic information from the technical description of individual image files while preserving the links between all components of the diagnostic case.
The “case_id” field contains a unique identifier of the diagnostic case. It is used to name JSON file. It is used to link patient characteristics, tumor features, diagnostic assessment results, images, and masks within a single record.
The “patient” dictionary contains depersonalized patient characteristics, including gender and age.
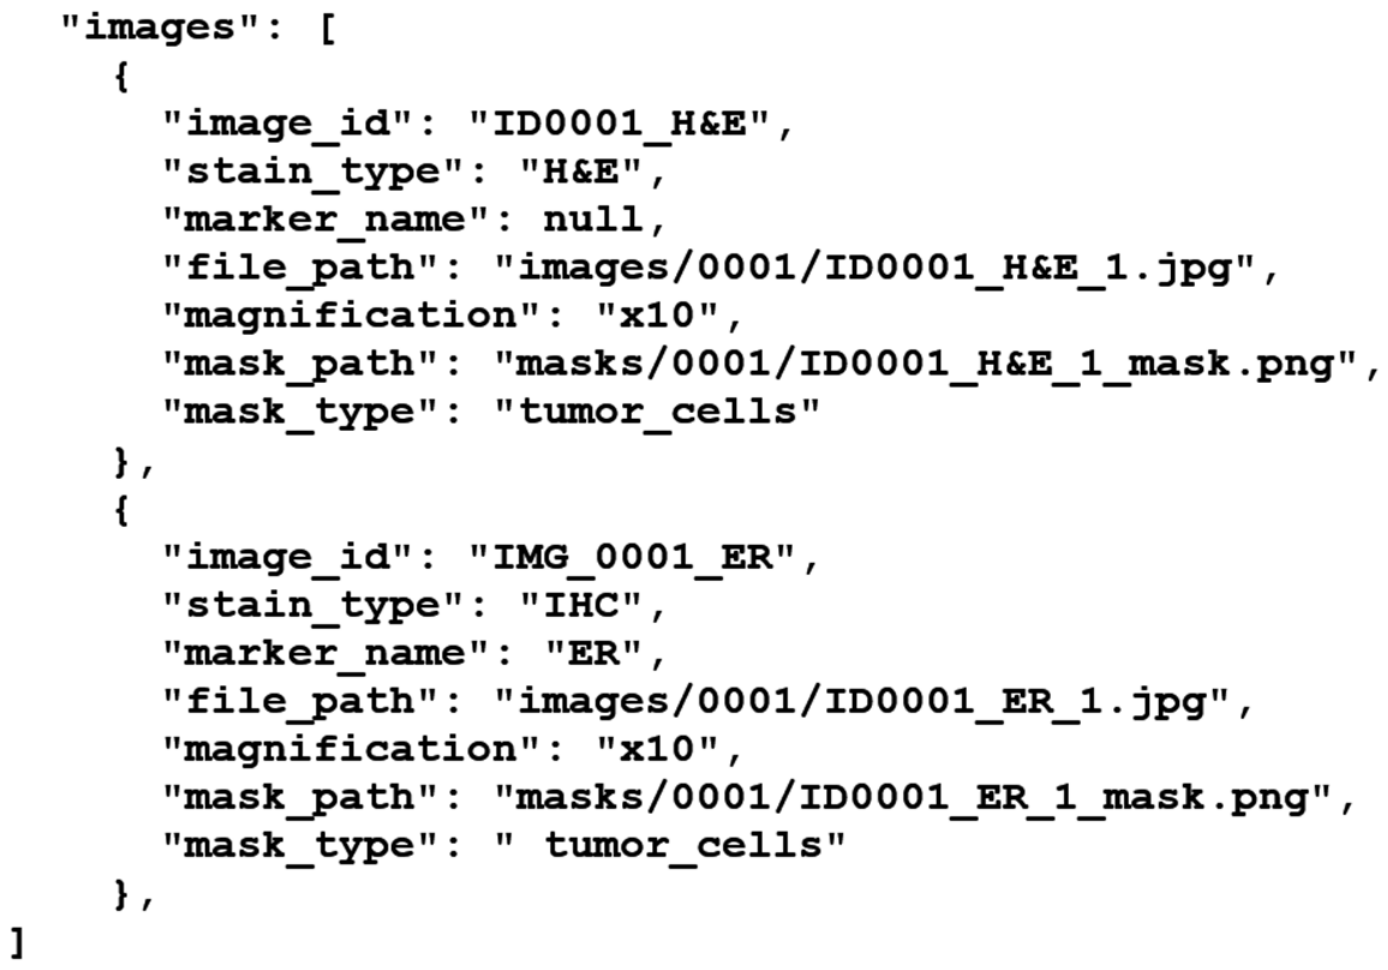
The “images” array shown in Figure 3 represents the relationship between the diagnostic case and the associated digital images and PNG segmentation masks. Only the H&E image and one IHC image are shown, using the ER marker as an example. The records for PR, HER2/neu, and Ki-67 use the same image-level structure. Marker assessment results characterize the diagnostic specimen as a whole.
The formalized tumor features reflect the main morphological, classification, and molecular characteristics of the tumor, including histological type, differentiation grade, invasion type, organ site, oncology classification code, molecular subtype, and overall HER2 status. In the data structure, these data are combined in the “tumor_profile” dictionary, which contains the fields “histological_type”, “differentiation_grade”, “invasion_type”, “organ_site”, “icd_o_code”, “molecular_subtype”, and “her2_overall_status”. These fields are used for grouping cases, statistical analysis, and matching formalized diagnostic characteristics with the corresponding images.
The her2_overall_status field provides a case-level summary of HER2 status for grouping cases and interpreting the molecular subtype. It is consistent with the final HER2/neu result in the marker-specific diagnostic assessment, where it is retained together with the detailed HER2 score, staining pattern, and percentage of stained tumor cells.
The immunohistochemical characteristics of the tumor are stored in the root-level “diagnostic_assessment” dictionary. This dictionary contains separate subdictionaries for ER, HER2/neu, Ki-67, and PR. The recorded values are derived from the assessment of the diagnostic specimen documented in the pathomorphological report (Table 2).
The structures of the marker-specific subdictionaries differ according to the corresponding assessment method. ER and PR are described using the percentage of positively stained tumor cells and the Allred scoring components. HER2/neu is described using the percentage of stained cells, membrane staining pattern, HER2 score, and final result. Ki-67 is described using the percentage of positively stained tumor cells, staining intensity, and final result. The molecular subtype of the tumor is determined on the basis of the combined ER, PR, HER2/neu, and Ki-67 findings.
The “images” array contains descriptions of the digital images associated with the diagnostic case. The “image_id” field contains the image identifier, “stain_type” indicates whether the image represents H&E or IHC staining, “marker_name” specifies the IHC biomarker where applicable, “file_path” contains the path to the digital image file, “magnification” specifies the acquisition magnification, “mask_path” contains the path to the corresponding PNG mask, and “mask_type” describes the annotation type.
The “mask_type” field describes the type of segmented object. In the context of this study of IHC images of breast cancer, these objects are tumor cell nuclei. The masks can be used for training and validating segmentation models, quantitative assessment of the area of positive staining, and cell counting.

3. Methods

3.1. Image Acquisition

The preparation of histological tissue sections was performed using standard laboratory: a Logos One closed vacuum tissue processor (Milestone, Sorisole, Italy), a KOS tissue processor (Milestone, Sorisole, Italy), an TEC 2800 paraffin embedding station (Amos Scientific Pty. Ltd., Melbourne, Australia), an AMR 400 rotary microtome (Amos Scientific Pty. Ltd., Melbourne, Australia), and a TEC 2500 module for flattening paraffin sections and drying slides (Amos Scientific Pty. Ltd., Melbourne, Australia). Images were acquired using a NIKON Eclipse Ci-E microscope (Nikon Corporation, Tokyo, Japan) and Sigeta M3CMOS 14.0 MP camera (SIGETA, Kyiv, Ukraine) at ×10 and ×20 magnification. A calibration slide with a division value of 0.01 mm was used to determine the image scale. The spatial resolution was 0.254 µm/pixel for images acquired at ×10 magnification and 0.127 µm/pixel for images acquired at ×20 magnification.
All histological slides were processed in accordance with the routine protocol. For the IHC study, antibodies against the following antigens were used:
  • Estrogen receptor α (DAKO, clone EP1);
  • Progesterone receptor (DAKO, clone PgR 636);
  • Oncoprotein c-erbB-2/neu (HER-2/neu) (DAKO, polyclonal);
  • Ki-67 (DAKO, clone MIB-1).
The dataset preserves the original colour characteristics of the archival images. The metadata include the manufacturer and antibody specification for each IHC biomarker. During dataset curation, a histologist visually reviewed the images for focus, staining quality, and major artifacts, and excluded images of inadequate quality.

3.2. Formation of the Clinical Data Level

The first stage in dataset formation is the creation of a depersonalized patient record and a diagnostic case record based on the pathomorphological report. At this level, only the demographic parameters necessary for analysis are stored, in particular gender and age group. Personal identifiers, such as name, address, date of birth, or other direct identifying data, are not included in the dataset structure.
The second stage is the extraction of information from the pathomorphological conclusion. The key structured features are extracted from it: histological type, differentiation grade, invasion type, ICD-O code, molecular subtype, and HER2 status [31].
The expression of ER and PR was evaluated using the semi-quantitative Allred scoring approach by the reporting pathologist as part of the routine diagnostic assessment. This method combines two components: the percentage of tumor cells showing positive nuclear staining, expressed as the proportion score (PS), and the strength of the staining reaction, expressed as the intensity score (IS). The PS was assigned on a scale from 0 to 5, whereas the IS was graded from 0 to 3. The final Allred total score (TS) was obtained by summing these two values, yielding a possible range from 0 to 8. Cases with a total score of 3 or higher were classified as showing positive receptor expression.
The molecular subtype of the tumor was determined from the immunohistochemical expression profiles of estrogen and progesterone receptors and HER2/neu, together with the Ki-67-based assessment of tumor cell proliferative activity. Based on these markers, tumors were grouped into four categories:
  • luminal A, defined by ER and/or PR positivity, HER2 negativity, and a low Ki-67 index;
  • luminal B, characterized by hormone receptor positivity with either HER2-negative or HER2-positive status and an elevated Ki-67 index;
  • non-luminal HER2-positive tumors, showing HER2/neu overexpression in the absence of ER and PR expression;
  • and triple-negative tumors, lacking ER, PR, and HER2/neu expression.
The pathomorphological conclusion undergoes additional expert verification by a second histologist. Diagnostically significant case attributes are checked, including cancer type, differentiation grade, IHC-defined tumor type, and the Allred score values for each corresponding immunohistochemical image.

3.3. Registration of Staining Types and IHC Markers

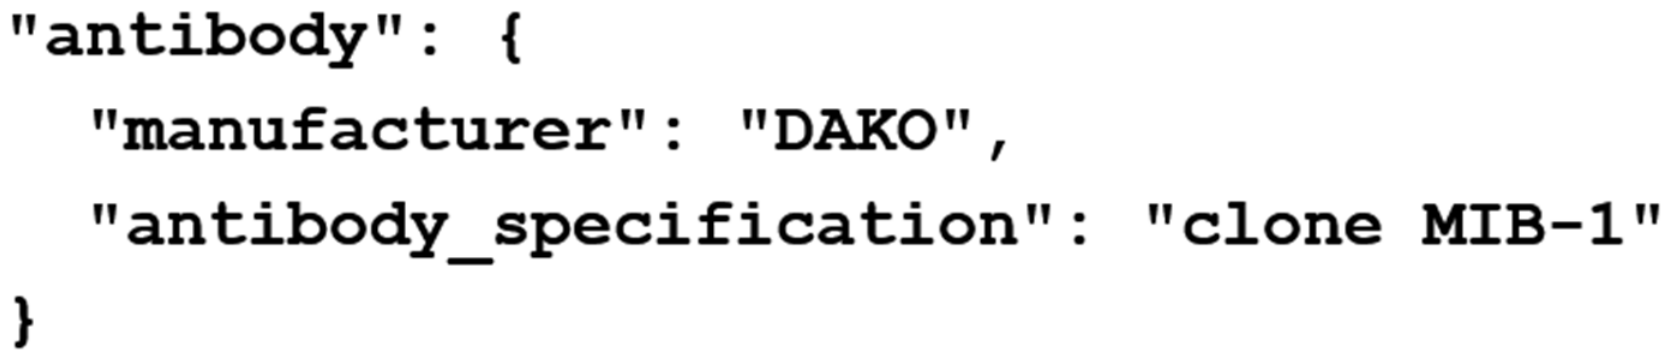
For each diagnostic case, the diagnostic assessment record specifies the image types and corresponding IHC markers. Assessment dictionary stores the evaluation data for the corresponding biomarker expression. It includes the percentage of positive cells and the Allred/Quick score values: allred_proportion_score, allred_intensity_score, and allred_total_score. In addition, assessment dictionary includes an antibody dictionary specifying the antibody manufacturer and its specification. For example, the clone or polyclonal type of the antibody is described as in Figure 4.
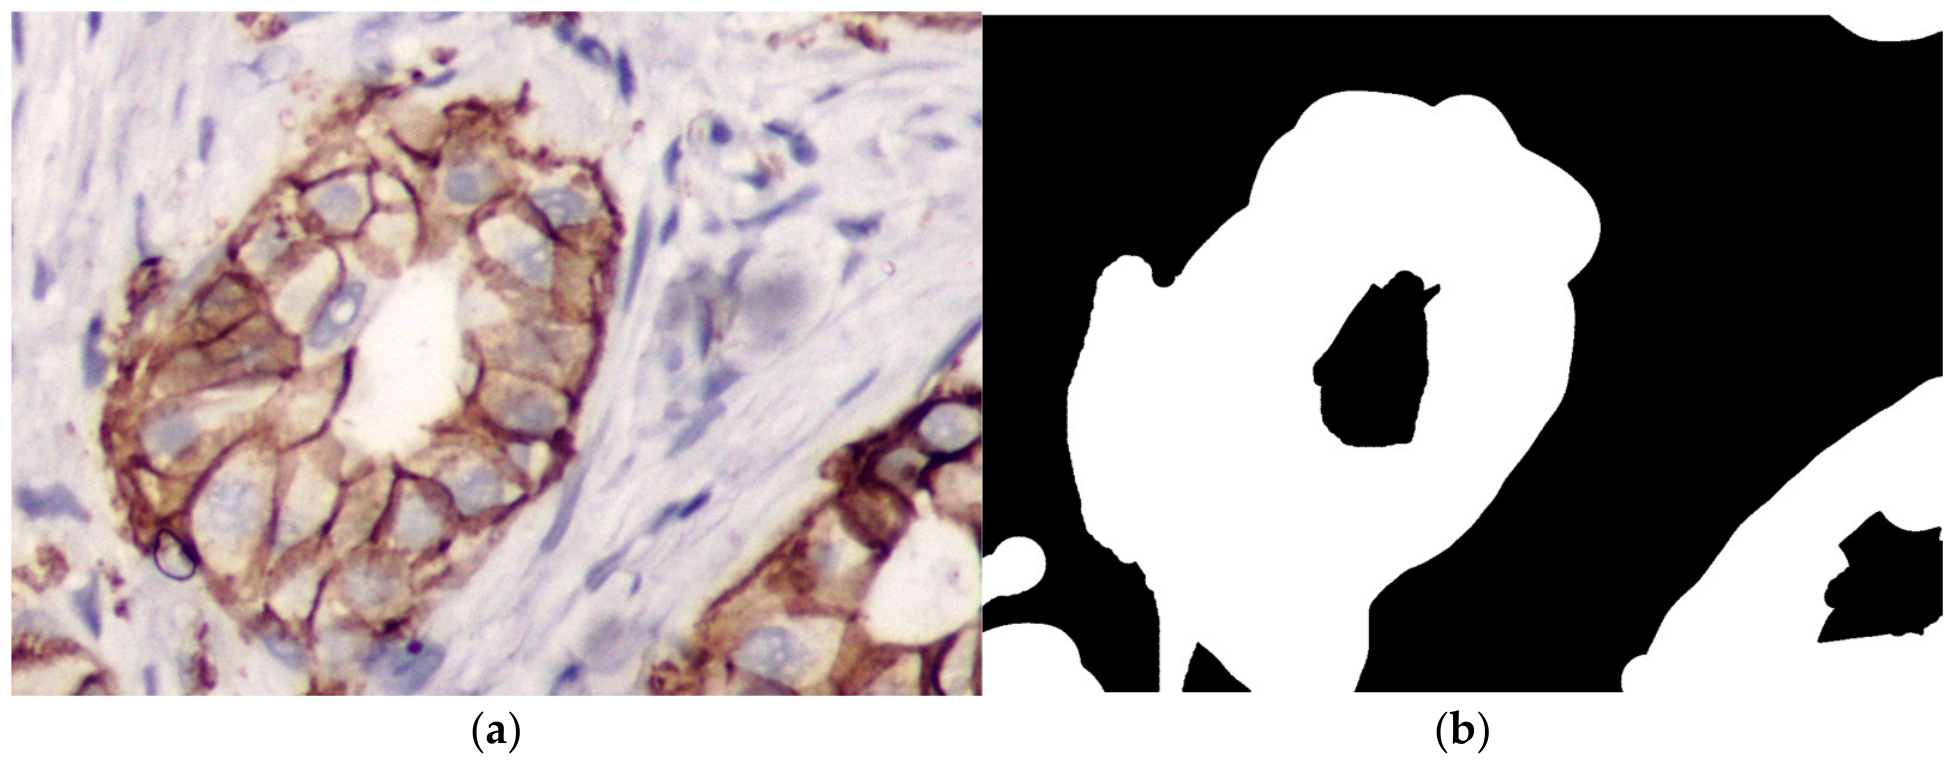
For H&E, ER, and PR images, the binary masks contain annotated tumor tissue regions that cover groups of nuclei of all tumor cells without distinction according to expression level. These masks are labeled as “tumor_cells”. Two annotation variants were used for HER2/neu and Ki-67 images. When all tumor cells were annotated regardless of their expression status, the mask was labeled as “tumor_cells”. When only tumor cells showing positive expression of the corresponding marker were annotated, the mask was labeled as “only_positive_tumor_cells”. For HER2/neu, positivity was determined by brown membrane staining, whereas for Ki-67, it was determined by brown nuclear staining. This approach allows the masks to be used both for segmentation of the entire tumor tissue and for separate analysis of positively stained tumor cells.

3.4. Addition of Digital Images and Masks

For each image, the dataset structure stores the file path, magnification, image role, and annotation type. Each diagnostic case includes one H&E field-of-view image and four IHC images corresponding to the respective biomarkers. A separate binary mask in PNG format was created for each image, as illustrated in Figure 5. The masks contain tumor cell regions annotated by an expert.
The inclusion of masks in the dataset structure enables the training of segmentation models, evaluation of automatic tumor region delineation, quantitative analysis of positive staining, and comparison of the results produced by different algorithms.
The developed dataset contains 11 breast cancer cases. According to histological type, invasive carcinoma of no special type was represented in 5 cases, accounting for 45.5% of the dataset. Invasive ductal carcinoma was also diagnosed in 5 cases, corresponding to 45.5%. One case, or 9.1%, was classified as metastatic invasive ductal carcinoma.
The distribution of cases according to tumor differentiation grade was relatively balanced. Grade G2 was identified in 6 cases, accounting for 54.5%, whereas grade G3 was identified in 5 cases, or 45.5%.
The ICD-O morphology code 8500/3 was assigned to 10 cases, representing 90.9% of the dataset. The ICD-O code 8522/3 was assigned to one case, accounting for 9.1%. The distribution of cases according to molecular subtype is presented in Table 3. The most frequently represented categories were the luminal A, HER2-negative subtype and the luminal B, HER2-negative subtype.

3.5. Dataset Limitations

Several limitations should be considered when using the dataset. First, the dataset comprises 11 diagnostic cases of breast cancer. All materials obtained from a single medical institution. Therefore, the presented sample does not fully reflect potential inter-center variability associated with differences in histological specimen preparation.
The dataset contains selected microscopic fields of view rather than complete digital images of histological slides. Consequently, it may not capture the full extent of intratumoral morphological and immunohistochemical heterogeneity within each diagnostic case. This limitation should be considered when constructing training, validation, and test subsets. Training, validation, and test subsets should be split at the patient/case level rather than the image level to prevent information leakage between subsets.
The binary masks represent annotated regions of tumor tissue or groups of tumor cells and do not always correspond to the contours of individual cells or nuclei. Therefore, the dataset is primarily intended for semantic segmentation rather than for the direct training of instance segmentation models or the precise counting of individual cells. Because the annotations were created manually, minor variations in region boundaries may occur, particularly for indistinct, partially overlapping, out-of-focus, or heterogeneously stained cells.
The semantics of the masks depend on the staining type and biomarker. For H&E, ER, and PR images, the masks cover groups of all identified tumor cells regardless of staining intensity or expression status. For HER2/neu and Ki-67 images, the masks may represent either all tumor cells or only tumor cells showing positive expression of the corresponding marker. Therefore, before combining images into a common training set, users should consider the annotation type and the corresponding labels provided in the metadata.
The ER, PR, HER2/neu, and Ki-67 assessment results reported in the metadata characterize the diagnostic specimen as a whole. They should not be automatically interpreted as local quantitative characteristics of each individual microscopic image. In particular, the percentage of positively stained cells or the overall biomarker assessment result may differ from its local manifestation within a specific field of view.
These limitations do not reduce the value of the dataset for the development, testing, and preliminary comparison of computer vision methods, the analysis of histological and immunohistochemical images, and the semantic segmentation of tumor tissue.

Author Contributions

Conceptualization, O.B. and P.S.; methodology, O.B. and P.S.; software, G.M. and O.P.; validation, A.S.; investigation, A.S.; resources, P.S.; data curation, A.S. and G.M.; writing—original draft preparation, G.M.; writing—review and editing, O.B.; supervision, O.B. and P.S. All authors have read and agreed to the published version of the manuscript.

Funding

This research received no external funding.

Institutional Review Board Statement

The work was conducted in accordance with the Declaration of Helsinki and approved by the Bioethics Commission of I. Horbachevsky Ternopil National Medical University of the Ministry of Health of Ukraine (protocol 85 from 1 April 2026).

Informed Consent Statement

Informed consent was obtained from all subjects involved in the study.

Data Availability Statement

The dataset described in this article is openly available in Zenodo at https://doi.org/10.5281/zenodo.21487211. The repository record includes de-identified histological and immunohistochemical images, corresponding binary annotation masks, structured case-level metadata. The manuscript is published under the CC BY license, whereas the underlying dataset is separately licensed under the CC BY-NC 4.0 license.

Conflicts of Interest

The authors declare no conflicts of interest.

Abbreviations

The following abbreviations are used in this manuscript:
H&EHematoxylin and Eosin
EREstrogen Receptor
HER2Human Epidermal growth factor Receptor 2/neuroblastoma
PRProgesterone Receptor

References

  1. Breast Cancer. Available online: https://www.who.int/news-room/fact-sheets/detail/breast-cancer (accessed on 10 May 2026).
  2. Bray, F.; Laversanne, M.; Sung, H.; Ferlay, J.; Siegel, R.L.; Soerjomataram, I.; Jemal, A. Global Cancer Statistics 2022: GLOBOCAN Estimates of Incidence and Mortality Worldwide for 36 Cancers in 185 Countries. CA A Cancer J. Clin. 2024, 74, 229–263. [Google Scholar] [CrossRef] [Scilit] [PubMed]
  3. Tan, P.H.; Ellis, I.; Allison, K.; Brogi, E.; Fox, S.B.; Lakhani, S.; Lazar, A.J.; Morris, E.A.; Sahin, A.; Salgado, R.; et al. The 2019 World Health Organization Classification of Tumours of the Breast. Histopathology 2020, 77, 181–185. [Google Scholar] [CrossRef] [Scilit] [PubMed]
  4. Amin, M.B.; Greene, F.L.; Edge, S.B.; Compton, C.C.; Gershenwald, J.E.; Brookland, R.K.; Meyer, L.; Gress, D.M.; Byrd, D.R.; Winchester, D.P. The Eighth Edition AJCC Cancer Staging Manual: Continuing to Build a Bridge from a Population-Based to a More “Personalized” Approach to Cancer Staging. CA A Cancer J. Clin. 2017, 67, 93–99. [Google Scholar] [CrossRef] [Scilit] [PubMed]
  5. Allison, K.H.; Hammond, M.E.H.; Dowsett, M.; McKernin, S.E.; Carey, L.A.; Fitzgibbons, P.L.; Hayes, D.F.; Lakhani, S.R.; Chavez-MacGregor, M.; Perlmutter, J.; et al. Estrogen and Progesterone Receptor Testing in Breast Cancer: American Society of Clinical Oncology/College of American Pathologists Guideline Update. Arch. Pathol. Lab. Med. 2020, 144, 545–563. [Google Scholar] [CrossRef] [Scilit] [PubMed]
  6. Wolff, A.C.; Somerfield, M.R.; Dowsett, M.; Hammond, M.E.H.; Hayes, D.F.; McShane, L.M.; Saphner, T.J.; Spears, P.A.; Allison, K.H. Human Epidermal Growth Factor Receptor 2 Testing in Breast Cancer: ASCO-College of American Pathologists Guideline Update. J. Clin. Oncol. 2023, 41, 3867–3872. [Google Scholar] [CrossRef] [Scilit] [PubMed]
  7. Nielsen, T.O.; Leung, S.C.Y.; Rimm, D.L.; Dodson, A.; Acs, B.; Badve, S.; Denkert, C.; Ellis, M.J.; Fineberg, S.; Flowers, M.; et al. Assessment of Ki67 in Breast Cancer: Updated Recommendations From the International Ki67 in Breast Cancer Working Group. J. Natl. Cancer Inst. 2020, 113, 808–819. [Google Scholar] [CrossRef] [Scilit] [PubMed]
  8. Allison, K.H.; Hammond, M.E.H.; Dowsett, M.; McKernin, S.E.; Carey, L.A.; Fitzgibbons, P.L.; Hayes, D.F.; Lakhani, S.R.; Chavez-MacGregor, M.; Perlmutter, J.; et al. Estrogen and Progesterone Receptor Testing in Breast Cancer: ASCO/CAP Guideline Update. J. Clin. Oncol. 2020, 38, 1346–1366. [Google Scholar] [CrossRef] [Scilit] [PubMed]
  9. Bankhead, P.; Loughrey, M.B.; Fernández, J.A.; Dombrowski, Y.; McArt, D.G.; Dunne, P.D.; McQuaid, S.; Gray, R.T.; Murray, L.J.; Coleman, H.G.; et al. QuPath: Open Source Software for Digital Pathology Image Analysis. Sci. Rep. 2017, 7, 16878. [Google Scholar] [CrossRef] [Scilit] [PubMed]
  10. Schmidt, U.; Weigert, M.; Broaddus, C.; Myers, G. Cell Detection with Star-Convex Polygons. In Medical Image Computing and Computer Assisted Intervention—MICCAI 2018; Frangi, A.F., Schnabel, J.A., Davatzikos, C., Alberola-López, C., Fichtinger, G., Eds.; Lecture Notes in Computer Science; Springer International Publishing: Cham, Switzerland, 2018; Volume 11071, pp. 265–273. ISBN 978-3-030-00933-5. [Google Scholar]
  11. Bulten, W.; Kartasalo, K.; Chen, P.-H.C.; Ström, P.; Pinckaers, H.; Nagpal, K.; Cai, Y.; Steiner, D.F.; van Boven, H.; Vink, R.; et al. Artificial Intelligence for Diagnosis and Gleason Grading of Prostate Cancer: The PANDA Challenge. Nat. Med. 2022, 28, 154–163. [Google Scholar] [CrossRef] [Scilit] [PubMed]
  12. Shamai, G.; Binenbaum, Y.; Slossberg, R.; Duek, I.; Gil, Z.; Kimmel, R. Artificial Intelligence Algorithms to Assess Hormonal Status From Tissue Microarrays in Patients With Breast Cancer. JAMA Netw. Open 2019, 2, e197700. [Google Scholar] [CrossRef] [Scilit] [PubMed]
  13. Che, Y.; Ren, F.; Zhang, X.; Cui, L.; Wu, H.; Zhao, Z. Immunohistochemical HER2 Recognition and Analysis of Breast Cancer Based on Deep Learning. Diagnostics 2023, 13, 263. [Google Scholar] [CrossRef] [Scilit] [PubMed]
  14. Ahmad Fauzi, M.F.; Wan Ahmad, W.S.H.M.; Jamaluddin, M.F.; Lee, J.T.H.; Khor, S.Y.; Looi, L.M.; Abas, F.S.; Aldahoul, N. Allred Scoring of ER-IHC Stained Whole-Slide Images for Hormone Receptor Status in Breast Carcinoma. Diagnostics 2022, 12, 3093. [Google Scholar] [CrossRef] [Scilit] [PubMed]
  15. Aresta, G.; Araújo, T.; Kwok, S.; Chennamsetty, S.S.; Safwan, M.; Alex, V.; Marami, B.; Prastawa, M.; Chan, M.; Donovan, M.; et al. BACH: Grand Challenge on Breast Cancer Histology Images. Med. Image Anal. 2019, 56, 122–139. [Google Scholar] [CrossRef] [Scilit] [PubMed]
  16. Spanhol, F.A.; Oliveira, L.S.; Petitjean, C.; Heutte, L. A Dataset for Breast Cancer Histopathological Image Classification. IEEE Trans. Biomed. Eng. 2016, 63, 1455–1462. [Google Scholar] [CrossRef] [Scilit] [PubMed]
  17. Litjens, G.; Bandi, P.; Ehteshami Bejnordi, B.; Geessink, O.; Balkenhol, M.; Bult, P.; Halilovic, A.; Hermsen, M.; van de Loo, R.; Vogels, R.; et al. 1399 H&E-Stained Sentinel Lymph Node Sections of Breast Cancer Patients: The CAMELYON Dataset. Gigascience 2018, 7, giy065. [Google Scholar] [CrossRef] [Scilit] [PubMed]
  18. Amgad, M.; Elfandy, H.; Hussein, H.; Atteya, L.A.; Elsebaie, M.A.T.; Abo Elnasr, L.S.; Sakr, R.A.; Salem, H.S.E.; Ismail, A.F.; Saad, A.M.; et al. Structured Crowdsourcing Enables Convolutional Segmentation of Histology Images. Bioinformatics 2019, 35, 3461–3467. [Google Scholar] [CrossRef] [Scilit] [PubMed]
  19. Komura, D.; Ishikawa, S. Machine Learning Methods for Histopathological Image Analysis. Comput. Struct. Biotechnol. J. 2018, 16, 34–42. [Google Scholar] [CrossRef] [Scilit] [PubMed]
  20. Dimitriou, N.; Arandjelović, O.; Caie, P.D. Deep Learning for Whole Slide Image Analysis: An Overview. Front. Med. 2019, 6, 264. [Google Scholar] [CrossRef] [Scilit] [PubMed]
  21. Weitz, P.; Valkonen, M.; Solorzano, L.; Carr, C.; Kartasalo, K.; Boissin, C.; Koivukoski, S.; Kuusela, A.; Rasic, D.; Feng, Y.; et al. A Multi-Stain Breast Cancer Histological Whole-Slide-Image Data Set from Routine Diagnostics. Sci. Data 2023, 10, 562. [Google Scholar] [CrossRef] [Scilit] [PubMed]
  22. Wölflein, G.; Um, I.H.; Harrison, D.J.; Arandjelović, O. Whole-Slide Images and Patches of Clear Cell Renal Cell Carcinoma Tissue Sections Counterstained with Hoechst 33342, CD3, and CD8 Using Multiple Immunofluorescence. Data 2023, 8, 40. [Google Scholar] [CrossRef] [Scilit]
  23. Berezsky, O.; Liashchynskyi, P.; Melnyk, G.; Dombrovskyi, M.; Berezkyi, M. Synthesis of Biomedical Images Based on Generative Intelligence Tools. In Proceedings of the 7th International Conference on Informatics & Data-Driven Medicine (IDDM 2024), Birmingham, UK, 14–16 November 2024; CEUR Workshop Proceedings. Volume 3892, pp. 349–362. Available online: http://ceur-ws.org/Vol-3892/paper23.pdf (accessed on 20 July 2026).
  24. Berezsky, O.; Melnyk, G.; Liashchynskyi, P.; Pitsun, O. Biomedical Image Datasets. In Lecture Notes in Data Engineering, Computational Intelligence, and Decision-Making, Volume 2; Babichev, S., Lytvynenko, V., Eds.; Lecture Notes on Data Engineering and Communications Technologies; Springer: Cham, Switzerland, 2025; Volume 244, pp. 61–82. [Google Scholar] [CrossRef] [Scilit]
  25. Berezsky, O.; Pitsun, O.; Liashchynskyi, P.; Derysh, B.; Batryn, N. Computational Intelligence in Medicine. In Lecture Notes in Data Engineering, Computational Intelligence, and Decision Making; Babichev, S., Lytvynenko, V., Eds.; Lecture Notes on Data Engineering and Communications Technologies; Springer: Cham, Switzerland, 2023; Volume 149. [Google Scholar] [CrossRef] [Scilit]
  26. Berezsky, O.; Pitsun, O.; Melnyk, G.; Datsko, T.; Izonin, I.; Derysh, B. An Approach toward Automatic Specifics Diagnosis of Breast Cancer Based on an Immunohistochemical Image. J. Imaging 2023, 9, 12. [Google Scholar] [CrossRef] [Scilit] [PubMed]
  27. Berezsky, O.; Pitsun, O.; Melnyk, G.; Koval, V.; Batko, Y. Multi-threaded Parallelization of Automatic Immunohistochemical Image Segmentation. In Advances in Intelligent Systems, Computer Science and Digital Economics IV; Hu, Z., Wang, Y., He, M., Eds.; Lecture Notes on Data Engineering and Communications Technologies; Springer: Cham, Switzerland, 2023; Volume 158, pp. 266–275. [Google Scholar] [CrossRef] [Scilit]
  28. Berezsky, O.; Pitsun, O.; Derysh, B.; Datsko, T.; Berezka, K.; Savka, N. Automatic Segmentation of Immunohistochemical Images Based on U-NET Architectures. In Proceedings of the 4th International Conference on Informatics & Data-Driven Medicine (IDDM 2021), Valencia, Spain, 19–21 November 2021; CEUR Workshop Proceedings. pp. 22–33. Available online: http://ceur-ws.org/Vol-3038/paper3.pdf (accessed on 20 July 2026).
  29. Berezsky, O.; Liashchynskyi, P.; Liashchynskyi, P.; Selskyy, P. Devising a Comprehensive Approach to Diagnosing Breast Cancer Subtypes Automatically Based on Deep Neural Networks. East.-Eur. J. Enterp. Technol. 2025, 6, 15–25. [Google Scholar] [CrossRef] [Scilit]
  30. Berezsky, O.; Melnyk, G.; Selskyy, P.; Slyva, A. Breast Cancer Histology and Immunohistochemistry Image Dataset 2026. Available online: https://zenodo.org/records/21487212 (accessed on 22 July 2026).
  31. Wolff, A.C.; Hammond, M.E.H.; Hicks, D.G.; Dowsett, M.; McShane, L.M.; Allison, K.H.; Allred, D.C.; Bartlett, J.M.S.; Bilous, M.; Fitzgibbons, P.; et al. Recommendations for Human Epidermal Growth Factor Receptor 2 Testing in Breast Cancer: American Society of Clinical Oncology/College of American Pathologists Clinical Practice Guideline Update. Arch. Pathol. Lab. Med. 2014, 138, 241–256. [Google Scholar] [CrossRef] [Scilit] [PubMed]
Figure 1. Examples of dataset images: (a) H&E image; (b) ER image; (c) HER2/neu image; (d) KI67 image; (e) PR image.
Data 11 00214 g001
Figure 2. General structure of a JSON metadata record.
Data 11 00214 g002
Figure 3. Images characteristics.
Data 11 00214 g003
Figure 4. Antibody description.
Data 11 00214 g004
Figure 5. Example of IHC image with the HER2/neu biomarker: (a) image; (b) mask.
Data 11 00214 g005
Table 1. Dataset image types.
PurposeDescription
H&EHematoxylin and Eosin histological image
H&E masksegmentation mask of tumor cells
ERimmunohistochemical image of estrogen receptor expression
ER, masksegmentation mask of tumor cells
HER2immunohistochemical image of HER2/neu expression
HER2, masksegmentation mask of tumor cells
KI67immunohistochemical image of KI67 expression
KI67 masksegmentation mask of tumor cells
PRimmunohistochemical image of progesterone receptor expression
PR masksegmentation mask of tumor cells
Table 2. Structure of the “diagnostic_assessment” dictionary.
FieldDescription
ERSubdictionary containing the diagnostic assessment of estrogen receptor expression.
ER.antibodyDictionary describing the antibody used for ER staining.
ER.antibody.manufacturerManufacturer of the antibody.
ER.antibody.antibody_specificationAntibody clone or other specification.
ER.positive_cell_percentagePercentage of tumor cells showing positive nuclear staining for ER.
ER.allred_proportion_scoreAllred proportion score.
ER.allred_intensity_scoreAllred staining intensity score.
ER.allred_total_scoreSum of the Allred proportion and intensity scores.
ER.resultFinal categorical interpretation, such as “positive” or “negative”.
HER2/neuSubdictionary containing the diagnostic assessment of HER2/neu expression.
HER2/neu.antibodyDictionary describing the antibody used for HER2/neu staining.
HER2/neu.positive_cell_percentagePercentage of tumor cells showing the reported membrane staining pattern.
HER2/neu.staining_patternDescription of the membrane staining pattern.
HER2/neu.her2_scoreHER2 score represented as an integer from 0 to 3.
HER2/neu.resultFinal categorical interpretation, such as “positive”, “negative”.
Ki-67Subdictionary containing the assessment of Ki-67 proliferative activity.
Ki-67.antibodyDictionary describing the antibody used for Ki-67 staining.
Ki-67.positive_cell_percentagePercentage of tumor cells showing positive nuclear staining; this value represents the Ki-67 proliferation index.
Ki-67.staining_intensityTextual description of staining intensity.
Ki-67.resultFinal categorical interpretation of the marker assessment.
PRSubdictionary containing the diagnostic assessment of progesterone receptor expression.
PR.antibodyDictionary describing the antibody used for PR staining.
PR.antibody.manufacturerManufacturer of the antibody.
PR.antibody.antibody_specificationAntibody clone or other specification.
PR.positive_cell_percentagePercentage of tumor cells showing positive nuclear staining for PR.
PR.allred_proportion_scoreAllred proportion score.
PR.allred_intensity_scoreAllred staining intensity score.
PR.allred_total_scoreSum of the Allred proportion and intensity scores.
PR.resultFinal categorical interpretation, such as “positive” or “negative”.
Table 3. Distribution of diagnostic cases according to molecular subtype.
Molecular SubtypeNumber of Cases, n
Luminal A, HER2-negative3
Luminal B, HER2-negative3
Luminal B, HER2-positive2
Triple-negative2
Non-luminal, HER2-positive1
Total11
Disclaimer/Publisher’s Note: The statements, opinions and data contained in all publications are solely those of the individual author(s) and contributor(s) and not of MDPI and/or the editor(s). MDPI and/or the editor(s) disclaim responsibility for any injury to people or property resulting from any ideas, methods, instructions or products referred to in the content.