1. Introduction
The increasing global prevalence of childhood and adolescent obesity represents one of the most critical public health challenges of the 21st century [
1]. Excess adiposity during adolescence is strongly associated with the early onset of cardiometabolic alterations, including insulin resistance, dyslipidemia, and elevated blood pressure [
2]. Beyond body mass index (BMI), central adiposity indicators such as the waist-to-height ratio (WHtR) have emerged as sensitive predictors of cardiometabolic risk in pediatric populations [
3,
4]. Despite extensive public health efforts, the early identification of adolescents at increased metabolic risk remains a major challenge, highlighting the need for more integrative and sensitive screening approaches [
5,
6].
Parallel to the rise in obesity, a consistent global decline in health-related physical fitness among adolescents has been widely documented [
7,
8]. Cardiorespiratory fitness and muscular strength are now recognized as strong and independent determinants of cardiometabolic health [
9,
10]. Increasing evidence suggests that higher levels of muscular power and aerobic capacity can attenuate the adverse metabolic effects associated with excess adiposity [
10,
11]. In particular, both upper- and lower-body strength have shown inverse associations with clustered metabolic risk in youth [
12]. Nevertheless, these components are frequently evaluated in isolation within epidemiological surveillance systems.
This fragmented approach limits the ability to capture the complex and interactive physiological relationships between adiposity and physical fitness. Current surveillance frameworks often fail to account for the synergistic effects between these domains, potentially underestimating their combined influence on cardiometabolic risk [
13]. Although the “fat but fit” paradigm has highlighted the protective role of physical fitness, it also underscores the need for integrative indicators that reflect the balance between adiposity and fitness [
14]. Previous efforts to construct composite metabolic scores have typically relied on invasive or clinically intensive measurements, limiting their feasibility in large-scale, field-based settings such as schools [
15].
In this context, the development of non-invasive, scalable, and data-driven composite indicators represents a critical step toward improving population-level screening strategies. The increasing availability of large-scale, standardized datasets enables the application of computational approaches capable of integrating multidimensional physiological information into unified and interpretable metrics [
16]. In Chile, the rapid epidemiological and nutritional transition has led to a substantial increase in pediatric obesity and sedentary behaviors, reinforcing the need for robust surveillance systems [
17]. The National Physical Fitness Assessment System (SIMCE-EF) provides a unique opportunity to leverage nationally representative data to explore novel integrative approaches to metabolic risk assessment [
18].
Despite these advances, there remains a lack of composite, field-applicable biomarkers capable of simultaneously capturing adiposity and physical fitness within a unified analytical framework. Addressing this limitation may improve the identification of at-risk populations and enhance the interpretation of large-scale health data.
Therefore, the aim of this study was to develop and analytically evaluate a composite adiposity–fitness imbalance index (AFI) derived from large-scale population data and to quantify its association with cardiometabolic risk and sociodemographic determinants in a nationally representative cohort of Chilean adolescents.
2. Materials and Methods
2.1. Study Design and Setting
This study employed an observational cross-sectional design [
19] to analyze data from the Chilean National Physical Fitness Assessment System (SIMCE-EF), a nationwide surveillance program from the Ministry of Education that monitors physical fitness and health indicators in adolescents. Assessments were conducted within educational establishments using standardized protocols and trained evaluators to ensure uniform measurement procedures across regions. The program employs a nationally representative, stratified sampling strategy covering students enrolled in the 8th grade of primary education. The study adhered to the principles of the Declaration of Helsinki. Written informed consent was obtained from parents or legal guardians, and assent was obtained from all participants. The protocol was approved by the Bioethics and Biosafety Committee of the Pontificia Universidad Católica de Valparaíso (approval code BIOPUCV-H516 2022).
2.2. Participants
The analytical sample for this study consisted of a total of 7852 students assessed as part of the SIMCE-EF, who constitute the full cohort of participants for this analysis, including anthropometric measurements and the five physical fitness tests. This sample (n = 7852) retained the demographic strata of sex, age, school administrative affiliation, and rural/urban residence specified by the original SIMCE-EF sampling design.
2.3. Anthropometric and Cardiometabolic Measures
Anthropometric assessments were conducted by trained personnel following standardized procedures. Body weight was measured to the nearest 0.1 kg using a calibrated digital scale, with participants barefoot and wearing light clothing. Height was measured to the nearest 0.1 cm using a stadiometer with participants standing upright in the Frankfurt plane. Waist circumference was measured at the midpoint between the lower rib margin and the iliac crest using a non-elastic measuring tape.
Body mass index (BMI) was calculated as weight divided by height squared (kg/m
2). Waist-to-height ratio (WHtR) was calculated as waist circumference divided by height and was used as an indicator of central adiposity. Elevated cardiometabolic risk was defined as a WHtR > 0.50 [
20].
2.4. Physical Fitness Assessment
Physical fitness was evaluated using standardized field-based tests included in the SIMCE-EF battery, following national protocols and administered by trained evaluators to ensure consistency across testing sites.
Specifically, abdominal muscular endurance was assessed using a one-minute sit-up test. Participants performed repeated trunk flexions following a standardized auditory rhythm, and the total number of correctly executed repetitions was recorded. In addition, cardiorespiratory fitness was estimated using the 20 m shuttle run test (Navette test), in which participants ran back and forth between two parallel lines separated by 20 m at progressively increasing speeds dictated by audio signals. The test ended when the participant failed to reach the line on two consecutive occasions. Performance in this test was subsequently used to estimate maximal oxygen uptake (VO2max) according to standardized equations included in the SIMCE-EF protocol, which are commonly used to estimate aerobic capacity in school-based populations.
Similarly, lower-limb explosive strength was evaluated using the standing long jump, where participants performed a maximal horizontal jump from a standing position with both feet together, and the best distance achieved was recorded. Furthermore, upper-limb muscular endurance was assessed using a 30 s push-up test, in which participants performed as many repetitions as possible within the time limit. Finally, flexibility was assessed using the sit-and-reach test, which measured the maximal forward reach distance in a seated position with the legs extended. Overall, for all tests, the best or total performance was recorded according to national protocol guidelines, ensuring comparability across participants.
2.5. Sociodemographic Variables
Sociodemographic characteristics included sex, age, school location (urban or rural), and school administrative dependency. Educational establishments were categorized as public (municipal), subsidized private, delegated administration, or private paid institutions, reflecting differences in funding and governance structures within the Chilean educational system. Socioeconomic status (SES) was operationalized using the official SIMCE-EF classification of school administrative dependency. SES therefore represents a school-level proxy of household socioeconomic position rather than an individual-level measurement, since household income, parental education, and material-resources data were not available in the SIMCE-EF dataset; this should be considered when interpreting SES-related estimates.
2.6. Adiposity–Fitness Imbalance (AFI) Index
To integrate multidimensional information on adiposity and fitness into a unified metabolic indicator, a composite biomarker termed the AFI index (Adiposity–Fitness Imbalance) was constructed.
Given that the variables were expressed in different units, all components were standardized using Z-scores. Z-scores were calculated by subtracting the sample mean from each individual value and dividing the result by the corresponding standard deviation, allowing all variables to be expressed on a common scale. In the primary analyses, z-scores were calculated globally over the full analytic sample. Because adiposity and fitness components vary by sex and age, a sensitivity analysis was also performed using sex- and age-specific z-scores; results were materially unchanged (see
Section 3). The pillar of adiposity (Z
adip) was calculated as the means of standardized BMI, waist circumference, and WHtR. A fitness pillar (Z
fit) was calculated as the mean of standardized cardiorespiratory fitness, strength, flexibility, and muscular endurance measures.
The AFI index was defined as:
Higher AFI values indicate greater adiposity relative to fitness and represent a less favorable metabolic profile, whereas negative values indicate better fitness relative to adiposity. The AFI index was used as a continuous predictor in subsequent regression analyses. Because the elevated-WHtR outcome shares one component with the adiposity pillar, a pre-specified sensitivity version of the index was also computed, in which WHtR was removed from the adiposity pillar, leaving the adiposity pillar as the mean of standardized BMI and waist circumference only. This component–outcome–independent version of the AFI was used in the sensitivity analyses described below.
2.7. Statistical Analysis
Descriptive statistics were used to summarize participant characteristics. Continuous variables are presented as medians and interquartile ranges due to non-normal distributions, whereas categorical variables are reported as frequencies and percentages.
Normality was assessed using the D’Agostino–Pearson test. Between-group comparisons were performed using the Mann–Whitney U test for continuous variables and chi-square tests for categorical variables.
To evaluate determinants of the continuous AFI index, robust linear regression models (RLM) with Huber’s M-estimator were applied. This approach was selected to minimize the influence of extreme values and violations of normality assumptions. These models examined associations between sociodemographic variables and metabolic imbalance. Unstandardised regression coefficients (β) with 95% confidence intervals were reported.
To estimate the probability of elevated cardiometabolic risk (defined as WHtR > 0.50), multivariable logistic regression models were constructed using standardized fitness biomarkers (z-scores) as predictors and adjusting for age and sex. Odds ratios (ORs) with 95% confidence intervals were reported. Regression coefficients represent the change in log-odds associated with a one-standard-deviation increase in each predictor.
Statistical significance was set at p < 0.05. All analyses were conducted using Python (version 3.11), with the pandas, scipy, and statsmodels libraries. To address the partial overlap between the adiposity pillar and the elevated-WHtR outcome, the primary logistic regression for the AFI index was complemented by a sensitivity analysis using the WHtR-independent version of the index. To assess potential overestimation arising from in-sample model fitting, internal validation was performed by partitioning the analytic sample into a derivation subsample (70%, n = 5496) and a validation subsample (30%, n = 2356), stratified by outcome. The AFI index, its component z-scores, and the logistic regression coefficients were all derived in the training subsample and applied unchanged to the validation subsample. In addition, performance of the AFI index was directly compared with simpler alternatives—BMI alone and the fitness pillar alone—within the same modeling framework (each adjusted for age and sex). Discrimination was summarized using the area under the receiver-operating-characteristic curve (AUC) with bootstrap 95% confidence intervals, and calibration was summarized using the Brier score and a 10-group calibration table. A complementary 5-fold cross-validation was performed for all candidate models. Finally, all AFI analyses were repeated using sex- and age-specific z-scores instead of global z-scores.
3. Results
Table 1 summarizes the anthropometric characteristics and physical fitness performance of the study population stratified by sex. The final sample included 7852 adolescents (4355 boys and 3497 girls), all with complete anthropometric and fitness assessments. Significant sex differences were observed across most variables. Boys were taller and heavier and demonstrated superior performance in muscular strength, power, and cardiorespiratory fitness tests, including sit-ups, push-ups, standing long jump, and estimated VO
2max (all
p < 0.001). Conversely, girls exhibited higher flexibility scores (median 32.5 cm vs. 27.5 cm,
p < 0.001). Body mass index did not differ significantly between sexes (
p = 0.098). However, waist-to-height ratio showed small but statistically significant differences (
p = 0.001), indicating subtle variations in central adiposity not captured by BMI alone. In addition, the AFI index differed significantly between sexes (
p < 0.001), with females showing higher values, indicating a greater imbalance between adiposity and physical fitness.
Multivariable logistic regression models were used to evaluate the association between standardized fitness biomarkers and elevated WHtR, used as an anthropometric proxy of cardiometabolic risk (
Table 2). Higher levels of muscular strength and power were consistently associated with lower odds of elevated WHtR. The standing long jump showed the strongest protective association (OR = 0.69, 95% CI 0.65–0.74), followed by push-ups (OR = 0.76, 95% CI 0.71–0.80) and sit-ups (OR = 0.81, 95% CI 0.77–0.85). Cardiorespiratory fitness was also associated with lower odds of elevated WHtR (OR = 0.82, 95% CI 0.75–0.89). A small protective association was also observed for flexibility (OR = 0.93, 95% CI 0.88–0.99,
p = 0.016).
Table 3 shows the associations between sociodemographic factors and elevated WHtR (anthropometric proxy of cardiometabolic risk). Urban residence was associated with higher odds of elevated WHtR compared with rural areas (OR = 1.263, 95% CI 1.014–1.573,
p = 0.037). Male sex was associated with lower odds compared with females (OR = 0.876, 95% CI 0.783–0.981,
p = 0.022). No statistically significant associations were observed for socioeconomic status or age after multivariable adjustment.
A multivariable logistic regression model was conducted to evaluate the association between the AFI index and elevated WHtR, used as an anthropometric proxy of cardiometabolic risk (
Table 4). Higher AFI values were strongly associated with increased odds of elevated WHtR. Specifically, each one-standard-deviation increase in the AFI index was associated with a nearly fivefold increase in the odds of elevated WHtR (OR = 26.74, 95% CI 22.57–31.68,
p < 0.001).
In the adjusted model that included the AFI index as a continuous predictor, male sex was no longer significantly associated with the outcome (OR = 1.06, 95% CI 0.89–1.27,
p = 0.487), and age showed a small but statistically significant inverse association (OR = 0.75, 95% CI 0.67–0.85,
p < 0.001). The change in the direction and magnitude of the sex and age coefficients between the model that included only sociodemographic predictors (
Table 3) and the model that includes the AFI index (
Table 4) reflects the strong correlation between the AFI index and these covariates: once the AFI index captures the joint imbalance between adiposity and fitness, the residual variance attributable to sex and age changes substantially.
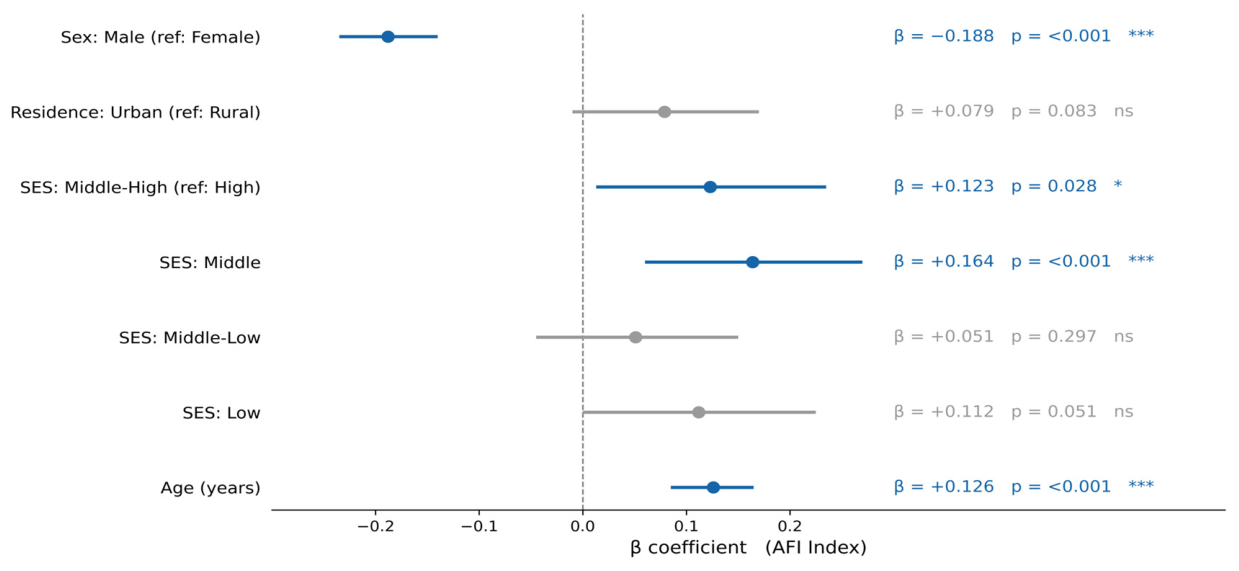
Robust linear regression analysis was conducted to evaluate the association between sociodemographic factors and the AFI index (
Figure 1). Male sex was significantly associated with lower AFI values (β = −0.188, 95% CI −0.237 to −0.139,
p < 0.001), indicating a more favorable balance between adiposity and physical fitness compared with females. Age was positively associated with AFI (β = 0.126, 95% CI 0.093 to 0.160,
p < 0.001), suggesting a progressive increase in metabolic imbalance with increasing age.
Regarding socioeconomic status, individuals in the middle and middle-high categories exhibited significantly higher AFI values compared with the high socioeconomic group (β = 0.164, p < 0.001; β = 0.123, p = 0.028, respectively). No significant associations were observed for urban residence or lower socioeconomic strata.
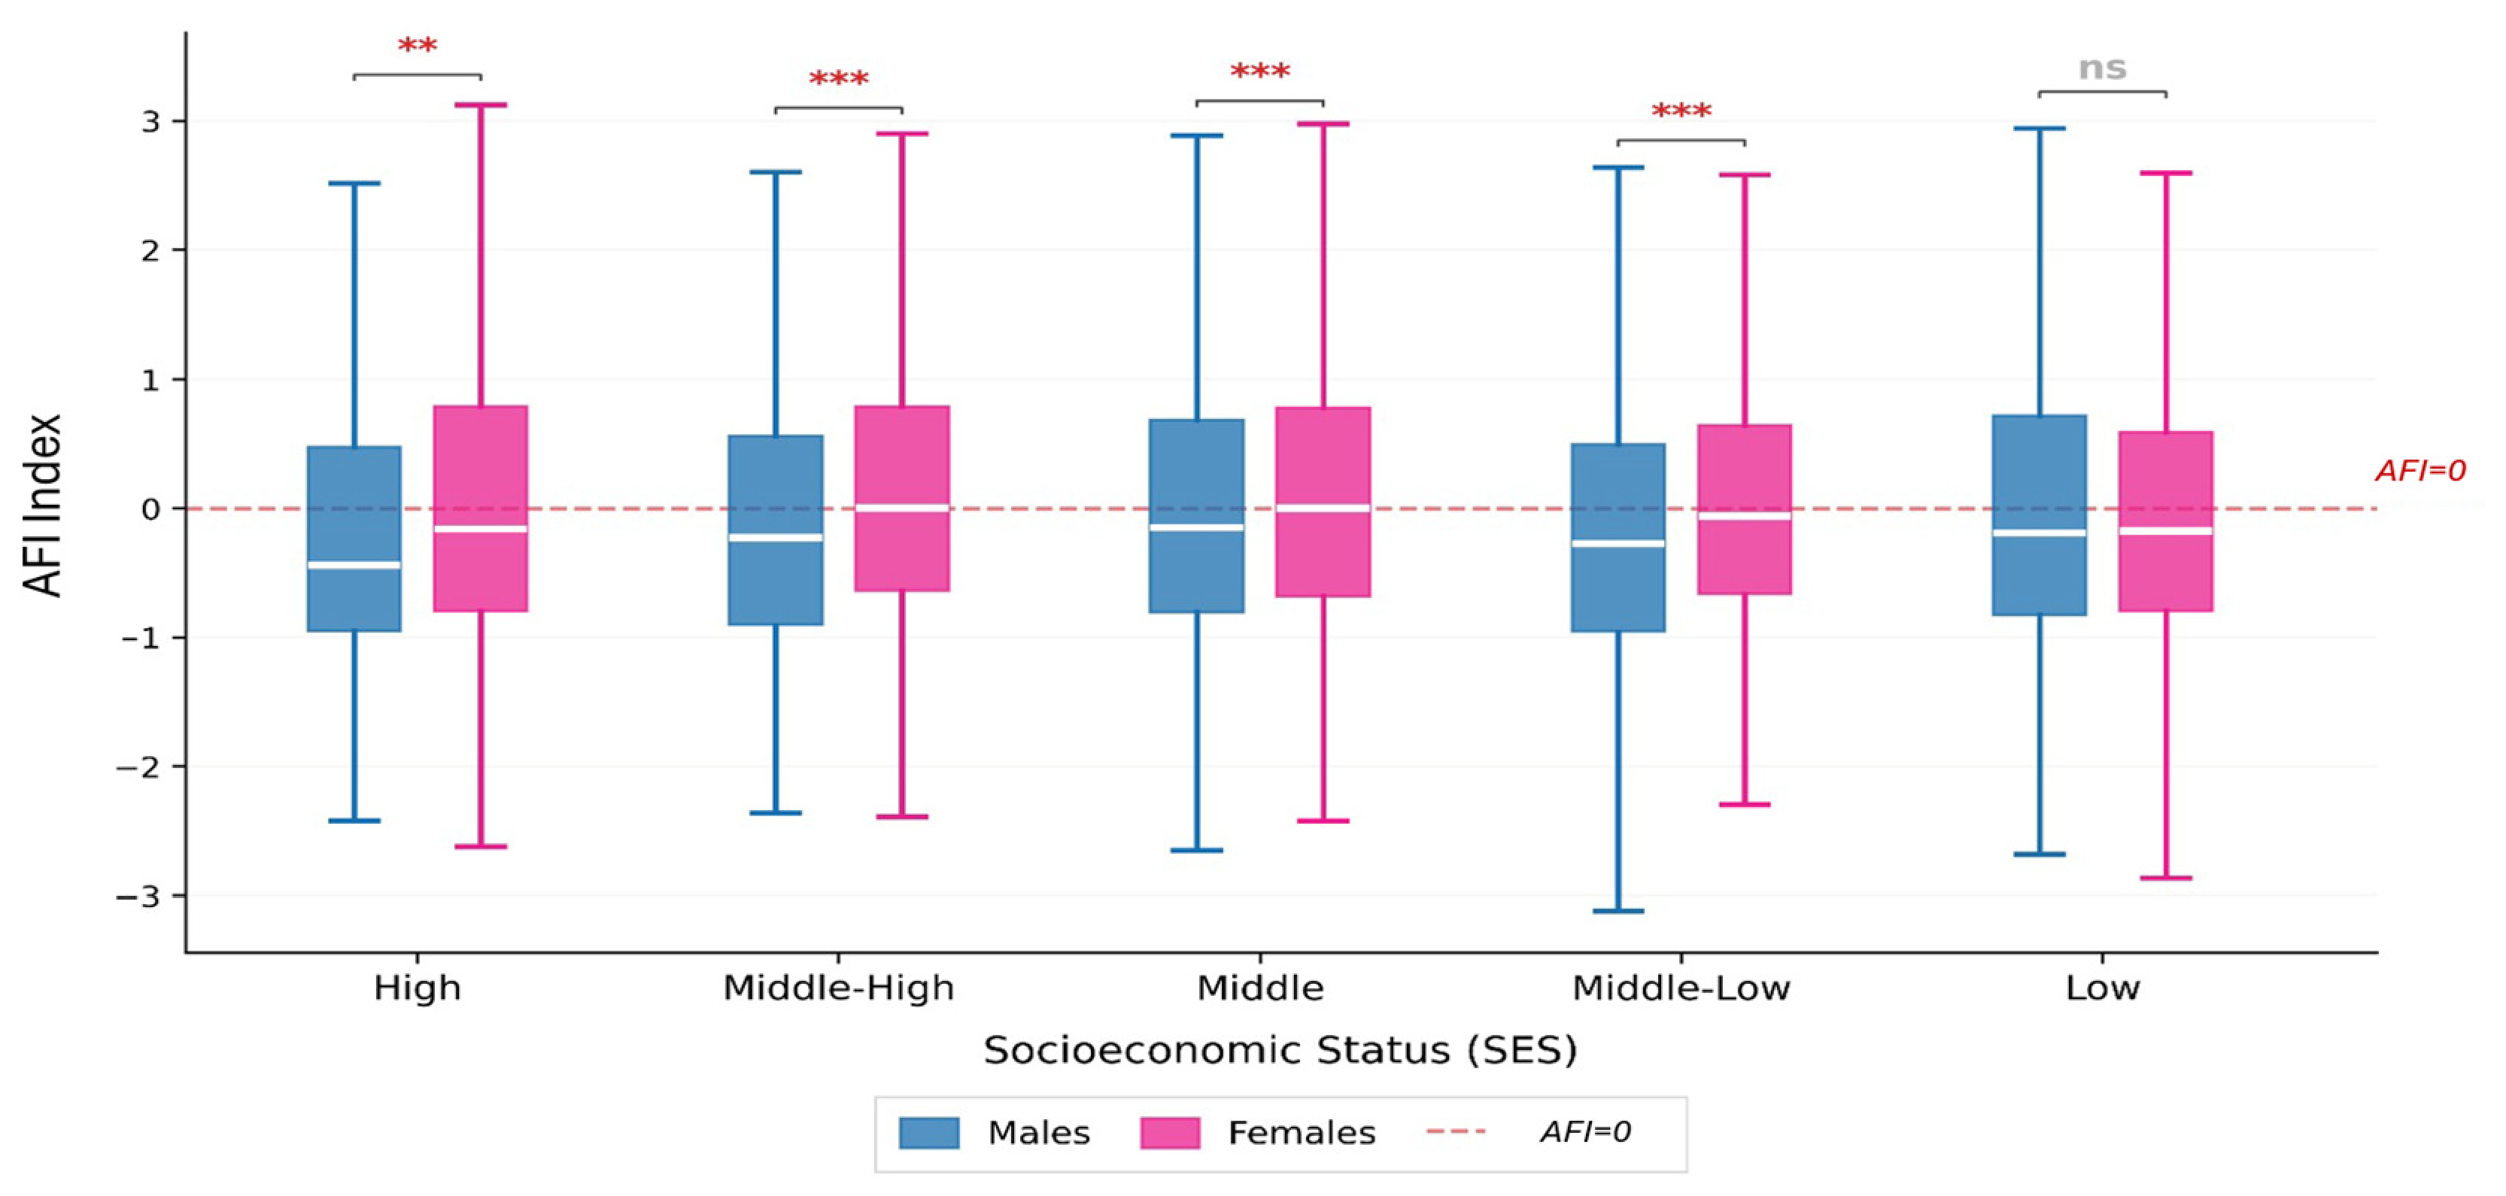
Figure 2 illustrates the distribution of the AFI index across socioeconomic strata stratified by sex. Females consistently showed higher AFI values across most socioeconomic categories, indicating a greater imbalance between adiposity and physical fitness. Statistically significant differences between sexes were observed across almost the entire socioeconomic spectrum, specifically in the High, Middle-High, Middle, and Middle-Low groups, emphasizing the pervasive nature of this imbalance. The Low socioeconomic group was the only stratum where this sex-based difference was not statistically significant.
The graphs illustrate the distribution of the AFI index across socioeconomic strata stratified by sex. Females consistently showed higher AFI values across most socioeconomic categories, indicating a greater imbalance between adiposity and physical fitness. This pattern was particularly evident in the middle and middle-high socioeconomic groups, where statistically significant differences were observed between sexes.
Sensitivity Analysis (AFI Without WHtR) and Internal Validation
Because the adiposity pillar of the AFI index originally included WHtR—the same variable used to define the outcome (WHtR > 0.50)—a pre-specified sensitivity analysis was conducted using a modified AFI in which the adiposity pillar was constructed only from standardized BMI and waist circumference (i.e., WHtR was excluded). In this WHtR-independent version, each one-standard-deviation increase in the AFI index remained strongly associated with elevated WHtR, with an OR of 14.60 (95% CI 12.77–16.70, p < 0.001) after adjustment for age and sex. Although the magnitude of the association was attenuated relative to the original index (OR = 26.74 per 1 SD), the direction and statistical significance were preserved, indicating that the predictive signal of the AFI index is not driven exclusively by the partial overlap between predictor and outcome. Direct head-to-head comparisons between the WHtR-independent AFI index and simpler indicators (each adjusted for age and sex) showed that the AFI index outperformed BMI alone (OR per 1 SD for BMI = 6.89, 95% CI 6.25–7.59) and the fitness pillar alone (OR per 1 SD = 0.67, 95% CI 0.63–0.71) in terms of magnitude of association with the outcome. WHtR alone is not reported as a comparator because, by construction, it perfectly determines the outcome (WHtR > 0.50) and therefore inflates predictive metrics in a non-informative way; this comparison was therefore not made. In 5-fold cross-validation, the area under the receiver-operating-characteristic curve (AUC) was 0.93 (SD across folds 0.005) for the WHtR-independent AFI model, compared with 0.90 for BMI alone (adjusted for age and sex) and 0.61 for the fitness pillar alone. In the derivation/validation split (70%/30%, stratified by outcome), the WHtR-independent AFI model trained on the derivation subsample (n = 5496) showed an AUC of 0.93 (95% CI 0.92–0.94) when applied to the held-out validation subsample (n = 2356), with an OR per 1 SD of 14.68 (95% CI 11.52–18.71) and a Brier score of 0.077. The full AFI model (with WHtR) showed even higher discrimination in the validation subsample (AUC = 0.95, 95% CI 0.94–0.96; OR per 1 SD = 26.30, 95% CI 19.43–35.60; Brier = 0.066), although this is in part inflated by the component–outcome overlap. The 10-group calibration table indicated good agreement between predicted probabilities and observed event rates across the entire risk spectrum, supporting the calibration of both versions of the model. Repeating all AFI analyses using sex- and age-specific z-scores instead of global z-scores produced essentially the same pattern of results (OR per 1 SD = 23.38, 95% CI 19.89–27.47), indicating that the observed associations are not an artifact of expected physiological differences between sexes and age strata.
4. Discussion
The present study provides robust evidence regarding the determinants of cardiometabolic risk in adolescents. As an initial step, our analyses confirmed that isolated physical fitness components—particularly explosive strength, muscular endurance, and aerobic capacity—are independently associated with lower odds of central adiposity. Building upon this foundation, we demonstrated a strong association between the AFI index—a novel composite measure integrating adiposity and physical fitness—and cardiometabolic risk. Specifically, individuals exhibiting a more pronounced adiposity–fitness imbalance demonstrated a markedly increased likelihood of cardiometabolic disturbances (OR = 26.74 per 1 SD), highlighting the synergistic and potentially multiplicative effect of excess adiposity combined with low fitness levels. These findings reinforce the concept that the interaction between body composition and physical fitness is more informative than either variable in isolation.
From a physiological perspective, the observed association can be explained by the combined impact of adiposity-driven metabolic dysregulation and the physiological consequences of globally reduced physical fitness. Excess adipose tissue, particularly visceral fat, is metabolically active and promotes chronic low-grade inflammation through the secretion of pro-inflammatory cytokines such as TNF-α and IL-6, contributing to insulin resistance and endothelial dysfunction [
21,
22]. Concurrently, low physical fitness—encompassing both cardiorespiratory and muscular components—exacerbates this metabolic risk [
23]. While reduced aerobic capacity is associated with impaired mitochondrial function and diminished oxidative capacity, deficits in muscular strength and endurance reflect a reduced capacity for insulin-mediated glucose disposal, given that skeletal muscle is the primary tissue for systemic glucose clearance [
24,
25]. Furthermore, actively contracting skeletal muscle functions as an endocrine organ, releasing myokines that exert anti-inflammatory effects and directly counteract the pro-inflammatory adipokines secreted by visceral fat [
26,
27]. Therefore, the AFI index successfully captures this complex physiological crosstalk: the coexistence of high structural load (adiposity) and diminished functional capacity (both neuromuscular and aerobic) likely amplifies cardiometabolic alterations beyond the additive effect of each factor alone.
Our findings are consistent with previous literature emphasizing the relevance of the fat-but-fit paradigm, which suggests that higher fitness levels may attenuate, but not fully eliminate, the deleterious effects of excess adiposity. A systematic review and meta-analysis demonstrated that individuals with higher cardiorespiratory fitness present a lower cardiometabolic risk regardless of fatness status; however, those who are both unfit and obese exhibit the highest risk profiles [
28]. In this context, the AFI index may provide a more nuanced stratification of risk by capturing this interaction explicitly rather than treating fitness and adiposity as independent predictors.
Importantly, the magnitude of association observed in this study appears higher than that reported in studies using isolated indicators such as BMI or fitness alone. For example, studies examining BMI as a predictor of cardiometabolic risk in youth often report moderate associations, partly due to its inability to differentiate between fat mass and lean mass [
29]. Similarly, while cardiorespiratory fitness is a strong independent predictor of metabolic health, its isolated use may overlook the contribution of excess adiposity [
30]. Therefore, the stronger association observed with the AFI index supports the hypothesis that composite indices may enhance predictive capacity in epidemiological and clinical settings.
Another relevant aspect of our findings is the association between higher AFI values and adverse sociodemographic factors, particularly urban residence and middle socioeconomic status. These results align with current evidence indicating that cardiometabolic risk in adolescents is not solely determined by biological factors but is profoundly shaped by the built environment and social determinants of health [
5]. While studies in high-income countries often report that the lowest socioeconomic strata face the highest risk, our findings reflect a pattern characteristic of countries undergoing rapid nutritional transition. In this context, adolescents from middle socioeconomic backgrounds may experience a “toxic combination”: increased purchasing power for ultra-processed foods and screen-based entertainment, coupled with reduced access to the elite sports clubs, safe recreational spaces, and structured physical activity available to the highest socioeconomic groups. This multidimensional context reinforces the need for integrated public health interventions targeting both behavioral and structural determinants, particularly focusing on urban planning and equitable access to physical activity in middle-income communities.
From a clinical and public health perspective, the AFI index represents a practical, scalable, and cost-effective tool for early risk stratification in youth populations. Unlike traditional composite metabolic scores that rely on invasive blood sampling or expensive laboratory equipment, the variables comprising the AFI index—basic anthropometry and field-based physical fitness tests—are highly feasible to collect in routine educational or primary care settings. This accessibility facilitates its seamless integration into large-scale epidemiological surveillance and school screening programs. The early identification of these high-risk trajectories is critical, as cardiometabolic alterations and physical deconditioning established during adolescence strongly track into adulthood, significantly increasing the lifetime risk of type 2 diabetes and premature cardiovascular disease [
31,
32].
This study presents several limitations that warrant consideration. First, the cross-sectional design precludes the establishment of causal inferences regarding the temporal relationship between adiposity accumulation and physical fitness decline; thus, longitudinal cohorts are required to confirm the predictive trajectory of the AFI index over time. Second, while the sample was large and nationally representative, residual confounding from unmeasured biological or environmental variables—such as pubertal maturation staging or specific dietary patterns—cannot be entirely ruled out. Third, although highly practical for large-scale epidemiological surveillance, the reliance on field-based surrogate measures for physical fitness and adiposity inherently introduces measurement error when compared to clinical gold standards, such as direct gas exchange spirometry (VO2max) or dual-energy X-ray absorptiometry (DXA). A further important limitation concerns the operational definition of the outcome and its overlap with the index components. In this study, “elevated cardiometabolic risk” was operationalized as WHtR > 0.50, which is itself one of the variables included in the adiposity pillar of the AFI index. Although WHtR is a well-established and pragmatic anthropometric proxy of central adiposity-related risk in pediatric populations, it is not equivalent to a full cardiometabolic phenotype based on metabolic and cardiovascular markers (lipids, blood pressure, glucose, insulin resistance), which were not available in the SIMCE-EF dataset. To address the partial component–outcome overlap, we conducted a pre-specified sensitivity analysis with a WHtR-independent version of the AFI index, internal derivation/validation, head-to-head comparison with simpler indicators, and analyses with sex- and age-specific z-scores; results were consistent across all of these analyses. Nevertheless, external validation of the AFI index against direct cardiometabolic markers (e.g., fasting lipid profile, glycemia, blood pressure, insulin resistance indices) in independent cohorts is warranted before stronger claims about cardiometabolic stratification can be made. A further limitation is that socioeconomic status was inferred from school administrative dependency rather than measured at the household level; this school-level proxy may not fully capture individual socioeconomic position and the SES-related estimates should be interpreted with this caveat in mind.
Despite these limitations, this research has notable strengths. Chief among them is the utilization of a massive, population-based dataset, which ensures high external validity and generalizability of the findings across the Chilean adolescent population. Furthermore, the application of a robust analytical framework—integrating multivariable logistic models with robust linear regression (Huber’s M-estimators) to manage outliers and sample heterogeneity—strengthens the reliability of the estimates. Finally, the conceptualization and internal evaluation of the AFI index introduces a novel, non-invasive composite anthropometric–fitness indicator that, pending external validation against direct cardiometabolic markers, may have potential applicability for screening of central-adiposity–related risk in real-world, resource-limited school and primary care settings.




 ,
,