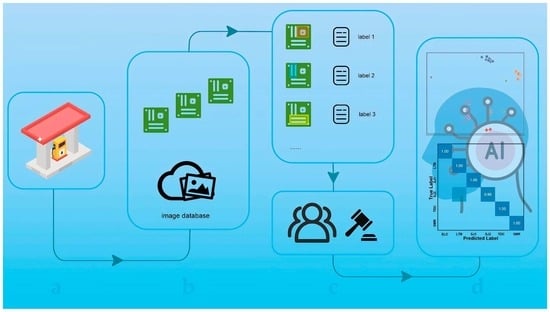
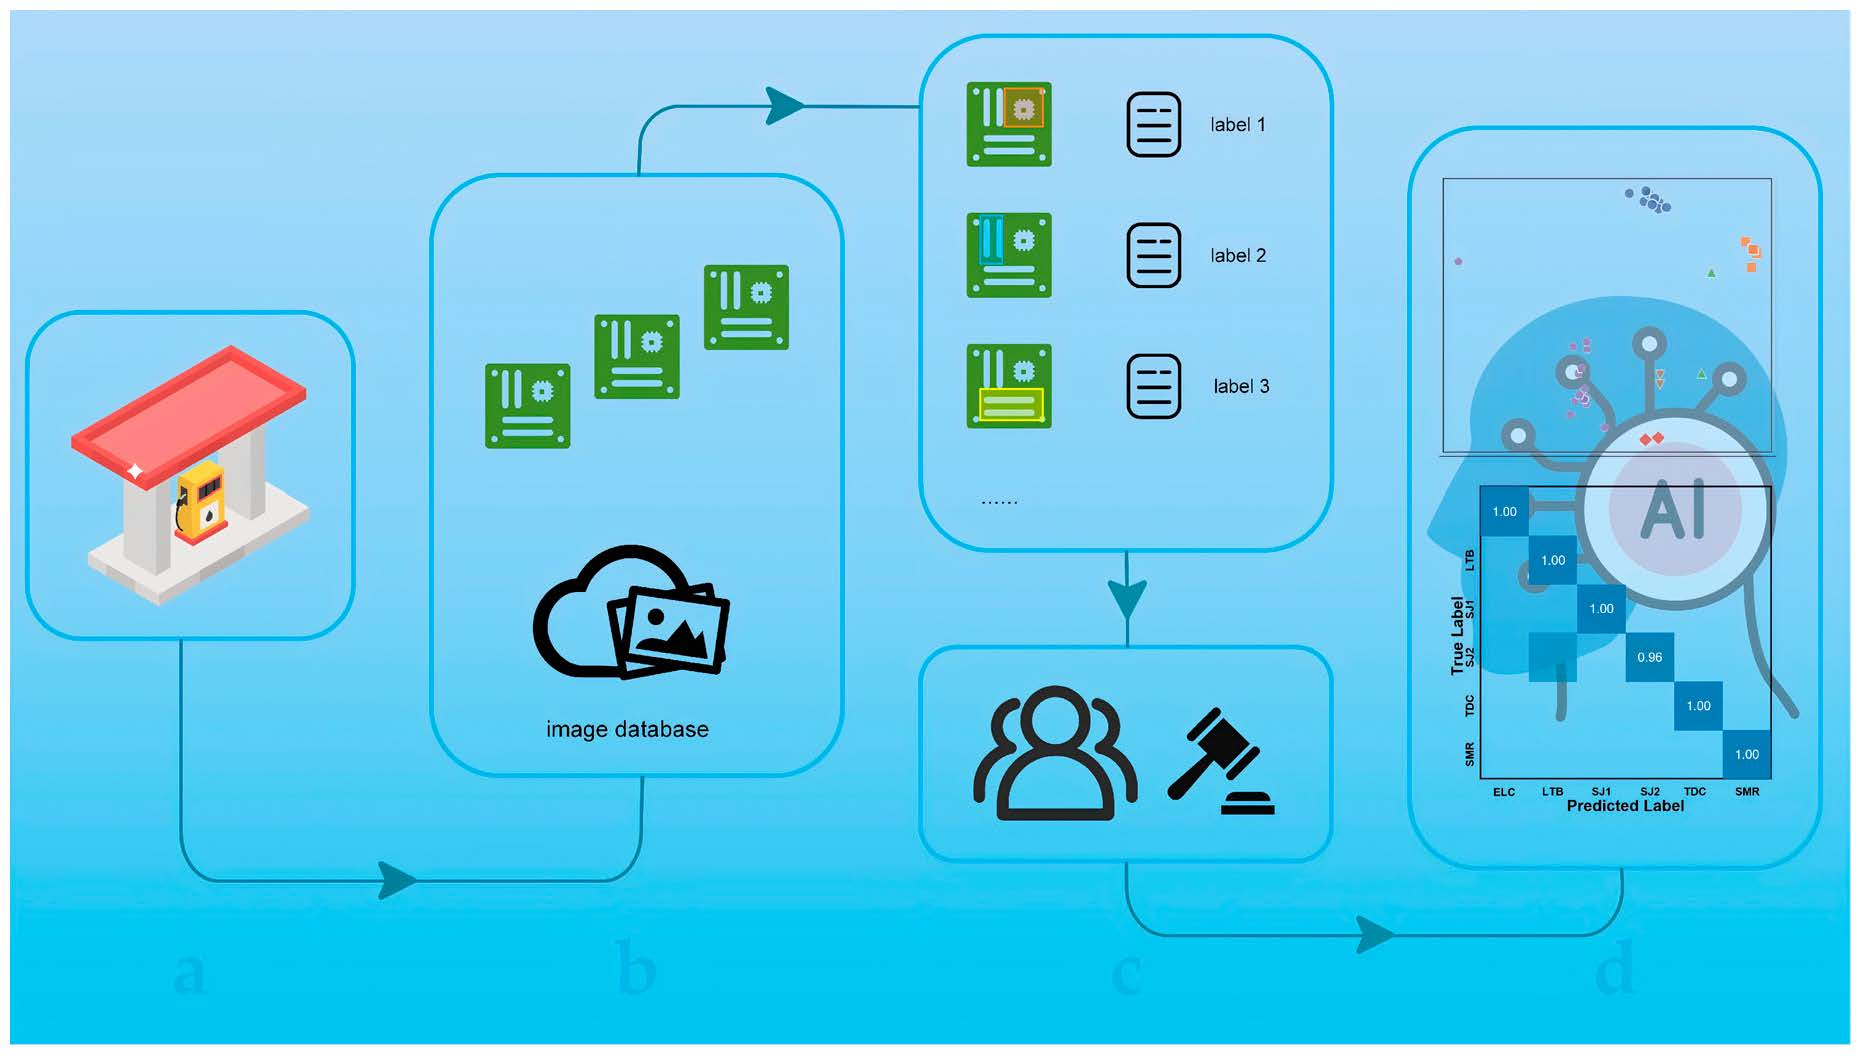
1. Introduction
Fuel dispensers are critical components of the petroleum distribution infrastructure, and the accuracy of their fuel metering is vital for protecting consumer rights, maintaining market fairness, and ensuring regulatory compliance. However, increasingly sophisticated tampering technologies continuously threaten the integrity of fuel dispenser metering. Modern tampering methods exploit security vulnerabilities in the electronic Printed Circuit Boards (PCBs) of fuel dispensers, including concealed circuit modifications, illegal reprogramming of microcontrollers, and the installation of hidden modules. Such operations covertly alter fuel metering results during transactions, causing substantial economic losses to consumers and undermining regulatory credibility. Traditional detection methods rely heavily on manual expertise, which are not only time-consuming and labor-intensive but also often struggle to identify subtle or hidden modification traces.
China is one of the world’s largest fuel markets, characterized by immense refined oil sales and a dense network of gas stations. In 2023, China’s refined oil consumption reached approximately 399 million tons [
1], fully reflecting the market scale and the critical role of fuel dispensers in daily operations. There are currently about 105,800 registered gas stations nationwide [
2], distributed across all provinces; such an extensive network makes metrological compliance essential for both economic order and consumer protection.
Despite the growing importance of automated detection [
3,
4], the development of computer vision-based methods for identifying fuel dispenser PCB tampering remains relatively limited [
5], primarily due to the lack of public, high-quality, and multi-brand datasets. Existing studies mostly focus on a single brand or simulated PCBs [
6], which severely limits the practical capability and reproducibility of detection algorithms. Therefore, constructing a standardized, annotated, multi-brand dataset is crucial for advancing the development of reliable automated detection systems and supporting reproducible research in the fields of industrial metrology and hardware forensics [
7,
8].
To fill this gap, this paper introduces the FD-TamperBoard dataset, a vision-based image dataset containing 189 high-resolution images of genuine tampered fuel dispenser PCBs. The samples were all collected from on-site law enforcement inspections and verified by technical experts. The dataset covers 5 mainstream market brands and includes 6 typical categories of tampering features, such as the installation of extra chip modules, solder joint modifications, and surface-mount resistor alterations. Each image is finely annotated to specify the presence and location of the tampering features, and all annotations have been reviewed by experts to ensure accuracy and consistency.
The FD-TamperBoard dataset authentically and comprehensively reflects multi-brand, multi-type tampering features. By providing a standardized, annotated image set, this dataset enables researchers to develop and evaluate machine learning algorithms for tampering detection, analyze tampering patterns across the covered brands, and validate the detection performance of models for the annotated tampering features. In addition to algorithm research and development, this dataset can also serve regulatory law enforcement, hardware forensic investigations, and research on standardized anti-tampering solutions for fuel dispensers.
In summary, the FD-TamperBoard dataset meets the urgent demand in the fuel dispenser security domain for a high-quality, multi-brand, annotated image dataset. It provides fundamental resources for computer vision research, supports the reproducible evaluation of detection algorithms, and is expected to promote the construction of a more secure and transparent fuel metering system [
9,
10]. In the future, the dataset can be expanded by incorporating more brands, tampering types, and imaging modalities, further enhancing its application value in automated detection systems and industrial compliance research.
2. Methods
2.1. Image Data Collection
The fuel dispenser tampered PCB image dataset constructed in this study originates from tampered PCB samples legally seized during law enforcement inspections, along with some non-tampered PCB samples confirmed through testing. All PCBs were sourced from real fuel dispenser equipment currently in use and were detached from the complete machines after fulfilling the law enforcement forensics or testing procedures. The data collection process does not involve any user privacy information, nor does it contain any commercially sensitive data. All PCB samples are electronic PCBs from actual operating equipment, accurately reflecting the hardware forms and structural features of tampering that may exist in real-world usage environments. Among them, the tampered PCBs were confirmed for their tampering attributes by professionals with relevant technical backgrounds based on law enforcement testing results and functional analysis; the non-tampered PCBs were sourced from equipment that passed inspections or showed no signs of tampering.
2.2. Image Data Collection Protocol
All PCB images were acquired using the same set of photographic equipment and a unified shooting protocol. The image acquisition utilized a Sony ILCE-7CM2 camera (Sony Corporation, Tokyo, Japan), paired with a TAMRON 35–150 mm F/2–2.8 Di III VXD lens (Tamron Co., Ltd., Saitama, Japan). All captured images were saved in JPG format. The camera’s shooting resolution was standardized at 7008 × 4672 pixels to ensure the completeness of the PCB’s structure and detailed information within the images. The shooting environment was indoors under natural light conditions, without the use of supplementary lighting or flash equipment, to minimize the impact of artificial lighting interventions on the appearance features of the PCBs. All images were taken after the PCBs were disassembled, with the shooting angle uniformly fixed at the front of the PCB, ensuring that the overall structure of the PCB was completely presented in the image. Each image contains the complete PCB area, and multi-angle shooting was not performed, thereby maintaining the consistency and comparability of the data.
2.3. Image Data Selection and Inclusion Criteria
To ensure dataset quality and usability, manual screening was performed on all image samples following the initial image acquisition. Images included in the dataset had to meet the following conditions simultaneously: 1. The overall structure of the PCB is completely clear and visible; 2. The image resolution meets the original acquisition standards without obvious scaling or compression distortion; 3. The PCB area has no severe occlusion, blurring, or excessive reflection; 4. The image contains no obvious interferents unrelated to the PCB. Images failing to meet these criteria (such as out-of-focus samples, severe exposure anomalies, or unidentifiable key PCB areas) were excluded and not incorporated into the final dataset.
2.4. Image Data Preprocessing
To eliminate geometric distortion and perspective bias introduced during on-site photography, a standardized data preprocessing pipeline consisting of lens distortion correction, perspective rectification, and background cropping was implemented.
First, Zhang’s calibration method [
11] was applied to correct barrel and pincushion distortions caused by the zoom lens. By matching the focal length from the image’s Exchangeable Image File Format (EXIF) metadata with pre-calibrated distortion coefficients, the algorithm effectively restores the true physical proportions of the components.
Next, to address perspective deformation caused by varying shooting angles, an automated homography estimation pipeline was utilized. This involves using the Canny algorithm [
12] and Douglas-Peucker polygon approximation to extract the four main corners of the PCB. A 3 × 3 perspective transformation matrix [
13] is then computed to project the image into a standardized orthographic top-down view, ensuring strict horizontal alignment.
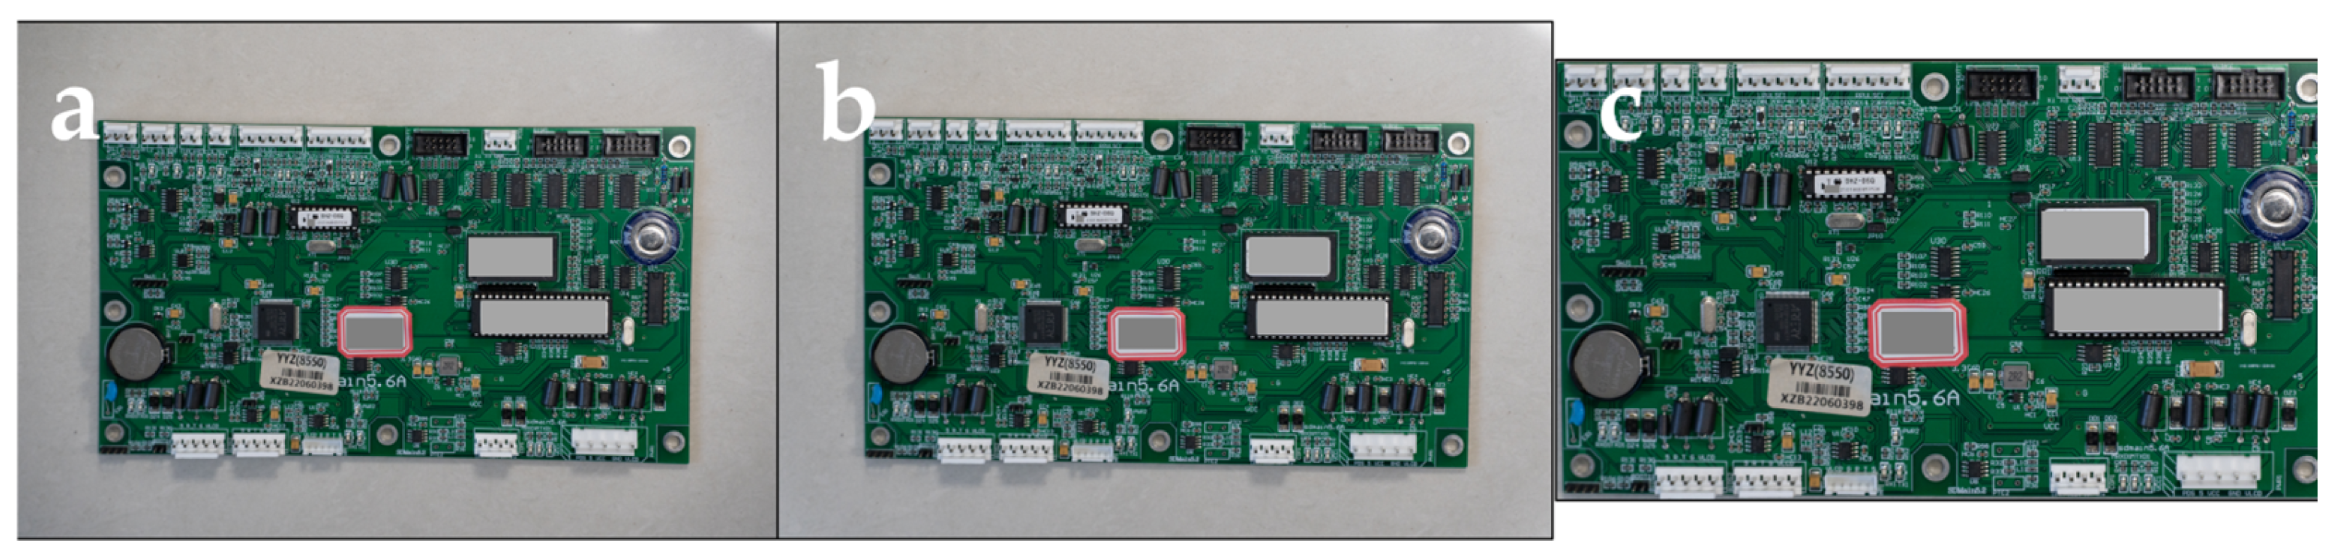
Finally, since perspective transformations often introduce invalid black padding, a morphological-based cropping algorithm was applied to automatically locate the maximum bounding box of the valid PCB area and strictly crop out the background. While the underlying geometric algorithms are standard, the primary contribution in this stage lies in integrating them into an automated and highly robust pipeline tailored specifically for complex law enforcement photography. This pipeline effectively neutralizes severe domain shifts caused by different shooting angles, varying focal lengths, and cluttered on-site backgrounds. As illustrated in
Figure 1, by transforming these on-site raw photos into standardized, geometrically consistent, and background-free PCB images, a reliable and high-fidelity data foundation is established. This rigorous standardization ensures that the subsequent object detection models can focus exclusively on learning the subtle morphological differences in the tampered features rather than being distracted by environmental noise, thereby maximizing the validity and reproducibility of the benchmark experiments.
2.5. Annotation and Labeling
To ensure the objective neutrality of the study and avoid potential commercial risks, this research anonymized all fuel dispenser manufacturers involved in the dataset, referring to 5 mainstream domestic fuel dispenser brands as Brand A, Brand B, Brand C, Brand D, and Brand E. To precisely locate the tampered regions and support object detection tasks, all images were annotated with fine-grained instance-level bounding boxes, defining the spatial location and class attributes independently for every tampering feature instance in the images. The bounding boxes are pixel-aligned with the target features, directly accommodating the training and validation pipelines of mainstream object detection algorithms.
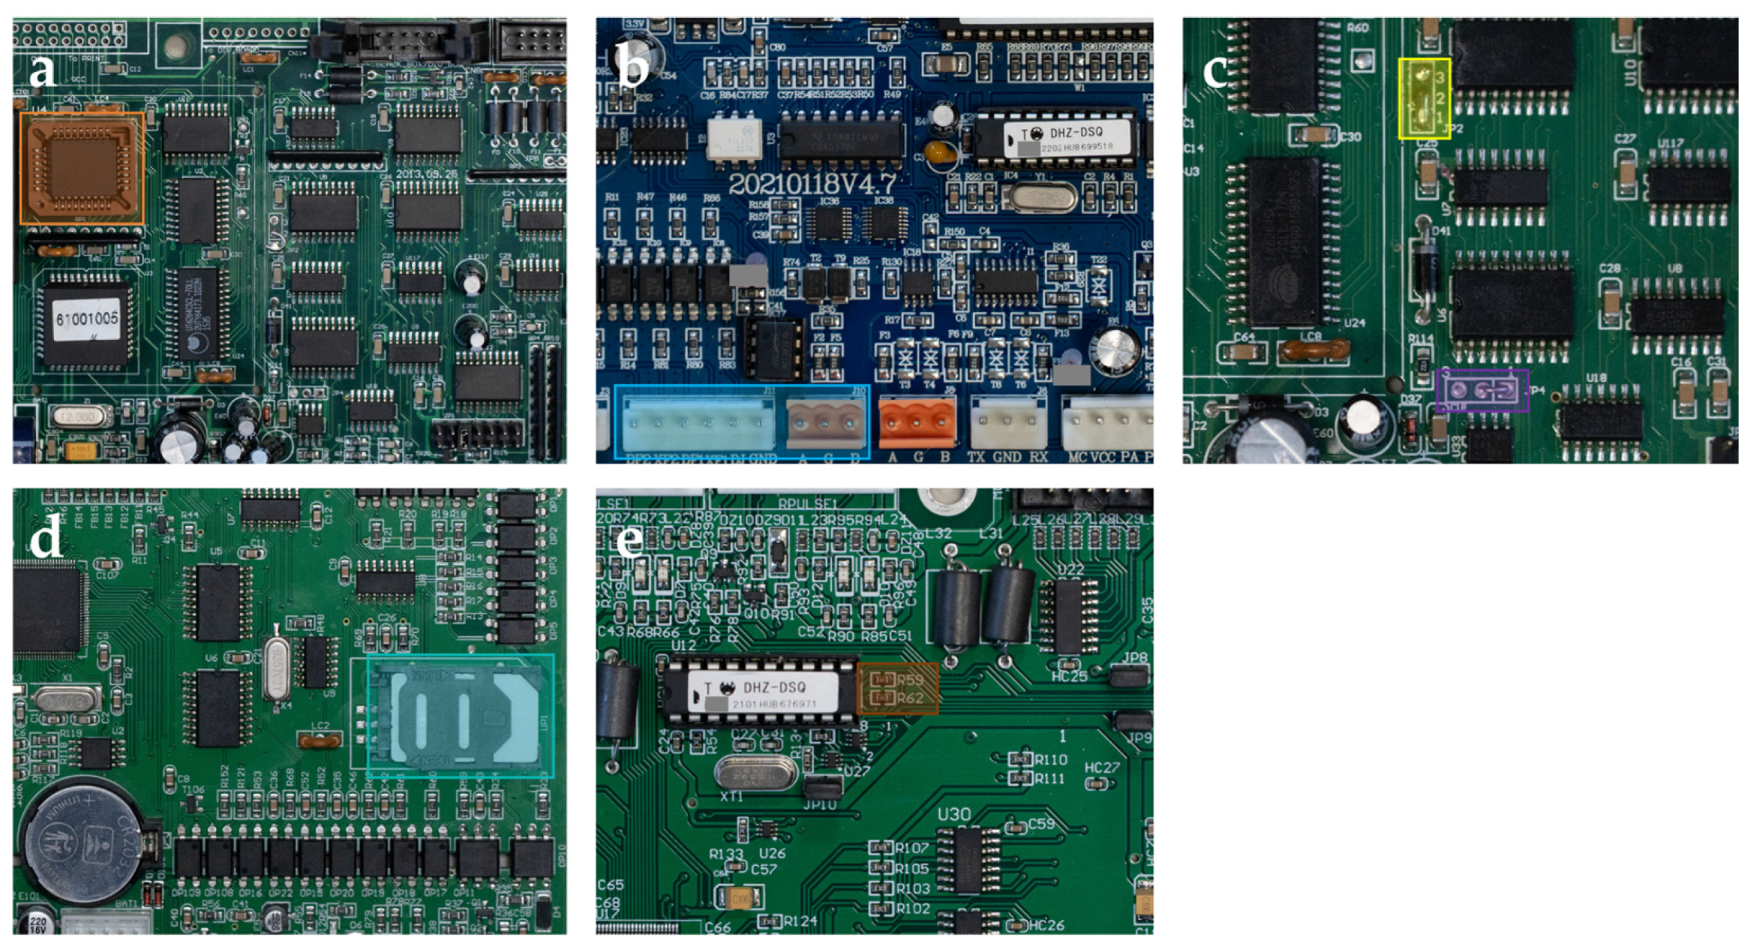
The annotation categories cover six typical tampering behaviors, including coarse-grained modifications such as external chips and decoding modules, and fine-grained modifications such as solder joints and surface-mount resistors. Among them, the Extra Language Chip (ELC) refers to an unauthorized module installed on the PCB’s reserved localization interface. Originally, this interface was designed for manufacturers to install specific language-display modules for different export regions. However, it is frequently exploited to covertly install illicit metering-alteration chips. The tampering feature for Brand A is Left Terminal Block (LTB); for Brand B, the features include Solder Joint 1 (SJ1), Solder Joint 2 (SJ2), and Tampered Decoding Chip (TDC); and the tampering feature for Brand C is Surface Mount Resistor (SMR). Every instance annotation was reviewed by domain experts to ensure accuracy and consistency, with bounding boxes highly aligned with actual features, providing a reliable foundation for model learning.
The distribution of the six tampering feature categories in the dataset is shown in
Table 1, totaling 203 annotated instances across 189 high-resolution images. The quantities for ELC, LTB, SJ1, SJ2, TDC, and SMR are 51, 25, 16, 25, 72, and 14, respectively. Among all images, there are 16 non-tampered images, which are treated as negative samples during evaluation. Because the dataset is sourced from real-world law enforcement inspections targeting suspected illicit metering, the vast majority of the seized boards naturally contain tampering features, making completely normal boards relatively scarce in this specific forensic context. To intuitively display the visual differences and annotation standards of these physical tampering methods,
Figure 2 provides high-resolution localized magnifications of these 6 tampering types on real PCBs.
2.6. Annotation Quality Control
To guarantee the “metrology-grade” accuracy of the annotations, the dataset implemented a rigorous multi-stage review mechanism. During the initial phase, technicians with expertise in PCB repair delineated regional bounding boxes for key components within the images, such as tax control chips, metering chips, and hardware configuration jumpers. Subsequently, an independent group of annotators conducted a secondary review to verify the category attributes (normal versus tampered) and assess the tampering confidence levels (categorized as high, medium, or low). Finally, to resolve any annotation discrepancies, an audit panel comprising three senior metrology experts performed a point-to-point review as the ultimate arbitration, continuing the process until a 100% consensus was achieved across all instances [
14].
3. Data Records
The FD-TamperBoard dataset is organized into a hierarchical directory structure designed to support both general object detection training and the exact replication of the benchmark experiments presented in this study. The primary resources are stored within the FD-TamperBoard root directory, which contains 189 high-resolution images of fuel dispenser PCBs, along with their correspondingly verified annotation information, stored in the “Data” and “Labels” subdirectories, respectively. Furthermore, to ensure the absolute reproducibility of the technical validation results, the dataset provides a dedicated 5-splits directory containing the exact data partitions used for the 5-fold cross-validation protocol. This directory is structured into five sub-folders, designated as split1 through split5, each representing a specific validation fold. Each split is further partitioned into “train” and “val” directories, within which the respective “images” and “labels” sub-directories are strictly organized. This comprehensive organizational logic ensures that future researchers can seamlessly transition from raw data inspection to the standardized replication of the algorithmic benchmarking. To facilitate direct downloading and experimental replication, the dataset has been publicly shared on the GitHub platform.
To facilitate seamless integration into machine learning workflows, the dataset adopts a strict one-to-one organization of “image file—label file,” linked through unified naming conventions. The annotation information specifies the spatial locations and specific categories of the tampering features.
4. Technical Validation
To comprehensively validate the effectiveness of the FD-TamperBoard dataset, this study conducted a series of experiments using 5 You Only Look Once (YOLO)-based object detection models [
15], including YOLOv8m, YOLOv9c, YOLOv10m, YOLOv11m, and YOLOv26m [
16,
17,
18]. These models were selected to cover various network architectures, encompassing both classic YOLO backbones and their latest improvements, ensuring the construction of a robust benchmark system for evaluating tampering feature detection performance.
All experiments were completed based on the PyTorch 2.5.1 framework and ran on a workstation equipped with an NVIDIA Tesla V100S Graphics Processing Unit (GPU) (NVIDIA Corporation, Santa Clara, CA, USA) with 32 GB of Video Random Access Memory (VRAM). This hardware supports high-throughput training and inference for high-resolution images, guaranteeing the reproducibility of the performance evaluation results. All models were trained using a Stochastic Gradient Descent (SGD) optimizer, with an initial learning rate set to 0.01, a batch size of 4, and 50 training epochs for each data fold [
19,
20]. To mitigate the risk of overfitting on the limited dataset, all models utilized their native, built-in data augmentation pipelines during training. These default schemes efficiently employ task-friendly transformations—such as horizontal mirroring, scaling, translation, and Mosaic augmentation—to continuously enrich sample diversity and ensure training stability. To ensure the fairness of the algorithmic comparisons, all models utilized the aforementioned uniform hyperparameters.
A rigorous 5-fold cross-validation protocol was implemented for model evaluation. The dataset was randomly divided into five folds, strictly maintaining the original sample proportions for each brand and tampering type. For each fold execution, 4 folds (80%) of the data were used for model training, and the remaining 1 fold (20%) was used for model validation. This process was repeated 5 times, allowing each data fold to participate once as a validation set. The various performance metrics corresponding to each data fold were calculated [
21], and the final results are presented as the mean ± standard deviation across all folds, reflecting both the central tendency and fluctuation of the metrics.
As shown in
Table 2, experimental results indicate that the five baseline models all exhibit extremely high performance on core object detection metrics, exceeding 0.97 for the mean Average Precision (mAP)@0.5 metric. Among them, YOLOv9c achieved the highest mAP@0.5 (0.9907 ± 0.0086) and also exhibited the smallest standard deviation, demonstrating the model’s outstanding stability across different data folds. YOLOv8m performed best on the more stringent mAP@0.5:0.95 metric (0.8005 ± 0.0308), further confirming that even under strict Intersection over Union (IoU) threshold limits, the model can still precisely locate tampering features. Comparatively, the dataset exhibited more noticeable performance fluctuations with YOLOv10m, which had relatively large standard deviations in recall (0.9486 ± 0.0302) and precision (0.9119 ± 0.0557). Such fluctuations are a recognized phenomenon when training certain complex deep neural networks on relatively limited sample sizes, requiring careful architectural tuning as discussed by Liu et al. [
22].
These excellent benchmark results serve as strong evidence for the high quality of the FD-TamperBoard dataset. First, all models reached extremely high recall and precision rates, indicating that the target bounding box annotations within this dataset possess extremely high accuracy and pixel-level consistency, without obvious annotation noise or ambiguous boundaries that would hinder model convergence. Second, the low inter-fold standard deviations demonstrate that in the 5-fold cross-validation, the distribution of various tampering features is uniform and consistent throughout the entire dataset.
Table 3 illustrates the comprehensive performance metrics of the five models on the six tampering feature classification tasks, including Accuracy, Specificity, Sensitivity, Precision, F1 Score, and Kappa Coefficient. YOLOv11m performed the most outstandingly on the classification tasks, achieving the highest levels across Accuracy (0.9860 ± 0.0279), Precision (0.9944 ± 0.0111), F1 Score (0.9873 ± 0.0255), and Kappa Coefficient (0.9822 ± 0.0357). It also tied with YOLOv9c for the highest Sensitivity (0.9833). YOLOv8m closely followed, demonstrating highly competitive performance and recording the highest Specificity (0.9992 ± 0.0177).
Conversely, YOLOv10m and YOLOv26m were relatively weaker across most metrics. In particular, YOLOv10m recorded the lowest Accuracy (0.8788 ± 0.0724) and a larger standard deviation in Sensitivity (0.0473), suggesting that its classification stability across different data folds requires further improvement.
It is worth noting that all models maintained extremely high Specificity (all exceeding 0.98), which means the models generated almost no False Positives. This result directly verifies the cleanliness of the “non-tampered/background regions” within this dataset, demonstrating that complex circuit board backgrounds and legitimate electronic components did not cause severe interference in identifying the tampering features. Furthermore, these near-perfect specificity results verify that deep neural networks effectively distinguish subtle tampering from complex PCB backgrounds, a task where traditional intensity-based matching often fails due to environmental noise and minor component shifts. Simultaneously, the Kappa Coefficients of the leading models (YOLOv11m and YOLOv8m) remaining above 0.97 indicate that even with 6 different tampering methods spanning 5 fuel dispenser brands, the category labels defined by the dataset still possess extremely strong mutual independence and logical rigor [
23].
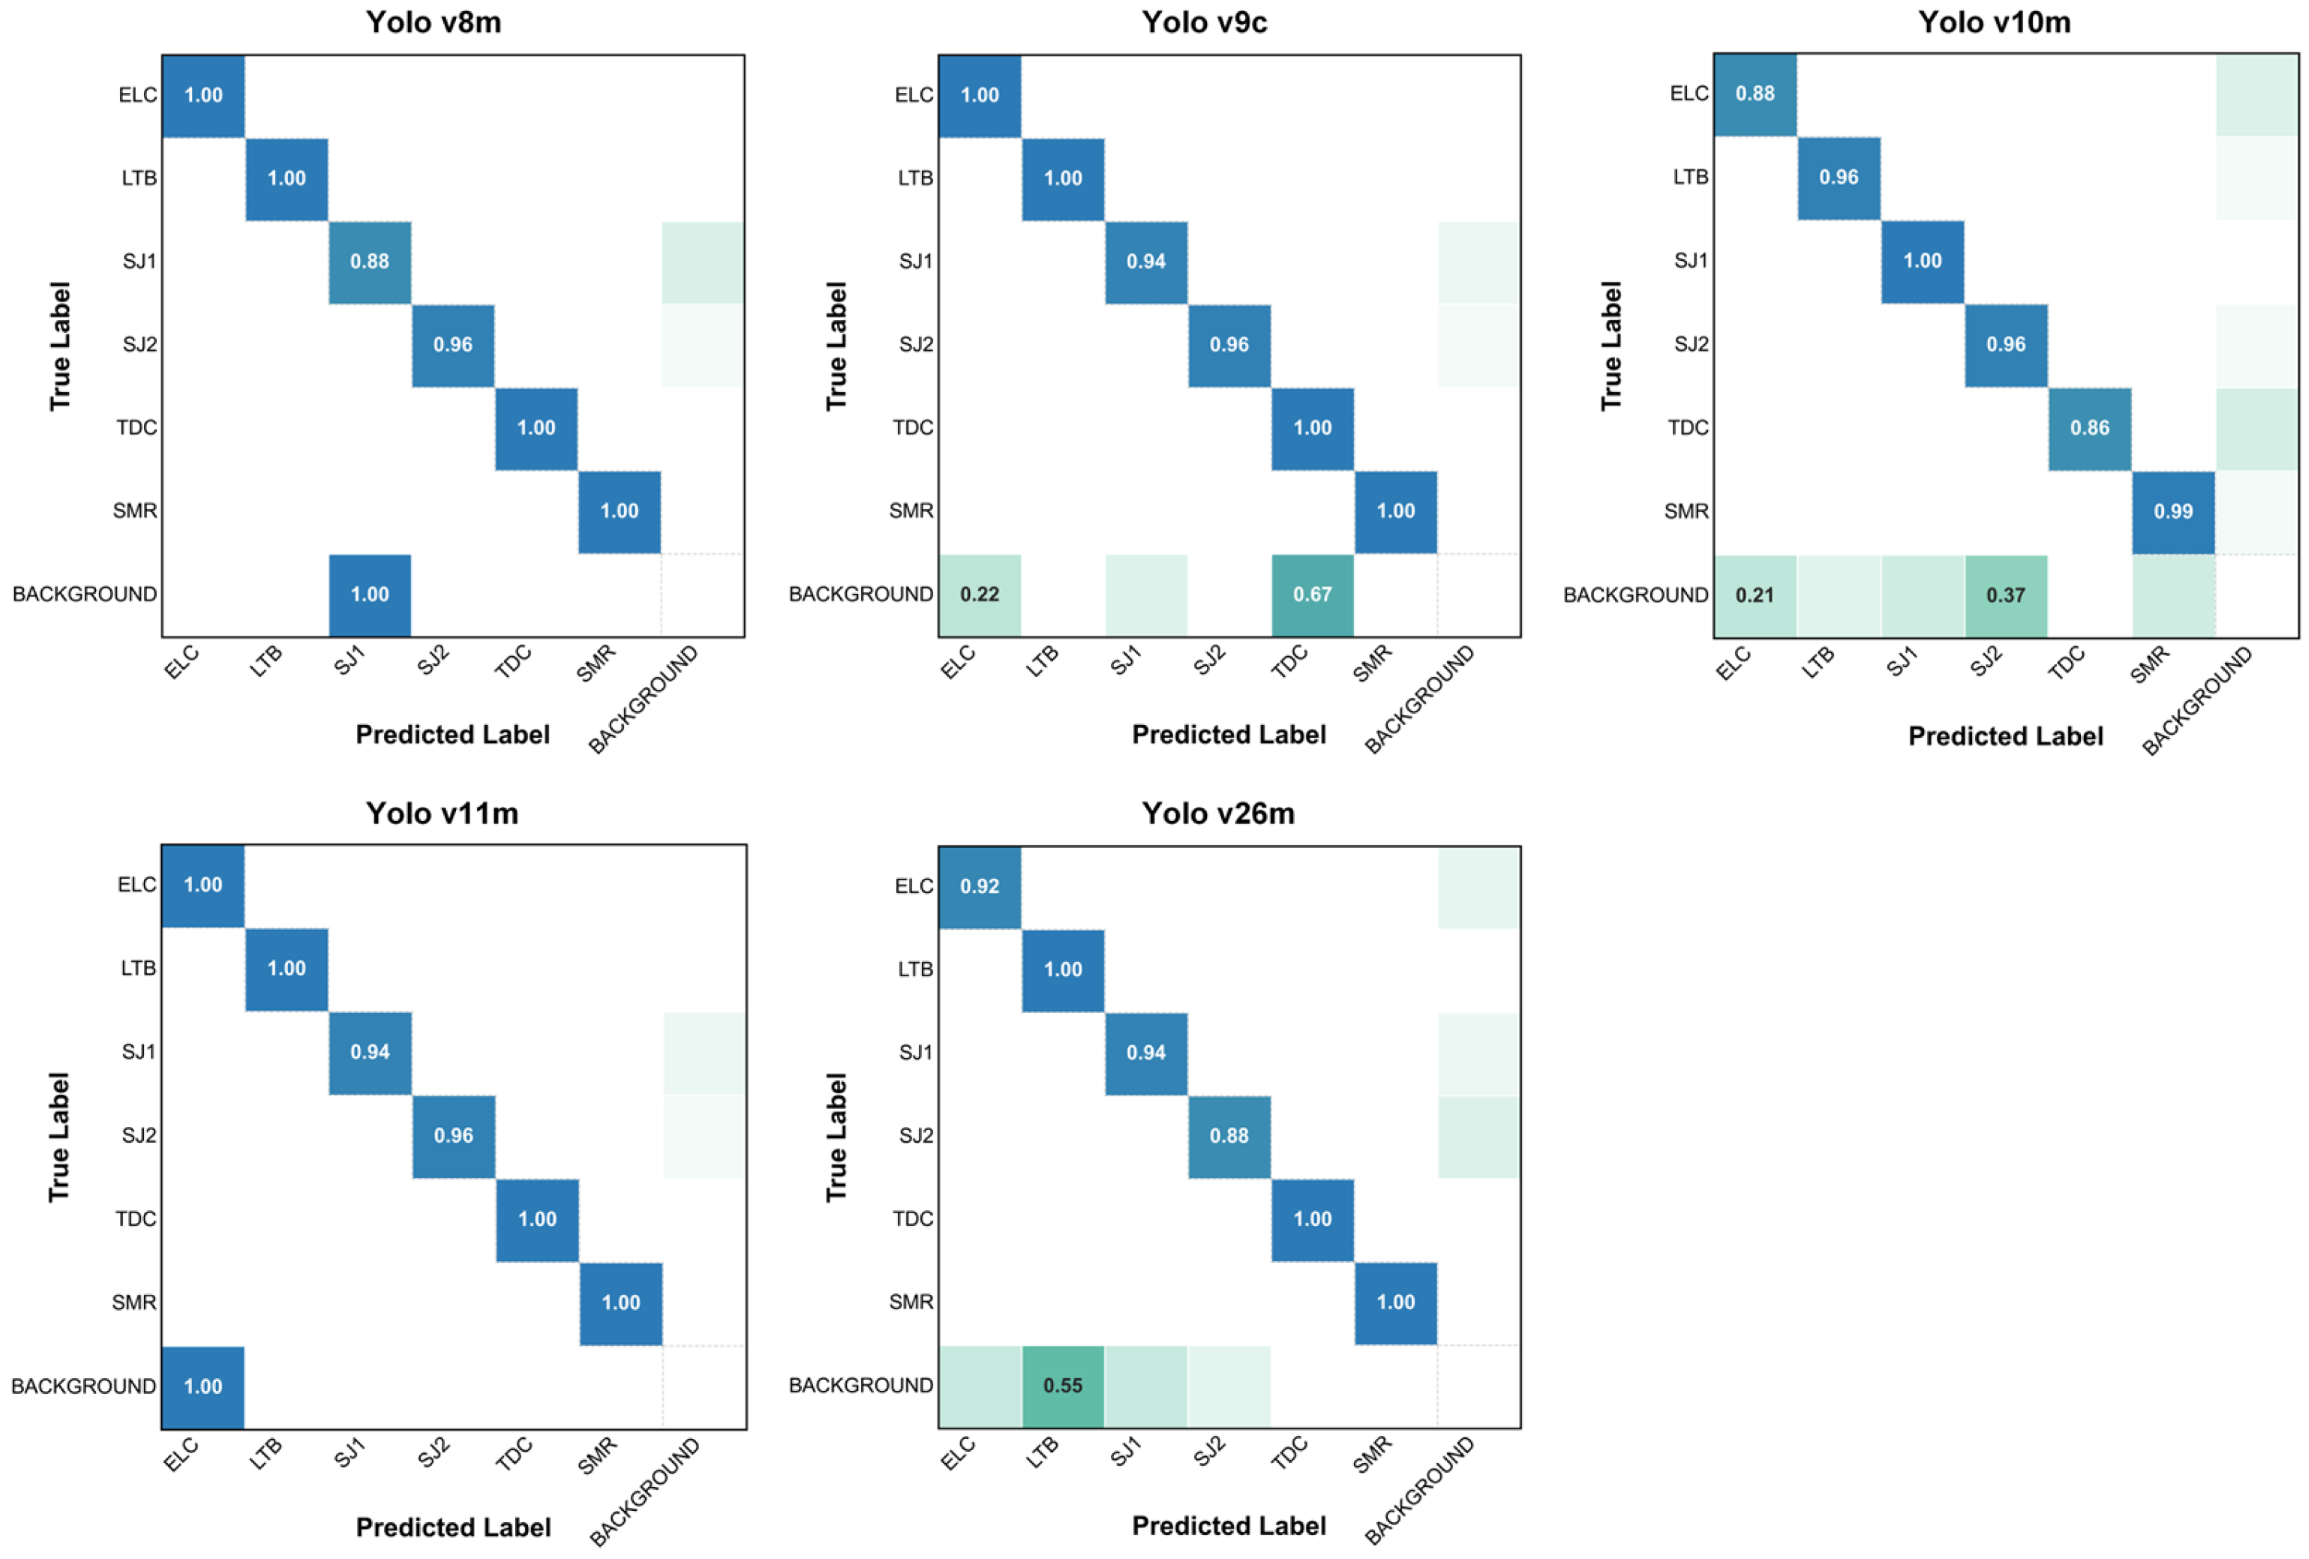
Figure 3 shows the normalized confusion matrices for the six tampering feature predictions by the five baseline models across the 5-fold cross-validation, detailing the models’ recognition blind spots and discriminative tendencies among fine-grained categories. The matrices reveal that the leading models possess extremely strong feature recognition and background decoupling capabilities. YOLOv11m and YOLOv8m exhibited the most outstanding performance. Specifically, YOLOv11m achieved a perfect true positive rate of 1.00 across the four categories of ELC, LTB, TDC, and SMR, with only minor missed detections in the fine-grained SJ1 and SJ2 classes (exhibiting minimal false negative proportions of 0.06 and 0.04, respectively).
It is highly notable that direct misclassifications between different tampering categories (inter-class errors) are virtually nonexistent across the top models. The rare errors observed are almost entirely isolated to the BACKGROUND class. For instance, in YOLOv8m, the extremely challenging fine-grained SJ2 category showed a false negative proportion of merely 0.04, with zero confusion with any other tampering types. Conversely, YOLOv10m, aligning with its overall lower performance metrics, exhibited slightly more confusion with the background, producing higher proportions of False Positives and False Negatives.
These results indicate that the dataset not only excels in facilitating the absolute distinction between various tampering methods, but the high-resolution images it provides are also sufficient to support computer vision algorithms in extracting fine-grained features and precisely locating sub-millimeter minute tampering traces, effectively isolating them from complex, legitimate circuit board backgrounds.
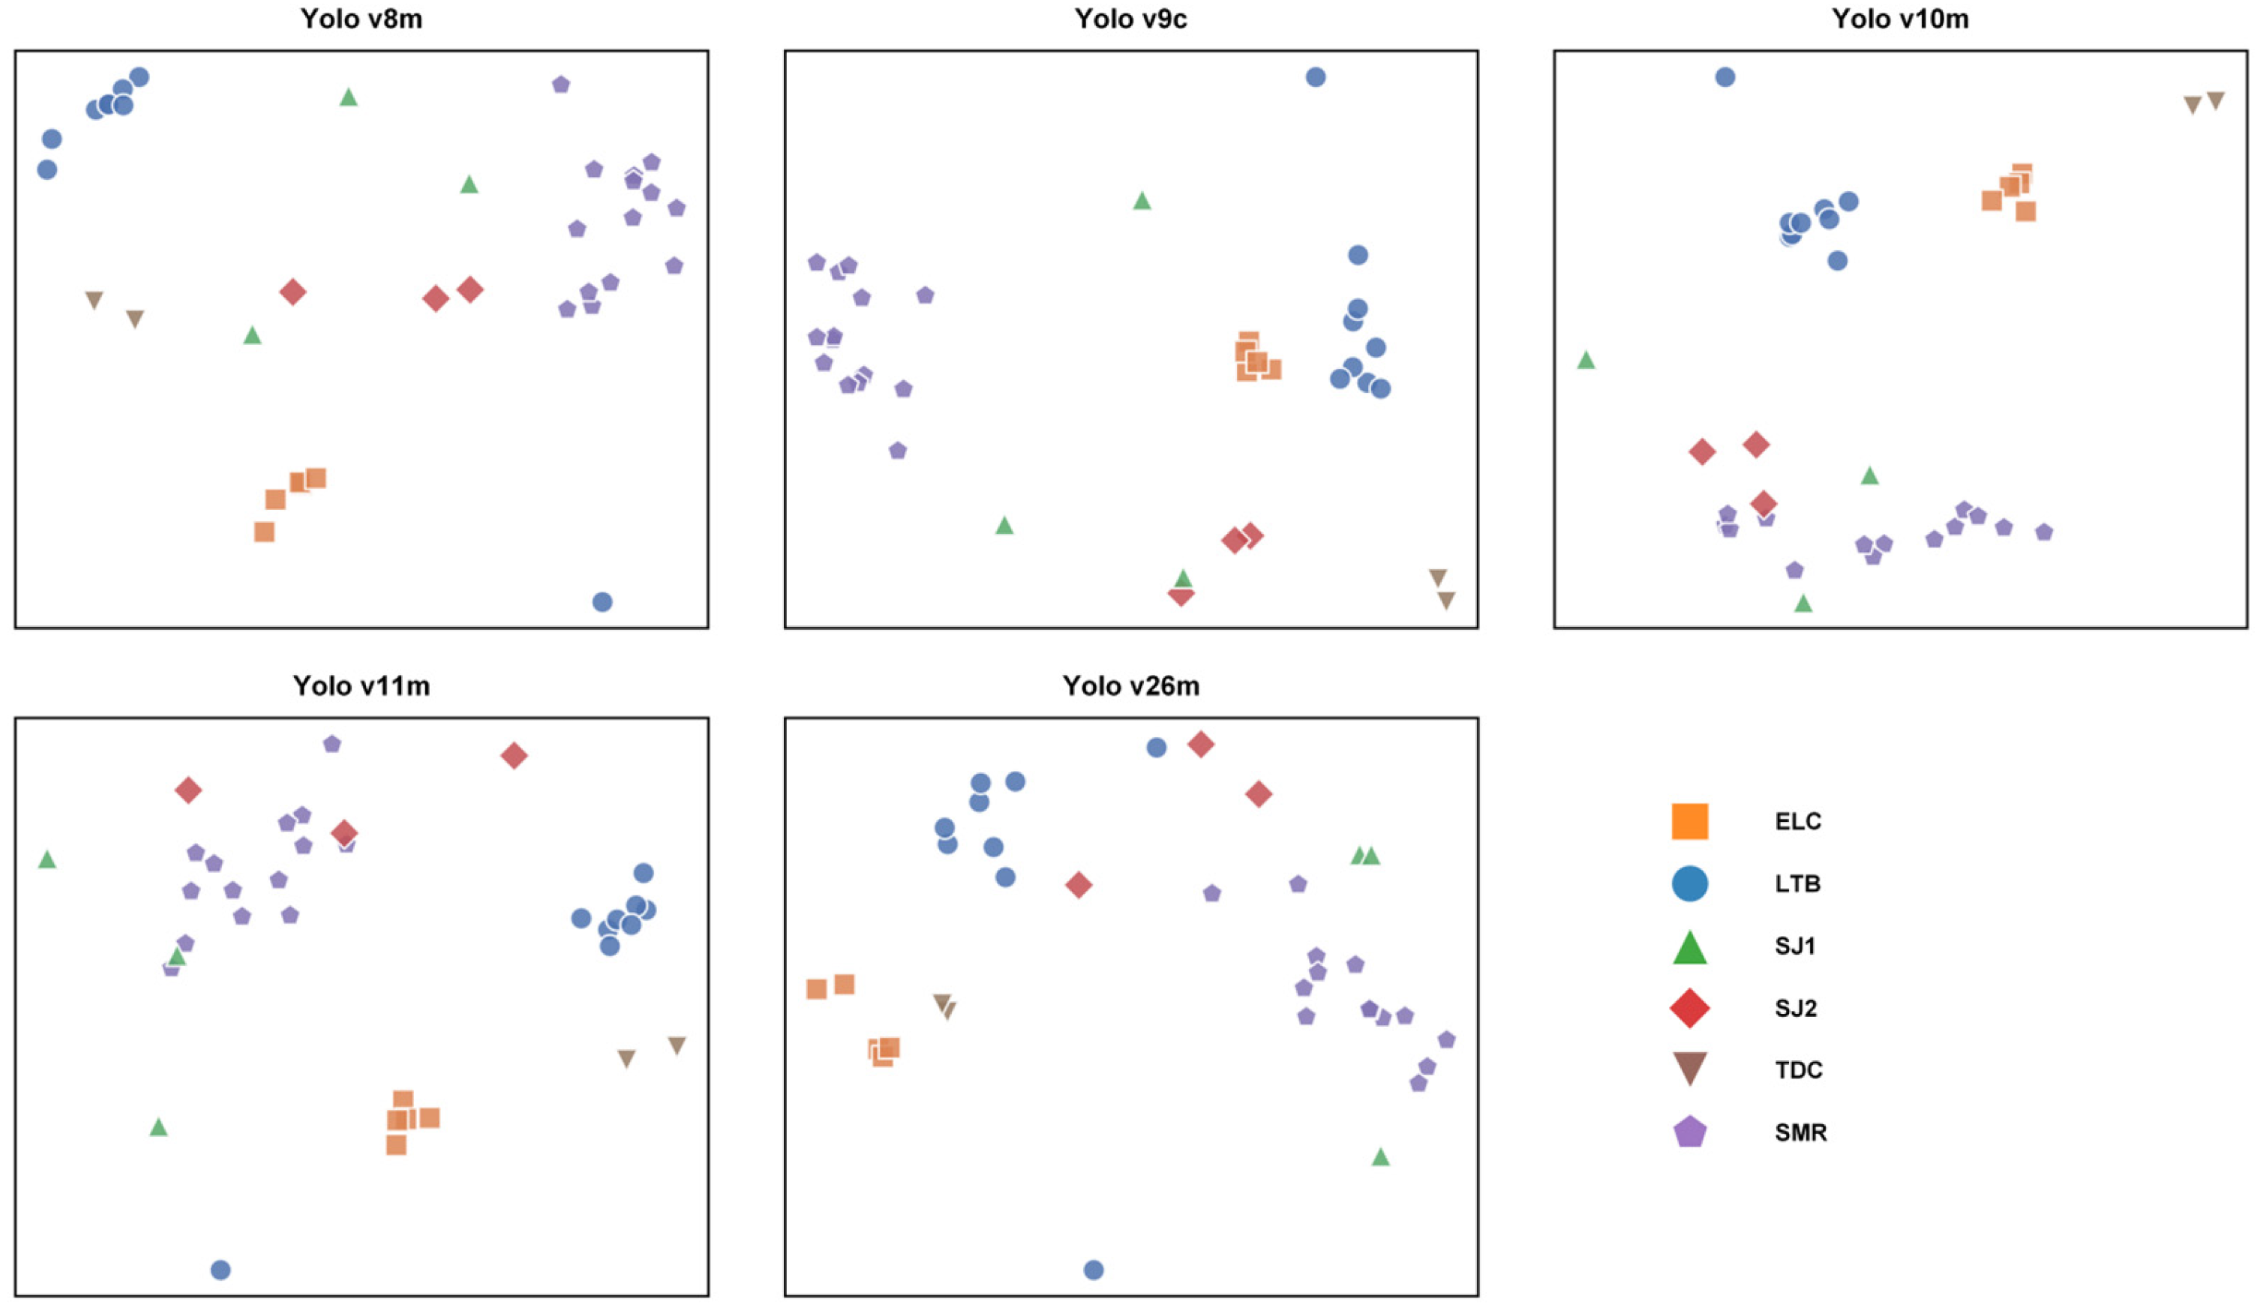
To further qualitatively evaluate the discriminative ability of the features extracted by each object detection model, t-distributed Stochastic Neighbor Embedding (t-SNE) technology [
24] was utilized to reduce the dimensionality of the high-dimensional features extracted by the 5 YOLO models on the first fold validation set. These reduced features were then visualized in 2D scatter plots, as shown in
Figure 4. The following conclusions can be drawn from this visualization:
Outstanding Feature Separability: All 5 models are capable of mapping the 6 tampering features (ELC, LTB, SJ1, SJ2, TDC, SMR) into relatively independent feature clusters in the 2D space. Each category of features exhibits high intra-class cohesion and significant inter-class separation. This qualitatively provides direct proof that the images and annotations in the FD-TamperBoard dataset are of extremely high quality, enabling models to learn highly discriminative feature representations from them.
Feature Space Mapping of Model Performance: The t-SNE visualization distributions highly align with the classification performance metrics presented in
Table 3. Consistent with its superior classification metrics, YOLOv11m (alongside YOLOv8m) exhibits the most ideal feature clustering effects, with distinct cluster boundaries for most categories and high intra-class cohesion. In contrast, some category feature distributions in YOLOv10m, YOLOv26m, and YOLOv9c show a more noticeable dispersion trend in the 2D space, which visually explains the lower stability and accuracy observed for these models.
High Separability for Fine-Grained Features: Notably, even fine-grained tampering features that are visually confusing or extremely small in physical size (such as tampered solder joints SJ1 and SJ2, and surface mount resistor SMR) can still be effectively isolated by the models in the feature space without severe feature aliasing phenomena. Meanwhile, features with substantial inherent visual differences (such as ELC and LTB) maintain extremely large Euclidean distances in the space.
5. Limitations
It should be noted that most tampering feature categories in FD-TamperBoard are intrinsically brand-specific. For example, SMR is exclusively observed in Brand C, while LTB is unique to Brand A. Additionally, owing to the forensic nature of the collection process, completely unmodified (non-tampered) boards are scarce. This limits the dataset’s capacity for straightforward side-by-side comparative analysis (normal vs. tampered) for every brand. Furthermore, because the images were acquired following strict forensic evidence-gathering protocols, the dataset consists exclusively of high-quality, stable, and well-lit photographs. It does not include samples with severe environmental degradation, such as motion blur from vibrations or extreme low-light conditions. While this accurately reflects regulatory inspection standards, it limits the dataset’s applicability for developing algorithms intended for casual, in situ detection under uncontrolled environments. Combined with the relatively small total instance count (203 annotations) and the limited sample size of certain fine-grained categories, the current dataset is not designed to support strong cross-brand generalization claims. Instead, the primary contribution lies in providing a high-quality, multi-brand benchmark for detecting known tampering behaviors within the scope of the covered brands. Future expansions with balanced, large-scale samples across brands would be required to rigorously evaluate cross-brand transferability.





 ,
,