1. Introduction
Performance indicators are widely used to predict team success in elite football [
1,
2]. These metrics assess various aspects of sporting performance and support the optimisation of both individual and collective outcomes [
2,
3,
4,
5,
6]. Common indicators include ball possession, passes, shots, and goals, which are closely associated with match outcomes [
3,
4,
5,
7,
8,
9,
10,
11]. While many studies have explored these relationships, few have specifically focused on champion teams, limiting our understanding of what drives title-winning performance [
9,
12,
13].
Among these indicators, ball possession has attracted considerable research attention, generally being associated with control of play and offensive organisation. It enhances the creation of scoring opportunities while influencing the opposing team’s strategy [
1,
2,
6,
13,
14,
15,
16]. The strategic significance of this variable is exemplified by the success of teams such as F.C. Barcelona and the Spanish national team, whose playing style emphasises possession and the management of game tempo [
2,
17,
18,
19,
20,
21,
22]. Conversely, a direct playing style, characterized by longer passes, rapid transitions, and a focus on advancing the ball into advanced areas with minimal buildup, represents an alternative tactical approach that also yields success, as evidenced by teams in various leagues [
18,
22]. The effectiveness of either style is highly context-dependent, influenced by team composition and opponent strategy, and understanding which styles and indicators contribute to champion-level success requires examining elite teams specifically, rather than general league averages.
Nonetheless, football is characterised by a low goal frequency, with goals occurring in approximately 1% of ball possessions in elite-level matches [
23]. This underscores the importance of the quality of offensive actions, particularly the effectiveness of finishing, in securing positive outcomes such as victories [
24,
25]. Although successful teams generally exhibit higher ball possession [
1,
2,
19,
20,
21,
26,
27], recent evidence suggests that possession alone does not necessarily lead to a greater number of shots or goals [
18,
19,
20,
22,
28]. Therefore, to better understand what drives the success of champion teams, it is important to consider indicators of chance creation and shot quality, rather than relying solely on goals scored. A notable example is the France National Team, winners of the 2018 World Cup, which recorded less than 50% possession per game, highlighting that possession quantity alone is insufficient to predict match success. This case underscores the importance of analysing not only the quantity but also the quality and specific characteristics of ball possession [
8,
22,
28].
Offensive effectiveness, defined as the capacity to consistently create and successfully convert scoring opportunities, constitutes a central axis of tactical organization in football [
4]. While goal scoring represents the ultimate performance outcome, an exclusive focus on goals may obscure the underlying processes and performance determinants that enable champion teams to achieve sustained success. Match outcomes are closely linked to finishing efficiency [
3,
4,
5], and pre-goal indicators such as the number and quality of passes, shots on target, crosses, and expected goals (xG) provide a more accurate understanding of offensive performance than raw goal counts [
1,
7,
8,
14,
29,
30,
31,
32]. Among offensive actions, crosses have been identified as particularly relevant for generating scoring opportunities, with their effectiveness demonstrated across various competitive contexts [
7,
8,
31,
32].
In addition to offensive indicators, defensive performance plays a decisive role in the success of football teams [
33,
34,
35,
36]. Defensive metrics such as tackles, interceptions, clearances, duels won, ball recoveries, ball losses, fouls committed, shots conceded, and goals conceded enable the assessment of a team’s effectiveness in limiting the opponent’s scoring opportunities, maintaining collective organisation, and transitioning to attack [
19,
21,
37,
38,
39,
40,
41]. Recent evidence indicates that success is not solely determined by the number of defensive actions, but rather by their efficiency, timing, and situational execution [
21,
35,
42,
43]. Considering these metrics is essential to understand the defensive foundations of title-winning performance.
Analysing indicators such as duels won, interceptions, shots conceded, and goals conceded provides insight into both individual defensive ability and overall team cohesion. Meanwhile, metrics like ball losses and fouls committed reveal potential vulnerabilities exploitable by opponents [
33,
34,
39]. Thus, the quality and contextual execution of defensive actions are more critical than their quantity, directly influencing team success. These insights are essential for tactical decision-making and opponent analysis [
19,
33,
34,
39,
40,
41]. Studies conducted across various leagues and international competitions have consistently identified these indicators as key predictors distinguishing winning from losing teams [
1,
9].
Moreover, performance indicators are influenced by contextual factors such as match location (home vs. away) and the quality of the opposition [
44,
45,
46]. Studies have shown that these situational variables can affect technical, tactical, and physical performance, prompting teams to adjust their play accordingly [
14,
45,
47,
48,
49]. In analyses of champion teams, accounting for such context is crucial, as the same performance metric may have different implications depending on the competitive context [
46,
48,
49,
50].
In elite football, research has increasingly focused on identifying key performance indicators (KPIs), defined as the factors most directly associated with team or player success [
42,
43,
51]. Advanced modelling techniques have been employed to enhance the predictive understanding of KPIs for football teams [
4,
52,
53]. However, few studies have specifically applied these approaches to champion teams across multiple elite leagues in a single season, leaving a gap in understanding the determinants of title-winning performance. A detailed understanding of these indicators is critical for technical staff to identify player and team strengths and weaknesses, enabling the development of performance profiles that support elite performance [
24,
25,
51,
54].
Statistical methods, including regression analysis, have proven useful for understanding how performance indicators influence competitive success in elite football [
10,
55]. Predictive analytics has become a key tool, converting data into tactical and operational insights that directly impact performance [
53]. Techniques such as regression, classification, and supervised machine learning have been applied to forecast match outcomes and anticipate individual player performance [
52,
53,
56]. However, the direct application of these analytical approaches to explore the relationship between performance indicators and match outcomes remains limited [
4].
Previous studies have applied predictive models to performance indicators in football [
4,
10,
52,
53,
57], but these often focus on general league samples, tournaments, or comparisons between winners and losers. The independent influence of KPIs on champion team success, however, remains underexplored. Title-winning teams may differ fundamentally from other teams due to distinct tactical philosophies and higher technical proficiency.
In sports analytics research, performance data are inherently hierarchical, with match observations nested within teams and teams nested within competitions [
8]. This nested structure violates the assumption of independent observations, requiring analytical techniques such as clustered standard errors to obtain valid variance estimates [
58]. Furthermore, current best practices distinguish between exploratory modelling, which aims to identify associations and generate hypotheses, and predictive modelling, which focuses on out-of-sample forecasting. The present study adopts an exploratory approach, and therefore model validation emphasises goodness-of-fit, the proportional odds assumption, and consistency across stratified contexts rather than external predictive validation procedures such as cross-validation or temporal splits.
To address this gap, the present study undertakes an exploratory investigation aiming to: (i) quantify the relationship between offensive and defensive indicators and match outcomes specifically for champion teams; (ii) develop and apply an ordinal logistic regression model to identify the most robust indicators of success and estimate their probabilistic impact (Odds Ratios); and (iii) examine how these relationships are moderated by match location (home vs. away) and opponent quality (high, medium, low). This analysis focuses on the champion teams from the five major European leagues in the 2023–2024 season, providing an exploratory, model-based profiling of elite performance.
2. Materials and Methods
2.1. Sample
The study analysed a full season (2023–2024) of champion teams from the five major European leagues according to the UEFA ranking (England, Spain, Germany, Italy, and France), totalling 182 matches. The sample comprised the following teams: Manchester City (Premier League), Real Madrid (LaLiga), Bayer Leverkusen (Bundesliga), Internazionale (Serie A), and Paris Saint-Germain (Ligue 1).
This study intentionally focuses exclusively on champion teams to establish a high-performance benchmark. The aim is to identify the specific performance indicators that characterize title-winning sides at the highest level, providing a reference model for elite performance rather than a broadly generalizable template for all teams. This approach allowed for a focused analysis of the metrics that differentiate top-tier teams, though it limits the generalisability of findings to mid-table or lower-ranked squads, a point acknowledged in the study’s limitations (
Section 5). Accordingly, this study adopts an elite-level reference model aimed at characterising the performance profile of championship-winning teams.
2.2. Data Collection and Analysis of Matches
The match data were collected using Wyscout
®, a specialised football data platform that provides validated metrics widely used in sports research and has demonstrated high reliability and validity in prior studies [
59,
60,
61]. The reliability of Wyscout
® data has been empirically established, with Pappalardo et al. [
59] reporting an inter-operator agreement rate of 0.70 for event data. Additionally, Cao [
61] validated passing event identification, confirming high consistency across matches. This is particularly relevant as passes represent approximately half of all recorded events in the Wyscout
® database [
59,
60].
To characterise the performance of the champion teams, a comprehensive set of technical indicators was collected and subsequently grouped into offensive and defensive dimensions:
Offensive indicators: ball possession (%), total passes, successful passes, total crosses, crosses resulting in shots, total shots, shots on target, goals scored and expected goals (xG).
Defensive indicators: ball losses, ball recoveries, interceptions, total duels, duels won, fouls committed, total shots conceded, shots on target conceded, goals conceded, yellow cards, and red cards.
2.3. Statistical Analysis
To characterise the performance indicators of champion teams, descriptive statistics were calculated, including the mean (M), standard deviation (SD), and coefficient of variation (CV), allowing for a detailed analysis of the central tendency and dispersion of the data. The univariate normality of continuous variables was assessed using the Shapiro–Wilk test [
62,
63]. Associations between performance indicators and match outcomes (win, draw, loss) were examined using Spearman’s rank correlation coefficient (ρ), which is appropriate for variables that do not meet the assumption of normality. The strength of the associations was classified according to the Hopkins scale [
64]: very weak (ρ < 0.1), weak (0.1 < ρ ≤ 0.3), moderate (0.3 < ρ ≤ 0.5), strong (0.5 < ρ ≤ 0.7), very strong (0.7 < ρ ≤ 0.9), almost perfect (ρ > 0.9), and perfect (ρ = 1.0).
To identify performance indicators associated with match outcomes, independent ordinal logistic regression analyses were conducted for offensive and defensive indicators, considering the match result as an ordered dependent variable (defeat < draw < victory) [
65]. This approach was selected because match outcomes are inherently ordered, enabling the estimation of cumulative probabilities for higher outcome categories [
58,
63,
64].
Analyses were performed for three distinct contexts: (i) overall performance, (ii) stratified by match location (home vs. away), and (iii) stratified by opponent quality (high, medium, low). Opponent quality was determined based on the final league ranking of each opponent at the end of the 2023–2024 season. Teams were classified as high (top 6), medium, or low (bottom 6), with thresholds adjusted according to the number of teams in each league (e.g., medium corresponded to positions 7–14 in 20-team leagues and 7–12 in 18-team leagues), following established methodological approaches in football performance research [
66].
Regression coefficients (β), standard errors (SEs), Wald χ2 values, odds ratios (ORs), and 95% confidence intervals (95% CIs) were reported, allowing for a quantitative interpretation of the effect of each indicator on the probability of victory. Model evaluation included comparison with the null model using the likelihood ratio test, assessment of explanatory power through the Cox and Snell and Nagelkerke pseudo-R2 values, verification of model fit using the Deviance and Pearson statistics, and confirmation of compliance with the proportional odds assumption via the test of parallel lines, thereby ensuring the validity of the ordinal regression model. Given the exploratory aim of the study, model evaluation focused on goodness-of-fit statistics (Deviance, Pearson), Nagelkerke pseudo-R2, and the proportional odds assumption, rather than on external predictive validation.
All continuous variables were standardised (z-scores) prior to analysis. This transformation ensures that coefficients are comparable across indicators measured on different scales (e.g., possession percentage, pass counts, expected goals), as each coefficient represents the effect of a one-standard-deviation increase in the respective predictor.
Given the hierarchical structure of the data, where multiple match observations belong to the same team, the assumption of independent observations is violated. Ignoring this dependence would produce underestimated standard errors and inflated Type I errors. To address this, we employed robust standard errors clustered at the team level, which account for within-team correlation and provide more accurate variance estimates [
58,
63].
To further assess the robustness and stability of model estimates, bootstrap resampling (1000 samples) was performed as a sensitivity analysis. However, convergence issues and instability in several parameter estimates were observed across bootstrap replications, particularly in models with sparse outcome categories and high parameter complexity. Therefore, bootstrap results were not used as the primary basis for inference but are reported in the
Supplementary Materials to support transparency and allow evaluation of parameter stability (see
Supplementary Materials Tables S3b–S8b).
Prior to regression analyses, multicollinearity was formally assessed using the variance inflation factor (VIF). Variables with VIF > 10 (total passes and successful passes) were removed from the final models due to severe multicollinearity. Additionally, to avoid conceptual overlap with match outcome, goals scored and goals conceded were also excluded from the main regression models (see
Supplementary Materials Tables S1 and S2).
To verify that the exclusion of goals scored and conceded from the main models did not alter the interpretation of the remaining performance indicators, supplementary ordinal regression analyses including these variables were conducted as a robustness check (see
Supplementary Materials Tables S3a–S8a).
A separate model specification was adopted for offensive and defensive indicators. This decision was made for three primary reasons: (i) conceptual clarity, allowing for the isolated interpretation of each performance dimension without potential suppression effects between theoretically distinct indicators; (ii) model simplicity, reducing model complexity and parameter count to mitigate the risk of overfitting given the sample size; and (iii) multicollinearity mitigation, as offensive and defensive indicators are conceptually independent and including them together could introduce redundancy without theoretical justification.
All statistical analyses were conducted using IBM SPSS® Statistics (version 29.0), with the level of significance set at p ≤ 0.05.
2.4. Ethical Approval
This study was conducted in accordance with the Declaration of Helsinki and approved by the Ethics Committee of the Faculty of Sport Sciences and Physical Education, University of Coimbra (reference number CE/FCDEF-UC/0013/2025; approved on 12 December 2024). Informed consent was not required due to the use of anonymized, commercially available match data.
3. Results
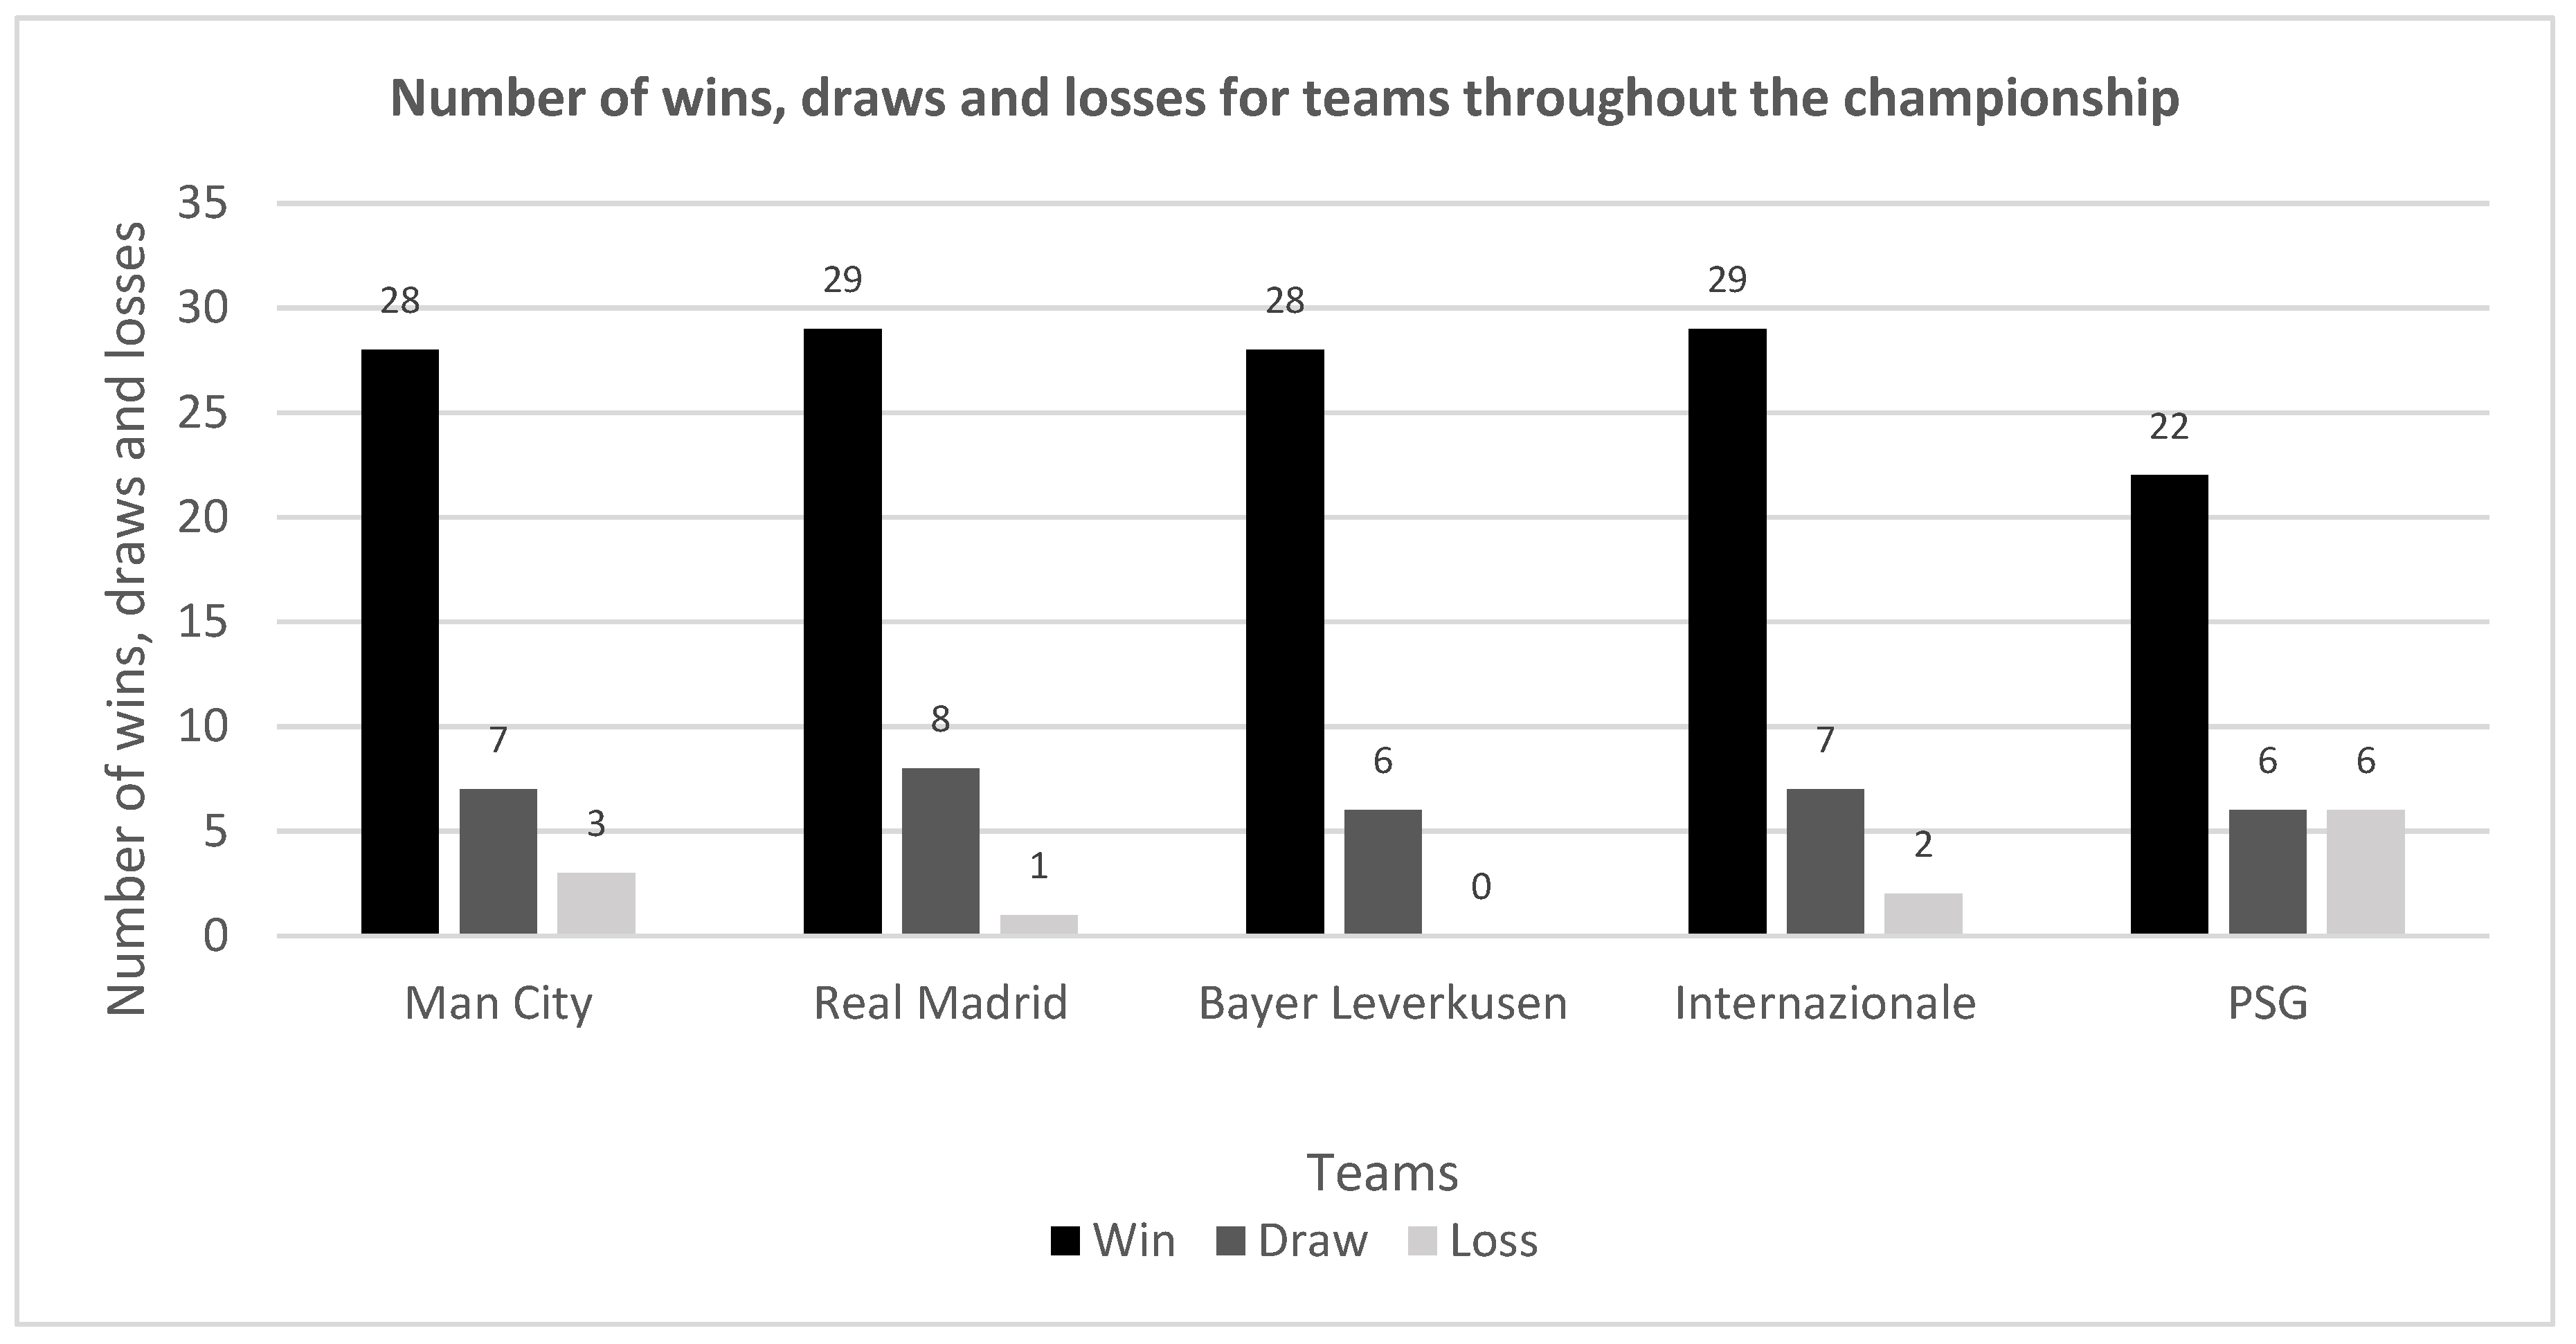
Figure 1 illustrates the total number of wins, draws, and losses for each team across the championship season.
The results indicated that, across the championship, champion teams recorded 136 wins (74.73%), 34 draws (18.68%), and 12 defeats (6.59%). Individually, Real Madrid and Internazionale were the teams with the highest number of wins (29 each–76, 32%), while Bayer Leverkusen was the only team without any defeats. PSG, on the other hand, was the team with the highest number of defeats (6 losses–17, 65%).
3.1. Offensive and Defensive Performance Indicators
This subsection presents the descriptive statistics (mean, standard deviation, coefficient of variation) for the offensive and defensive performance indicators of the champion teams, providing a foundational overview of their playing profiles.
Table 1 presents the descriptive statistics, including mean (M), standard deviation (SD), and coefficient of variation (CV), for the offensive performance indicators analysed in champion teams across the season in the main professional football leagues.
Analysis of offensive performance indicators revealed that teams maintained an average of 60.00% ball possession throughout the competition. In this context, Manchester City recorded the highest average (65.12%), whereas Internazionale registered the lowest (55.14%), highlighting differences in the teams’ capacity to control possession.
The total number of passes averaged 628.79 per match (SD = 9.64; CV = 20.30%). In this parameter, Manchester City stood out for having the highest number of passes in the competition (T = 25,540; M = 672.11), while PSG had the best average per game (M = 677.00). This pattern persisted when analysing passing effectiveness: the overall average number of successful passes was 565.74 per match (SD = 125.62; CV = 22.21%), with Manchester City recording the highest value (T = 23,202; M = 610.58) and Internazionale the lowest (T = 18,275; M = 480.92). Regarding crosses, the teams recorded an overall mean of 15.45 per match (SD = 7.89; CV = 51.07%), with Internazionale registering the highest number of crosses both per match and across the competition as a whole (T = 679; M = 17.87), while PSG recorded the lowest values, reflecting differences in offensive width strategies.
In terms of offensive production, measured by the total number of shots, teams averaged 15.73 shots per game (SD = 5.45; CV = 34.71%), with Manchester City standing out for the highest volume (T = 658; M = 17.32). While this indicator reflects the overall volume of shots, it is equally important to consider their effectiveness, as assessed by the number of shots on target. The overall mean number of shots on target was 6.30 per game (SD = 2.78; CV = 44.11%), with Manchester City recording the highest figure (T = 274; M = 7.21) and PSG the lowest (T = 189; M = 5.56), reinforcing the trends observed in total offensive production.
Finally, the analysis of offensive effectiveness, measured by goals scored, further substantiated these observations. The overall mean was 2.43 goals per game (SD = 1.36; CV = 55.83%), with Manchester City scoring the most goals (T = 96; M = 2.53) and PSG the fewest (T = 81; M = 2.38), highlighting the consistently strong offensive performance of the teams throughout the competition. Complementing this analysis, expected goals (xG), which reflects the quality of scoring opportunities, averaged 2.14 per game (SD = 0.99; CV = 46.43%). Manchester City recorded the highest average xG (M = 2.30), while Real Madrid registered the lowest (M = 2.00). The difference between actual goals scored and xG varied across teams, with Bayer Leverkusen showing the largest positive differential (+0.35 goals per game).
Table 2 shows the descriptive statistics, including mean (M), standard deviation (SD), and coefficient of variation (CV), for the defensive performance indicators analysed in champion teams across the season in the main professional football leagues.
Analysis of defensive indicators revealed that teams recorded a total of 16,407 ball losses throughout the competition (M = 90.15; SD = 13.38; CV = 14.84%). Within this parameter, Internazionale stood out with the highest values in the competition overall (T = 3319) and PSG recorded the highest average number of ball losses per match (M = 96.97), while Real Madrid recorded the lowest value, both overall and on average per match (T = 3206; M = 84.37). Regarding ball recoveries, the overall mean was 76.27 per game (SD = 11.25; CV = 14.75%), with Bayer Leverkusen achieving the highest number both per game and across the competition (T = 2874; M = 84.53). On the other hand, the lowest values were presented by Real Madrid (T = 2723; M = 71.66). The average number of interceptions was 34.93 per match (SD = 9.15; CV = 26.18%), with Real Madrid recording the highest number in the competition (T = 1379) and PSG per match (M = 37.12), while the lowest value was presented by Bayer Leverkusen in total for the competition (T = 1207) and by Manchester City on average per match (M = 31.89). Furthermore, the overall mean number of defensive duels was 179.53 per match (SD = 26.20; CV = 14.59%), totalling 32,675 throughout the competition. Real Madrid recorded the highest number of duels both in total (T = 6870) and PSG the best average per match (M = 189.87). Regarding duels won, the overall mean was 88.85 per game (SD = 15.27; CV = 17.19%), totalling 16,170, Real Madrid had the highest total volume in the competition (T = 3426) and PSG had the best average per match (M = 91.91). In terms of fouls committed, the overall mean was 9.42 per game (SD = 3.38; CV = 35.91%), totalling 1715, with Internazionale recording the highest number both per match and overall (T = 405; M = 10.66). Manchester City was the team that committed the fewest fouls in the competition and per match (T = 283; M = 7.45). Finally, for shots conceded, the overall mean was 9.03 per game (SD = 4.61; CV = 51.05%), totalling 1643, with PSG conceding the most per match and in total for the competition (T = 384; M = 11.29). In turn, Bayer Leverkusen was the team that conceded the fewest shots in the competition (T = 263), while Manchester City had the lowest average number of shots conceded per match (M = 7.05).
Considering only shots conceded on target, the overall total was 601 (M = 3.30; SD = 2.35; CV = 71.28%), with PSG recording the highest number (T = 153; M = 4.50) and Manchester City and Internazionale the lowest (T = 111; M = 2.92). Finally, regarding goals conceded, the overall mean was 0.76 per game (SD = 0.86; CV = 112.70%), totalling 139 throughout the competition. Manchester City conceded the most goals in the competition (T = 34) and PSG conceded the highest average per game (M = 0.97), while Internazionale recorded the lowest figures (T = 22; M = 0.58). In terms of discipline, the champion teams accumulated 275 yellow cards (M = 1.51 per game) and 10 red cards (M = 0.05 per game). Real Madrid recorded the most yellow cards (T = 68) and red cards (T = 4), while Bayer Leverkusen completed the season without any red cards.
3.2. Interrelation of Performance Indicators and Their Association with Match Outcomes
Following the descriptive analysis, this subsection examines the bivariate associations between the performance indicators and match outcomes using Spearman’s rank correlation.
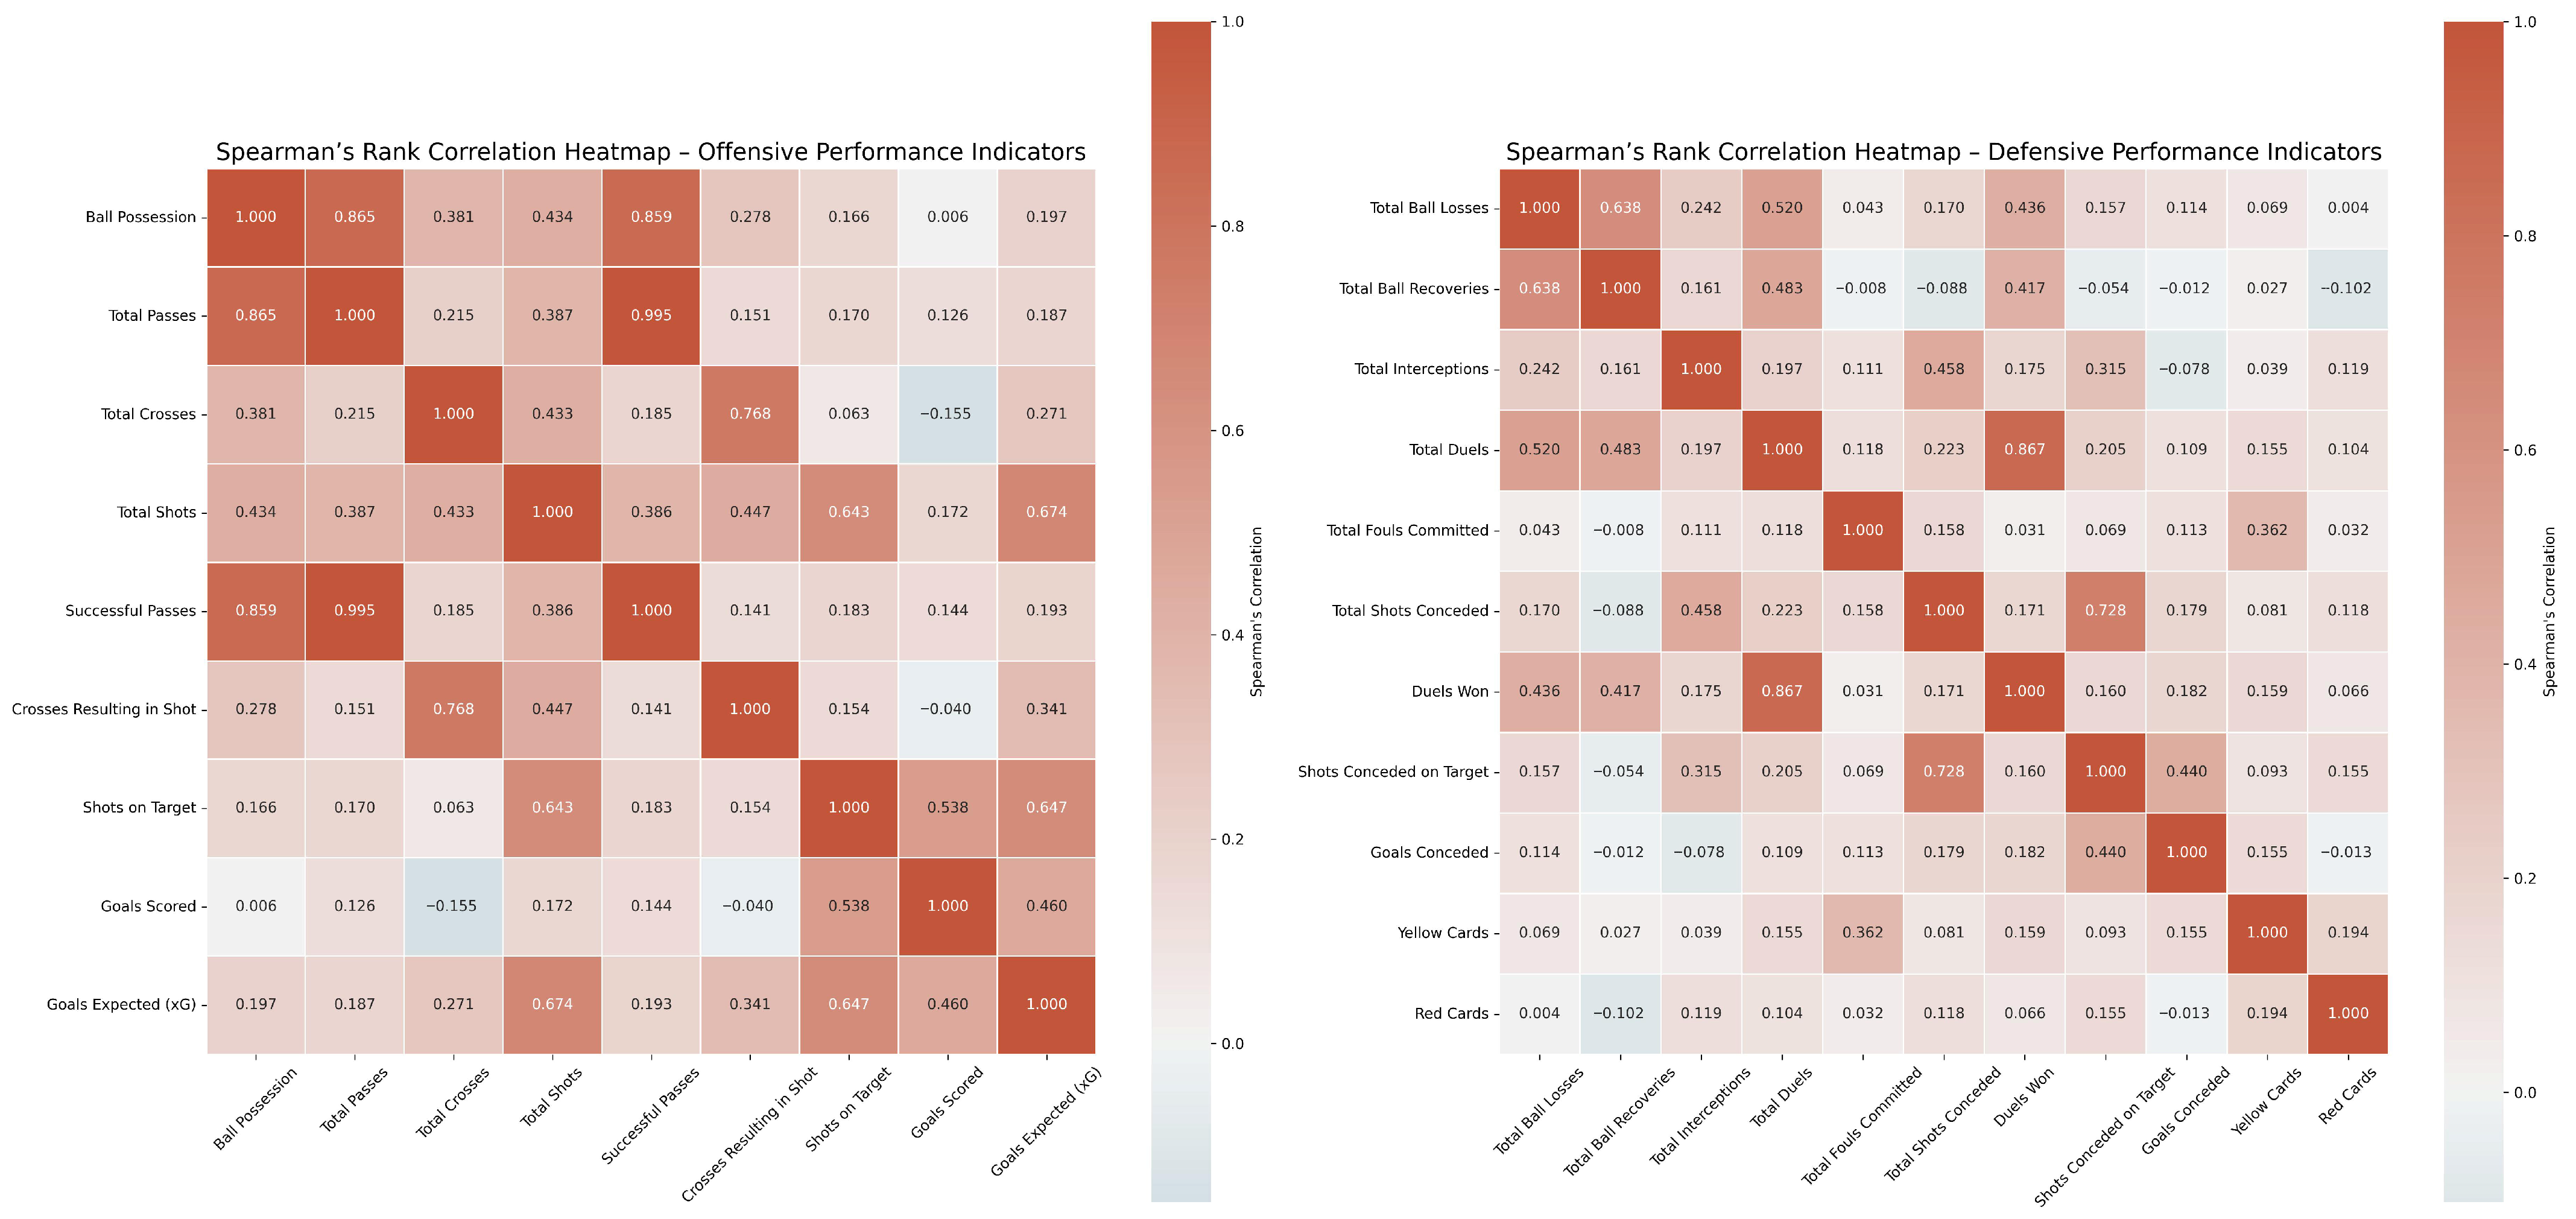
Figure 2 presents a heatmap of Spearman correlations between performance indicators (offensive and defensive metrics) and match outcomes, highlighting significant relationships and their statistical significance levels.
The data revealed significant correlations among both offensive and defensive performance indicators. Offensively, total passes were almost perfectly correlated with successful passes (ρ = 0.995), while ball possession showed very strong correlations with both total passes (ρ = 0.865) and successful passes (ρ = 0.859). Crosses were strongly associated with crosses resulting in shots (ρ = 0.768), and total shots correlated strongly with shots on target (ρ = 0.643) and goals expected (xG, ρ = 0.674). Shots on target were also strongly linked to xG (ρ = 0.647) and moderately to goals scored (ρ = 0.538). Defensively, total duels were very strongly correlated with duels won (ρ = 0.867), while total ball losses correlated with total ball recoveries (ρ = 0.638) and duels (ρ = 0.520). Shots conceded were strongly associated with shots on target conceded (ρ = 0.728) and moderately with interceptions (ρ = 0.458), and shots on target conceded correlated moderately with goals conceded (ρ = 0.440).
The following analysis explores the relationships between key performance indicators and match outcomes across different contexts in football, as summarised in
Table 3.
The data reveal that offensively, goals scored showed the strongest positive correlations with match outcomes, particularly at home (ρ = 0.590 **) and in medium-level matches (ρ = 0.512 **). Shots on target were moderately associated with outcomes in high- (ρ = 0.406 **) and low-level matches (ρ = 0.684 **). Total crosses exhibited a significant negative correlation overall (ρ = −0.457 **), while crosses resulting in shots showed a negative association overall (ρ = −0.398), although not statistically significant. Defensively, goals conceded were consistently negatively correlated with match outcomes across most contexts (ρ = −0.295 * to −0.463 **), and shots conceded on target and total ball losses also displayed moderate negative associations in specific contexts (e.g., Total Ball Losses Overall: ρ = −0.337 **; Shots Conceded on Target, Home: ρ = −0.301 **). Collectively, these findings underscore that offensive efficiency and defensive solidity are key determinants of competitive success.
3.3. Performance Indicators Associated with Match Outcomes
The association between offensive and defensive performance indicators and match outcomes (loss < draw < win) was examined using ordinal logistic regression. Analyses were conducted for overall performance, match location (home vs. away), and opponent quality (high, medium, low). Continuous variables were standardised (z-scores), and robust standard errors were clustered by team.
The stratified analysis revealed that offensive and defensive indicators vary substantially in importance according to context. Shots on target emerged as a key predictor at home and against low-quality opponents, whereas expected goals (xG) gained relevance in away matches. In defensive terms, interceptions proved influential in away matches and against high-quality opponents, while fouls committed and yellow cards were particularly detrimental against medium-quality opponents. Against low-quality opponents, defensive stability, reflected in shots conceded, shots on target conceded, and red cards, became a critical differentiating factor. These contextual patterns underscore that the relevance of specific performance metrics is not uniform but rather modulated by match location and opponent strength.
To assess how offensive metrics relate to achieving more favourable match results,
Table 4 presents the effect of each indicator on the likelihood of better outcomes.
The overall model for offensive performance indicators was statistically significant (χ2(6) = 38.704, p < 0.001, Nagelkerke R2 = 0.253), and the proportional odds assumption was satisfied (parallel lines test p = 0.571). Among offensive variables, total crosses were negatively associated with match outcomes (β = −0.790; p = 0.011; OR = 0.454 [0.247–0.832]), indicating that increased crossing frequency reduced the probability of winning. Additionally, shots on target were positively associated with match outcomes (β = 0.904; p = 0.021; OR = 2.468 [1.146–5.317]). Other offensive metrics, including ball possession, total shots, and expected goals (xG), did not show significant effects.
Table 5 summarises the associations between defensive indicators and the likelihood of better match outcomes.
The defensive model was also significant (χ2(10) = 29.169; p = 0.001; Nagelkerke R2 = 0.195; parallel lines test p = 0.323). Significant predictors included interceptions (β = 0.414; p = 0.049; OR = 1.513 [1.001–2.288]), fouls committed (β = −0.547; p = 0.006; OR = 0.579 [0.392–0.856]), and shots on target conceded (β = −0.740; p = 0.003; OR = 0.477 [0.293–0.777]), highlighting that defensive organisation, discipline, and effective ball recovery are key determinants of match success, whereas other actions, such as duels, total shots conceded, and disciplinary variables, were not significant.
Given the number of predictors and stratified models, our interpretation emphasises overall patterns and the consistency of effects across contexts (e.g., home vs. away, opponent quality) rather than relying on isolated individual coefficients. The robustness of these patterns under reasonable alternative specifications is supported by: (i) the sanity check models presented in the
Supplementary Materials (Tables S3–S8), which, despite including goals scored and conceded, show consistent directional effects for most efficiency-based indicators; and (ii) the stratified analyses themselves, which reveal systematic variation in the relevance of specific indicators while maintaining the overarching finding that efficiency-based metrics supersede volume-based indicators.
3.4. Contextual Effects of Performance Indicators on Match Outcome
Before interpreting the stratified results, it should be noted that the proportional odds assumption was violated in some models. For these models, the reported odds ratios represent average effects across cumulative logits (loss vs. draw, draw vs. win) and should be interpreted with caution.
To examine how offensive and defensive indicators relate to match outcomes depending on match location,
Table 6 and
Table 7 present the results for home and away matches.
Results showed that in home matches, only shots on target significantly increased the likelihood of better outcomes (β = 1.324; p = 0.003; OR = 3.757 [1.578–8.944]). No offensive indicators were significant in away matches, highlighting the stronger influence of attacking efficiency in home contexts. However, the proportional odds assumption was violated for the home model (p = 0.015), and therefore results should be interpreted with caution.
The findings reveal that at home, fouls committed (β = −0.735; p = 0.014; OR = 0.479 [0.267–0.862]) and shots conceded on target (β = −1.123; p = 0.014; OR = 0.325 [0.133–0.795]) were significant predictors of match outcomes, highlighting the importance of defensive discipline and reducing opponent shooting efficiency. In away matches, no defensive indicators reached statistical significance, suggesting a weaker influence of defensive performance on outcomes in this context.
To explore how match outcomes are influenced by opponent strength,
Table 8 and
Table 9 present offensive and defensive indicators according to high, medium, and low-quality opponents.
Offensive indicators revealed that against high-quality opponents, both total crosses (β = −1.286; p = 0.030; OR = 0.276 [0.086–0.885]) and crosses resulting in a shot (β = 1.537; p = 0.046; OR = 4.649 [1.028–21.034]) significantly influenced match outcomes. For low-quality opponents, total crosses were also significantly associated with match outcomes (β = −2.276; p = 0.042; OR = 0.103 [0.011–0.917]), indicating a negative relationship between crossing volume and performance outcomes in this context. No other offensive indicators reached statistical significance across opponent quality levels.
Defensive indicators showed context-dependent effects according to opponent quality. Against high-quality opponents, interceptions were marginally significant (β = 0.567; p = 0.050; OR = 1.763 [1.001–3.105]). For medium-quality opponents, fouls committed (β = −0.640; p = 0.020; OR = 0.527 [0.308–0.904]) was the only significant predictor, while yellow cards were not statistically significant. Against low-quality opponents, several indicators were significant, including total shots conceded (β = 2.112; p = 0.002; OR = 8.261 [2.173–31.396]), shots conceded on target (β = −1.512; p = 0.008; OR = 0.220 [0.072–0.678]), and red cards (β = 4.198; p = 0.005; OR = 66.576 [3.522–1258.488]), whereas total ball losses showed only a non-significant trend (p = 0.070).
Overall, these findings indicate that offensive efficiency is primarily expressed through effective shooting and creation of goal-scoring opportunities, whereas defensive performance depends on organisation, discipline, and control of key actions. The influence of specific indicators is modulated by match location and opponent quality, emphasising the context-dependent nature of performance metrics in competitive football.
4. Discussion
This study employed ordinal logistic regression to quantify the key performance indicators predictive of match outcomes for champion teams in Europe’s top leagues. The core findings confirm the paramount importance of goals but advance the field by providing a precise, model-based quantification of their effects and by demonstrating that, for this elite group, efficiency-based indicators overwhelmingly surpass volume-based indicators as independent predictors. The application of this specific regression technique allows for the interpretation of results not merely as associations, but as estimates of how each unit change in an indicator affects the probability of moving from a loss, to a draw, to a win.
The present study offers a contemporary, cross-league perspective on performance determinants in elite football by applying ordinal logistic regression to champion teams from the 2023–2024 season. While the findings confirm the centrality of goal-related metrics, this study provides updated, quantified evidence, specifically through odds ratio, for elite champion teams across five major leagues, addressing a gap in recent multi-league comparative analyses.
4.1. Offensive and Defensive Performance Indicators
Analysis of offensive performance indicators revealed substantial variation among the champion teams, reflecting diverse tactical philosophies. Manchester City stood out with the highest averages in ball possession (65.12%), Successful passes (T = 23,202; M = 610.58), shots (T = 658; M = 17.32), shots on target (T = 274; M = 7.21), goals (T = 96; M = 2.53) and expected goals (xG) (M = 2.30). These results align with a playing model based on sustained possession, enabling teams to control match tempo and create high-quality scoring opportunities [
14,
17,
67].
Conversely, Bayer Leverkusen and Real Madrid achieved lower possession rates (59.95% and 58.25%, respectively) but demonstrated notable efficiency in offensive actions. Bayer Leverkusen, in particular, exhibited the largest positive differential between goals scored and xG (+0.35 goals per game), reflecting superior finishing quality despite creating slightly fewer high-quality chances than Manchester City. This data reinforces evidence that offensive success depends more on finishing quality than possession alone [
18,
20,
22]. On the other hand, shots on goal remain consistently identified as key predictors of match outcomes [
57,
68,
69].
Taken together, these results highlight that assessing offensive performance requires an integrative approach. While possession provides insight into team control and build-up play, efficiency metrics, such as shot accuracy and goal conversion and the ability to exceed expected goals (xG), offer direct indications of a team’s ability to generate scoring opportunities [
10,
14,
17,
18,
20,
22,
67]. In elite football, where marginal differences decisively influence outcomes, integrating efficiency measures provides a more precise assessment of offensive effectiveness and competitive performance [
2,
4,
6,
26].
Having analyzed offensive performance, we next analyzed defensive indicators, which are equally critical for team success. Thus, the analysis revealed marked differences among the champions, reflecting varied defensive strategies. Internazionale recorded the highest total of ball losses (T = 3319), while PSG had the highest average per match (M = 96.97), suggesting a more aggressive or high-risk style. In contrast, Real Madrid showed the lowest totals and averages (T = 3206; M = 84.37), indicative of controlled possession. Bayer Leverkusen led in ball recoveries (T = 2874; M = 84.53), whereas Real Madrid had the fewest (T = 2723; M = 71.66), supporting prior findings that efficient recovery enhances defensive stability and facilitates attack transitions [
36,
39,
70].
On the other hand, interceptions and duels reflect even more defensive approaches, with teams averaging 34.93 interceptions per game, with Real Madrid recording the highest total (T = 1379) and PSG the highest average per game (M = 37.12). Real Madrid led total duels (T = 6870) and duels won (T = 3426), while PSG had the highest per-match averages (M = 189.87 duels; M = 91.91 duels won). These patterns indicate that elite teams combine individual defensive skills with coordinated team organization to limit scoring opportunities [
4,
71].
Fouls committed also reveal strategic differences: Internazionale had the most fouls (T = 405; M = 10.66), reflecting a physical style, whereas Manchester City had the fewest (T = 283; M = 7.45), emphasizing disciplined positioning [
21,
33,
34]. Disciplinary indicators further differentiated teams: Real Madrid accumulated the most yellow cards (T = 68; M = 1.79) and red cards (T = 4), suggesting a more aggressive defensive approach, while Bayer Leverkusen completed the season without any red cards, reflecting greater composure. Regarding shots and goals conceded, PSG allowed the most shots (T = 384; M = 11.29), whereas Bayer Leverkusen and Manchester City had the fewest (T = 263; M = 7.05). PSG also led in shots on target (T = 153; M = 4.50), with Manchester City and Internazionale the lowest (T = 111; M = 2.92). For goals conceded, Manchester City had the highest total (T = 34), PSG the highest per-match average (M = 0.97), and Internazionale the lowest (T = 22; M = 0.58). These findings reinforce that defensive efficiency and situational execution, rather than sheer volume, determine success [
4,
36].
Taken together, champion teams adopt diverse defensive strategies aligned with their tactical philosophy. Real Madrid and PSG prioritize active engagement via duels and interceptions and a more aggressive approach reflected in higher foul and card counts, whereas Manchester City emphasizes structured positional defense and risk management. Ultimately, efficiency, timing, and situational execution of defensive actions are more decisive than quantity, corroborating the importance of high-level defensive performance as a predictor of team success [
21,
35,
37,
38].
These descriptive patterns can be further interpreted through the lens of the teams’ distinct tactical philosophies and the broader styles prevalent in their respective leagues. Manchester City’s dominance in possession-based metrics aligns with the Premier League’s intensity and a “positional play” model that prioritizes ball circulation and controlled buildup to create high-quality chances [
2,
17]. The club’s discipline, fewest fouls and modest card accumulation, further reflects this controlled approach. In contrast, Internazionale’s profile (i.e., lower possession but high defensive solidity and crossing volume) reflects traits associated with defensive organization. Research on defensive performance in elite European leagues has highlighted the importance of structured defending and tactical discipline in limiting opponent scoring opportunities [
33,
34,
35,
36]. Real Madrid’s high volume of duels, interceptions, and cards suggests a more physically assertive style. Bayer Leverkusen’s high ball recovery rate and unbeaten record and notable finishing efficiency (exceeding xG) underscore an effective high-pressing and rapid transition style. Previous studies have demonstrated that high-pressing strategies can disrupt opponent possession and facilitate quick offensive transitions, contributing to team success in elite competitions [
37,
41]. This diversity confirms that multiple tactical pathways, underpinned by core principles of offensive efficiency and defensive organization, can lead to elite success.
4.2. Interrelation of Performance Indicators and Their Association with Match Outcomes
Spearman’s correlation analysis revealed statistically significant associations between various performance indicators and match outcomes. Among the offensive indicators, goals scored (ρ = 0.523;
p < 0.01) exhibited a strong correlation with match outcomes, indicating that increases in this variable significantly raise the probability of victory. This finding is consistent with Lago-Peñas et al. [
57], who identified offensive effectiveness as a primary predictor of success, and with Liu et al. [
8], who emphasise the centrality of goal scoring in achieving victories. Additionally, accurate and well-directed crosses into the box have been identified as a relevant offensive factor for increasing the probability of scoring and winning matches [
69,
72].
Conversely, ball possession, often regarded as an indicator of territorial superiority, exhibited very strong correlations with total passes (ρ = 0.865) and successful passes (ρ = 0.859), reflecting the team’s control of the game and offensive organisation. However, its direct relationship with match outcomes was more moderate, indicating that, although it may contribute to game control, it is not, in itself, a decisive factor for victory. This finding supports the conclusions of Collet [
12], who argues that ball possession alone is not a reliable indicator of competitive performance, particularly when considered outside the context of its functionality and effectiveness during offensive phases.
Regarding defensive indicators, goals conceded (ρ = −0.441;
p < 0.01) and shots conceded on target (ρ = −0.301;
p < 0.01) exhibited moderate negative correlations with match outcomes, confirming that defensive effectiveness in preventing clear scoring opportunities is as crucial as offensive effectiveness. This finding underscores the importance of an integrated approach to performance, in line with González-Ródenas et al. [
31], who emphasise the relevance of indicators such as interceptions and defensive duels in reducing the risk of conceding goals.
Overall, the correlation data indicate that performance indicators most directly associated with effectiveness, including goals scored, shots on target, and goals conceded, possess greater explanatory power for match outcomes. In contrast, volume- or possession-related variables, such as total passes and crosses, exert an effect that is more dependent on context and quality of execution. It is worth noting that for medium-quality opponents, crosses resulting in shots showed a negative effect (β = −0.515; p = 0.012), although this does not compromise the general interpretation of offensive effectiveness across different match contexts.
4.3. Performance Indicators Associated with Match Outcomes
The ordinal logistic regression analysis enabled the assessment of the influence of offensive and defensive indicators on match outcomes (defeat < draw < victory). Among the offensive variables included in the model, only total crosses proved statistically significant (β = −0.790;
p = 0.011; OR = 0.454 [0.247–0.832]), indicating that a higher volume of ineffective crossing reduces the probability of a better match outcome. Goals scored, while strongly correlated with outcomes in the bivariate analysis, was excluded from the regression model to avoid conceptual overlap with the dependent variable. This finding reinforces that, for elite champion teams, the accumulation of offensive actions alone is not predictive of success. Rather, offensive effectiveness is primarily expressed through the quality and efficiency of actions rather than their sheer volume, supporting the conclusions of González-Rodenas et al. [
10] and Stafylidis et al. [
4], who emphasise that offensive volume gains independent explanatory contribution only when associated with efficiency and contextualised within the dynamics of play.
Conversely, other offensive indicators, including ball possession, total passes, successful passes, crosses resulting in a shot, total shots, shots on target, and expected goals (xG), did not exert a significant effect on match outcomes (
p > 0.05). These results align with Liu et al. [
8], who demonstrated that the quality of actions, rather than the quantity, determines match outcomes in elite football.
With regard to defensive indicators, the results showed that interceptions (β = 0.414; p = 0.049; OR = 1.513 [1.001–2.288]), fouls committed (β = −0.547; p = 0.006; OR = 0.579 [0.392–0.856]), shots conceded on target (β = −0.740; p = 0.003; OR = 0.477 [0.293–0.777]) were statistically significant predictors. Yellow cards (p = 0.192) were not statistically significant and should not be interpreted as an influential predictor. Specifically, higher numbers of interceptions increased the likelihood of better outcomes, whereas fouls committed, shots conceded on target, and yellow cards reduced that probability. Goals conceded, while strongly correlated with outcomes in the bivariate analysis, was excluded from the regression model to avoid conceptual overlap with the dependent variable.
This pattern indicates that defensive organisation, discipline, and effective ball recovery exert a greater influence on match outcomes than the mere accumulation of defensive actions, reinforcing the importance of maintaining a structured and cohesive defensive approach even within highly competitive teams. These findings corroborate previous research emphasising the significance of action effectiveness and situational context as key determinants of competitive success, particularly in the management of defensive phases and transitions [
1,
18,
67].
Notably, this study quantifies these effects specifically for elite champion teams: each additional ineffective cross reduces the odds of a better match outcome by approximately 55% (OR = 0.45), while interceptions were associated with a 51% increase in the odds of success (OR = 1.51; p = 0.049). Conversely, each foul committed reduces the odds by 42% (OR = 0.58), and each shot conceded on target reduces the odds by 52% (OR = 0.48). These estimates, derived from the latest season’s top performers, provide a precise, benchmarked understanding of success determinants at the highest level of European football.
Furthermore, the remaining defensive indicators, including ball losses, ball recoveries, total duels, duels won, and total shots conceded, did not exert a significant effect on match outcomes, suggesting that quantity-based metrics, when not directly related to controlling the result, have limited explanatory value for match outcomes. This aligns with the broader observation that volume-based metrics often yield negative or trivial effects when analysed within-team [
8], reinforcing the notion that defensive effectiveness and situational context matter more than the mere volume of actions [
37,
38,
67].
Despite the robustness of the model, it should be noted that performance in football is influenced by multiple contextual factors not addressed in this study, such as match location, players’ psychological state, refereeing decisions, injuries, and the tactical strategies of the opposing team [
66]. Accordingly, explanatory models based exclusively on technical-tactical indicators should be complemented with contextual variables to provide a more comprehensive understanding of competitive performance.
Finally, the performance model emerging from these analyses reflects a championship-winning profile where execution quality and defensive discipline supersede action volume. This efficiency-based framework demonstrates limited generalizability beyond elite contexts, as mid-table teams typically achieve success through different performance patterns centred on game control and defensive stability. Consequently, these findings establish a specific benchmark for top-tier performance rather than a universal predictive template for all competitive levels.
4.4. Contextual Effects of Performance Indicators on Match Outcome
While the aggregate models in
Section 4.3 established goals as the dominant global associated factors, the stratified analyses revealed that the relevance of offensive and defensive indicators varies substantially according to match location and opponent quality (
Table 6,
Table 7,
Table 8 and
Table 9). These context-dependent patterns align with previous research demonstrating that technical and tactical metrics must be situated within the specific competitive environment, as their predictive value varies systematically with situational variables [
1,
10,
66].
Regarding offensive indicators by match location, at home, shots on target significantly increased the odds of better outcomes (OR = 3.76;
p = 0.039), whereas in away matches, expected goals (xG) emerged as the only significant predictor (OR = 2.09;
p = 0.009). This suggests that at home, finishing accuracy drives success, while away from home, the quality of created chances becomes more informative than shot volume. The prominence of shots on target at home aligns with Konefał et al. [
45], who demonstrated that playing at home significantly increases the odds of winning across all playing positions, with offensive efficiency emerging as a key differentiator. Conversely, the relevance of xG away from home is consistent with Settembre et al. [
46], who identified match location among the top contributors to match outcomes, suggesting that the quality of created chances becomes more critical when teams are away from familiar environments.
Concerning defensive indicators by match location, at home, four indicators reduced the odds of better outcomes: total ball losses (OR = 0.47), shots conceded on target (OR = 0.33), and fouls committed (OR = 0.48; all
p < 0.05). This underscores that defensive stability and discipline are paramount at home. Duels won (OR = 0.53) was included in the model but was not statistically significant and therefore should not be interpreted as a determinant of outcomes. In away matches, only interceptions reached significance (OR = 1.47;
p = 0.005), indicating that disrupting opponent build-up through anticipatory actions is the most valuable defensive skill away from home. The importance of interceptions in away matches corroborates the findings of Almeida et al. [
73], who reported that regaining possession, particularly in advanced zones, is associated with success, especially in contexts where proactive disruption is required.
Turning to offensive indicators by opponent quality, against high quality opponents, shots on target (OR = 5.24) and crosses resulting in a shot (OR = 4.65) were significant (
p < 0.05), highlighting that efficiency is paramount when facing elite sides. This finding reinforces the observations of Bilek and Ulas [
44], who identified shots on target as particularly influential against stronger opponents, underscoring that efficiency rather than volume determines success when facing elite sides. Against medium quality opponents, crosses positively influenced outcomes (OR = 2.07), whereas total shots were detrimental (OR = 0.54). Against low quality opponents, shots on target again emerged as a strong predictor (OR = 3.10;
p = 0.001). Notably, ball possession and total passes did not reach significance in any opponent context, echoing the conclusion that volume-based metrics, such as possession and pass counts, offer limited explanatory value when analysed within team [
4,
8]. This pattern is in line with Liu et al. [
8], who reported that volume-based metrics exhibit negative or limited effects when analysed within the same team, reinforcing the notion that the quality of actions supersedes their quantity.
With respect to defensive indicators by opponent quality, against high quality opponents, interceptions were the sole significant predictor (OR = 1.76;
p = 0.015), reinforcing the notion that disrupting elite teams early in their offensive construction is critical [
73]. Against medium quality opponents, fouls committed (OR = 0.53;
p < 0.05) reduced the odds of better outcomes, indicating that disciplinary lapses are particularly costly when champion teams are expected to control play. Against low quality opponents, a cluster of indicators reached significance: total ball losses (OR = 0.26), shots conceded on target (OR = 0.22), and red cards (OR = 66.58), highlighting that defensive solidity and numerical parity are critical against weaker sides [
37]. The substantial effect of red cards against weaker sides is consistent with Bar-Eli et al. [
74], who demonstrated that numerical disadvantage disproportionately affects outcomes, particularly when teams are expected to maintain control rather than recover from critical errors.
Overall, these findings demonstrate that the influence of specific performance indicators is systematically modulated by match location and opponent quality. The varying explanatory power across contexts (Nagelkerke R
2 from 0.172 away to 0.510 against low quality opponents) suggests that technical indicators explain more variance in matches against weaker opposition than in tight contests away from home or against elite rivals. These context-dependent patterns provide an empirical foundation for the practical applications detailed in
Section 7.
4.5. Contribution to the Literature and Conceptual Implications
Building on the quantitative model and the specific findings for elite teams, this study offers a threefold contribution to the field of football performance analysis, namely:
Quantitative Precision and Contextual Specificity: This study provides exact, benchmarked estimates of the impact of key performance indicators, disaggregated by match location (home vs. away) and opponent quality (high, medium, low). The findings indicate that the relevance and magnitude of performance indicators vary across contexts. At home, shots on target significantly increased the odds of a better match outcome (OR = 3.76), whereas in away matches, expected goals (xG) emerged as the main offensive predictor (OR = 2.09). Against high-quality opponents, shots on target (OR = 5.24) and crosses resulting in a shot (OR = 4.65) showed strong associations with outcomes. Against medium-quality opponents, crosses (OR = 2.07) were positively associated with outcomes, while fouls committed (OR = 0.53) and yellow cards (OR = 0.61) were negatively associated. Against low-quality opponents, defensive-related variables such as total shots conceded (OR = 8.26) and red cards (OR = 66.58) exhibited substantial effects. Overall, these context-specific estimates move the discussion beyond general assertions toward a more precise quantification of how performance indicators operate under different competitive conditions in elite teams.
The Elite Performance Profile: A critical insight emerging from the stratified multivariate models is the context-dependent relevance of performance indicators. Volume-based metrics, such as ball possession, total passes, and total shots, generally did not retain significant independent effects across most contexts, whereas efficiency-based indicators, including shots on target, expected goals (xG), interceptions, and defensive control metrics (e.g., shots conceded on target), consistently emerged as key predictors. For instance, in the overall model, significant effects were observed for total crosses and shots on target on the offensive side, together with several defensive indicators, namely interceptions, fouls committed, shots conceded on target, and yellow cards. This indicates that both offensive efficiency and defensive organisation contribute to match outcomes at the elite level, while most volume-based metrics do not show independent explanatory power. This pattern suggests that for teams operating at the highest level, where technical proficiency is a given, simply accumulating more actions does not independently increase the probability of winning. Instead, the marginal gain comes from executing actions more effectively: converting possessions into high-quality chances and limiting opponent efficiency. This delineates a champion profile that is distinct from teams for whom controlling volume may represent a more viable route to success.
Methodological Application: The use of ordinal regression with robust standard errors clustered by team models the ordered nature of match outcomes (loss < draw < win) while accounting for the dependence of observations within teams. This approach provides a more nuanced analytical framework than binary win/loss classifiers or models that ignore data structure. Furthermore, the stratification by match location and opponent quality illustrates how methodological choices can reveal context-dependent effects that may remain hidden in aggregate analyses. Model fit statistics (Nagelkerke R2 ranging from 0.172 to 0.510 across contexts) and the proportional odds tests provide partial support for the suitability of the ordinal modelling approach, although some violations indicate that results should be interpreted with caution depending on the specific context.
Together, these contributions establish a conceptual foundation for rethinking performance analysis at the elite level, advocating for a shift from volume-based metrics to efficiency-based diagnostics, and from aggregate analyses to context-sensitive evaluations. The practical operationalisation of these insights for performance analysts and coaching staff is detailed in
Section 7.
5. Limitations
This study has several limitations that should be considered when interpreting its findings.
First, although the study adopted a comprehensive set of performance indicators, the analysis focused exclusively on technical and tactical metrics. Several contextual factors known to influence match outcomes were not included, such as game state (e.g., current scoreline), match congestion (days of rest between fixtures), phase of the season, injuries, suspensions, and refereeing decisions.
Second, the study did not examine interaction effects between offensive and defensive indicators. The inclusion of such interactions would substantially increase model complexity and require a larger sample to ensure stable estimates, which was not feasible within the current dataset.
Third, the analytical approach was explanatory (associative) rather than predictive. Consequently, model validation focused on goodness-of-fit statistics (Deviance, Pearson, Nagelkerke pseudo-R2) and the proportional odds assumption, rather than on external predictive validation procedures such as cross-validation, temporal splits, or probability-based classification metrics.
Fourth, while the proportional odds assumption was satisfied for the overall models (parallel lines test
p > 0.05), it was violated in some stratified models (Home model in
Table 6, Away model in
Table 7, Medium model in
Table 8, and Medium and Low models in
Table 9). This indicates that the effect of some predictors may not be consistent across all thresholds of the outcome variable (i.e., the transition from loss to draw versus draw to win). Consequently, the reported odds ratios for these specific models represent an average effect across the cumulative logits. This is a known limitation of ordinal regression when the assumption is not met [
65]. Given the exploratory nature of this study, we retained these models for their explanatory (associative) value, but the findings from these stratified analyses should be interpreted with this caveat in mind.
Fifth, the decision to focus exclusively on champion teams from the five major European leagues during a single season (2023–2024) provides an elite performance benchmark but limits the applicability of the findings. The sample is characterised by a high prevalence of victories (74.7%), which restricts the variability of negative outcomes and may affect the stability of coefficient estimates for draws and losses.
Sixth, the modest explanatory power of the regression models (Nagelkerke R2 ranging from 0.172 to 0.510 across contexts) indicates that a substantial portion of the variance in match outcomes remains unexplained by the technical indicators analysed. This underscores the complexity of football and the influence of unmeasured psychological, stochastic, and contextual factors.
Seventh, some caution is warranted when interpreting coefficients from models that include highly collinear predictors, such as expected goals (xG) and goals scored. As shown in the
Supplementary Materials (Tables S3, S5 and S7), the simultaneous inclusion of both variables can produce unstable or counterintuitive coefficient estimates (e.g., negative coefficients for xG), particularly in stratified subgroups with limited sample sizes (e.g., n ≈ 54 for high/low opponent quality). This phenomenon, known as suppression due to multicollinearity, does not affect our main models (
Table 4,
Table 6 and
Table 8), where goals scored was excluded to avoid conceptual overlap with the dependent variable. In those models, all xG coefficients were positive and consistent with theoretical expectations. Readers should therefore prioritize the main models when interpreting the role of offensive efficiency.
Additionally, the study adopted separate models for offensive and defensive indicators. While this choice was methodologically justified, it does not explicitly model interactions between offensive and defensive phases. For example, the effect of a defensive action (e.g., an interception) that leads directly to an offensive scoring opportunity is not captured as an interactive process. Consequently, the combined effect of offensive and defensive actions on match outcomes remains unexplored and should be addressed in future research.
Finally, although bootstrap resampling was employed as a sensitivity analysis to assess parameter stability, results indicated instability in several stratified models, particularly under sparse outcome distributions. Accordingly, bootstrap estimates were not used as the basis for statistical inference, and primary interpretations are based on the maximum likelihood estimates. This behaviour reflects the sensitivity of certain parameters to sample structure and distributional sparsity rather than a limitation of the primary modelling framework.
Taken together, these limitations delimit the scope of the findings, which should be interpreted as a contextualised characterisation of elite champion team performance during the 2023–2024 season.
6. Recommendations for Future Research
Building on the limitations identified in this study, future research should pursue several directions to enhance the robustness and applicability of performance indicator models in football.
To overcome the limited generalizability inherent in focusing solely on champion teams across a single season, future research should expand the sample to include teams across the entire league table spectrum, enabling the development of tier-specific performance benchmarks or, with appropriate methodological adaptations, predictive models capable of forecasting match outcomes. Longitudinal designs analysing data across multiple seasons are also needed to distinguish stable success factors from transient, season-specific trends.
From a methodological standpoint, future studies should implement external validation procedures such as cross-validation, temporal splits, or leave-one-team-out approaches to assess the generalizability of findings across seasons and competitive contexts. Probability-based metrics and classification performance measures, including confusion matrices, macro-F1, balanced accuracy, calibration plots, and area under the ROC curve (AUC), should also be employed when predictive aims are pursued. Sensitivity analyses, such as alternative model specifications and resampling-based approaches, may further assess the robustness of coefficient estimates in future studies, particularly in larger and more balanced samples. Additionally, the exploration of interaction effects between offensive and defensive indicators, which were not examined due to sample size constraints, would provide valuable insights into how combined performance dimensions influence match outcomes.
While the present study incorporated match location and opponent quality as stratification variables, several contextual factors remained unexplored. Future investigations should consider game-state variables, such as current scoreline; match congestion, measured by days of rest between fixtures; phase of the season, distinguishing first from second half; and the availability of key players due to injuries or suspensions. Disaggregating analyses by playing position, match type, or time intervals within matches may also reveal nuanced patterns not captured by aggregate team-level analyses.
Given the moderate explanatory power of the technical indicators analysed, incorporating additional data streams would be valuable. Tracking data, including player positioning, distances covered, and intensity metrics, could capture spatial and physical dimensions of performance. Psychological measures, such as resilience, team cohesion, and pressure handling, alongside qualitative tactical assessments of playing style and formations, may help explain the substantial unexplained variance in match outcomes. Finally, the integration of advanced metrics such as expected assists should be further explored, building on the inclusion of expected goals in the present study.
Finally, while the present study adopted an exploratory approach focused on identifying performance indicators associated with match outcomes, future research may extend this work towards predictive modelling. Building on the quantified associations and the contextual framework established here, studies with larger samples and designed specifically for predictive purposes could develop and validate models capable of forecasting match outcomes in real-world settings. Such an evolution from exploration to prediction would represent a natural progression, leveraging the empirical foundations provided by this exploratory research to inform practical applications in performance analysis and tactical decision-making.
7. Practical Applications
The findings of this study highlight offensive effectiveness (finishing) and defensive solidity (goal prevention) as critical determinants of competitive success. From a practical standpoint, these results underscore the importance of prioritising the quality of actions over their quantity.
For performance analysts, this study demonstrates that the relevance of performance indicators is context-dependent, thereby validating the need for stratified analyses by match location and opponent quality. This approach yields more precise benchmarks than aggregate metrics alone, providing an empirically grounded framework for tailoring performance reports to specific competitive scenarios.
For coaches, the stratified analyses reveal that the relevance of performance indicators is modulated by match location and opponent quality, enabling them to move beyond one-size-fits-all approaches and adopt training strategies precisely tailored to each competitive context. By identifying which indicators drive success under different conditions, such analyses provide an empirically grounded framework for optimising training preparation and strategic planning.
Illustrating this approach with findings from the present study of champion teams, the data reveal that in home matches, training should prioritise finishing accuracy and shots on target, given that this indicator significantly increased the odds of victory. Conversely, in away fixtures, the focus should shift towards creating high-quality scoring opportunities, as reflected by expected goals (xG), rather than merely increasing shot volume. From a defensive perspective, preparation should be tailored to opponent quality: against high-quality opponents, emphasis should be placed on interceptive actions, which emerged as the sole significant defensive predictor in this context; when facing medium-quality opponents, attention to disciplinary control is warranted, as fouls committed and yellow cards substantially reduced the odds of favourable outcomes; and against low-quality opponents, limiting shots on target conceded is paramount, given the substantial negative effect of this indicator on match results.
These recommendations are derived exclusively from champion teams and may not directly generalise to other competitive levels. Nevertheless, the methodological approach, stratified analysis by match location and opponent quality, offers a valuable framework adaptable to different contexts.
8. Conclusions
This study utilised ordinal logistic regression to quantify the key performance indicators associated with competitive success for elite football champions. The results showed that efficiency-based indicators were the main predictors of match outcomes, with effects varying systematically by match location and opponent quality.
Offensively, shots on target and expected goals (xG) emerged as relevant predictors, particularly at home and against stronger opponents. Defensively, interceptions were associated with improved outcomes against high-quality opponents, whereas fouls and yellow cards were associated with poorer outcomes against medium-quality opponents. Against weaker opponents, defensive stability and reduced defensive errors were particularly important.
Volume-based indicators such as ball possession, total passes, and crosses did not consistently retain significant independent effects in the multivariate models. This suggests that, at the elite level, the quality and efficiency of actions may be more relevant than the overall volume of play.
The integration of offensive and defensive indicators into explanatory models provides a useful framework for performance analysis and tactical interpretation. Although the findings are specific to champion teams in the 2023–2024 season, they offer a context-sensitive benchmark for elite European football. Future research should extend this analysis across multiple seasons to further evaluate the robustness and generalisability of these indicators.
In conclusion, this exploratory study provides evidence that efficiency-based indicators, shot accuracy, expected goals, defensive organisation, and disciplinary factors, are associated with competitive success in elite football. The findings generate hypotheses for future confirmatory research aimed at improving performance analysis in professional football.




 ,
,