Article

Biofilm Formation of Probiotic Saccharomyces cerevisiae var. boulardii on Glass Surface during Beer Bottle Ageing

by
Khosrow Mohammadi
and
Per Erik Joakim Saris
*
Department of Microbiology, Faculty of Agriculture and Forestry, University of Helsinki, P.O. Box 56, FI-00014 Helsinki, Finland
*
Author to whom correspondence should be addressed.
Beverages 2022, 8(4), 77; https://doi.org/10.3390/beverages8040077
Submission received: 23 September 2022 / Revised: 28 October 2022 / Accepted: 21 November 2022 / Published: 1 December 2022

Abstract

:
While brewing probiotic beer using Saccharomyces cerevisiae var. boulardii, we noticed the yeast potentially makes biofilm in glass bottles as the bottles get hazy. In this study, S. cerevisiae var. boulardii CNCM I-745 was used as a starter culture to produce probiotic beer. We studied the biofilm parameters combined with FLO11 mRNA expression and used light and scanning electron microscopy to document biofilm formation and structure. Our results revealed that ageing the beer and maturing from a sugar-rich to a sugar-limited beer, along with the stress factors from the brewing process (pH reduction and produced metabolites), led to an increase in biofilm mass; however, the viable count remained relatively stable (approximately 7.1 log10 cells/mL). Biofilm S. boulardii cells showed significantly higher FLO11 mRNA expression in the exponential and stationary phase compared to the planktonic cells. This study, therefore, provides evidence that S. cerevisiae var. boulardii makes biofilm on glass surfaces during beer bottle ageing. The impact of complications caused by formed biofilms on returnable bottles emphasizes the significance of this study.

1. Introduction

In breweries, most contaminant microorganisms are bound in biofilms as a reservoir and breeding ground for occurring microorganisms, both known for beer spoilage and microorganisms of no concern in bottled beer [1]. The presence of biofilms in food manufacturing surfaces can lead to financial losses and/or, more vital concern; these biofilms can cause crucial public health issues. Biofilms may contain pathogenic microorganisms targeting healthy individuals or, at times, only immunocompromised patients [2]. Saccharomyces cerevisiae var. boulardii (Sc.b.) has extensively been used as a probiotic in clinical practice and gastrointestinal disorders; however, there is conflicting evidence of its potential opportunistic pathogenicity, especially in those with a central venous catheter [3].
Yeast biofilms are complex and heterogenous multicellular structures in which the cells are well protected from hostile external conditions. Biofilm formation of yeast occurs through specific steps in which cell-to-surface and cell-to-cell interactions take place simultaneously to cause adhesion and colonization. In the first step, yeast cells adhere to the surface and start to divide and make microcolonies. Then, as the growth proceeds, yeast cells produce an extracellular matrix (ECM) and differentiate to produce elongated pseudohyphae and hyphae to thrive in low-nutrient environments. Finally, in the maturation phase, the amount of ECM increases [4,5].
Adhesion genes, which contribute to cell-cell or cell-biotic/abiotic interactions, are infrequently studied in biofilm formation [6,7,8]. Saccharomyces cerevisiae (Sc.c.) includes a series of FLO genes (FLO1, FLO5, FLO9, FLO10, and FLO11) encoding various adhesive surface glycoproteins [9]. FLO11 confers cell-surface adherence (flo11p), pseudohyphae, and biofilm formation [5,10,11]. Three signaling cascades regulate FLO11 expression in response to environmental factors: the mitogen-activated protein kinase (MAPK) pathway, Ras/cAMP pathway, and glucose repression. The expression of these genes and cell-surface adhesion is activated by a variety of stress factors and/or environmental triggers [11]. Despite identifying different genes involved in biofilm formation, yeast species exhibit diverse adhesins [12].
Alcoholic fermented beverages are enjoyed broadly worldwide, mainly for the welfare [13]. People often say that beer from a bottle is more tasteful than from a can [14]. Depending on the nutrient content of the beer, the biofilm formation process may take hours to months [15]. Once the biofilm is formed in a reusable beer bottle, it prevents microbial cells from being washed away and protects them from chemical cleaning and disinfection programs [11,16]. Later, biofilm-surviving microorganisms can be the root of irregular contamination in bottled beer [15].
The structure and formation of brewery-based biofilms have been studied in detail previously [17,18,19]. Meanwhile, different functional properties of probiotic yeast in beer production have been well studied [20,21,22,23]. Notwithstanding all the acquired knowledge involved in developing a probiotic beer, there are still challenges in Sc.b. biofilm formation that are yet to be understood. So far, the ability of probiotic Sc.b. to form biofilm in beer bottles has not been studied. For the above-mentioned reason, the ability of Sc.b. to adhere to and form biofilm on a glass surface during beer bottle ageing was investigated in the current study. The yeast metabolic activity, biofilm parameters, and the transcriptomes of biofilms and planktonic cells were determined.

2. Materials and Methods

2.1. Yeast Strain, Inoculum Standardisation, and Cell Viability

Probiotic Sc.b. CNCM I-745, with a clinically confirmed probiotic effect, was sourced from a pharmacy (Biocodex, Inc., San Mateo, CA, USA) and maintained on YPD agar plates. For yeast propagation, a single yeast colony was taken from a stock plate and inoculated into 10 mL yeast-extract-peptone-dextrose (YPD) broth and incubated aerobically overnight at 28 °C on an orbital shaker at 120 rpm. The suspension was transferred to a 1-L flask containing 250 mL YPD medium and incubated aerobically overnight at 28 °C with constant shaking (120 rpm). The yeast cells were recovered by centrifugation at 3000× g for 5 min at 4 °C, and the starting yeast concentration was measured by direct microscopic count method using a Neubauer chamber in conjunction with methylene blue staining to calculate the pitching rate. The viable count of yeast was performed on Sabouraud Dextrose agar (HiMedia, West Chester, PA, USA) using a previously described method [24].

2.2. Glass Surface

Two kinds of glass slides (Thermo Fisher Scientific, Vantaa, Finland) were used to form biofilms. Plain microscope slides (25 × 75 × 1 mm) were used for biofilm morphology and gene expression studies, and 8-chambered glass slides for biofilm quantification assays. In order to clean any possible fingerprints, oils, and other soils on the glass, they were prepared according to a method by Speranza, Corbo [25]. All slides were cleaned in sodium hypochlorite solution (3.5% m/V) at 75 °C for 5 min. Then, they were rinsed in distilled water and placed into 7.0 g/L phosphoric acid solution (Sigma-Aldrich, Helsinki, Finland) for 5 min. Next, The slides were rinsed and air-dried. Plain microscope slides were autoclaved at 121 °C for 15 min, and 8-chambered glass slides were washed with alcohol and thoroughly dried.

2.3. Wort Preparation

The wort was produced in a 27-L capacity Brewferm® stainless steel boiler. 2.5 kg of Pilsner malt, 2 kg of Pale ale malt, and 0.5 kg of wheat malt (Viking malt, Lahden polttimo Ltd., Lahti, Finland) were mixed and crushed in a 120 kg/h two-roller mill with a 0.5 mm gap between the rollers. Then, the grist was mixed with 20 L of 70 °C water to start the mashing process, where α-amylase produces more non-fermentable sugars (dextrins) to achieve a wort with a low concentration of monosaccharides and disaccharides [26,27]. Mashing was continued for one hour at 66 °C. Then, the mash was washed with 70 °C water until the Brix value reached 5° Bx. Next, the wort was heated to boiling, followed by adding bittering hops (10 g Magnum hops) (Panimonurkka Ltd., Espoo, Finland). Five minutes before the 1-h boiling, the aroma hops were added (30 g Hüll Melon) (Panimonurkka Ltd.). Next, the wort was rapidly cooled down to 36 °C and pitched with Sc.b. CNCM I-745 (4.4 × 10⁵ cells/mL), where the final gravity of wort and Brix was 1060 and 14° Bx, respectively. The wort was fermented for two weeks at 20 °C in the dark, and then D-glucose was added five grams per litre of beer for secondary fermentation and bottled into 250 mL bottles containing a plain microscope and 8-chambered glass slide. Half of the batch was kept uninoculated as the control group. The beer bottles were stored for 60 days at 20 °C in the dark.

2.4. Biofilm Formation Parameters

In order to evaluate biofilm formation, 8-chambered glass slides were placed in the beer bottles, and biofilm development was evaluated during the bottle ageing of the beer. The experiment was performed on days 3, 15, 30, 45, and 60 when glass slides were taken out, and wells were washed twice with PBS to remove non-adherent yeasts. After drying at room temperature, a series of biofilm-related parameters, including total biomass, metabolic activity, and extracellular matrix, were measured as described below.

2.4.1. Biomass

The method of quantifying Sc.b. CNCM I-745 biofilm mass was adapted from the technique described by Peeters and Nelis [28]. The biofilm mass was fixed with 200 μL of 99% methanol for 15 min. Next, the supernatant was discarded, the 8-chambered glass slide was air-dried for 5 min, and 200 μL of 0.5% crystal violet solution was added to each well. The slides were incubated for 20 min at room temperature, then the wells were washed with sterile water to remove the extra stain, and the biomass was decolorized by the addition of 200 μL of 33% (v/v) acetic acid for 5 min. The acetic acid solution was gently stirred with a pipette until the rest of the crystal violet was homogeneously dissolved. Finally, one hundred microlitres of the acetic acid solution from each well were transferred to a 96-well plate, and then read in an ELISA reader (infinite M200, Tecan, Austria) at a wavelength of 590 nm.

2.4.2. Metabolic Activity

Determination of the metabolic activity was done with a colorimetric assay based on the metabolic reduction of 2,3-bis (2-methoxy-4-nitro-5-sulfophenyl)-5-[(phenylamino)carbonyl]-2H-tetrazolium hydroxide (XTT; Sigma-Aldrich) to a water-soluble brown formazan product [29]. First, 200 μL of the XTT/menadione solution [4 mg XTT was dissolved in 10 mL pre-warmed PBS and supplemented with 100 μL of menadione stock solution (Sigma-Aldrich), which contained 55 mg of menadione in 100 mL of acetone], was added to each well of the 8-chambered glass slide and then incubated in the dark at 37 °C for 3 h. The solution inside the wells was transferred to microcentrifuge tubes and centrifuged at 4000× g for 5 min. One hundred microlitres of supernatant from each microcentrifuge tube were transferred to a microplate, and the absorbance was measured at 492 nm using a microplate reader (infinite M200, Tecan, Austria) [30].

2.4.3. Extracellular Matrix

The extracellular matrix was quantified according to the method described by Mello, Oliveira [31]. First, 200 μL of 0.1% safranin (Sigma-Aldrich) were added to each well and incubated at room temperature for 5 min. Then, the wells were washed with PBS until the supernatants became limpid. The bound safranin was decolorized from the stained cells with 200 μL of 30% (v/v) acetic acid for 5 min. A total of 100 μL of the supernatants were transferred to a 96-well plate, and the absorbance of the solution was measured at 530 nm.

2.5. Microscopic Visualisation of Biofilm S. boulardii Cells

In order to further ascertain the biofilm formation of Sc.b. CNCM I-745 on the glass surface, two microscopic techniques were applied. Briefly, glass slides were placed inside the beer bottle before bottling, and formed biofilms were visualized by light and scanning electron microscopy. During bottle ageing, glass slides were taken out, washed with sterile PBS to remove non-adherent planktonic cells, and adhered cells were stained with 0.4% crystal violet for 5 min. Any excess crystal violet stain was washed away with sterile water. After drying, the formation of biofilm was visualized under the light microscope at 400× magnification (Leica DM2000 LED, Wetzlar, Germany).
To visualize biofilm structure under SEM, the glass microscope slides were cut to 0.5 cm2 and were fixed in 2.5% (w/v) glutaraldehyde solution in 0.1 M sodium phosphate buffer, pH 5.5, for 2 h. The fixed specimens were processed for SEM by washing the fixed specimens in sodium cacodylate buffer (0.1 M, pH 7.4), osimicted in 2% OsO4 for 1 h, washed in DW, dehydrated using a series of ethanol solutions (50%, 70%, 96%, 100% × 2 times, 5 min each), and finally dried overnight using hexamethyldisilazane (Fluka 52620). The dried specimens were coated with a 5 nm layer of platinum using Quorum Q150TS (Quorum Technologies, Lewes, UK). Scanning electron microscopy was performed with FEI Quanta 250 FEG (Thermo Fisher, Bend, OR, USA) using ETD detector of secondary electrons using 3 kV accelerating voltage and spot size 2.7.

2.6. HPLC Analysis

The optimized HPLC method was conducted according to a previously described method by Mattila and Kačar [32]. Beer samples preserved at −20 °C were diluted 1:1 with pure water after defrosting. The diluted samples were centrifuged at 10,000× g for 1 min to precipitate the cells. Next, 200 microlitres of obtained supernatants were transferred to HPLC vials by passing through filters (Whatman, MA, USA, TishScientific) with a pore size of 0.45 µm. Sugar concentration (glucose and maltose) and produced metabolites (ethanol, glycerol, and acetate) were measured by Waters Alliance separation module e2695 HPLC coupled with two consecutive detectors, Waters 996 photodiode array and Hewlett Packard HP1047A RI. The analytes were separated on Agilent Hi-Plex H 300 × 6.5 mm column and Agilent PL-Hi-Plex H Guard Column (50 × 7.7 mm). The analytes injection volume was 20 μL and eluted with isocratic 5 mM H2SO4 at 0.6 mL/min flow rate. The column temperature was kept constant at 65 °C throughout the process.

2.7. Transcription Analysis Using Real-Time Quantitative PCR (RT-qPCR)

Sessile biofilm cells grown on glass slides were scraped off with cotton sticks, suspended in physiological saline, and subsequently harvested by vortexing the sticks. Cell pellets were rapidly frozen in liquid nitrogen and stored at −80 °C until further analysis. Total RNA was extracted from biofilm Sc.b. CNCM I-745 cells using the RiboPure™-Yeast kit (Ambion, Applied Biosystems, Austin, TX, USA), according to the manufacturer’s manual. RNA concentrations and RNA purity were determined using a NanoDrop spectrophotometer (Thermo Scientific NanoDrop™ 1000). Additionally, gel electrophoresis was conducted to ensure intact RNA. RNA (1 μg) was treated with 8 U ultrapure DNase I provided with the RiboPure™-Yeast kit. Genomic DNA contamination was verified by PCR reaction as follows: RNA sample treated with DNase I was used as a negative amplification template for the FLO11 and 18S genes. Genomic DNA was used as a positive amplification control. PCR products were amplified in a 20-μL reaction containing 4 μL 5X Phusion HF Buffer, 0.4 μL dNTPs (10 mM), 1.5 μL each primer (50 ng) (Table 1), 0.2 μL Phusion Hot Start II High-Fidelity DNA Polymerase (2U/μL), and 3 μL RNA treated with DNase (50 ng) or genomic DNA template (100 ng). The initial denaturation time was 2 min at 95 °C, followed by 30 cycles at 95 °C for 20 s, 52 °C for 20 s, and 72 °C for 40 s, with a final extension cycle at 72 °C for 2 min. One microgram of RNA was subjected to cDNA synthesis using the RevertAid H Minus First Strand cDNA Synthesis Kit. qRT-PCRs were conducted on cDNA samples from four replicate tests during exponential and stationary growth phases. The FLO11 expression levels in biofilm and planktonic cells were quantified by the 2−ΔΔCT method [33] and were reported as n-fold differences.

2.8. Statistical Analysis

Data are presented as mean ± standard deviation of three independent experiments performed in triplicate. Statistical analyses were carried out using analysis of variance (ANOVA) followed by Fisher LSD’s test at 5% probability level (p < 0.05) using the SPSS version 20.

3. Results

3.1. Metabolic Activity of S. boulardii

In beer fermentation, the fermentative behavior of yeasts depends on the chemical composition of the wort and used adjuncts. Fermentable sugars are the main components that are converted to metabolites during fermentation. Table 2 represents the metabolic activity of Sc.b. CNCM I-745 on wort and beer sugars (glucose and maltose) and produced metabolites (ethanol, glycerol, and acetate). During the two weeks of wort fermentation, glucose and maltose content dropped significantly (p < 0.01) from 15.2 and 55.6 g/L to 1.3 and 33.3 g/L, respectively.
In the current study, prior to bottling, we added 5 g/L D-glucose into beer, which was significantly (p < 0.05) reduced in three days of storage at 20 °C. Afterward, the glucose level remained around 0.2%, the limit that triggers aggregation and biofilm formation in Saccharomyces [10]. The maltose content of the beer decreased throughout the fermentation and ageing period, and at the end of the experiment, almost all the maltose was converted to other metabolites, such as alcohol, glycerol, and organic acids.
The time course of by-products’ synthesis was assessed by sampling at regular intervals. No metabolite content was observed in the worts, and their production started after introducing the Sc.b. CNCM I-745 culture. Clearly, most of the by-products were formed during the fermentation period, except for ethanol, which still increased sharply during the ageing period. Sc.b. CNCM I-745 was able to utilize glucose and maltose, and the metabolism rate was proportional to the amount of ethanol production. The differences in alcohol concentration in the beer after day 30 were significant (p < 0.01); however, most of the glycerol and acetate were produced in the fermentation process, and their fluctuations in the bottle ageing period were not significant (p > 0.05).
Figure 1 shows the survival of Sc.b. CNCM I-745 in probiotic beer during storage at 20 °C for 60 days. Inoculum level increased significantly (p < 0.01) from 5.6 to 7.1 log10 cell/mL during wort fermentation. The yeast number remained relatively stable during bottle ageing, and fluctuations in the viable count were insignificant (p > 0.05); hence, Sc.b. performed well as a brewer’s yeast for probiotic beer production. It seems that the wort sugars and added adjunct provided a rich nutrient source for Sc.b. CNCM I-745 to maintain high viable cell counts. Probiotic Sc.b. strain CNCM I-745 was resistant to pH changes, produced ethyl alcohol, and displayed considerable viability (approximately 7.1 log10 cells/mL) toward the end of the ageing period.
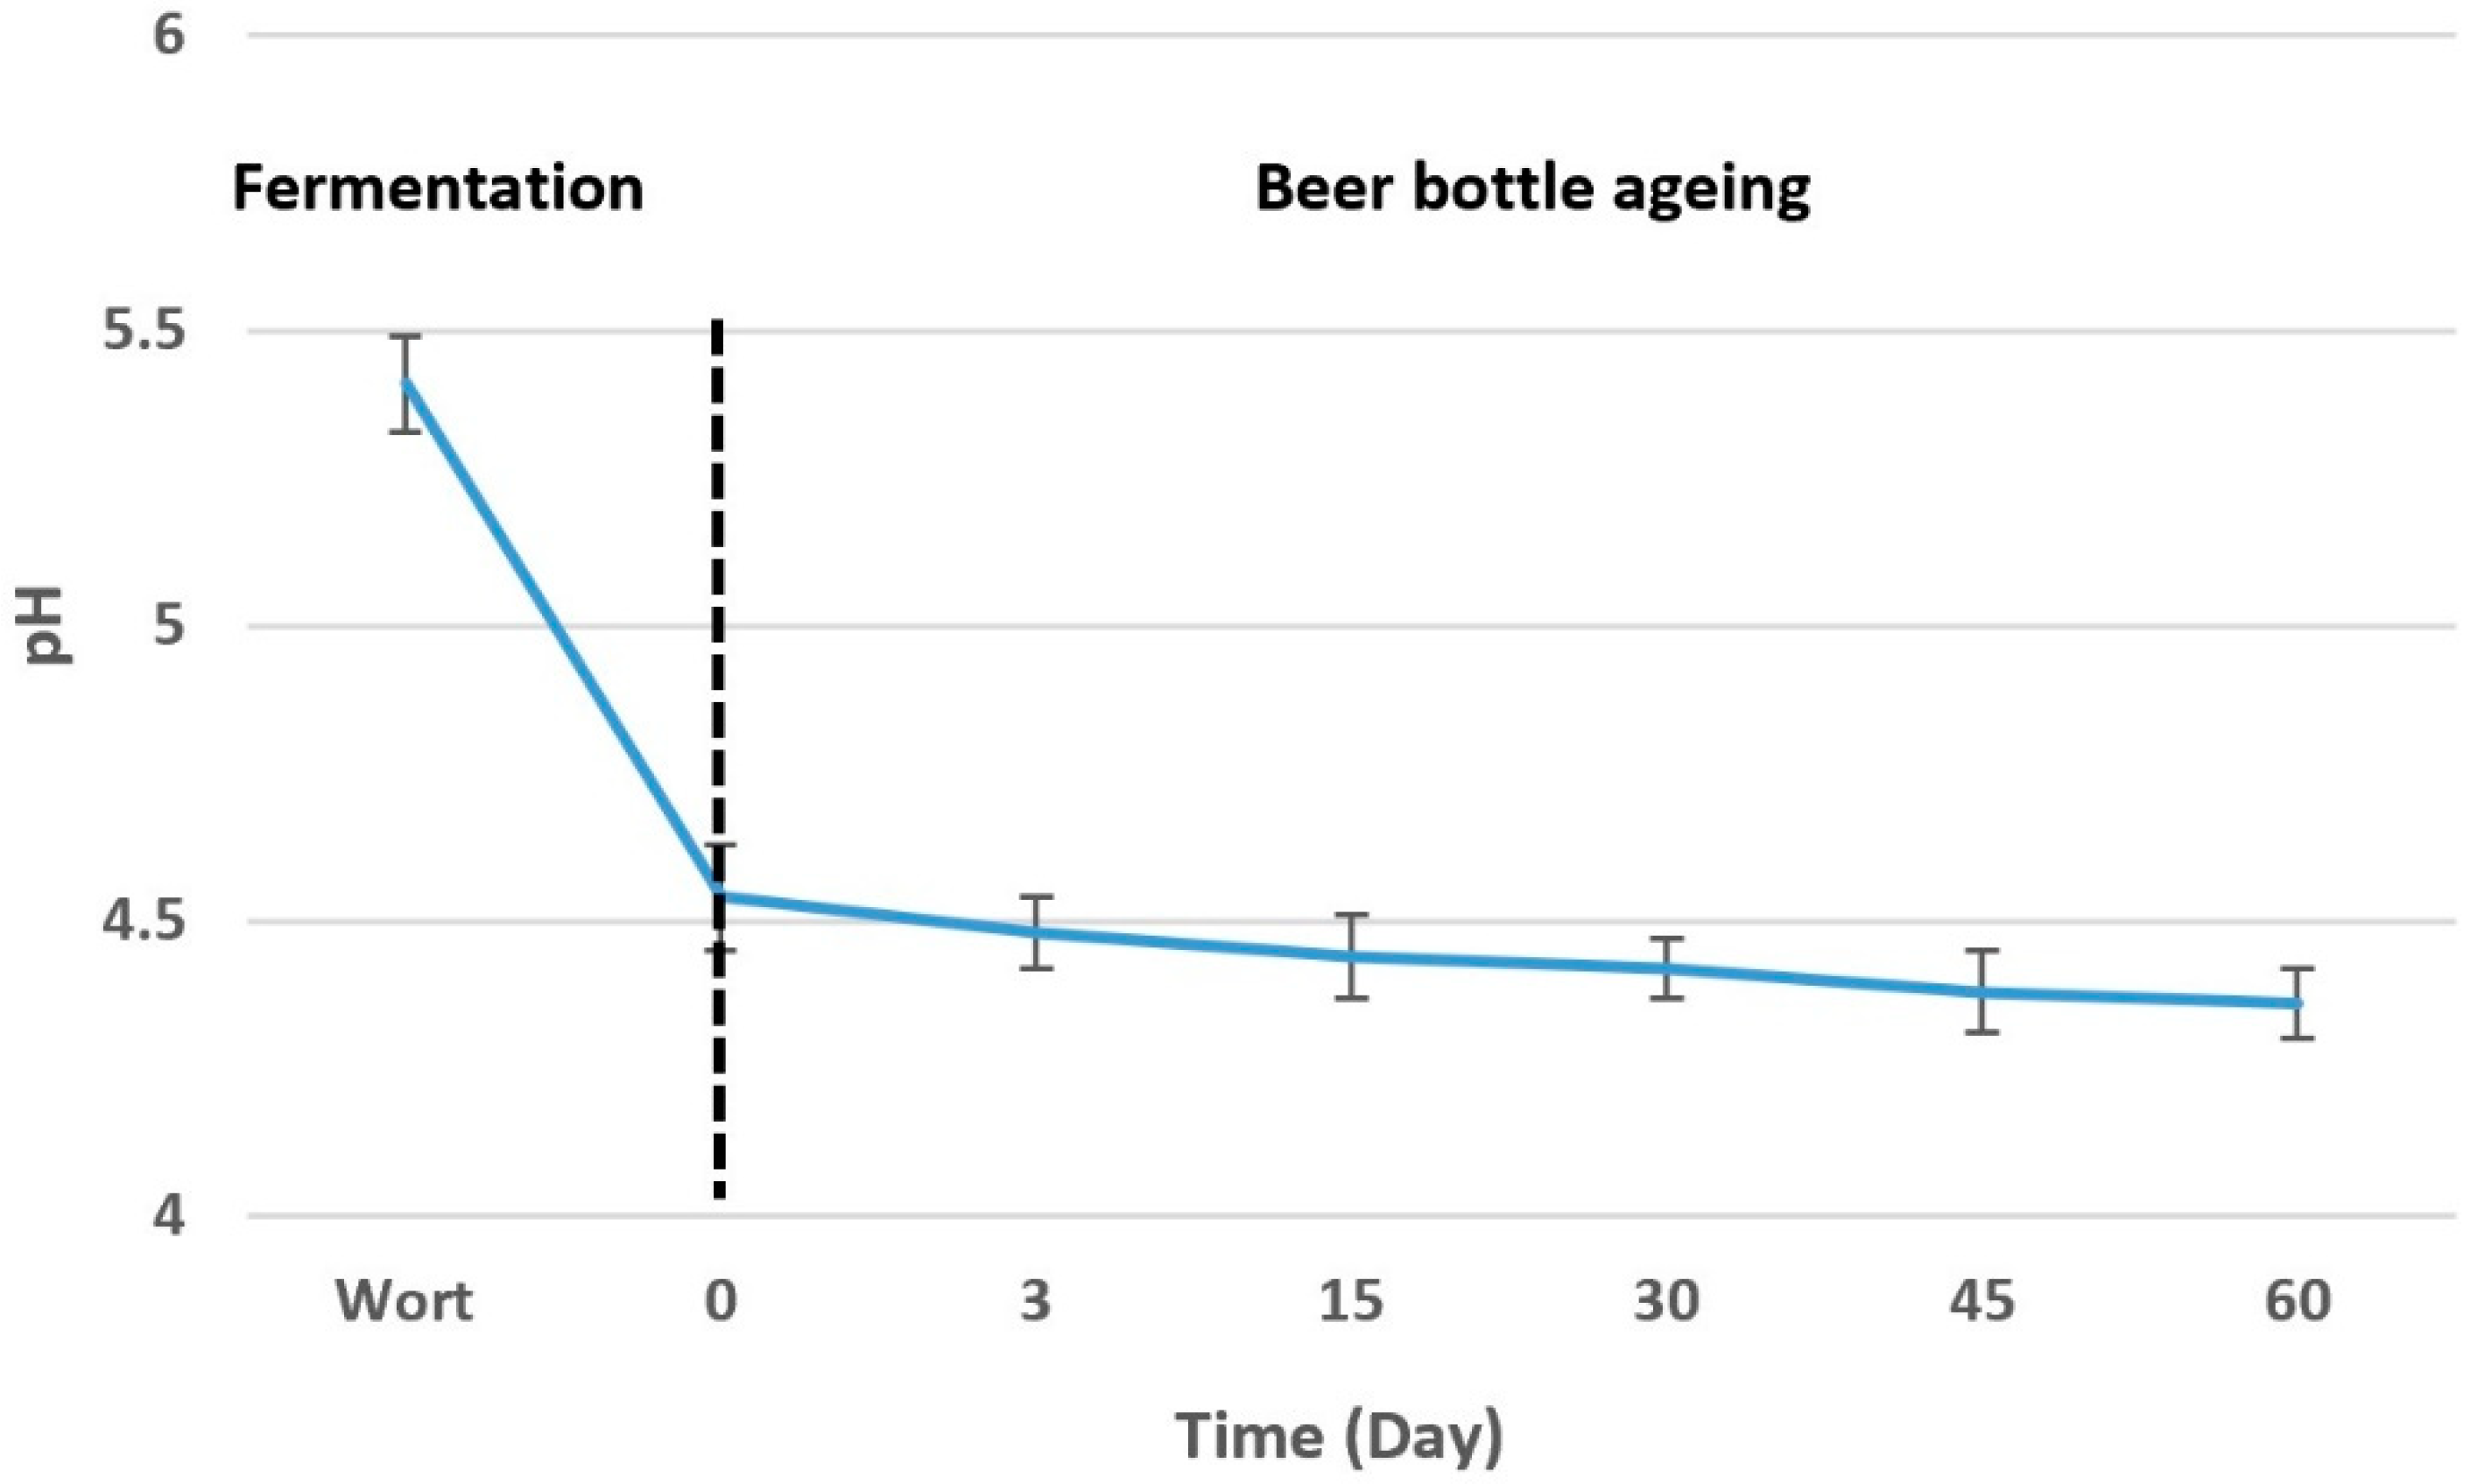
Regarding pH variation (Figure 2), fermentation of malt wort alone resulted in the highest decrease of pH (from 5.41 to 4.54), followed by fermentation of added glucose at bottling time (Day 0), which led to a pH decrease to 4.48 at day 3. During the storage period, the pH variation was not significant (p > 0.05) and was recorded between optimum pH ranges for Saccharomyces spp. (4.0 to 6.0) [34].

3.2. Biofilm Quantification

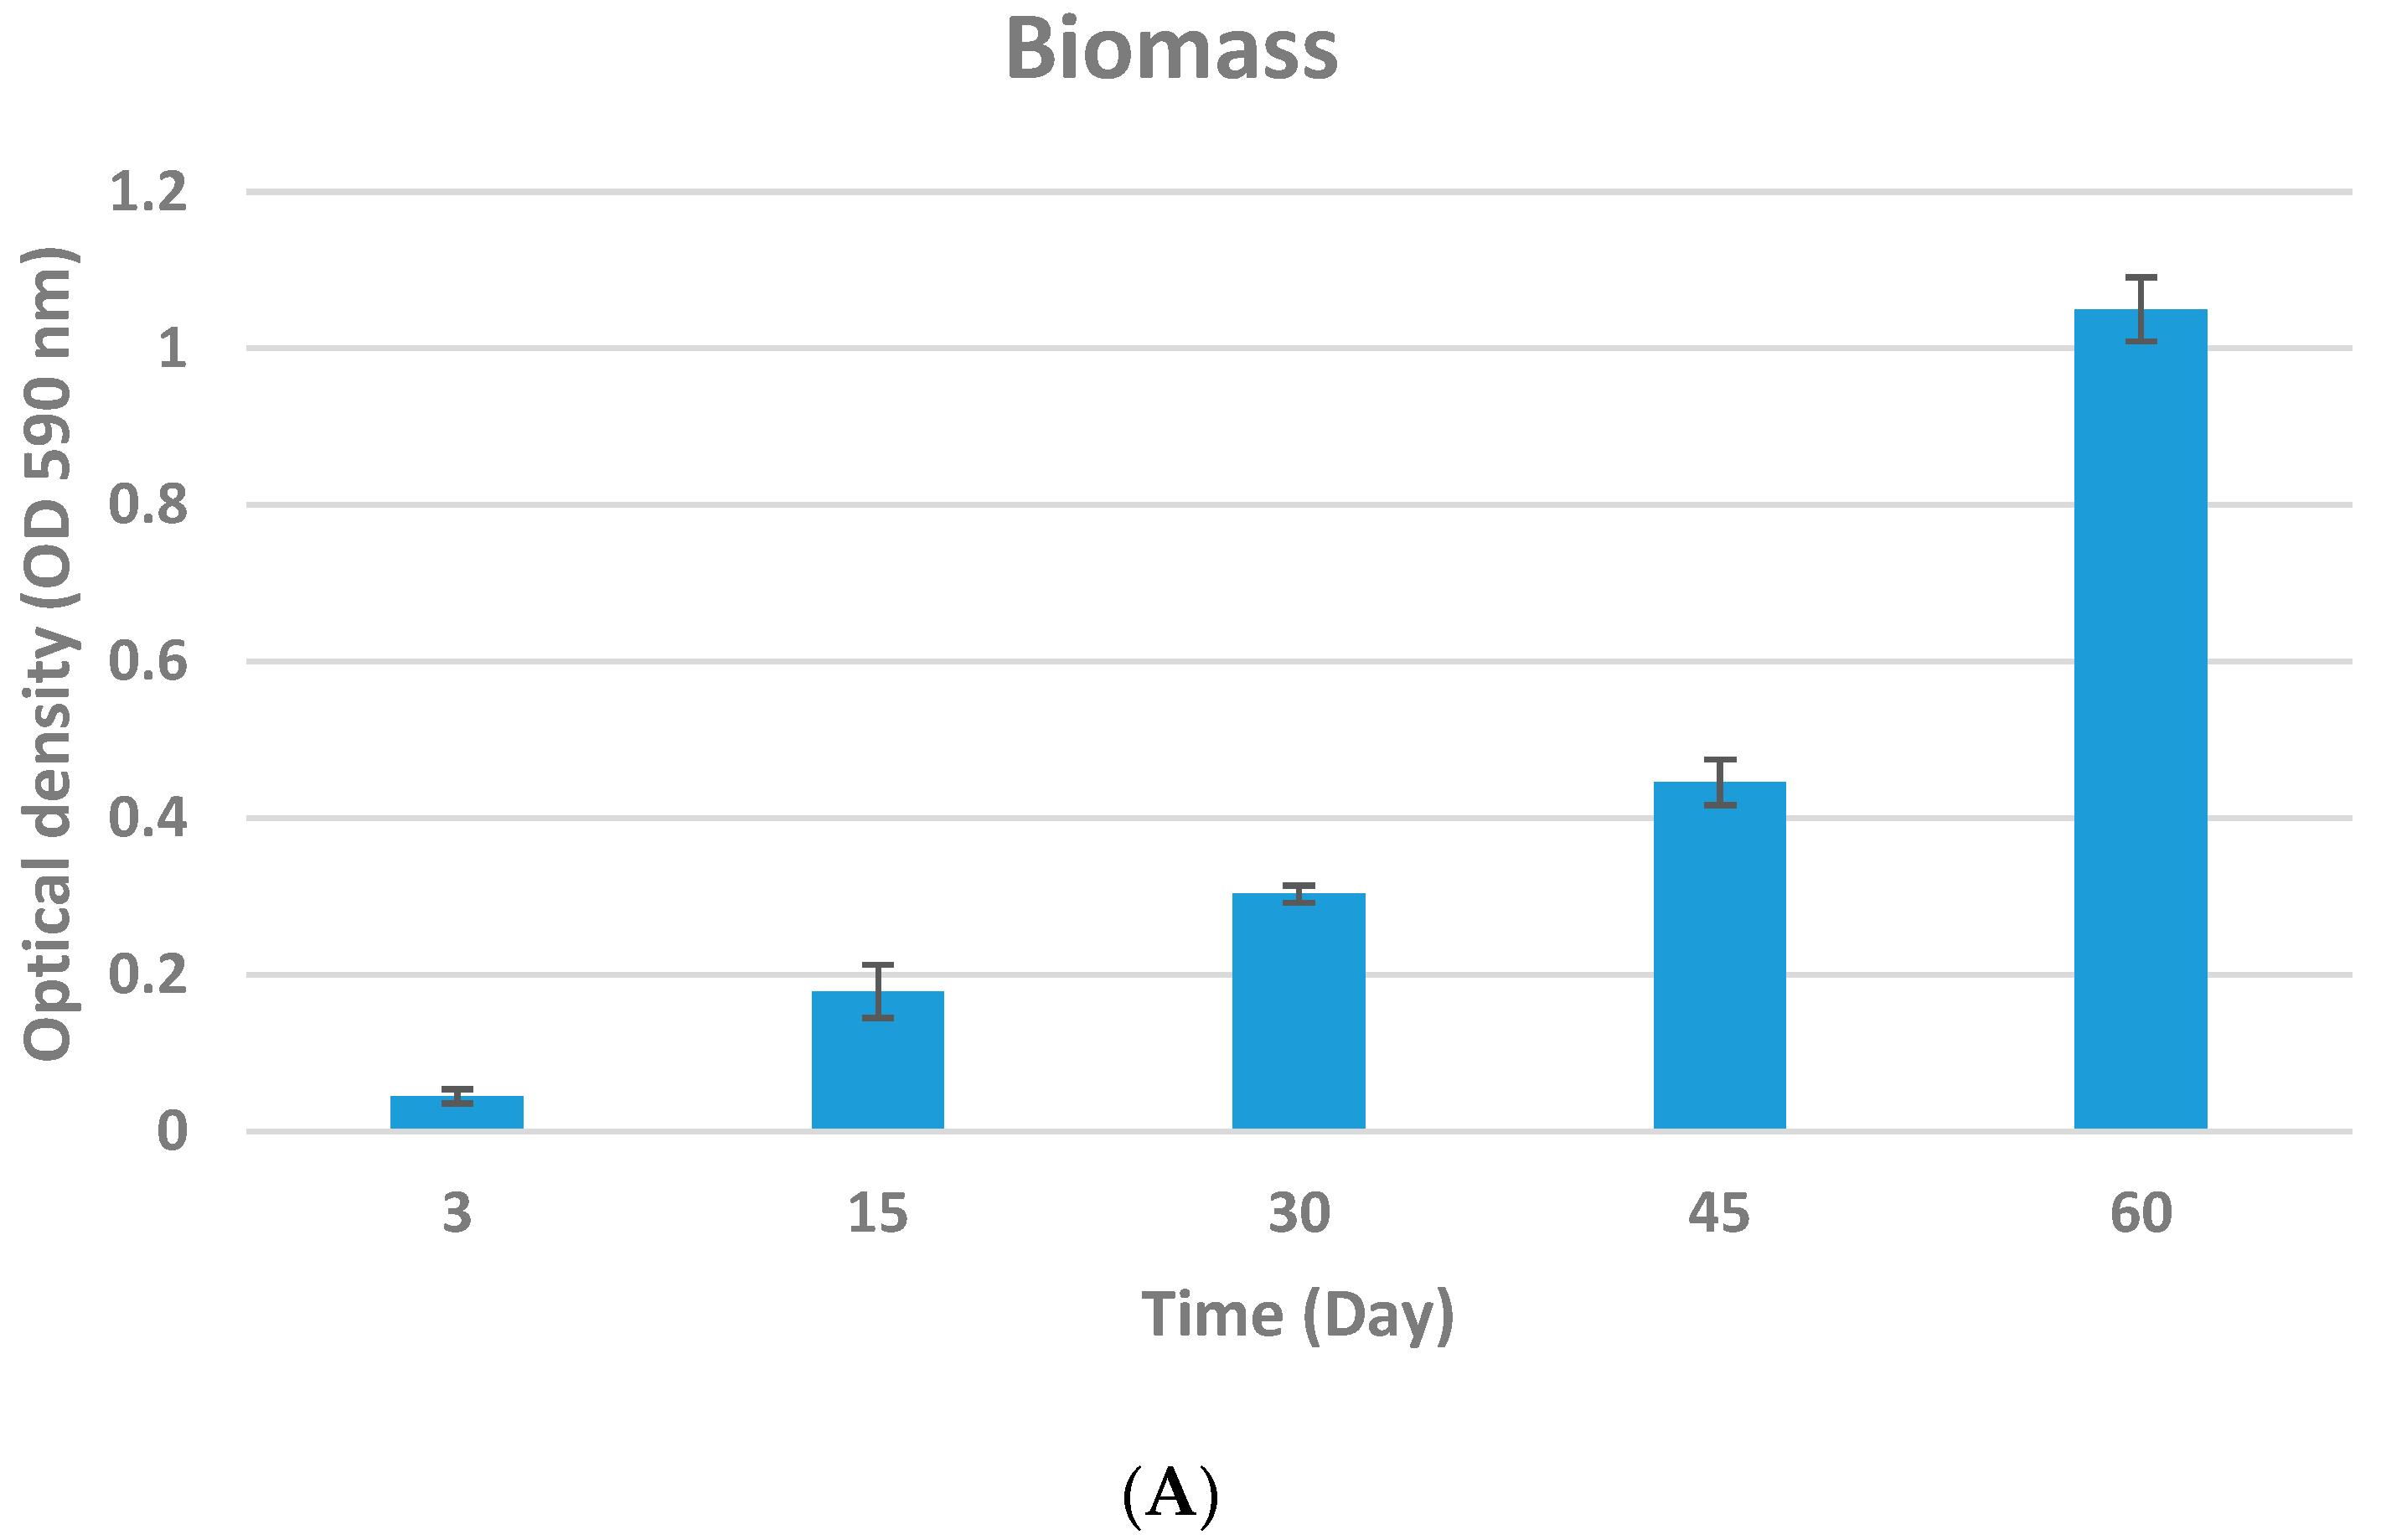
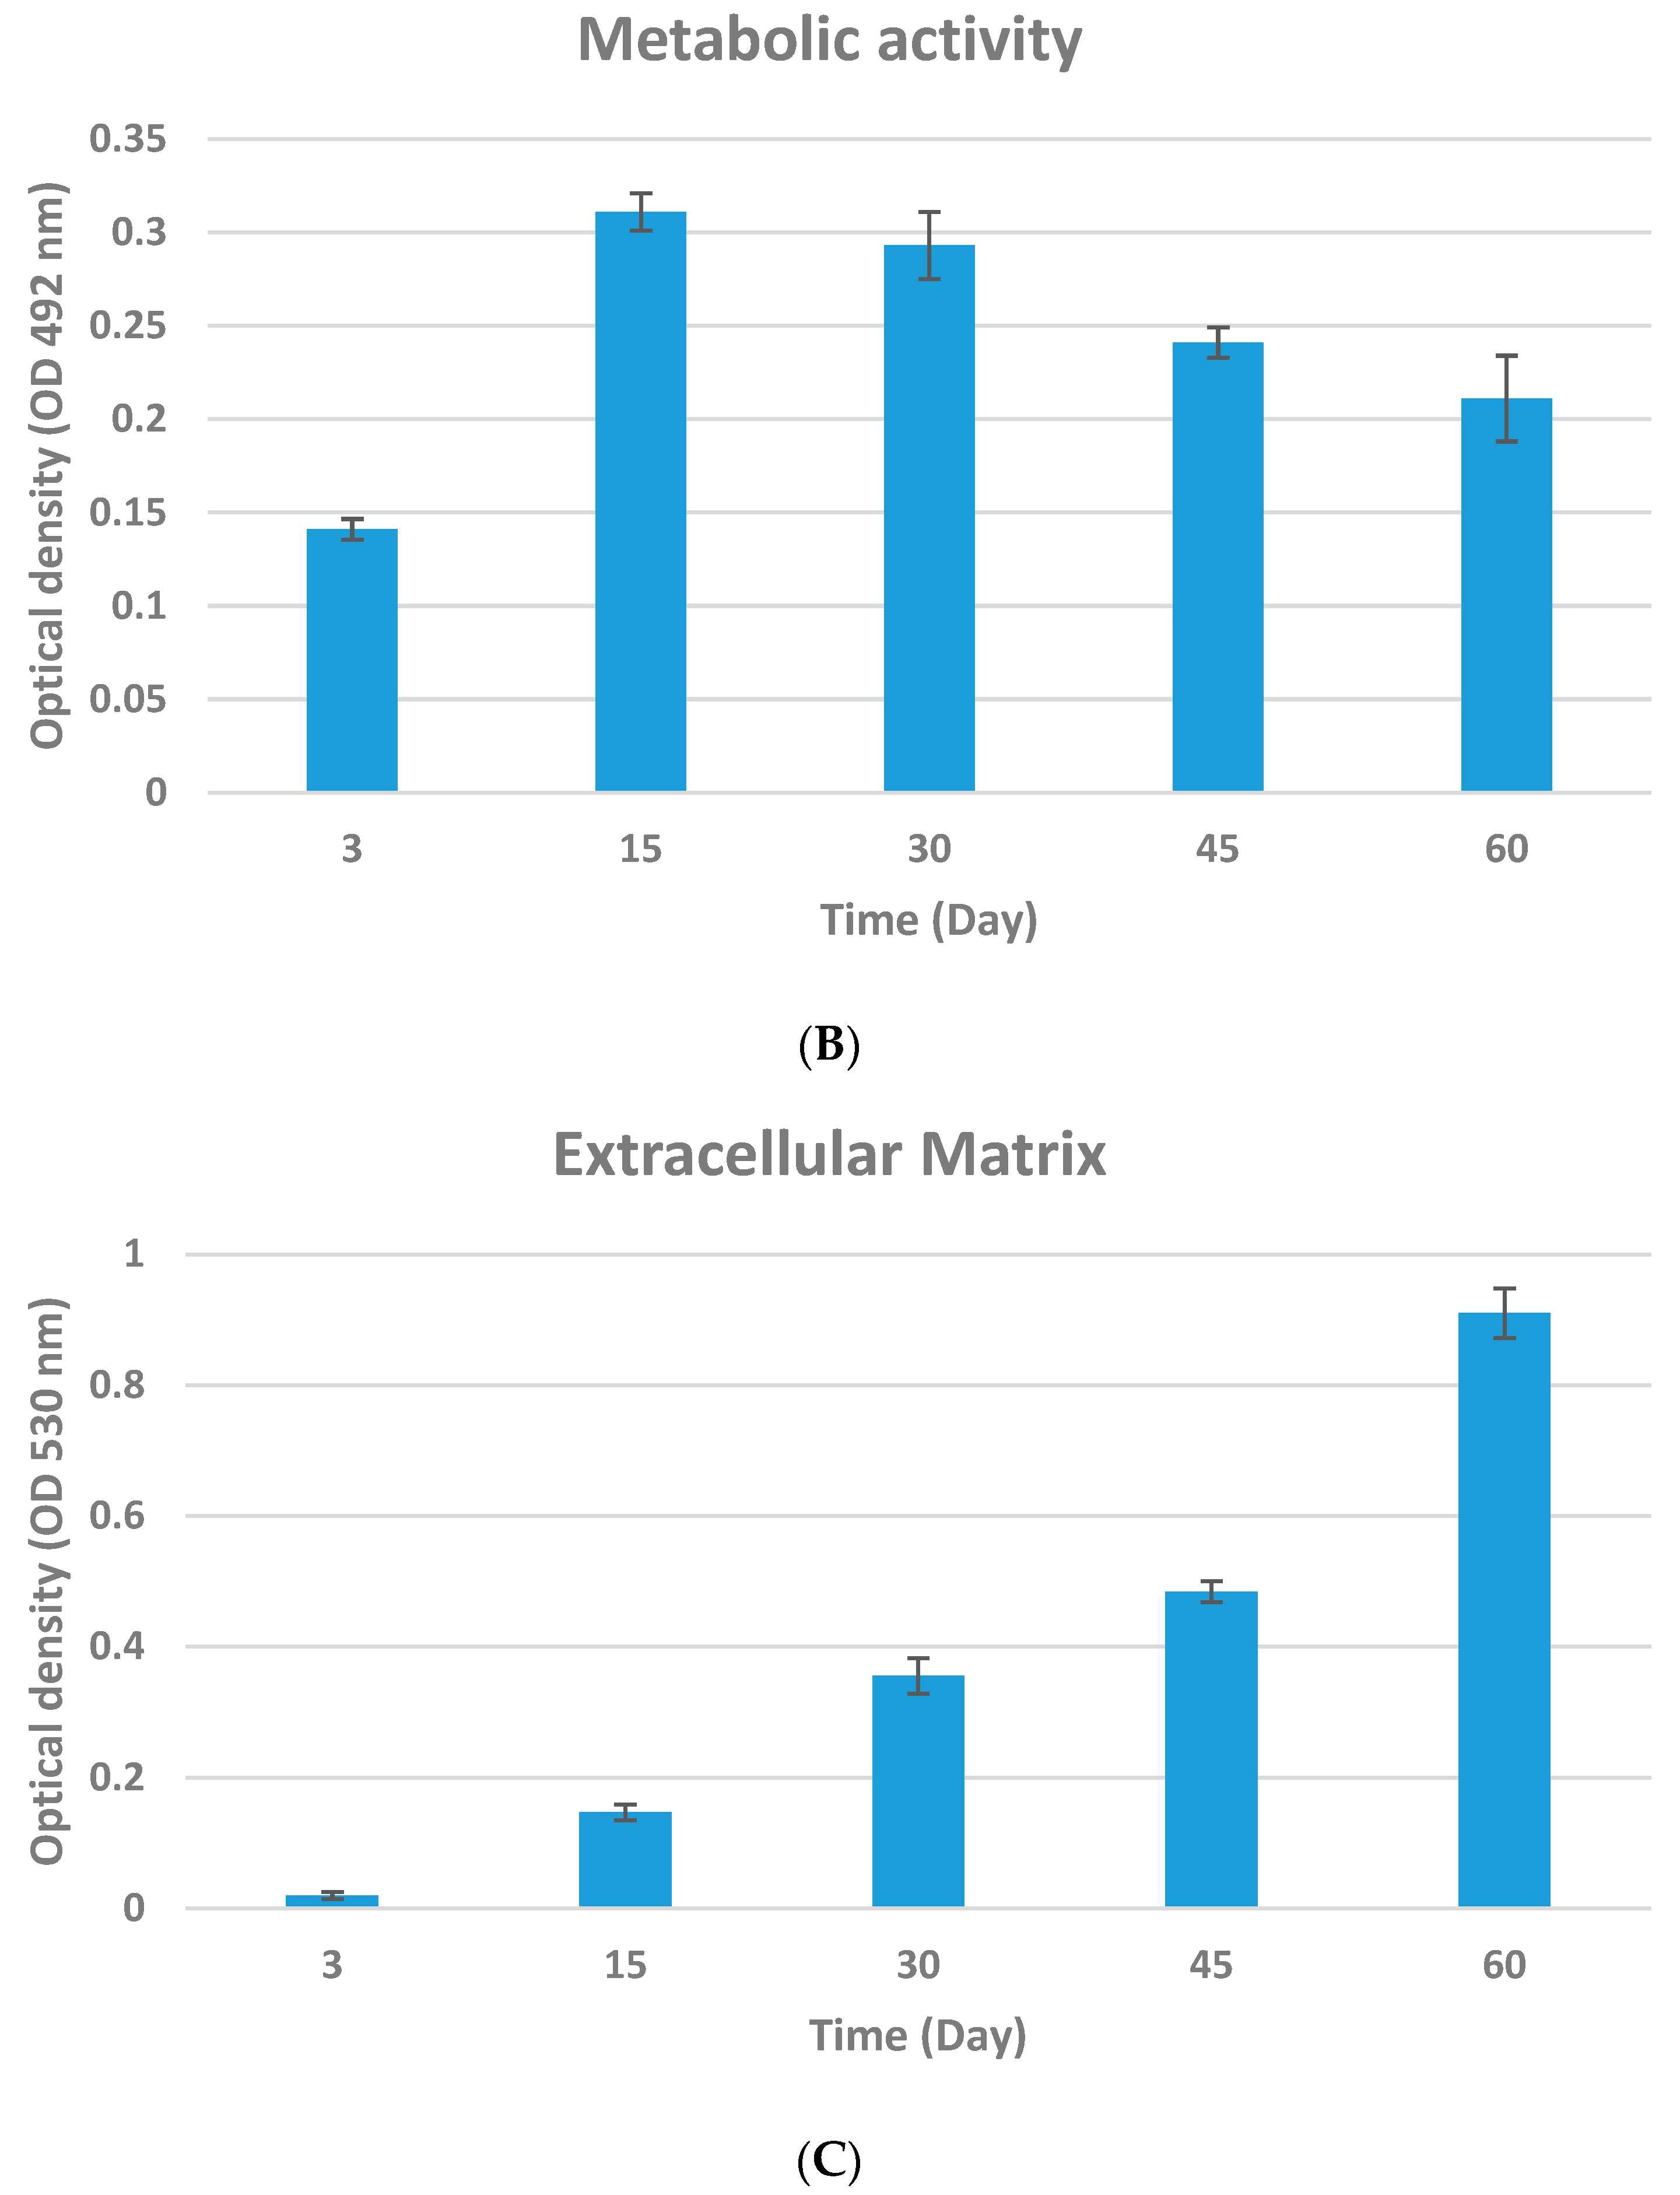
The ability of S. boulardii to form biofilm on the glass surface was evaluated over the 60 days of bottle ageing. Three main biofilm parameters, including biomass, metabolic activity, and extracellular matrix, were measured by crystal violet, XTT, and safranin procedures, respectively. The statistical analysis between time points revealed significant differences in the amount of biomass, biological activity, and extracellular matrix, indicating biofilm formation on the glass surface (Figure 3). Biomass and extracellular matrix increased in a time-dependent manner and reached their highest amount after 60 days of storage (p < 0.05). However, a low metabolic activity was recorded despite the presence of a thick biofilm (high biomass and extracellular matrix) at day 60 (p > 0.05).

3.3. Biofilm Morphology

The biofilm formation of Sc.b. CNCM I-745 on the glass surface was inspected by microscopic observations. Light and SEM micrographs demonstrate that Sc.b. CNCM I-745 has the potential to adhere and form biofilm on the glass surface. Light microscopy images revealed the presence of biofilms composed of a thin matrix of budding yeast cells and developed microcolonies (Figure 4A). SEM images illustrate biofilm structure and production of exopolysaccharides by Sc.b. CNCM I-745 (Figure 4B).

3.4. Expression Level of FLO11 Gene in Planktonic and Biofilm Cells

The attachment process of microbial cells is a necessary step for the initiation of biofilm formation. FLO11 has been widely recognized as a crucial gene in cell–substrate interactions and biofilm development in yeast [10,35,36]. We performed a qRT-PCR test to quantify comparative levels of FLO11 transcripts in both planktonic and biofilm cells during the exponential (12 h) and stationary (72 h) growth phase.
Genes whose expression differs by over 2.0-fold are considered significantly regulated [37]. We found a pronounced expression difference in the FLO11 gene when 18S rRNA was used as the reference gene. The FLO11 gene was up-regulated 2.6- and 370-fold in biofilm Sc.b. CNCM I-745 cells during the exponential and stationary growth phase, respectively.

4. Discussion

Saccharomyces spp. biofilms are studied frequently in laboratory media [6,25,38]; however, knowledge is scarce about the biofilm development of yeast in beverages. This is probably the first report on the biofilm formation of starter culture in an alcoholic beverage on the glass surface. According to our results, the adhesion and biofilm development of Sc.b. CNCM I-745 on the glass surface depends on the nutrient content of the beer. Differences in glucose and maltose content of beer in experiment time points may play a major role in the difference in quantities of biofilm biomass.
The first parameter we investigated, the existence of a glucose and maltose gradient across the biofilm formation, showed remarkable variation. The rate of biomass and extracellular matrix development was considerably increased (Figure 3A,C) as the sugar content of the beer decreased (Table 2). It is already known that FLO11 encodes an important cell surface glycoprotein as part of a superfamily of fungal cell surface adhesion proteins (adhesins) present in Saccharomyces and Candida species. In Saccharomyces spp., FLO11 is essential for mat formation, adhesion to surfaces, and filamentous growth [39,40]. FLO11 gene expression and biofilm formation are enhanced under glucose starvation. Reynolds and Fink [5] reported that Sc.c. makes a dense biofilm on plastic surfaces, and the adhesion was increased as the glucose concentration was lowered. This process is regulated through the cAMP–PKA and SNF1 pathways [8,41]. High glucose concentration controls biofilm formation in the opposite manner by increased Cyc8p mediated FLO11 repression [38]. D-glucose plays a vital role in determining the extent of maltose fermentation. In batch fermentation, yeast uses wort sugars in an ordered fashion, with glucose being assimilated first, followed by the major wort sugar, maltose [42]. Comparing the transport of constituent monosaccharides, which are carried out by diffusion through hexose transporters, maltose is internalized in an active process by permeases; then, it is hydrolyzed to glucose units by the maltase enzyme (α-glucosidase) [43,44]. The synthesis of the maltase enzyme is prevented in the presence of glucose in the medium, which is termed glucose repression [45]. In our experiment, the 5% glucose adjunct was utilised mostly during the first three days of storage, while the maltose concentration remained relatively constant. The maltose consumption accelerated when glucose was in a very trace amount (0.1%) and vanished toward the end of the ageing period. This is in the same line with the findings of de Paula and de Souza Lago [20] who reported that in the presence of maltose, probiotic Sc. c. WB-06 was shown to prefer glucose as the main source of carbon, and the maltose utilization was inhibited at a glucose concentration above 8 g/L.
Secondly, we quantified the biofilm characteristics by three different methods. According to obtained results, considerable variability in biofilm parameters was observed at different time points. One noteworthy result of the study is the increase in biomass with time while biological activity decreased. This finding is supported by a study comparing biofilm formation in terms of biomass and activity [46]. This result may be found counterintuitive with the viable count of Sc.b. CNCM I-745 as the numbers remained nearly constant at the end of the ageing period; however, it should be noted that XTT assay measures the metabolic activity of viable cells, not necessarily reflecting all culturable cells [47]. The relationship between the XTT method and the subsequent colorimetric signal is not always proportional [48]. The XTT assay is based on metabolic activity, which might be altered in the basal layer due to limited access to nutrients and oxygen; consequently, the absorbance may not determine the exact number of live cells. A similar experience has already been reported in biofilm studies due to the decreased penetration of the XTT solution inside the dense biofilm structure [31,49]. The same as biomass, ECM production increased over time. However, Sc.c. had long been believed as a none-ECM-producer yeast before the report by Beauvais and Loussert [50]. They revealed that FLO1 expressing cells produce an extracellular matrix composed of glucose and mannose polysaccharides that surround cells but do not confer resistance to ethanol. The ECM provides yeast cells with a variety of advantages, such as adhesion, nutritional sources, and protection [51]. In our study, the produced ECM by Sc.b. CNCM I-745 was visibly observed through SEM analysis (Figure 4). This finding is in line with previous research on ECM. [52,53].
Thirdly, we investigated the cell stress from the beer and viability over the bottle-ageing period. The yeast cell viability as high as possible is essential in beer fermentation. Furthermore, this parameter profoundly impacts the fermentation process and beer quality. The effect of storage time on biofilm formation is multi-fold. Mercier-Bonin [54] devised a glass/yeast model to evaluate the biofilm formation of Sc.c. on the glass plate. They found that by increasing contact time, cells were firmly stuck to the glass plate due to the release of macromolecules, such as proteins from lysed cells. During beer production, yeasts are subjected to several stress factors, among them are pH changes and ethanol production, while struggling to adapt to the adverse conditions found during the fermentation and ageing. It is noteworthy that pH value may be of particular ecological importance to budding yeast. The adherence characteristics of the adhesin FLO11, which is essential for adherence, are pH-dependent [35]. Adhesion of the cell-surface increases as the pH value decreases between 5.5 and 3.9 [55]. In our study, during the fermentation of wort and bottle ageing of beer, the pH value declined between the range mentioned above, stimulating Sc.b. biofilm formation. Surprisingly, glucose disrupts biofilm and releases adhered cells [38]. Additionally, maltose is introduced as a dispersing agent on attached cells. In a study by Kleyn and Hough [56], where flocculation of S. cerevisiae appeared at pH 3.5, the addition of maltose (concentration of 10% w/v) had dispersing effect on flocculated cells; however, in practice, wort sugars do not provide such a concentration of maltose. Yeasts producing higher concentrations of ethanol are favorable in brewing; however, as the fermentation proceeds, yeasts are exposed to ethanol stress and osmotic pressure. Produced ethanol during the ageing period (4% at day 60) could positively affect biofilm formation since Sc.c. exhibits higher ethanol stress resistance in biofilms relative to planktonic cells [56]. In brewing practice, the use of nutrient supplements improves ethanol productivity. In an experiment to elucidate the effect of glucose on maltose fermentation, when prior to fermentation, a small amount of D-glucose was added to the purified maltose; the alcohol yield was 88.7% of the experiment conducted with D-glucose. Interestingly, if the maltose contains 1% of D-glucose as an initial accelerator, then the alcohol yield is the same as with D-glucose alone [57]. Our results indicated that Sc.b. was able to efficiently produce ethanol as the main metabolite from glucose and maltose. We did not observe residual sugars at the end of the ageing period. In a previous study, Candida glabrata failed to produce ethanol from maltose [58]. Among the volatile acids identified in beer, acetate has the greatest amount quantitatively, comprising 40 to 80% of the total, giving the beer a sour taste. The acetate content of the beer was 0.38 g/L, and a similar value was found in a study by Liu [59]. Glycerol is produced throughout alcoholic fermentation and leads to viscosity and sensory quality [60]. Glycerol accumulation during fermentation is strain-dependent, and screening studies have been conducted to isolate high glycerol-producing strains [61]. The Sc.b. strain CNCM I-745 produced 1.68 g/L glycerol after wort fermentation; approximately the same amount was reported by de Paula and de Souza Lago [20] in a probiotic wheat beer. According to obtained results, the probiotic Sc.b. strain CNCM I-745 presented a diversified fermentative characteristic regarding utilizing maltose and producing ethanol and glycerol.
Finally, we performed further comparative transcriptional analysis and found a marked upregulation of FLO11 expression in biofilm cells during the exponential and stationary growth phase. These results demonstrate the function of FLO11 in Sc.b. CNCM I-745 biofilm formation on a glass surface (hydrophilic surface) is consistent with the first report on the role of FLO11 in Sc.c. adhesion to a glass surface and biofilm development [36]. In previous work, Purevdorj-Gage and Orr [36] developed a FLO11 overexpression strain that readily adhered to a liquid-hydrophilic surface. They reported the FLO11 expression level 1663 and 652 relative to the FLO11 deletion mutant over the exponential and stationary phase.

5. Conclusions

During storage of beer fermented with probiotic S. boulardii CNCM I-745, a film was formed on the bottle wall that led to a haze-like appearance of the bottle. The results presented here revealed that S. boulardii CNCM I-745 could adhere and form biofilm in beer on the glass surface. This conclusion is supported by the results of the biofilm parameters, the higher FLO11 gene expression in S. boulardii CNCM I-745 biofilm compared to planktonic cells, and the microscopic visualization. The presented data suggest that cell stress from the brewing process and prolonged storage time might activate the adhesion of yeast on the glass surface. Further studies are required to explore an efficient additive in beer to hinder the biofilm formation of S. boulardii, as S. boulardii in biofilm may pose a health risk for people with low immunity or a central venous catheter.

Author Contributions

Conceptualization, K.M. and P.E.J.S.; methodology, K.M.; software, K.M.; validation, K.M. and P.E.J.S.; formal analysis, K.M.; investigation, K.M.; resources, P.E.J.S.; data curation, K.M.; writing—original draft preparation, K.M.; writing—review and editing, K.M. and P.E.J.S.; visualization, K.M. and P.E.J.S.; supervision, P.E.J.S.; project administration, P.E.J.S.; funding acquisition, P.E.J.S. All authors have read and agreed to the published version of the manuscript.

Funding

This research was funded by the Finland-China Food and Health Network (FCFH).

Conflicts of Interest

The authors declare no conflict of interest.

References

  1. Riedl, R.M.A.F. Systems for Validation of Brewing Equipment Hygiene on the Basis of Characteristic Biofilm Organisms; mediaTUM, Universitätsbibliothek, Technische Universität München: Munich, Germany, 2020. [Google Scholar]
  2. Galiè, S.; García-Gutiérrez, C.; Miguélez, E.M.; Villar, C.J.; Lombó, F. Biofilms in the Food Industry: Health Aspects and Control Methods. Front. Microbiol. 2018, 9, 898. [Google Scholar] [CrossRef] [PubMed]
  3. Lolis, N.; Veldekis, D.; Moraitou, H.; Kanavaki, S.; Velegraki, A.; Triandafyllidis, C.; Tasioudis, C.; Pefanis, A.; Pneumatikos, I. Saccharomyces boulardii fungaemia in an intensive care unit patient treated with caspofungin. Crit. Care 2008, 12, 1–2. [Google Scholar]
  4. Richard, M.L.; Nobile, C.J.; Bruno, V.M.; Mitchell, A.P. Candida albicans Biofilm-Defective Mutants. Eukaryot. Cell 2005, 4, 1493–1502. [Google Scholar] [CrossRef] [Green Version]
  5. Reynolds, T.B.; Fink, G.R. Bakers’ yeast, a model for fungal biofilm formation. Science 2001, 291, 878–881. [Google Scholar] [CrossRef]
  6. Yang, L.; Zheng, C.; Chen, Y.; Ying, H. FLO genes family and transcription factor MIG1 regulate Saccharomyces cerevisiae biofilm formation during immobilized fermentation. Front. Microbiol. 2018, 9, 1860. [Google Scholar] [CrossRef] [PubMed]
  7. Stringer, J.R.; Keely, S.P. Genetics of Surface Antigen Expression in Pneumocystis carinii. Infect. Immun. 2001, 69, 627–639. [Google Scholar] [CrossRef] [Green Version]
  8. Bojsen, R.K.; Andersen, K.S.; Regenberg, B. Saccharomyces cerevisiae—A model to uncover molecular mechanisms for yeast biofilm biology. FEMS Immunol. Med Microbiol. 2012, 65, 169–182. [Google Scholar] [CrossRef] [Green Version]
  9. Teunissen, A.W.R.H.; Steensma, H.Y. The dominant flocculation genes of Saccharomyces cerevisiae constitute a new subtelomeric gene family. Yeast 1995, 11, 1001–1013. [Google Scholar] [CrossRef]
  10. Zara, S.; Bakalinsky, A.T.; Zara, G.; Pirino, G.; Demontis, M.A.; Budroni, M. FLO11 -Based Model for Air-Liquid Interfacial Biofilm Formation by Saccharomyces cerevisiae. Appl. Environ. Microbiol. 2005, 71, 2934–2939. [Google Scholar] [CrossRef] [Green Version]
  11. Verstrepen, K.J.; Klis, F.M. Flocculation, adhesion and biofilm formation in yeasts. Mol. Microbiol. 2006, 60, 5–15. [Google Scholar] [CrossRef]
  12. Douglas, L.M.; Li, L.; Yang, Y.; Dranginis, A.M. Expression and characterization of the flocculin Flo11/Muc1, a Saccharomyces cerevisiae mannoprotein with homotypic properties of adhesion. Eukaryot. Cell 2007, 6, 2214–2221. [Google Scholar] [CrossRef]
  13. Silva, A.P.; Jager, G.; van Bommel, R.; van Zyl, H.; Voss, H.-P.; Hogg, T.; Pintado, M.; de Graaf, C. Functional or emotional? How Dutch and Portuguese conceptualise beer, wine and non-alcoholic beer consumption. Food Qual. Prefer. 2016, 49, 54–65. [Google Scholar] [CrossRef]
  14. Barnett, A.; Velasco, C.; Spence, C. Bottled vs. canned beer: Do they really taste different? Beverages 2016, 2, 25. [Google Scholar] [CrossRef] [Green Version]
  15. Back, W. Biofilme in der Brauerei und Getrankeindustrie-15 Jahre Praxiserfahrung. Brauwelt 2003, 24, 766–777. [Google Scholar]
  16. Flemming, H. Wingender: The biofilm matrix. Nat. Rev. Microbiol. 2010, 8, 623–633. [Google Scholar] [CrossRef]
  17. Vávrová, A.; Matoulková, D.; Balážová, T.; Šedo, O. MALDI-TOF MS Analysis of Anaerobic Bacteria Isolated from Biofilm-Covered Surfaces in Brewery Bottling Halls. J. Am. Soc. Brew. Chem. 2014, 72, 95–101. [Google Scholar] [CrossRef]
  18. Riedl, R.; Fütterer, J.; Goderbauer, P.; Michel, M.; Jacob, F.; Hutzler, M. Combined Yeast Biofilm Screening—Characterization and Validation of Yeast Related Biofilms in a Brewing Environment with Combined Cultivation and Specific Real-time PCR Screening of Selected Indicator Species. J. Am. Soc. Brew. Chem. 2019, 77, 99–112. [Google Scholar] [CrossRef]
  19. Wagner, E.M.; Thalguter, S.; Wagner, M.; Rychli, K. Presence of Microbial Contamination and Biofilms at a Beer Can Filling Production Line. J. Food Prot. 2021, 84, 896–902. [Google Scholar] [CrossRef]
  20. de Paula, B.P.; de Souza Lago, H.; Firmino, L.; Lemos Júnior, W.J.F.; Dutra Corrêa, M.F.; Guerra, A.F.; Pereira, K.S.; Zarur Coelho, M.A. Technological features of Saccharomyces cerevisiae var. boulardii for potential probiotic wheat beer development. LWT 2021, 135, 110233. [Google Scholar]
  21. Senkarcinova, B.; Dias, I.A.G.; Nespor, J.; Branyik, T. Probiotic alcohol-free beer made with Saccharomyces cerevisiae var. boulardii. LWT 2019, 100, 362–367. [Google Scholar] [CrossRef]
  22. Reitenbach, A.F.; Iwassa, I.J.; Barros, B.C.B. Production of functional beer with the addition of probiotic: Saccharomyces boulardii. Res. Soc. Dev. 2021, 10. [Google Scholar] [CrossRef]
  23. Li, R.; Yassami, S.; Kiviniemi, E.A.; Qiao, W.; Takala, T.M.; Saris, P.E. Listeria decontamination of chicken meat with beer brewed with bacteriocin producing Saccharomyces boulardii. LWT 2021, 152, 112323. [Google Scholar] [CrossRef]
  24. Rodriguez, E.; Martínez-Flores, H.; Rodiles-Lopez, O.; Zamora-Vega, R.; Salgado-Garciglia, R.; Pérez-Sánchez, E. Survival rate of Saccharomyces boulardii adapted to a functional freeze-dried yogurt: Experimental study related to processing, storage and digestion by Wistar rats. Funct. Foods Health Dis. 2017, 7, 98–114. [Google Scholar]
  25. Speranza, B.; Corbo, M.R.; Campaniello, D.; Altieri, C.; Sinigaglia, M.; Bevilacqua, A. Biofilm formation by potentially probiotic Saccharomyces cerevisiae strains. Food Microbiol. 2020, 87, 103393. [Google Scholar] [CrossRef] [PubMed]
  26. Muller, R. The production of low-alcohol and alcohol-free beers by limited fermentations. Ferment 1990, 3, 224–230. [Google Scholar]
  27. Muller, R. The effects of mashing temperature and mash thickness on wort carbohydrate composition. J. Inst. Brew. 1991, 97, 85–92. [Google Scholar] [CrossRef]
  28. Peeters, E.; Nelis, H.J.; Coenye, T. Comparison of multiple methods for quantification of microbial biofilms grown in microtiter plates. J. Microbiol. Methods 2008, 72, 157–165. [Google Scholar] [CrossRef] [PubMed] [Green Version]
  29. Mowat, E.; Butcher, J.; Lang, S.; Williams, C.; Ramage, G. Development of a simple model for studying the effects of antifungal agents on multicellular communities of Aspergillus fumigatus. J. Med Microbiol. 2007, 56, 1205–1212. [Google Scholar] [CrossRef] [PubMed] [Green Version]
  30. Mello, T.P.; Aor, A.C.; Gonçalves, D.S.; Seabra, S.H.; Branquinha, M.H.; Santos, A.L.S. Assessment of biofilm formation by Scedosporium apiospermum, S. aurantiacum, S. minutisporum and Lomentospora prolificans. Biofouling 2016, 32, 737–749. [Google Scholar] [CrossRef]
  31. Mello, T.P.; Oliveira, S.S.C.; Frasés, S.; Branquinha, M.H.; Santos, A.L.S. Surface properties, adhesion and biofilm formation on different surfaces by Scedosporium spp. and Lomentospora prolificans. Biofouling 2018, 34, 800–814. [Google Scholar] [CrossRef] [PubMed]
  32. Mattila, H.; Kačar, D.; Mali, T.; Lundell, T. Lignocellulose bioconversion to ethanol by a fungal single-step consolidated method tested with waste substrates and co-culture experiments. AIMS Energy 2018, 6, 866–879. [Google Scholar] [CrossRef]
  33. Purevdorj-Gage, B.; Sheehan, K.B.; Hyman, L.E. Effects of Low-Shear Modeled Microgravity on Cell Function, Gene Expression, and Phenotype in Saccharomyces cerevisiae. Appl. Environ. Microbiol. 2006, 72, 4569–4575. [Google Scholar] [CrossRef] [PubMed] [Green Version]
  34. Narendranath, N.V.; Power, R. Relationship between pH and Medium Dissolved Solids in Terms of Growth and Metabolism of Lactobacilli and Saccharomyces cerevisiae during Ethanol Production. Appl. Environ. Microbiol. 2005, 71, 2239–2243. [Google Scholar] [CrossRef] [Green Version]
  35. Forehand, A.L.; Myagmarsuren, D.; Chen, Z.; Murphy, H.A. Variation in pH gradients and FLO11 expression in mat biofilms from environmental isolates of the yeast Saccharomyces cerevisiae. MicrobiologyOpen 2022, 11, e1277. [Google Scholar] [CrossRef] [PubMed]
  36. Purevdorj-Gage, B.; Orr, M.E.; Stoodley, P.; Sheehan, K.B.; Hyman, L.E. The role of FLO11 in Saccharomyces cerevisiae biofilm development in a laboratory based flow-cell system. FEMS Yeast Res. 2007, 7, 372–379. [Google Scholar] [CrossRef] [PubMed]
  37. Li, Z.; Chen, Y.; Liu, D.; Zhao, N.; Cheng, H.; Ren, H.; Guo, T.; Niu, H.; Zhuang, W.; Wu, J.; et al. Involvement of glycolysis/gluconeogenesis and signaling regulatory pathways in Saccharomyces cerevisiae biofilms during fermentation. Front. Microbiol. 2015, 6, 139. [Google Scholar] [CrossRef] [PubMed]
  38. Van Nguyen, P.; Plocek, V.; Váchová, L.; Palková, Z. Glucose, Cyc8p and Tup1p regulate biofilm formation and dispersal in wild Saccharomyces cerevisiae. npj Biofilms Microbiomes 2020, 6, 1–10. [Google Scholar] [CrossRef] [Green Version]
  39. Lo, W.-S.; Dranginis, A.M. The Cell Surface Flocculin Flo11 Is Required for Pseudohyphae Formation and Invasion by Saccharomyces cerevisiae. Mol. Biol. Cell 1998, 9, 161–171. [Google Scholar] [CrossRef] [Green Version]
  40. Kumamoto, C.A.; Vinces, M.D. Alternative Candida albicans lifestyles: Growth on Surfaces. Annu. Rev. Microbiol. 2005, 59, 113–133. [Google Scholar] [CrossRef]
  41. Livas, D.; Almering, M.J.; Daran, J.-M.; Pronk, J.T.; Gancedo, J.M. Transcriptional responses to glucose in Saccharomyces cerevisiae strains lacking a functional protein kinase A. BMC Genom. 2011, 12, 405. [Google Scholar] [CrossRef] [Green Version]
  42. Boulton, C.; Quain, D. Brewing Yeast and Fermentation; John Wiley & Sons: Hoboken, NJ, USA, 2008; p. 210. [Google Scholar]
  43. Stewart, G.; Zheng, X.; Russell, I. Wort Sugar Uptake and Metabolism—The Influence of Genetic and Environmental Factors. In Poceedings of Congress- European Brewery Convention; Oxford University Press: Oxford, UK, 1995. [Google Scholar]
  44. Griffin, S.R. Maltase activity in Saccharomyces cerevisiae during fermentation of synthetic media. J. Inst. Brew. 1969, 75, 342–346. [Google Scholar] [CrossRef]
  45. Lee, Y.-S.; Lee, W.G.; Chang, Y.K.; Chang, H.N. Modelling of ethanol production by Saccharomyces cerevisiae from a glucose and maltose mixture. Biotechnol. Lett. 1995, 17, 791–796. [Google Scholar] [CrossRef]
  46. Henriques, M.; Azeredo, J.; Oliveira, R. Candida albicans and Candida dubliniensis: Comparison of biofilm formation in terms of biomass and activity. Br. J. Biomed. Sci. 2006, 63, 5–11. [Google Scholar] [CrossRef] [PubMed] [Green Version]
  47. Honraet, K.; Goetghebeur, E.; Nelis, H.J. Comparison of three assays for the quantification of Candida biomass in suspension and CDC reactor grown biofilms. J. Microbiol. Methods 2005, 63, 287–295. [Google Scholar] [CrossRef] [PubMed]
  48. Kuhn, D.M.; Balkis, M.; Chandra, J.; Mukherjee, P.K.; Ghannoum, M.A. Uses and Limitations of the XTT Assay in Studies of Candida Growth and Metabolism. J. Clin. Microbiol. 2003, 41, 506–508. [Google Scholar] [CrossRef]
  49. Rollin-Pinheiro, R.; de Meirelles, J.V.; Vila, T.V.M.; Fonseca, B.B.; Alves, V.; Frases, S.; Rozental, S.; Barreto-Bergter, E. Biofilm Formation by Pseudallescheria/Scedosporium Species: A Comparative Study. Front. Microbiol. 2017, 8, 1568. [Google Scholar] [CrossRef] [Green Version]
  50. Beauvais, A.; Loussert, C.; Prevost, M.C.; Verstrepen, K.; Latgé, J.P. Characterization of a biofilm-like extracellular matrix in FLO1-expressing Saccharomyces cerevisiae cells. FEMS Yeast Res. 2009, 9, 411–419. [Google Scholar] [CrossRef] [Green Version]
  51. Santos, A.L.S.d.; Galdino, A.C.M.; de Mello, T.P.; Ramos, L.d.S.; Branquinha, M.H.; Bolognese, A.M.; Neto, J.C.; Roudbary, M. What are the advantages of living in a community? A microbial biofilm perspective! Memórias Do Inst. Oswaldo Cruz 2018, 113. [Google Scholar] [CrossRef] [Green Version]
  52. Abdo, H.; Catacchio, C.R.; Ventura, M.; D’Addabbo, P.; Calabrese, F.M.; Laurent, J.; David-Vaizant, V.; Alexandre, H.; Guilloux-Bénatier, M.; Rousseaux, S. Colonization of Wild Saccharomyces cerevisiae Strains in a New Winery. Beverages 2020, 6, 9. [Google Scholar] [CrossRef] [Green Version]
  53. Mitchell, K.F.; Zarnowski, R.; Andes, D.R. The Extracellular Matrix of Fungal Biofilms. Fungal Biofilms Relat. Infect. 2016, 931, 21–35. [Google Scholar] [CrossRef]
  54. Mercier-Bonin, M.; Ouazzani, K.; Schmitz, P.; Lorthois, S. Study of bioadhesion on a flat plate with a yeast/glass model system. J. Colloid Interface Sci. 2004, 271, 342–350. [Google Scholar] [CrossRef] [PubMed]
  55. Bayly, J.C.; Douglas, L.M.; Pretorius, I.; Bauer, F.F.; Dranginis, A.M. Characteristics of Flo11-dependent flocculation in Saccharomyces cerevisiae. FEMS Yeast Res. 2005, 5, 1151–1156. [Google Scholar] [CrossRef] [Green Version]
  56. Kleyn, J.; Hough, J. The microbiology of brewing. Annu. Rev. Microbiol. 1971, 25, 583–608. [Google Scholar] [CrossRef]
  57. Blair, M.G.; Pigman, W. Fermentability of maltose. Arch. Biochem. Biophys. 1954, 48, 17–22. [Google Scholar] [CrossRef]
  58. Vincent, M.; Johnny, Q.; Adeni, D.S.A.; Suhaili, N. Potential of Candida glabrata from ragi as a bioethanol producer using selected carbohydrate substrates. Nusant. Biosci. 2020, 13. [Google Scholar] [CrossRef]
  59. Liu, F. Changes in organic acids during beer fermentation. J. Am. Soc. Brew. Chem. 2015, 73, 275–279. [Google Scholar] [CrossRef]
  60. Monošík, R.; Magdolen, P.; Streďanský, M.; Šturdík, E. Monitoring of monosaccharides, oligosaccharides, ethanol and glycerol during wort fermentation by biosensors, HPLC and spectrophotometry. Food Chem. 2013, 138, 220–226. [Google Scholar] [CrossRef]
  61. Zhao, X.; Procopio, S.; Becker, T. Flavor impacts of glycerol in the processing of yeast fermented beverages: A review. J. Food Sci. Technol. 2015, 52, 7588–7598. [Google Scholar] [CrossRef]
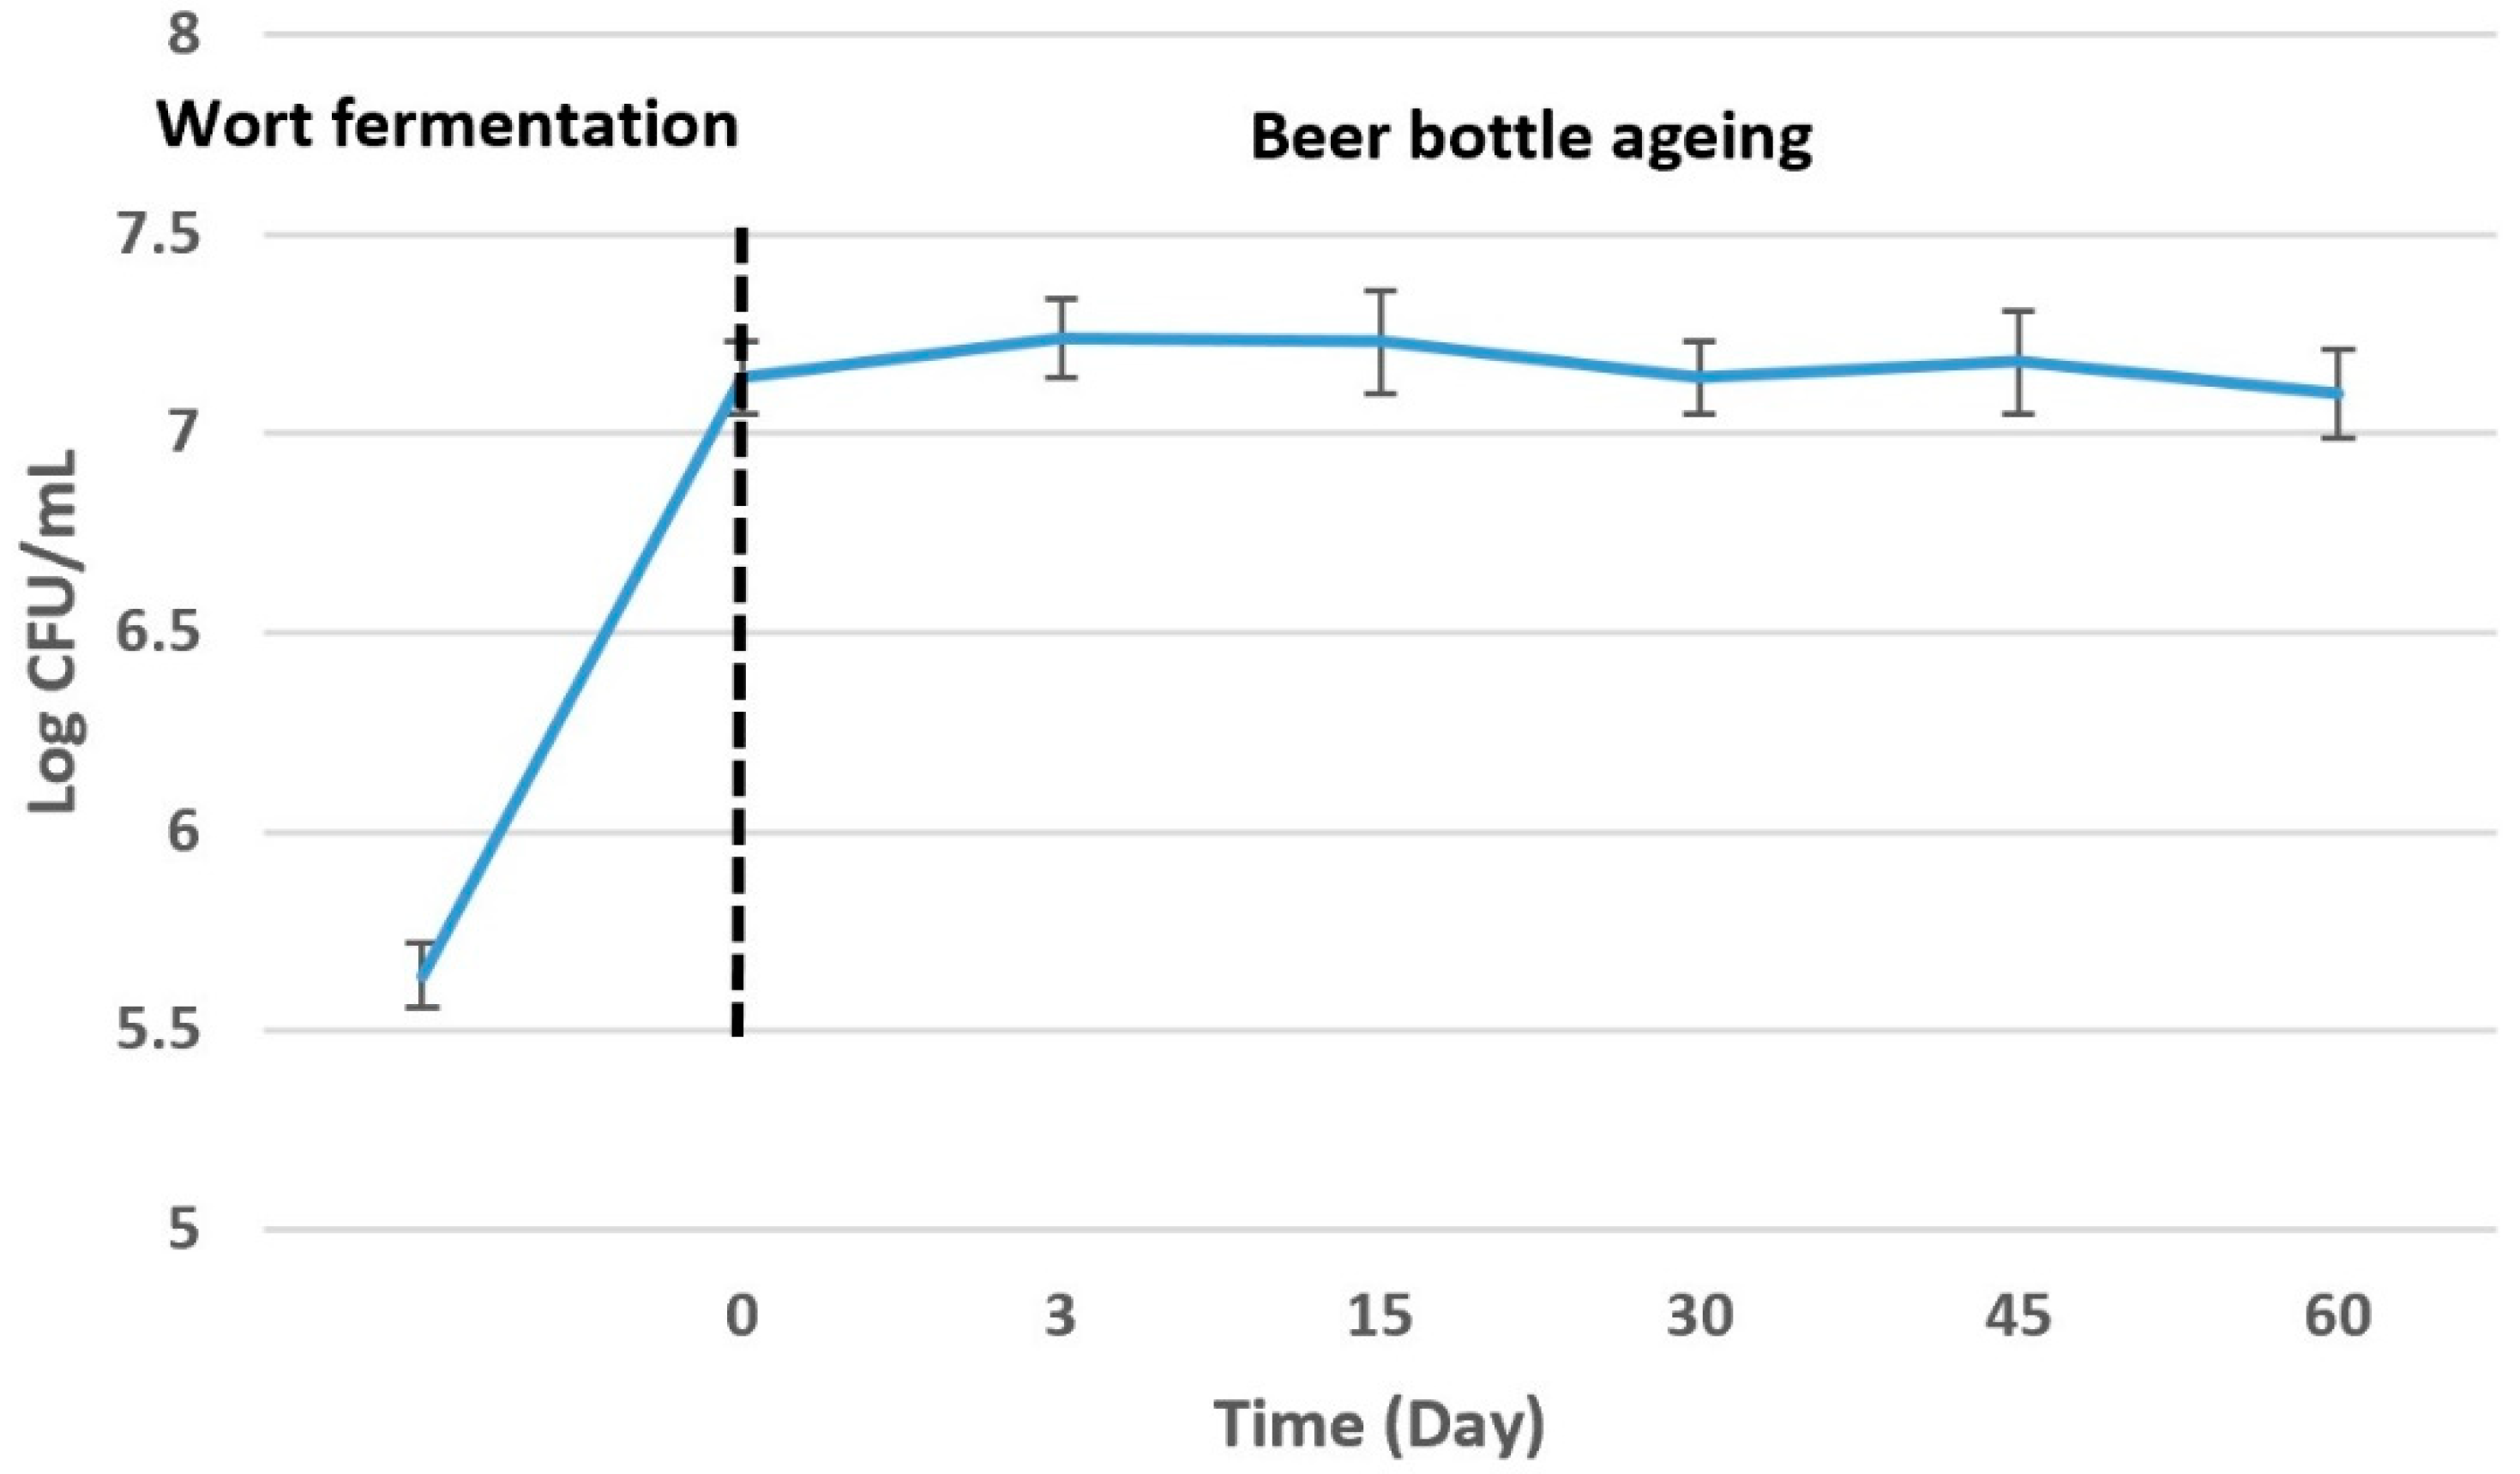
Figure 1. Survival of S. boulardii CNCM I-745 in probiotic beer during storage at 20 °C for 60 days. Wort fermentation was performed for 14 days.
Beverages 08 00077 g001
Figure 2. Changes in pH during the alcoholic fermentation and bottle ageing of probiotic beer.
Beverages 08 00077 g002
Figure 3. Biofilm formation by S. boulardii CNCM I-745 on glass surface during beer storage for 3, 15, 30, 45, and 60 days at 20 °C. After each time point, the 8-well glass slides were processed to detect (A) Yeast biomass by incorporation of crystal violet in methanol-fixed biofilms (at 590 nm), (B) metabolic activity by reduction of XTT in formazan by viable cells (492 nm), and (C) extracellular matrix by staining with safranin (530 nm). The results are presented as the means of three independent replicates ± SDs.
Beverages 08 00077 g003aBeverages 08 00077 g003b
Figure 4. Light microscopic and SEM observations of S. boulardii CNCM I-745 biofilms formed on the glass surface in the beer model after 72 h of storage at 20 °C. (A) Light microscopic micrographs (magnification: ×400, scale bar 5 μm) depicting attached single cells and developed microcolonies on the glass surface. (B) SEM micrographs displaying the biofilm structure and amorphous extracellular matrix between cells (arrows).
Beverages 08 00077 g004
Table 1. qRT-PCR primer pairs used in this study.
GeneForward Primer Sequence (5′–3′)Reverse Primer Sequence (5′–3′)Length (bp)
FLO11AACCAAGTCCATCCCAACCGCGAGTAGCAACCACATAAAG300
18STTAATGACCCACTCGGCACCACCACCACCCACAAAATC215
Table 2. Sugars (glucose and maltose) and metabolites (ethanol, glycerol, and acetate) content during malt extract fermentation and storage at 20 °C for 3, 15, 30, 45, and 60 days. For each storage time point, means in a column followed by the same letter are not significantly different (p ≥ 0.05).
ProcessTimeSugar Composition (g/L)Metabolites Production (g/L)
GlucoseMaltoseEthanolGlycerolAcetate
Wort fermentationDF0 *15.29 ± 0.16 a55.64 ± 0.22 a
Beer bottle ageingD0 **6.36 ± 0.12 b33.31 ± 0.13 b17.35 ± 0.13 a1.68 ± 0.07 a0.34 ± 0.06 a
D32.52 ± 0.09 c32.93 ± 0. 09 b18.88 ± 0.16 a1.58 ± 0.07 a0.36 ± 0.09 a
D151.99 ± 0.12 c30.06 ± 0.19 b17.23 ±0.11 a1.76 ± 0.08 a0.34 ± 0.07 a
D301.94 ± 0.11 c23.61 ± 0.14 c19.21 ± 0.08 a1.85 ± 0.04 a0.38 ± 0.07 a
D451.92 ± 0.07 c15.68 ± 0.08 d33.27 ± 0.14 b2.30 ±0.09 a0.34 ± 0.08 a
D601.21 ± 0.08 c40.36 ± 0.12 c2.28 ± 0.06 a0.38 ± 0.08 a
* DF0 refers to the beginning of wort fermentation. This process took 14 days. ** At bottling time (Day 0), 5 g/L glucose was added as an adjunct.
Publisher’s Note: MDPI stays neutral with regard to jurisdictional claims in published maps and institutional affiliations.