Article

The Influence of Green and Black Tea Infusion Parameters on Total Polyphenol Content and Antioxidant Activity by ABTS and DPPH Assays

by
Giuliana Vinci
*,
Fabrizio D’Ascenzo
,
Lucia Maddaloni
,
Sabrina Antonia Prencipe
and
Margherita Tiradritti
Department of Management, Sapienza University of Rome, Via del Castro Laurenziano 9, 00161 Rome, Italy
*
Author to whom correspondence should be addressed.
Beverages 2022, 8(2), 18; https://doi.org/10.3390/beverages8020018
Submission received: 15 January 2022 / Revised: 11 March 2022 / Accepted: 18 March 2022 / Published: 22 March 2022
(This article belongs to the Section Quality, Nutrition, and Chemistry of Beverages)

Abstract

:
Tea contains about 230 chemical bioactive compounds, of which polyphenols represent the most considerable fraction (30% of total dry weight). These compounds have relevant nutritional and pharmacological effects on human health, exerting antioxidant activities against oxidative stress-induced damage. The industrial processes applied in tea production can lead to qualitative and quantitative changes in the phenolic content and composition and in antioxidant properties, thus influencing their potential biological activities. Meanwhile, the procedure for tea preparation may influence the quantity of the extracted phenolic compounds. In this study, the effects of different infusion parameters, such as the water type used for infusion (tap water, distilled water, and natural mineral water), time (3, 5, and 10 min), temperature (T = 80 °C and 100 °C), and pH (ranged between 3 and 9) were considered. The optimal infusion variables resulting from the study were obtained by extracting phenolic compounds at T = 100 °C for 10 min, both for green (916.12–1169.81 mg GAE/g) and black (932.03–1126.62 mg GAE/g) bagged tea samples, respectively.

1. Introduction

Tea (Camellia sinensis) is one of the oldest beverages and widely consumed worldwide [1]. Since tea plant cultivation needs a humid and hot climate, production is mainly concentrated in tropical and subtropical regions. Hence, most tea is produced in large estates in East Africa and Southeast Asia [2]. From 2004 to 2019, world tea production has risen from 3.15 million metric tons (MMT) to 6.1 MMT, with a total trade of $7.44 B. China alone produced around 2.8 MMT in 2019, leading the market as the primary producer and leading exporter ($1.77 B) [3]. The other leading largest countries for the production of tea in 2019 were India (1.4 MMT), Kenya (459 thousand tons), Sri Lanka (300 thousand tons), and Indonesia (129 thousand tons) [4].
Tea production starts with leaf collection, which then undergo processing. During the transformation phases, tea leaves undergo oxidative and hydrolysis processes due to endogenous enzymes (e.g., polyphenol oxidase and peroxidase) in leaf cells [5]. Depending on the level of fermentation and processing methods, it is possible to distinguish between six main kinds of tea (Figure 1): yellow, white, and green tea (non-fermented), oolong tea (semi-fermented), black tea (fully fermented), and dark tea (post-fermented) [6,7]. In green tea, the leaves are rolled and steamed to inactivate polyphenol oxidase, thus reducing oxidation before drying; while, in black tea production, leaves are rolled to allow the rupture of cellular constituents, thus facilitating contact between phenolic compounds and polyphenol oxidase.
Tea is considered a psychoactive beverage, similar to coffee and chocolate drinks, because of their stimulating effects that are mainly derived from methylxanthines (e.g., theophylline, theobromine, caffeine) [8]. Dried tea leaves contain about 230 chemical bioactive compounds [9], of which polyphenols represent the largest fraction (30% of the total dry weight, TDW), and they are considered to have beneficial effects on human health [10]. It is worth noting that tea consumption can have different health-promoting effects, such as anticarcinogenic and antioxidant activities and cardiovascular and metabolic disease prevention [5,8]. However, polyphenol profiles are markedly different among teas based on their diverse potential biological activities. The most beneficial effects of green tea are credited to green tea polyphenols, mainly catechins, which make up 25–35% of the TWD of tea leaves. The remaining part is mainly composed of caffeine (approximately 3.5% of the TDW), theobromine (0.15–0.2%), theophylline (0.02–0.04%) and other methylxanthines, lignin (6.5%), organic acids (1.5%), chlorophyll (0.5%), and other pigments. Green tea has been shown to exert chemoprotective, antimicrobial, cardioprotective, and immunostimulatory functions [11]. In contrast, black tea polyphenols are mainly derived from the polymerization of catechins into theaflavin (0.3–2% of TDW) and thearubigins (10–20% of TDW) produced during fermentation [12]. These compounds, found in tea leaves and infusions, can exert antioxidant activities against free radicals, thus protecting the human body from oxidative stress-induced damage.
Over the years, several works concerning the antioxidant activities of infusions of Camellia sinensis have been published. These works show the great interest of scientific researchers in the antioxidant compounds of tea. In the literature, the polyphenol content in green and black tea infusions is well documented [13,14,15,16,17,18,19,20,21,22]. Different studies have investigated the application of different solvents to the extraction of phenolic compounds in green and black tea extracts [14,16,21]. Otherwise, they considered only a single type of water (e.g., distilled water) as an extractive solvent, performing the extraction at 100 °C for 45 min [17,18]. However, few studies simultaneously considered the optimization of different infusion parameters of green and black teas [12,20,22]. McAlpain et al. [20] and Zargar et al. [12] studied tea infusions obtained in water by varying only the time of infusion (1–10 min) while keeping the temperature fixed.
Individual preferences for the consumption of tea change according to the country of origin. Generally, tea is usually consumed after an infusion in water between 95 °C and 100 °C for a determined time [23]. In Western countries, the consumption of bagged black tea leaves after a short infusion time (<3 min) in water at 100 °C is preferred. In India, Pakistan, and some Middle Eastern Countries, black leaves are boiled in a pot for longer before consumption. In China and Japan, tea is prepared by steeping green leaves in hot, not boiling, water, and only the second and subsequent infusions are consumed [23]. Therefore, although the procedure for preparing tea is not the same worldwide, it is essential to keep its active principles intact. To deepen the beneficial effects derived from tea consumption in the laboratory setting, it is essential to understand how the total polyphenol content varies when varying the kind of water used for the infusion and the temperature/time conditions. Currently, most research focused on steeping times often used by consumers reported that over 50% of polyphenols were released in the initial 5 min of infusion time [8,24]. Studies have only investigated a few steeping times, such as an extended timeframe (e.g., beyond the first 5 min of infusion), or have only examined a specific type of tea at a fixed temperature [23,24,25].
The objective of the study was to evaluate the total polyphenol content and the antioxidant activity by means of the Folin–Ciocâlteu method and the Diammonium salt (ABTS) and 2,2-diphenyl-1-picrylhydrazyl (DPPH) assays in black and green tea samples after considering various infusion parameters (time, temperature, pH, type of water used for infusion: tap, natural mineral, and distilled water). The ability to directly analyze aqueous green and black tea extracts could replace and limit the use of organic solvents (e.g., methanol, ethyl acetate), which are often harmful to human health and the environment. To date in literature, no studies have compared the application of different types of water in the extraction of polyphenols, but they have performed a comparison between organic solvents and only distilled or tap water [14,16,21].

2. Materials and Methods

2.1. Chemicals

Folin–Ciocâlteu reagent (H3[P(W3O10)4/H3[P(Mo3O10)4], gallic acid (C7H6O5), sodium carbonate (Na2CO3), Eriochrome Black T (MB 11), ammonium chloric (NH4Cl), ethylenediaminetetraacetic acid (EDTA), 2,2′-azino-bis(3-ethylbenzothiazoline-6-sulfonic acid) diammonium salt (ABTS), 2,2-diphenyl-1-picrylhydrazyl (DPPH), potassium persulfate (K2S2O8), sodium phosphate dibasic (Na2HPO4), phosphate-buffered saline (PBS), methanol (CH3OH), and ultrapure water were purchased from Sigma-Aldrich Chemical Co., St. Louis, MO, USA. Instead, acetic acid (CH3COOH), sodium acetate (CH3COONa), chloridric acid (HCl), and sodium hydroxide (NaOH) were purchased from Carlo Erba, Milan, Italy.

2.2. Instruments

The following instruments were used: Bandelin Sonorex RK100H water and ultrasonic thermostatic bath, Hanna Instruments pH211 Microprocessor pH Meter (Sigma Aldrich, Milan, Italy)), and UV–Vis spectrophotometer (Jenway, Stone, (UK)).

2.3. Samples

Twenty commercial tea bags of two varieties (green and black ones) were collected from local markets and tea shops. For each tea variety, n = 10 samples of three different brands were purchased. Samples were stored in darkness at T = 15–20 °C until the day of analysis. The results of the analyses are presented as the average of the samples for each type of commercial tea: green and black tea bagged samples.

2.4. Aqueous Tea Extract Preparation

Before conducting polyphenol aqueous extraction, water hardness was measured as follows: 50 mL of sample was placed in a flask, to which 4 mL of NH4Cl/NH3/EDTA and 0.2 g of MB11 were added. The solution was then titrated under stirring with 0.01 M EDTA solution. The results were calculated as follows:
Hardness   ( ° F ) = V 3 ×   M × 10 V 4
where V3 = volume (mL) used for titration, M = molarity of EDTA, V4 = volume (mL) of the sample tested.
According to Das et al. [21], extraction of total polyphenols from the different tea samples was performed as follows: commercial tea bags, which weighed between 1.5 and 2 g were opened, and 2 g of sample was weighed for each aliquot. The sample was then placed into a glass flask with 200 mL of water for infusion: tap water (TW), high hardness (33.5 °F) distilled water (DW), and natural mineral water (NMW), low hardness (13.3 °F). Table 1 reports the physicochemical characteristic of water used for the analysis.
The extraction of total polyphenols from the different tea samples was performed for different infusion times (3, 5, 10 min) and at different temperature ratios (T = 80 °C and 100 °C), respectively (Figure 2). These time and temperature conditions were chosen to replicate the usual homemade preparation conditions in the laboratory setting. For each sample, analyses were performed in triplicate.

2.5. Polyphenols Aqueous Extraction at Different pH

To evaluate the influence of pH on the extraction of polyphenols, two types of water were considered: natural mineral water and distilled water. The effect of pH on the extraction capacity of total polyphenols in tea samples was examined, considering the best conditions for polyphenol extraction (T = 100 °C for 10 min). pH values ranging between 3 and 9 were analyzed. This pH range was considered for the analysis as it reflects the pH values of most commercial beverages (e.g., soft drinks, fruit juices) [26]. DW and NMW were acidified by adding HCl (0.1 M) and alkalized by the addition of NaOH (0.1 M). In addition, different buffer solutions at different pH were considered. Buffer solutions were obtained between pH 3 and 6 using CH3COOH/CH3COONa (0.1 M) buffer, while for the buffer solutions at basic pH (7–9), the Na2HPO4/HCl (0.1 M) buffer was used. After the aqueous solution and buffer solution preparation, polyphenol extraction was conducted on commercial tea bag samples to which 200 mL of acidified aqueous solution, alkaline aqueous solution, and buffer solution was added. All analyses were performed in triplicate.

2.6. Determination of Total Polyphenol Content (Folin–Ciocâlteu)

Total polyphenol content (TPC) was measured by spectrophotometric analysis using the Folin–Ciocâlteu method [27]. The TPC method was modified for tea infusion analysis: 1 mL of tea infusion sample was added to 0.25 mL of Folin–Ciocâlteu reagent (2.0 N). After 3 min, 0.5 mL of Na2CO3 (7.5%, w/v) was added and brought to a final volume of 10 mL with distilled water. The tea samples were left for 45 min in the dark at room temperature. The absorbance was measured at λ = 750 nm in cuvettes with a 1 cm path length relative to the aqueous solution. The total content of phenols was expressed as milligrams of gallic acid equivalent (GAE) per gram of bagged tea samples. The results were obtained through a calibration curve ranging from 50 to 500 mg/L of gallic acid solution (y = 0.0005x − 0.0023; R2 = 0.9905).

2.7. Determination of Antioxidant Activity (ABTS and DPPH Assays)

Antioxidant activity was determined through ABTS and DPPH assays, according to a previously reported method of Thaijpong et al. [28]. The free radical scavenging activity of the aqueous tea extracts was assessed by measuring the decrease in absorbance at 515 nm for DPPH and at 734 nm for ABTS●+ radical cation. Absorbance was measured in cuvettes with a 1 cm path length relative to aqueous solution (distilled, tap, and natural mineral water, respectively), using a UV–Vis spectrophotometer (Jenway, Stone, UK). Results were expressed as inhibition percentage (I%) and were calculated based on Equation (1):
I % = A 0 A f   A 0 × 100
where A0 is the initial absorbance of the radical cation and Af is the absorbance after the addition of tea sample extract.

2.8. Statistical Analysis

The statistical package SPSS, v.27, was used (SPSS Inc. a.s., 2000, Bologna, Italy) to calculate significant differences between the tea samples in all the analyses. Results were evaluated with one-way analysis of variance (ANOVA) and p-values of <0.05 were considered significant.

3. Results and Discussion

3.1. Effect of Infusion Variables on TPC

A comparison of the polyphenol content of tea samples infused in different types of water (tap water, natural mineral water, and distilled water) is proposed for the first time in this manuscript.
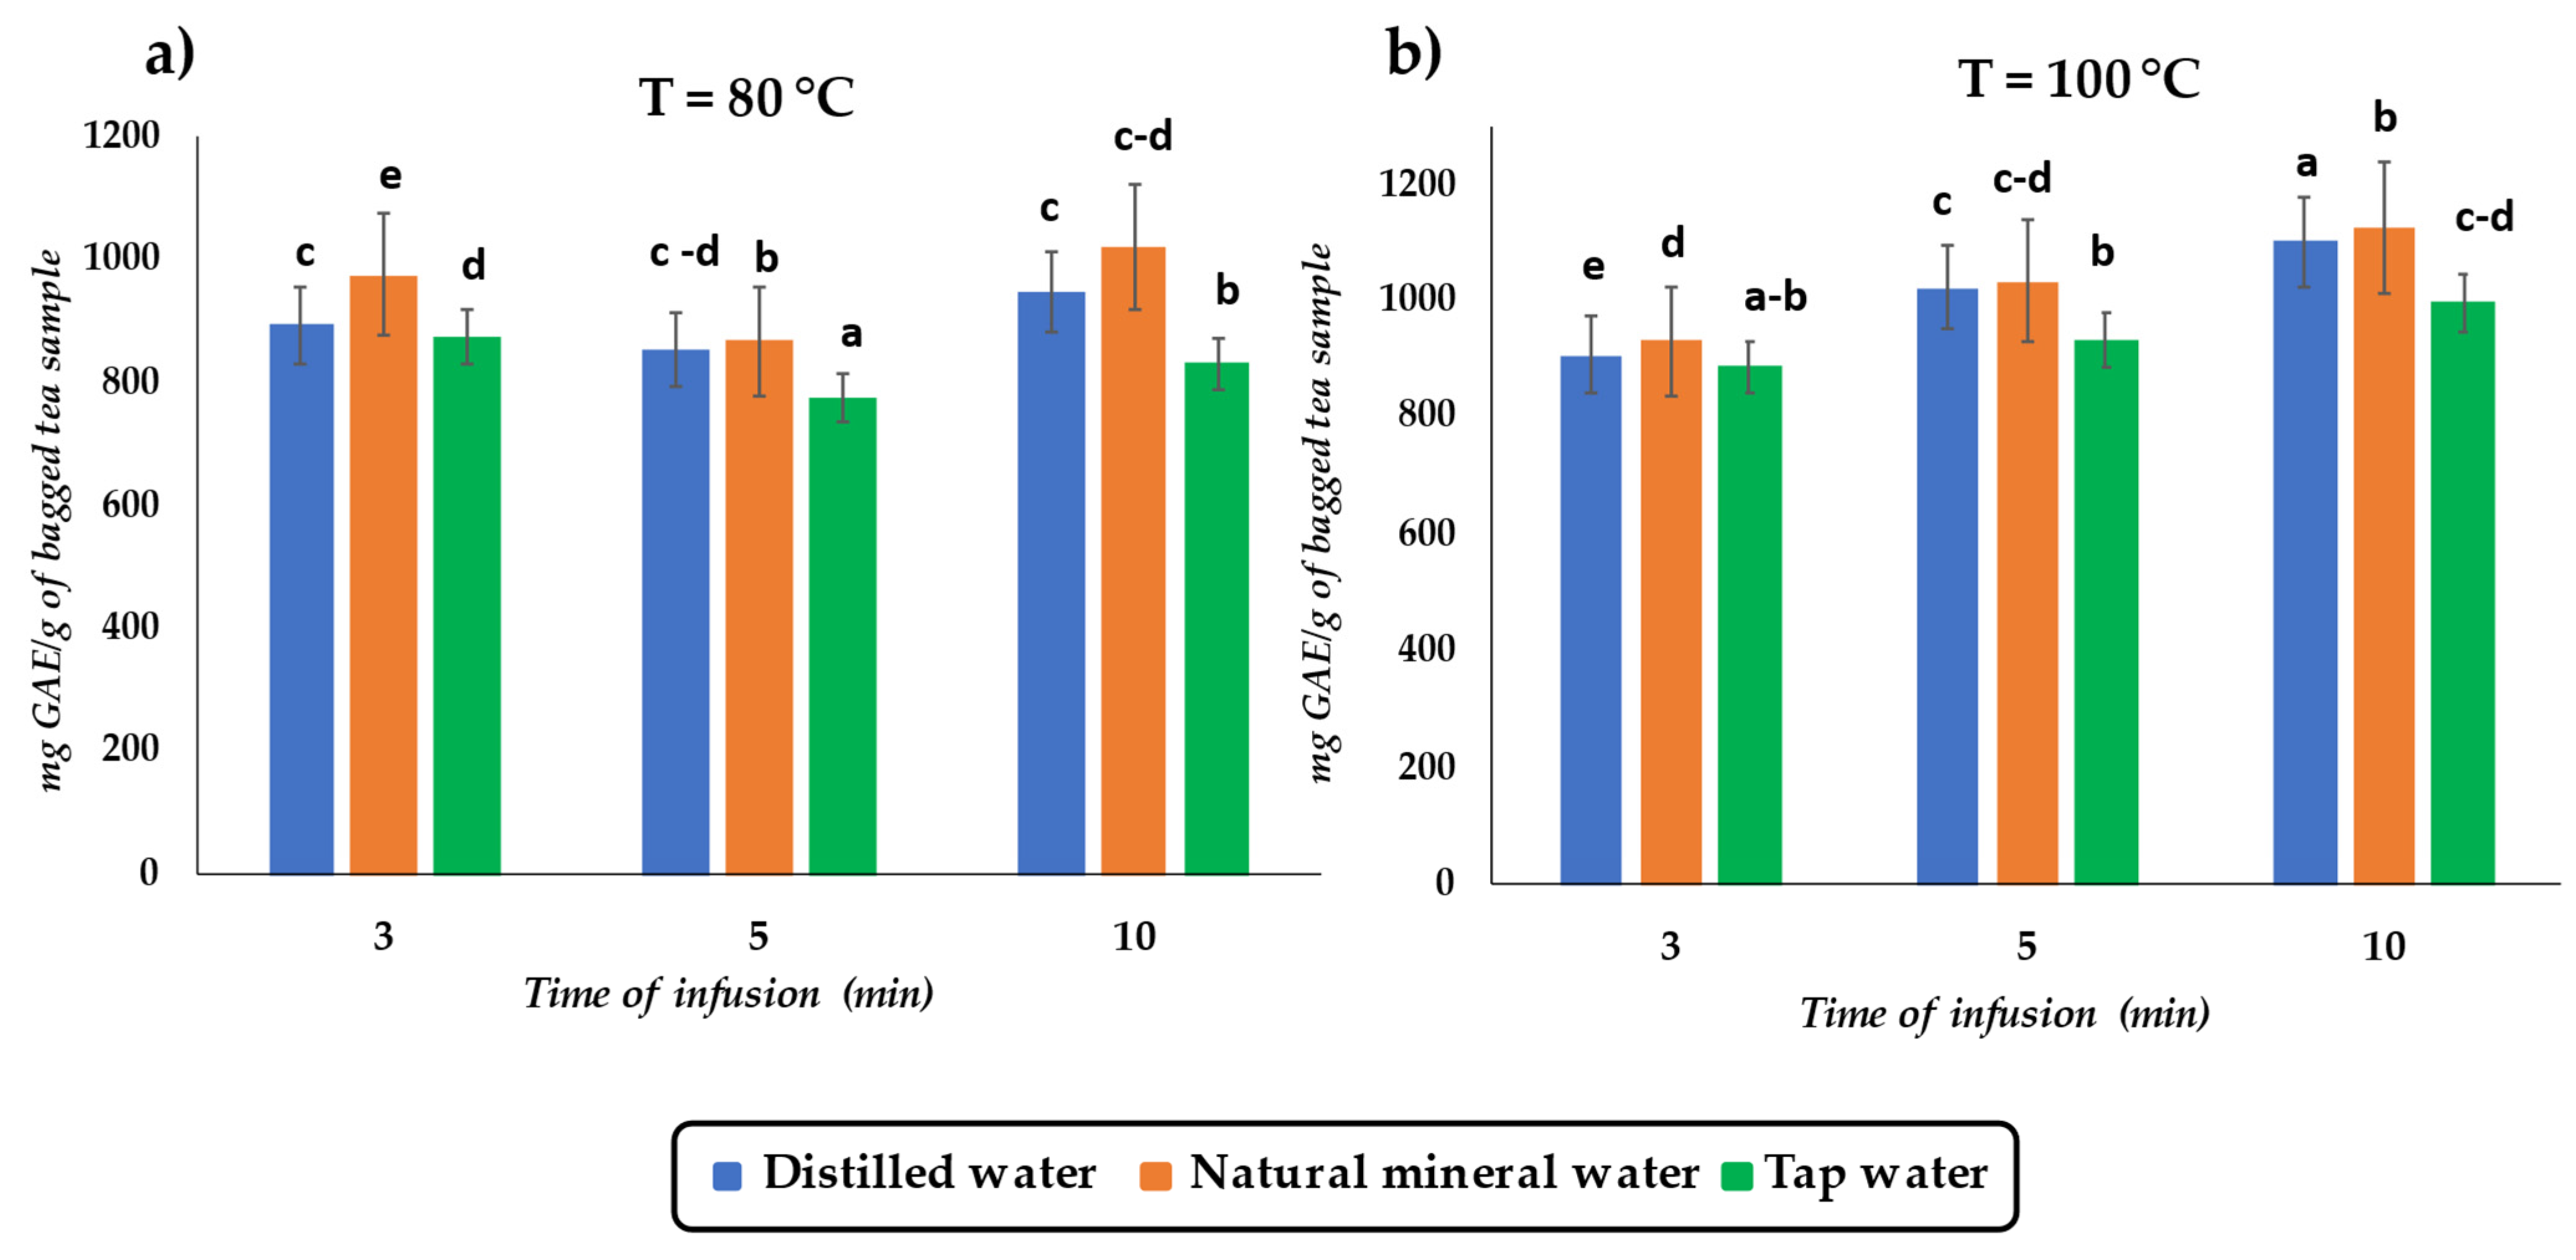
The Folin–Ciocâlteu assay has been extensively used for the determination of total polyphenol content (TPC) in different food matrices [27,29,30], including tea [20,31]. However, no studies have been simultaneously considered different infusion temperatures (80 °C and 100 °C), different infusion times (3, 5 and 10 min). and different types of water (distilled, tap and natural mineral water). Figure 3 shows the total phenolic content (TPC) of green tea infusion considering the different time/temperature conditions and different types of water used for the infusion. There was a clear increase in TPC with a longer steep time for each type of water investigated. Moreover, an increase in TPC was observed in green tea samples extracted at T = 100 °C for 10 min (Figure 3b). Among water types, it was found that NMW for all three infusion times (3, 5, and 10 min) resulted in higher TPC values (916.12–1169.81 mg GAE/g).
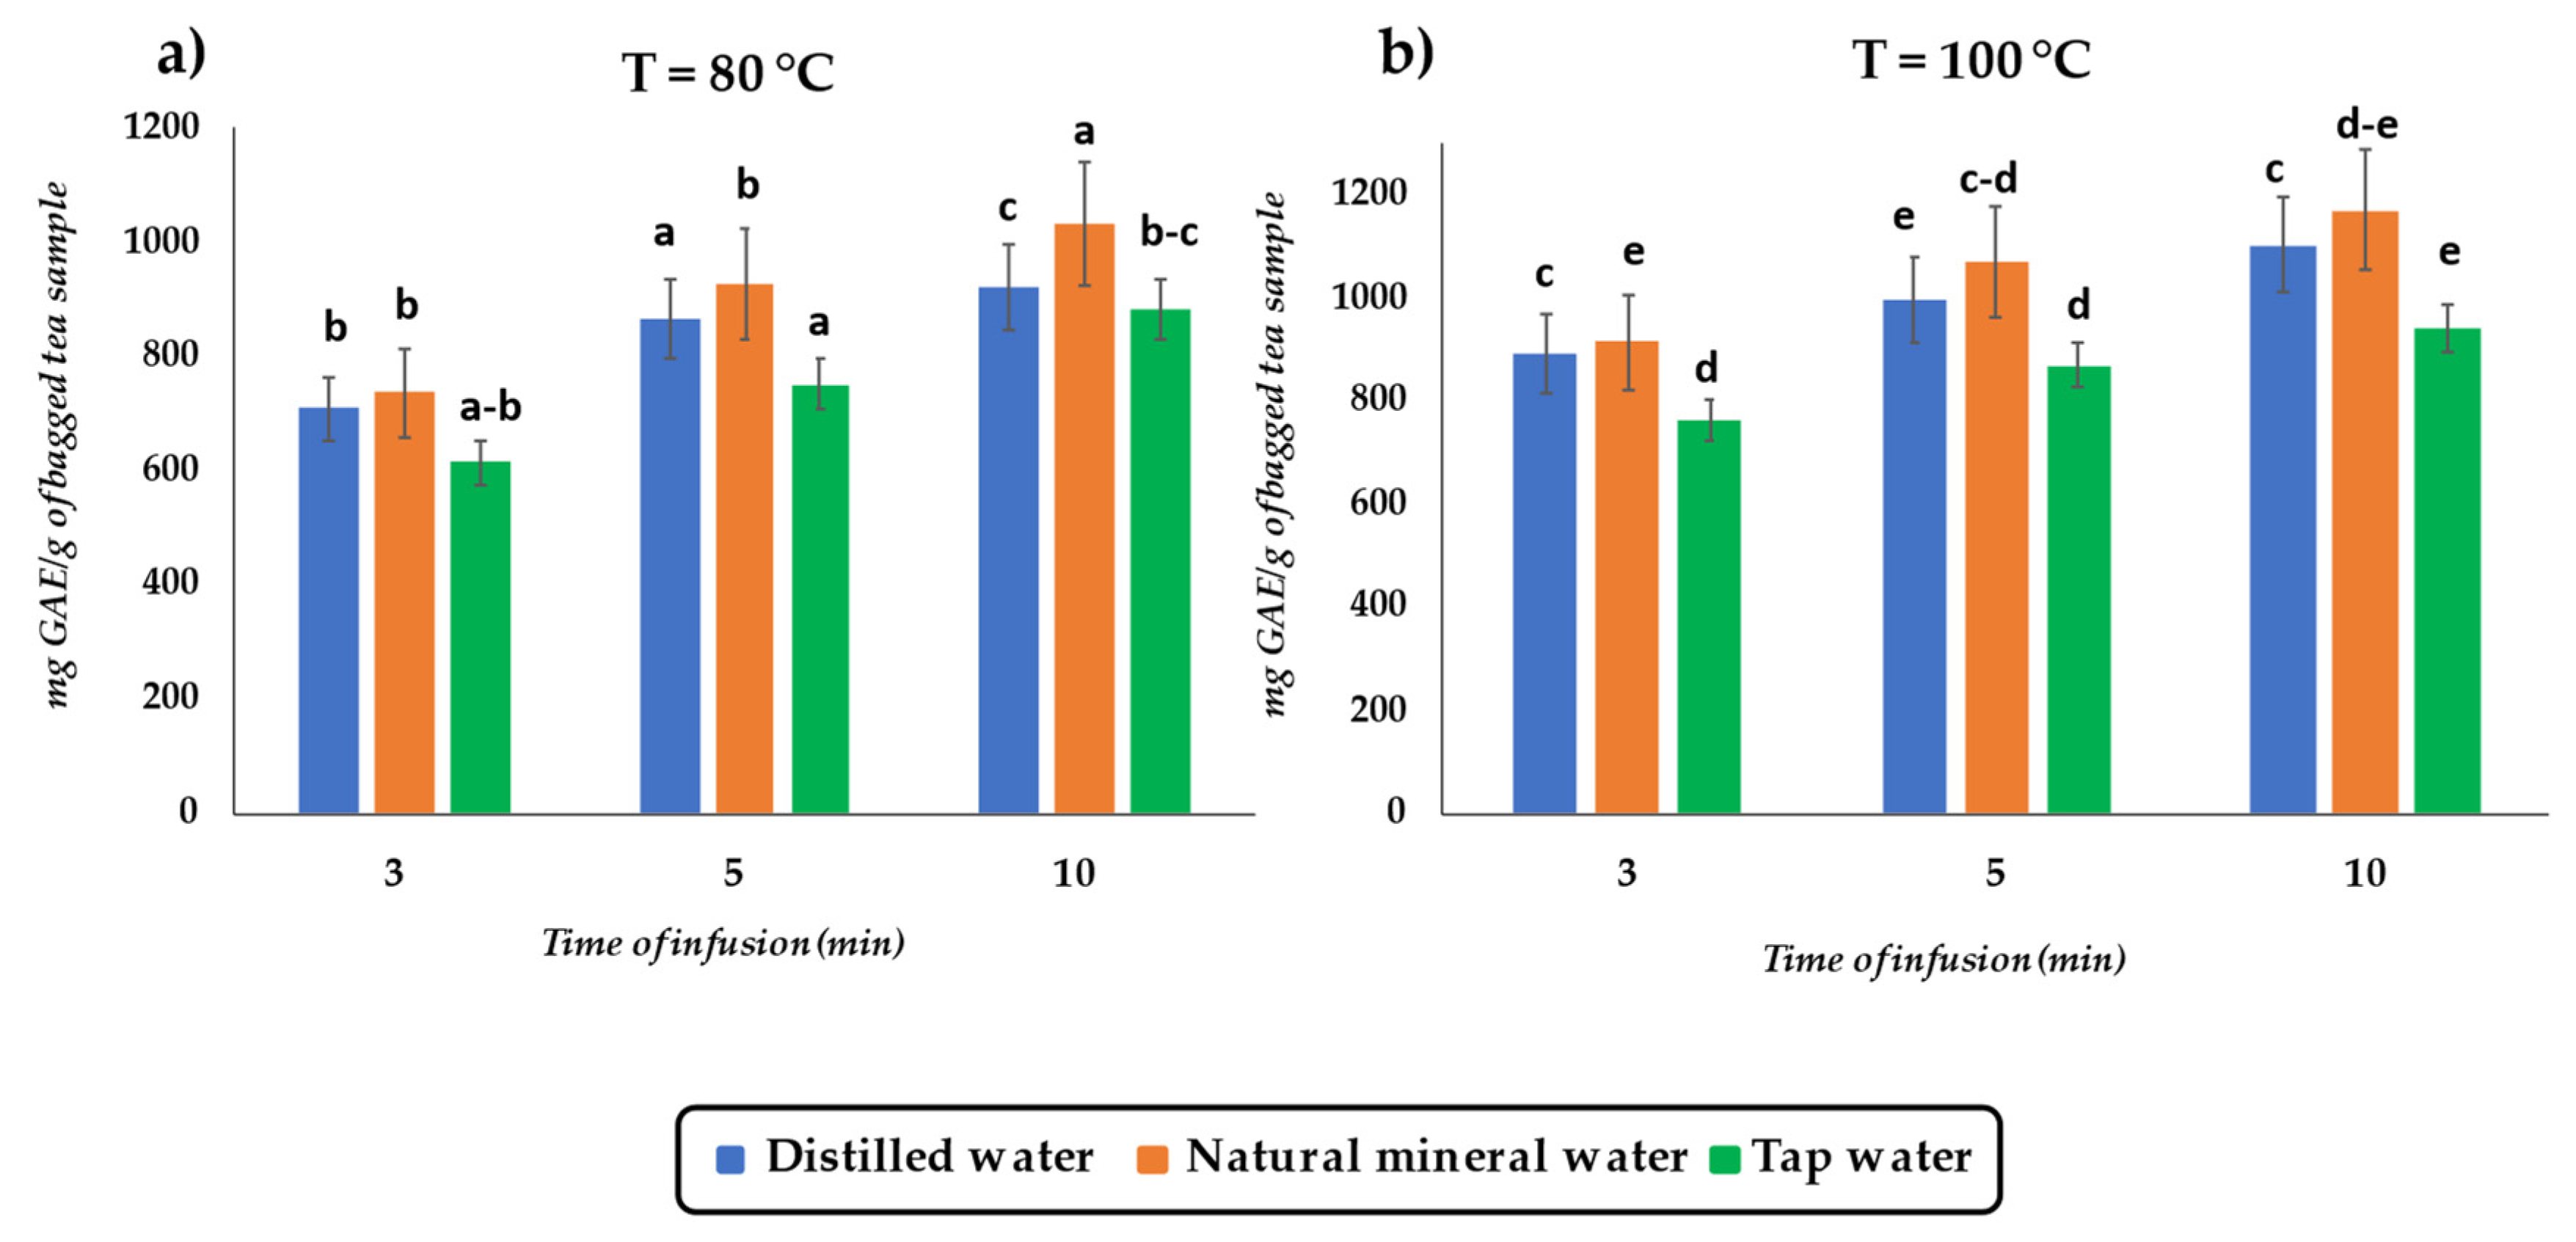
For black tea samples (Figure 4), the TPC is lower than that of green tea samples. However, black tea infusion also displays the same trend as green tea, with a higher TPC for the infusions extracted at a temperature of 100 °C (Figure 4b) than those extracted at a temperature of about 80 °C (Figure 4a). In addition, even for black tea, NMW extracts more polyphenols than tap water and distilled water.
The greater TPC of green teas than black tea could result from their production processes. According to Astill et al. [23], during the production of green tea, the primary polyphenols (i.e., catechins) remain relatively intact during the process. This could be attributable to the deactivation of enzymes that can catalyze the oxidative polymerization of catechins by heat treatment (pan-roasting or steaming) immediately after harvesting. In contrast, black tea production involves a leaf-breaking step to promote the enzymatic oxidation of catechins, thus decreasing the polyphenol content.
The parameters that most influence the concentration of TPC are the infusion time and the type of water used for the infusion preparation. Indeed, the increase in temperature from 80 °C to 100 °C is accompanied by a slight increase in the TPC. Infusion time is the parameter that mainly influences the extraction of polyphenols, according to the literature [12,20,22]. For commercial packs of tea, the recommended infusion time is 2–3 min; this is recommended because an excessive concentration of polyphenols could influence the taste of the product [32].
Therefore, the results showed that the best extraction conditions for antioxidant compounds in tea is using NMW with an extraction time of 10 min at 100 °C (1126.62 mg GAE/g). These infusion procedures could be applied to homemade preparations to keep its active principles intact, thus strengthening the beneficial effects of its consumption [13].

3.2. Effect of pH of Aqueous Solution on TPC

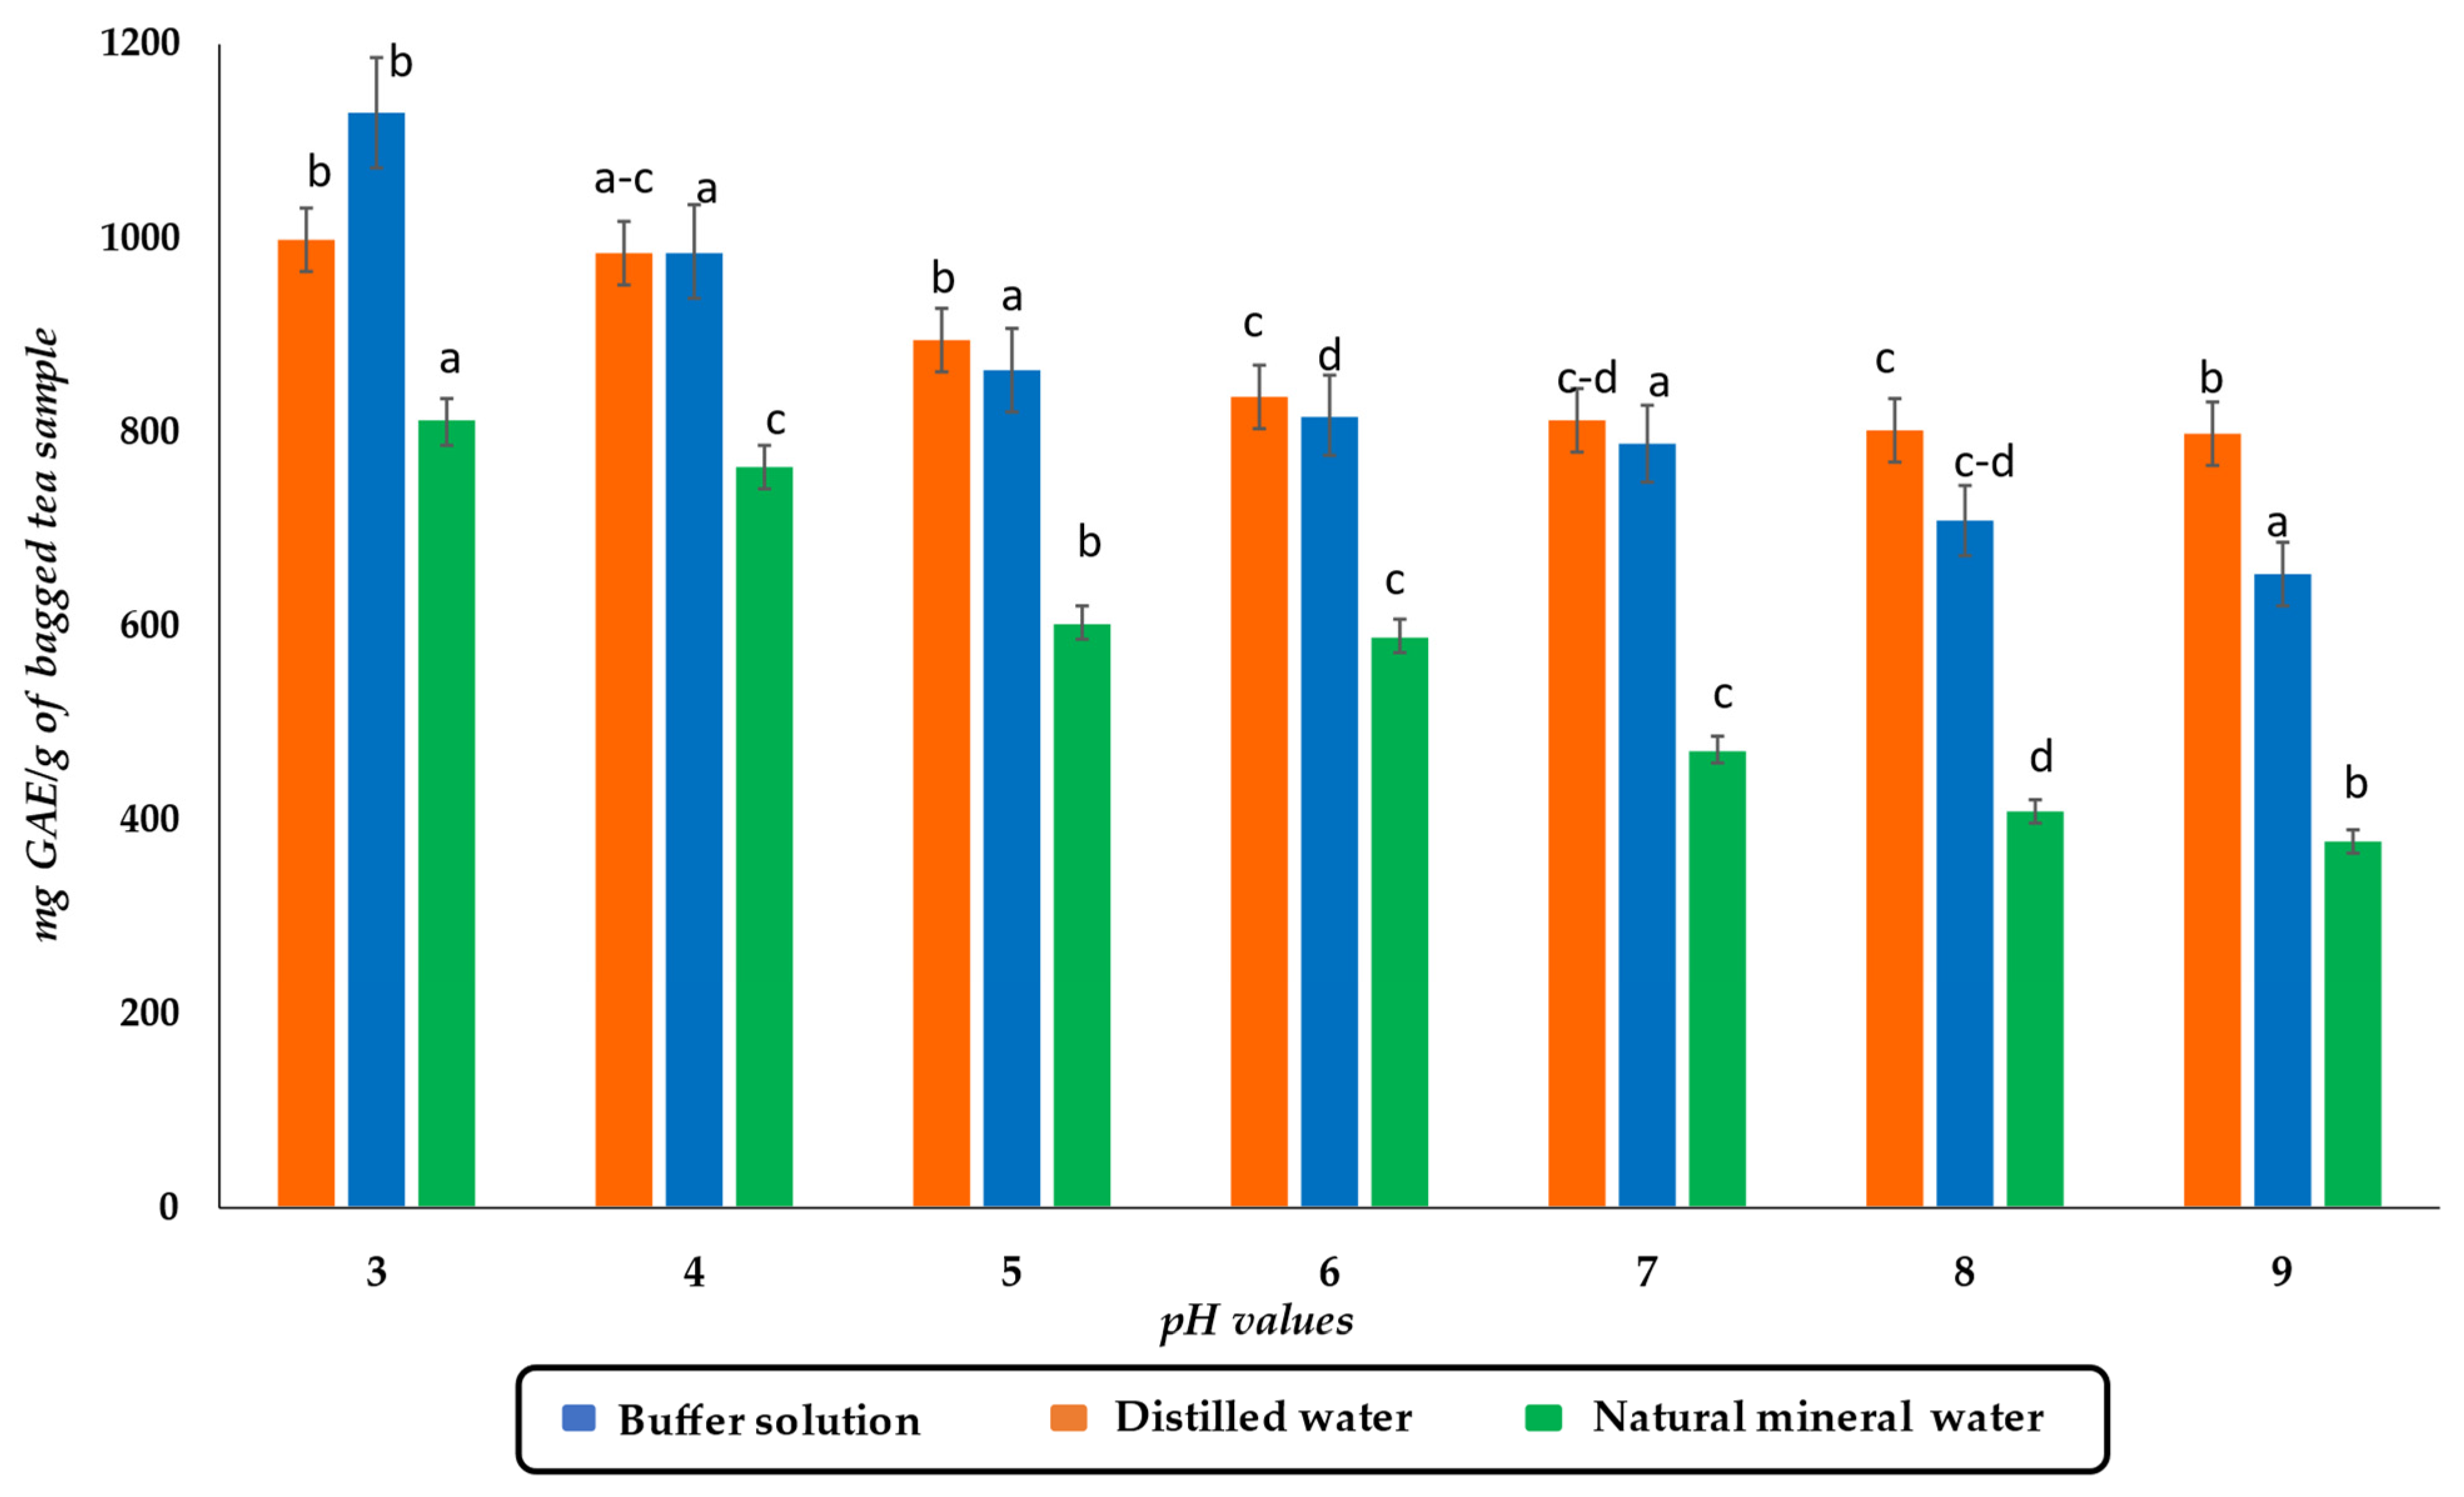
In addition to the infusion time/temperature conditions, the effect of pH on the extraction of total polyphenols from green tea samples was performed when using the best conditions for polyphenols extraction (T = 100 °C for 10 min). In addition, only green tea was used for this analysis, as it was the sample with the highest polyphenol content (890.09–075.01 mg GAE/g). Figure 5 shows the values of TPC for green tea infusions in distilled water, buffer solutions, and natural mineral water at different pH values. It is possible to notice a decrease in total polyphenol content between pH 3 and pH 9. This decrease of about 20% in the TPC of green tea prepared at neutral or alkaline pH is probably due to the stability of some phenolic compounds in tea, such as catechins. It has been shown that these compounds have greater stability at acidic pH and tend to change epimer conformation as the pH increases, thus triggering the polyphenol degradation reactions in tea that lead to the formation of lower molecular weight compounds and, consequently, the loss of phenolic compounds [33]. In addition, it should be considered that, despite the different starting pH of the distilled water, during the infusion, the pH changed until it reached a value of 4.7 in all infusions, regardless of the initial pH value. This is in line with the study of Vuong et al. [34], which reported a similar phenomenon in black tea samples extracted with distilled water at different pH values. Indeed, using buffer systems, it was possible to maintain a constant pH throughout the infusion time. A similar trend was found at different pH values than distilled water, but the observed decrease reached almost 40% going from pH 3 to pH 9. In this case, it is possible to assume that it arises not from an increase in degradation reactions as a decrease in the extraction efficiency of TPCs at the different pH considered, which is in line with the study of Gadkari et al. (2015) [35], who found a decrease in extraction efficiency in phosphate buffers in the pH range between 6 and 8 in green tea samples.
As pointed out by Ananingsih et al. [33], TPC values can be related to the presence of the ions within the mineral water. It has been reported by [36] that some metal ions (e.g., Fe2+, Fe3+, and Cu2+) form complexes that catalyze the oxidation of some phenolic compounds (e.g., catechins). Therefore, the reduction in the TPC of green tea samples could be attributable to the composition of the mineral water used (hardness: 13.3 °F). In addition, the concentration of calcium ions in the natural mineral water (33.7 mg/L) could be the major contributor to the observed decrease. The composition of tap water and water with a high level of mineralization includes large amounts of dissolved mineral salts, especially calcium and magnesium salts, and hydrogen carbonate ions, which can inhibit the extraction process and react with the polyphenolic compounds [18,36], lowering the antioxidant properties of the infusion [37]. In addition, extracts of phenolic compounds from plants may contain various contaminants and interfering substances [21]. pH is also an essential factor in the extraction of phenolics. Usually, a low pH in the extraction solution can prevent the oxidation of phenolics, although they can also be eliminated through chelation with metal ions [21]. Hence, it can be assumed that tea polyphenols are more stable under acidic conditions and weaker under alkaline conditions. This is confirmed because by alkalizing the mineral water at pH 9, a precipitate (Ca(OH)2 or CaCO3) was formed. When performing the analysis on a filtered aliquot of the sample, the TPC was higher than that obtained at pH 3, thus confirming the possible interaction between polyphenols and calcium ions present in the water.

3.3. ABTS Assay of Tea Infusions

In Figure 6, the ABTS radical scavenging capacity of different green and black tea infusions obtained with different waters (DW, NMW, and TW) at different steeping times/temperatures. In the green tea infusion, the highest ABTS activity is observed in the samples prepared with NMW at 100 °C for 10 min (99.73, I%), while the lowest is at 80 °C for 3 min with TW (93.10, I%). The trend found in green tea is also observed for black tea infusions (Figure 6).
Polyphenols from green tea (unfermented) and black tea infusion (fermented) are both effective in scavenging the ABTS radical, but the differences in scavenging activities may be due to the decrease in polyphenol concentrations during the fermentation process [12]. In addition, the water temperature does not negatively affect the antioxidant capacity, probably creating the assumption that the chemical structure of polyphenols maintains efficiency even at high temperatures [19,21]. In addition, the higher antioxidant activity may be related to the total polyphenol content of the tea infusions. Indeed, higher antioxidant activity was also found for this assay in tea infusions prepared with NMW [38].

3.4. DPPH Activity of Tea Infusions

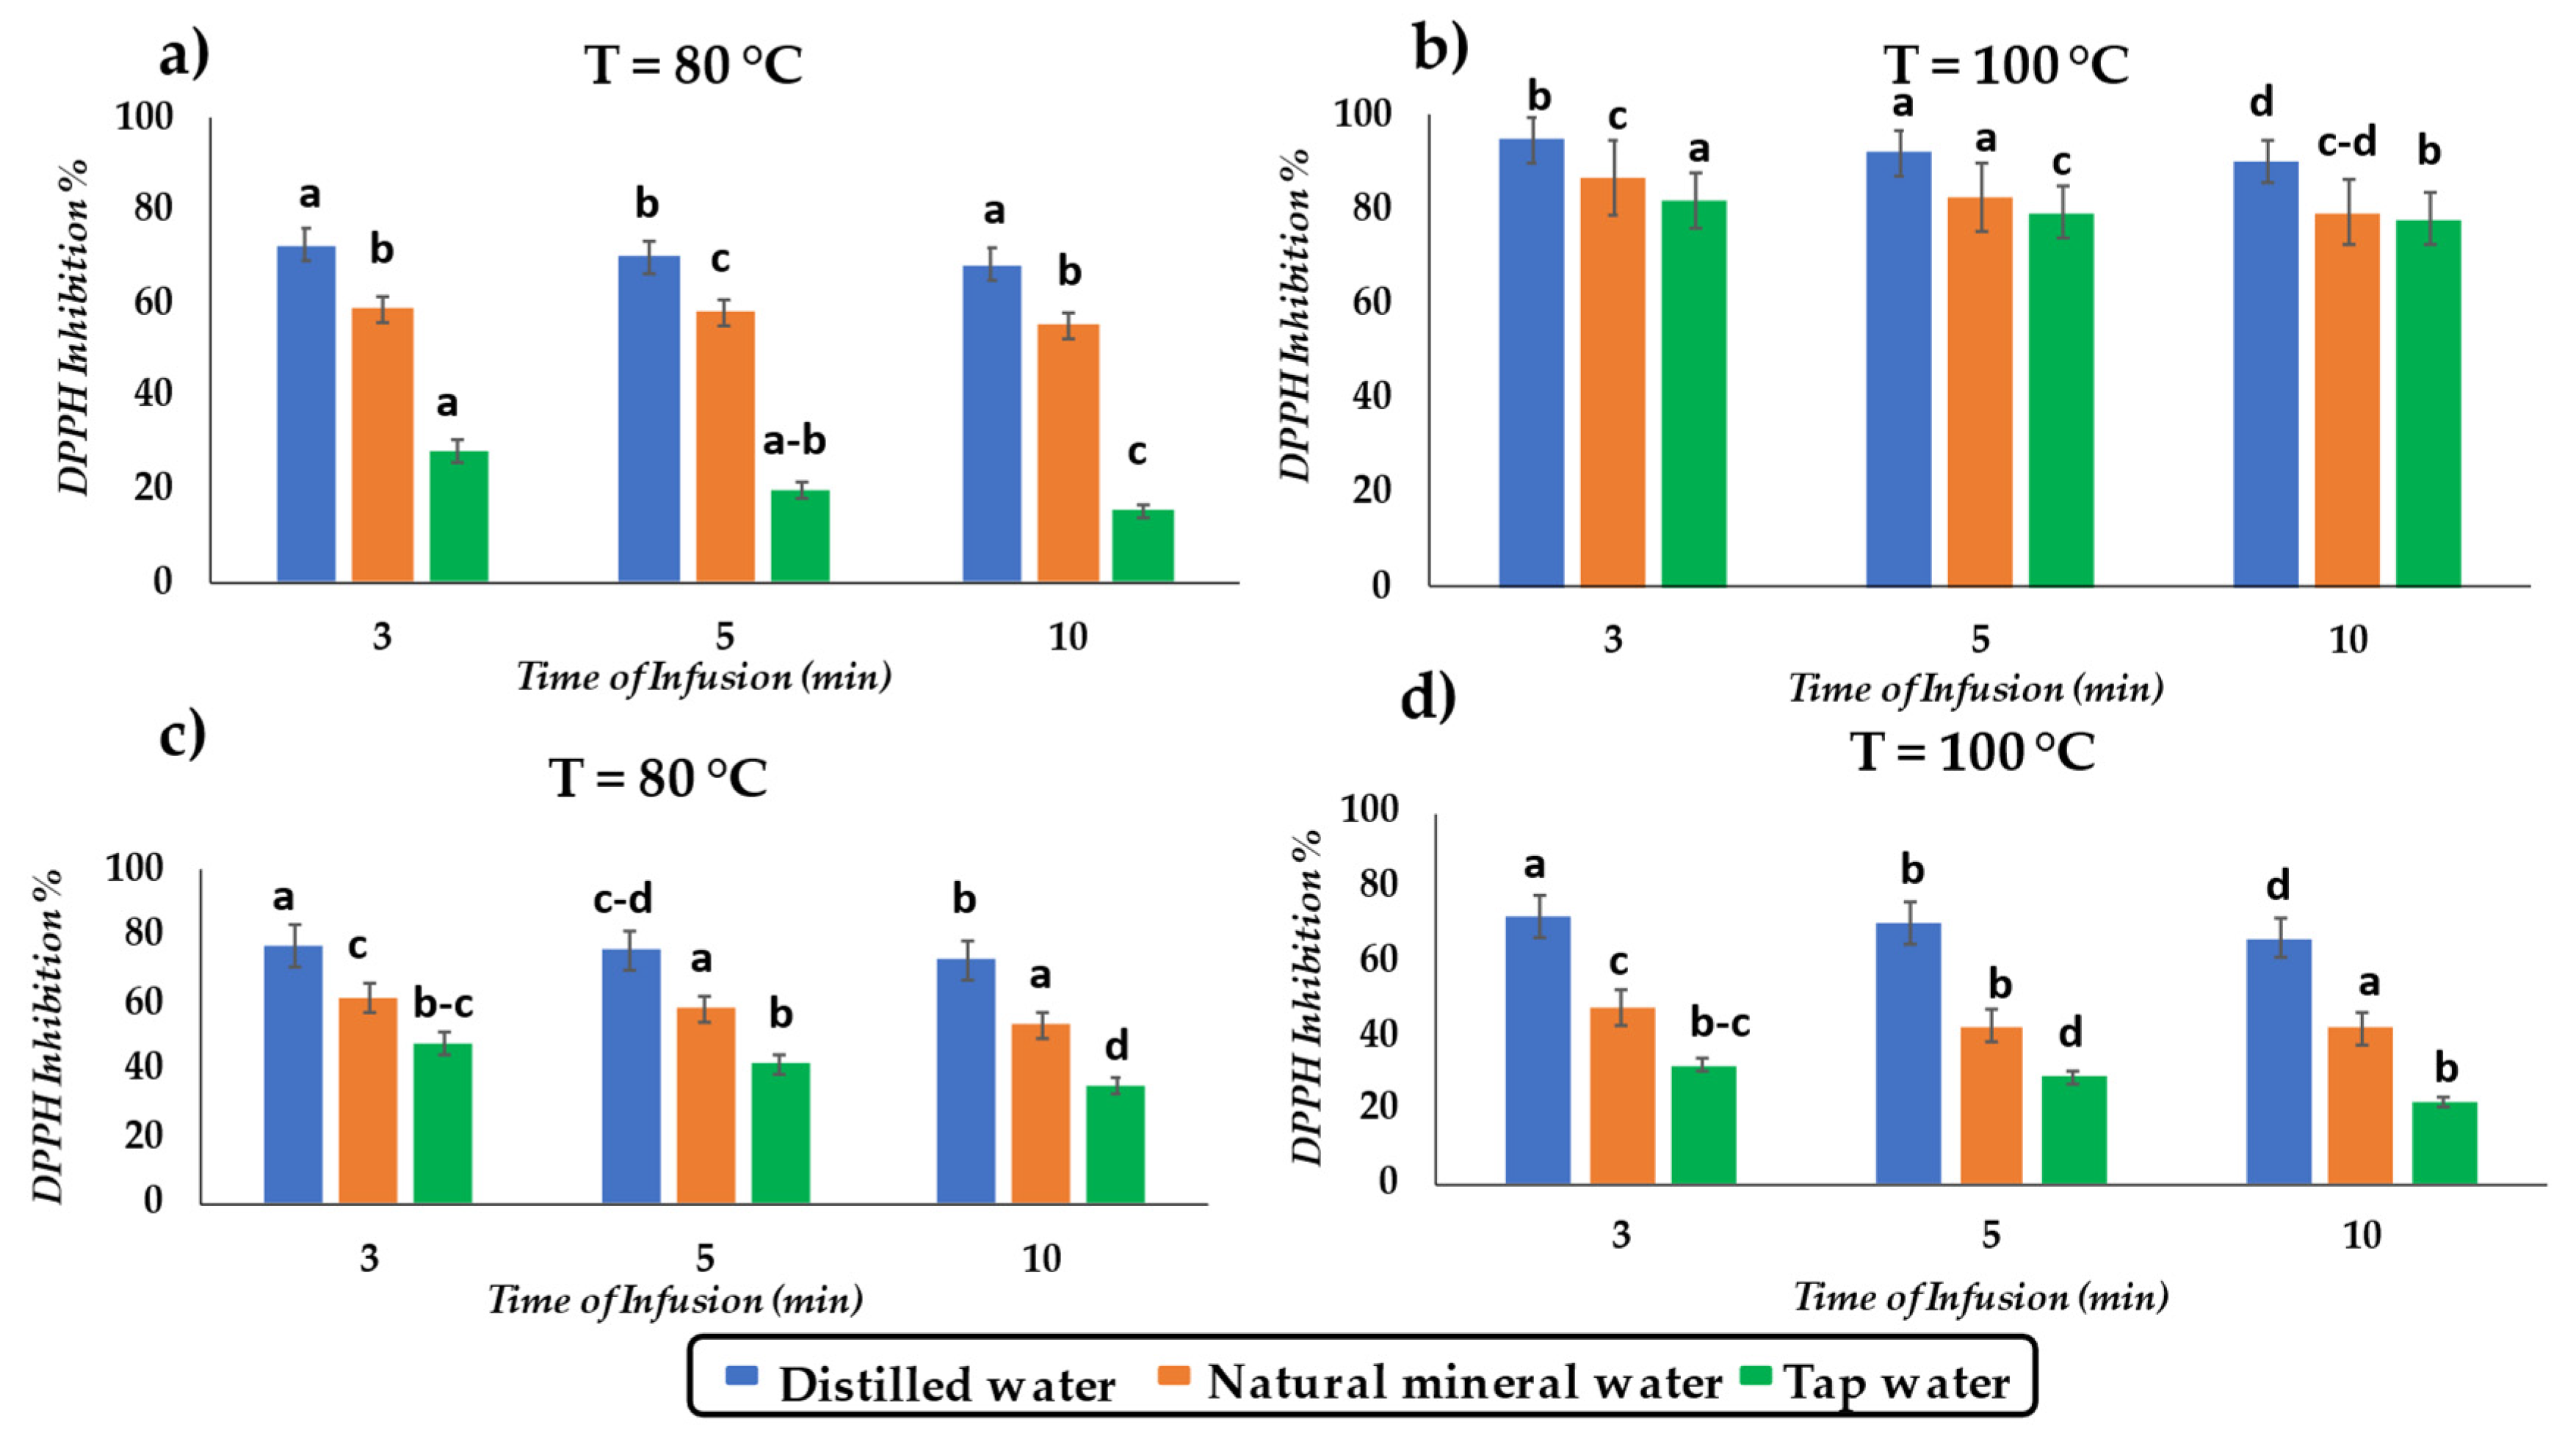
The results show that DPPH activity increases with increasing steeping temperature and decreases with increasing infusion time (Figure 7). The highest DPPH activity in green tea infusions was obtained at 100 °C for 3 min (95.01, I%), whereas in black teas the highest antioxidant activity was obtained at 80 °C for 3 min (77.29, I%). Moreover, it was observed that DW is the water with the greatest extraction capacity for polyphenols for both green and black teas; this is probably due to the absence of calcium and magnesium salts dissolved in it [37].
Among the different infusions of tea obtained with three different types of water, there is a reduction in antioxidant activity probably related to the concentration of Ca2+ and Mg2+ ions. In addition, a precipitate is observed during the analysis of samples obtained with tap water (33.8 °F), probably because during the infusion phase, Ca2+ ions interact with polyphenols to form a polyphenol/calcium complex that is deposited on the bottom. An aliquot of tea infusion was subjected to centrifugation and then analyzed. This procedure revealed an antioxidant capacity higher than that obtained without centrifugation, confirming the possible interaction between calcium ions and polyphenols [36,37].
Furthermore, the increase in antioxidant activity may be due to the total polyphenol content and may be related to steeping time, leaf size, and the porosity of tea bags [12,32].
Nevertheless, the results of the DPPH assay differ from those of the ABTS assay; this is probably related to the different type of reagents used. The DPPH reagent is a stable nitrogen radical that interacts with peroxidic radicals involved in lipid peroxidation, while ABTS reacts with hydrophilic and lipophilic compounds. Therefore, the reactivity of DPPH is limited to the lipophilic fraction [39].

4. Conclusions

In this study, we evaluated the influence on polyphenol extraction from in green and black tea matrices, of different types of water (tap, distilled, and natural mineral water) with different hardness, different infusion times (3, 5, 10 min) and temperatures (80 °C and 100 °C). The optimal infusion variables were obtained by extracting phenolic compounds at T = 100 °C for 10 min, both for samples of green tea (916.12–1169.81 mg GAE/g) and black tea (932.03–1126.62 mg GAE/g) in natural mineral water. In addition, it has been shown that, under the same infusion conditions, acidic solutions have a higher capacity for polyphenol extraction, probably because acidic solutions stabilize polyphenols, limiting their oxidation [35]. Therefore, the optimal infusion variables (time, temperature, water types, and pH) could be considered for the preparation of domestic and industrial teas, as well as those indicated on the label, in order to obtain infusions with higher polyphenol content and antioxidant activity and achieve greater benefit from the health-promoting effects. Moreover, this study could be a starting point for future research, examining the number and commercial tea types present on the market and investigating their polyphenolic profile.

Author Contributions

Conceptualization, G.V. and F.D.; Data curation, F.D.; Formal analysis, L.M. and S.A.P.; Investigation, L.M., S.A.P. and M.T.; Methodology, G.V., L.M. and S.A.P.; Software, L.M., S.A.P. and M.T.; Supervision, G.V. and F.D.; Visualization, G.V.; Writing—original draft, L.M., S.A.P. and M.T.; Writing—review and editing, G.V., L.M., S.A.P. and M.T. All authors have read and agreed to the published version of the manuscript.

Funding

This research received no external funding.

Institutional Review Board Statement

Not applicable.

Informed Consent Statement

Not applicable.

Conflicts of Interest

The authors declare no conflict of interest.

References

  1. FAO. Report: World Tea Production and Trade, Current and Future Development; Food and Agriculture Organization: Rome, Italy, 2015. [Google Scholar]
  2. Fairtrade International. Innovation and Resilience for a More Sustainable World; Annual Report 2019–2020; Fairtrade International: Bonn, Germany, 2020. [Google Scholar]
  3. Observatory of Economic Complexity (OEC). Available online: https://oec.world/en/profile/hs92/tea (accessed on 26 October 2021).
  4. Statista. Statista Consumer Market Outlook—Segment Report. 2021. Available online: https://www.statista.com/study/48824/tea-report/ (accessed on 26 October 2021).
  5. Takemoto, M.; Takemoto, H. Synthesis of Theaflavins and Their Functions. Molecules 2018, 23, 918. [Google Scholar] [CrossRef] [PubMed] [Green Version]
  6. Diniz, P.H.G.D.; Barbosa, M.F.; de Melo Milanez, K.D.T.; Pistonesi, M.F.; de Araújo, M.C.U. Using UV–Vis spectroscopy for simultaneous geographical and varietal classification of tea infusions simulating a home-made tea cup. Food Chem. 2016, 192, 374–379. [Google Scholar] [CrossRef] [PubMed]
  7. Gonçalves Bortolini, D.; Windson Isidoro Haminiuk, C.; Cristina Pedro, A.; de Andrade Arruda Fernandes, I.; Maria Maciel, G. Processing, chemical signature, and food industry applications of Camellia sinensis teas: An overview. Food Chem. 2021, 12, 100160. [Google Scholar] [CrossRef] [PubMed]
  8. Teixeira, A.M.; Sousa, C. A review on the Biological Activity of Camellia Species. Molecules 2021, 26, 2178. [Google Scholar] [CrossRef]
  9. Jeszka-Skowron, M.; Zgoła-Grześkowiak, A.; Frankowski, R. Cistus incanus a promising herbal tea rich in bioactive compounds: LC–MS/MS determination of catechins, flavonols, phenolic acids and alkaloids—A comparison with Camellia sinensis, Rooibos and Hoan Ngoc herbal tea. J. Food Compost. Anal. 2018, 74, 71–81. [Google Scholar] [CrossRef]
  10. Siddiqui, I.A.; Adhami, V.M.; Saleem, M.; Mukhtar, H. Beneficial effects of tea and its polyphenols against prostate cancer. Mol. Nutr. Food Res. 2006, 50, 130–143. [Google Scholar] [CrossRef]
  11. Graham, G.H. Green tea composition, consumption, and polyphenol chemistry. Prev. Med. 1992, 21, 334–350. [Google Scholar] [CrossRef]
  12. Zargar, B.; Majeed, D.; Ganai, S.A.; Mir, S.A.; Dar, B.N. Effect of different processing parameters on antioxidant activity of tea. J. Food Meas. Charact. 2018, 12, 527–534. [Google Scholar] [CrossRef]
  13. Dhaouadi, K.; Fattouch, S.; Hamdaoui, M.H. Extraction, identification and quantification of the polyphenols of green and black tunisian tea decoctions commercialized as “Garden of Tea”. Acta Hortic. 2010, 853, 199–206. [Google Scholar] [CrossRef]
  14. Bhebhe, M.; Füller, T.N.; Chipurura, B.; Muchuweti, M. Effect of solvent type on total phenolic content and free radical scavenging activity of black tea and herbal infusions. Food Anal. Methods 2016, 9, 1060–1067. [Google Scholar] [CrossRef]
  15. Orak, H.; Yagar, H.; Isbilir, S.; Demirci, A.; Gumus, T. Antioxidant and antimicrobial activities of white, green and black tea extracts. Acta Aliment. 2013, 42, 379–389. [Google Scholar] [CrossRef]
  16. Anand, J.; Upadhyaya, B.; Rawat, P.; Rai, N. Biochemical characterization and pharmacognostic evaluation of purified catechins in green tea (Camellia sinensis) cultivars of India. 3 Biotech. 2015, 5, 285–294. [Google Scholar] [CrossRef] [PubMed] [Green Version]
  17. Nibir, Y.M.; Sumit, A.F.; Akhand, A.A.; Ahsan, N.; Hossain, M.S. Comparative assessment of total polyphenols, antioxidant and antimicrobial activity of different tea varieties of Bangladesh. Asian Pac. J. Trop. Biomed. 2017, 7, 352–357. [Google Scholar] [CrossRef]
  18. Li, Y.; Du, Y.; Zou, C. Effects of pH on antioxidant and antimicrobial properties of tea saponins. Eur. Food Res. Technol. 2009, 228, 1023–1028. [Google Scholar] [CrossRef]
  19. Somsong, P.; Tiyayon, P.; Srichamnong, W. Antioxidant of green tea and pickle tea product, miang, from northern Thailand. Acta Hortic. 2018, 1210, 241–248. [Google Scholar] [CrossRef]
  20. McAlpine, M.; Ward, W.E. Influence of steep time on polyphenol content and antioxidant capacity of black, green, rooibos and herbal tea. Beverages 2016, 2, 17. [Google Scholar] [CrossRef]
  21. Das, A.; Kalita, A.; Raychaiudhuri, U.; Chakraborty, R. Synergistic effect of herbal plant extract (Hibiscus subdariffa) in maintain the antioxidant activity of decaffeinated green tea from various parts of Assam. J. Food Sci. Technol. 2019, 56, 5009–5016. [Google Scholar] [CrossRef]
  22. Cleverdon, R.; Elhalaby, Y.; McAlpine, M.; Gittings, W.; Ward, W.E. Total polyphenol content and antioxidant capacity of tea bags: Comparison of Black, green, red rooibos, chamomile and peppermint over different steep time. Beverages 2018, 4, 15. [Google Scholar] [CrossRef] [Green Version]
  23. Astill, C.; Birch, M.R.; Dacombe, C.; Humphrey, P.G.; Martin, P.T. Factors Affecting the Caffeine and Polyphenol Contents of Black and Green Tea Infusions. J. Agric. Food Chem. 2001, 49, 5340–5347. [Google Scholar] [CrossRef]
  24. Dorkbuakaew, N.; Ruengnet, P.; Pradmeeteekul, P.; Nimkamnerd, J.; Nantitanon, W.; Thitipramote, N. Bioactive compounds and antioxidant activities if Camellia sinensis var. assamica in different leave maturity from Northern Thailand. Int. Food Res. J. 2016, 23, 2291–2295. [Google Scholar]
  25. Fernando, C.D.; Soysa, P. Extraction kinetics of phytochemicals and antioxidant activity during black tea (Camellia sinensis L.) brewing. Nutr. J. 2015, 14, 74. [Google Scholar] [CrossRef] [PubMed] [Green Version]
  26. Enam, F.; Mursalat, M.; Guha, U.; Aich, N.; Anik, M.I.; Nisha, N.S.; Esha, A.A.; Khan, M.S. Dental erosion potential of beverages and bottled drinking water in Bangladesh. Int. J. Food Prop. 2017, 20, 2499–2510. [Google Scholar] [CrossRef] [Green Version]
  27. Rapa, M.; Ciano, S.; Ruggieri, R.; Vinci, G. Bioactive compounds in cherry tomatoes (Solanum Lycopersicum var. Cerasiforme): Cultivation techniques classification by multivariate analysis. Food Chem. 2021, 355, 129630. [Google Scholar] [CrossRef]
  28. Thaipong, K.U.; Boonprakob, K.; Crosby, L.; Cisneros-Zevallos, D.; Hawkins, B. Comparison of ABTS, DPPH, FRAP, and ORAC assays for estimating antioxidant activity from guava fruit extracts. J. Food Compos. Anal. 2006, 19, 669–675. [Google Scholar] [CrossRef]
  29. Zujko, M.E.; Witkowska, A.M. Antioxidant Potential and Polyphenol Content of Selected Food. Int. J. Food Prop. 2011, 14, 300–308. [Google Scholar] [CrossRef]
  30. Álvarez, R.; Araya, H.; Navarro-Lisboa, R.; Lopez de Dicastillo, C. Evaluation of Polyphenol Content and Antioxidant Capacity of Fruits and Vegetables Using a Modified Enzymatic Extraction. Food Technol. Biotechnol. 2016, 54, 462–467. [Google Scholar] [CrossRef]
  31. Simsek, M.; Sufer, O. Infusion of walnut (Juglans regia L.) shell tea: Multi response optimization and antioxidant potential. J. Appl. Res. Med. Aromat. Plants 2020, 20, 100278. [Google Scholar] [CrossRef]
  32. Kowalska, J.; Marzec, A.; Domian, E. Influence of Tea Brewing Parameters on the Antioxidant Potential of Infusions and Extracts Depending on the Degree of Processing of the Leaves of Camellia sinensis. Molecules 2021, 26, 4773. [Google Scholar] [CrossRef]
  33. Ananingsih, V.K.; Sharma, A.; Zhou, W. Green tea catechins during food processing and storage: A review on stability and detection. Food Res. Int. 2013, 50, 469–479. [Google Scholar] [CrossRef]
  34. Vuong, Q.V.; Golding, J.B.; Stathopoulos, C.E.; Roach, P.D. Effects of aqueous brewing solution pH on the extraction of the major green tea constituents. Food Res. Int. 2013, 53, 713–719. [Google Scholar] [CrossRef]
  35. Gadkari, P.V.; Balaraman, M. Catechins: Sources, extraction and encapsulation: A review. Food Bioprod. Process. 2015, 93, 122–138. [Google Scholar] [CrossRef]
  36. Wyrostek, J.; Kowalski, R. The Effect of Water Mineralization on the Extraction of Active Compounds from Selected Herbs and on the Antioxidant Properties of the Obtained Brews. Foods 2021, 10, 1227. [Google Scholar] [CrossRef] [PubMed]
  37. Dudonné, S.; Vitrac, X.; Coutière, P.; Woillez, M.; Mérillon, J.M. Comparative study of antioxidant properties and total phenolic content of 30 plant extracts of industrial interest using DPPH, ABTS, FRAP, SOD, and ORAC assays. J. Agric. Food Chem. 2009, 57, 1768–1774. [Google Scholar] [CrossRef] [PubMed]
  38. Roshanak, S.; Rahimmalek, M.; Goli, S.A.H. Evaluation of seven different drying treatments in respect to total flavonoid, phenolic, vitamin C content, chlorophyll, antioxidant activity and color of green tea (Camellia sinensis or C. assamica) leaves. J. Food Sci. Techol. 2015, 53, 721–729. [Google Scholar] [CrossRef] [Green Version]
  39. Prior, R.L.; Wu, X.; Schaich, K. Standardized Methods for the determination of antioxidant capacity and phenolics in food and dietary supplementation. J. Agric. Food Chem. 2005, 10, 4290–4302. [Google Scholar] [CrossRef]
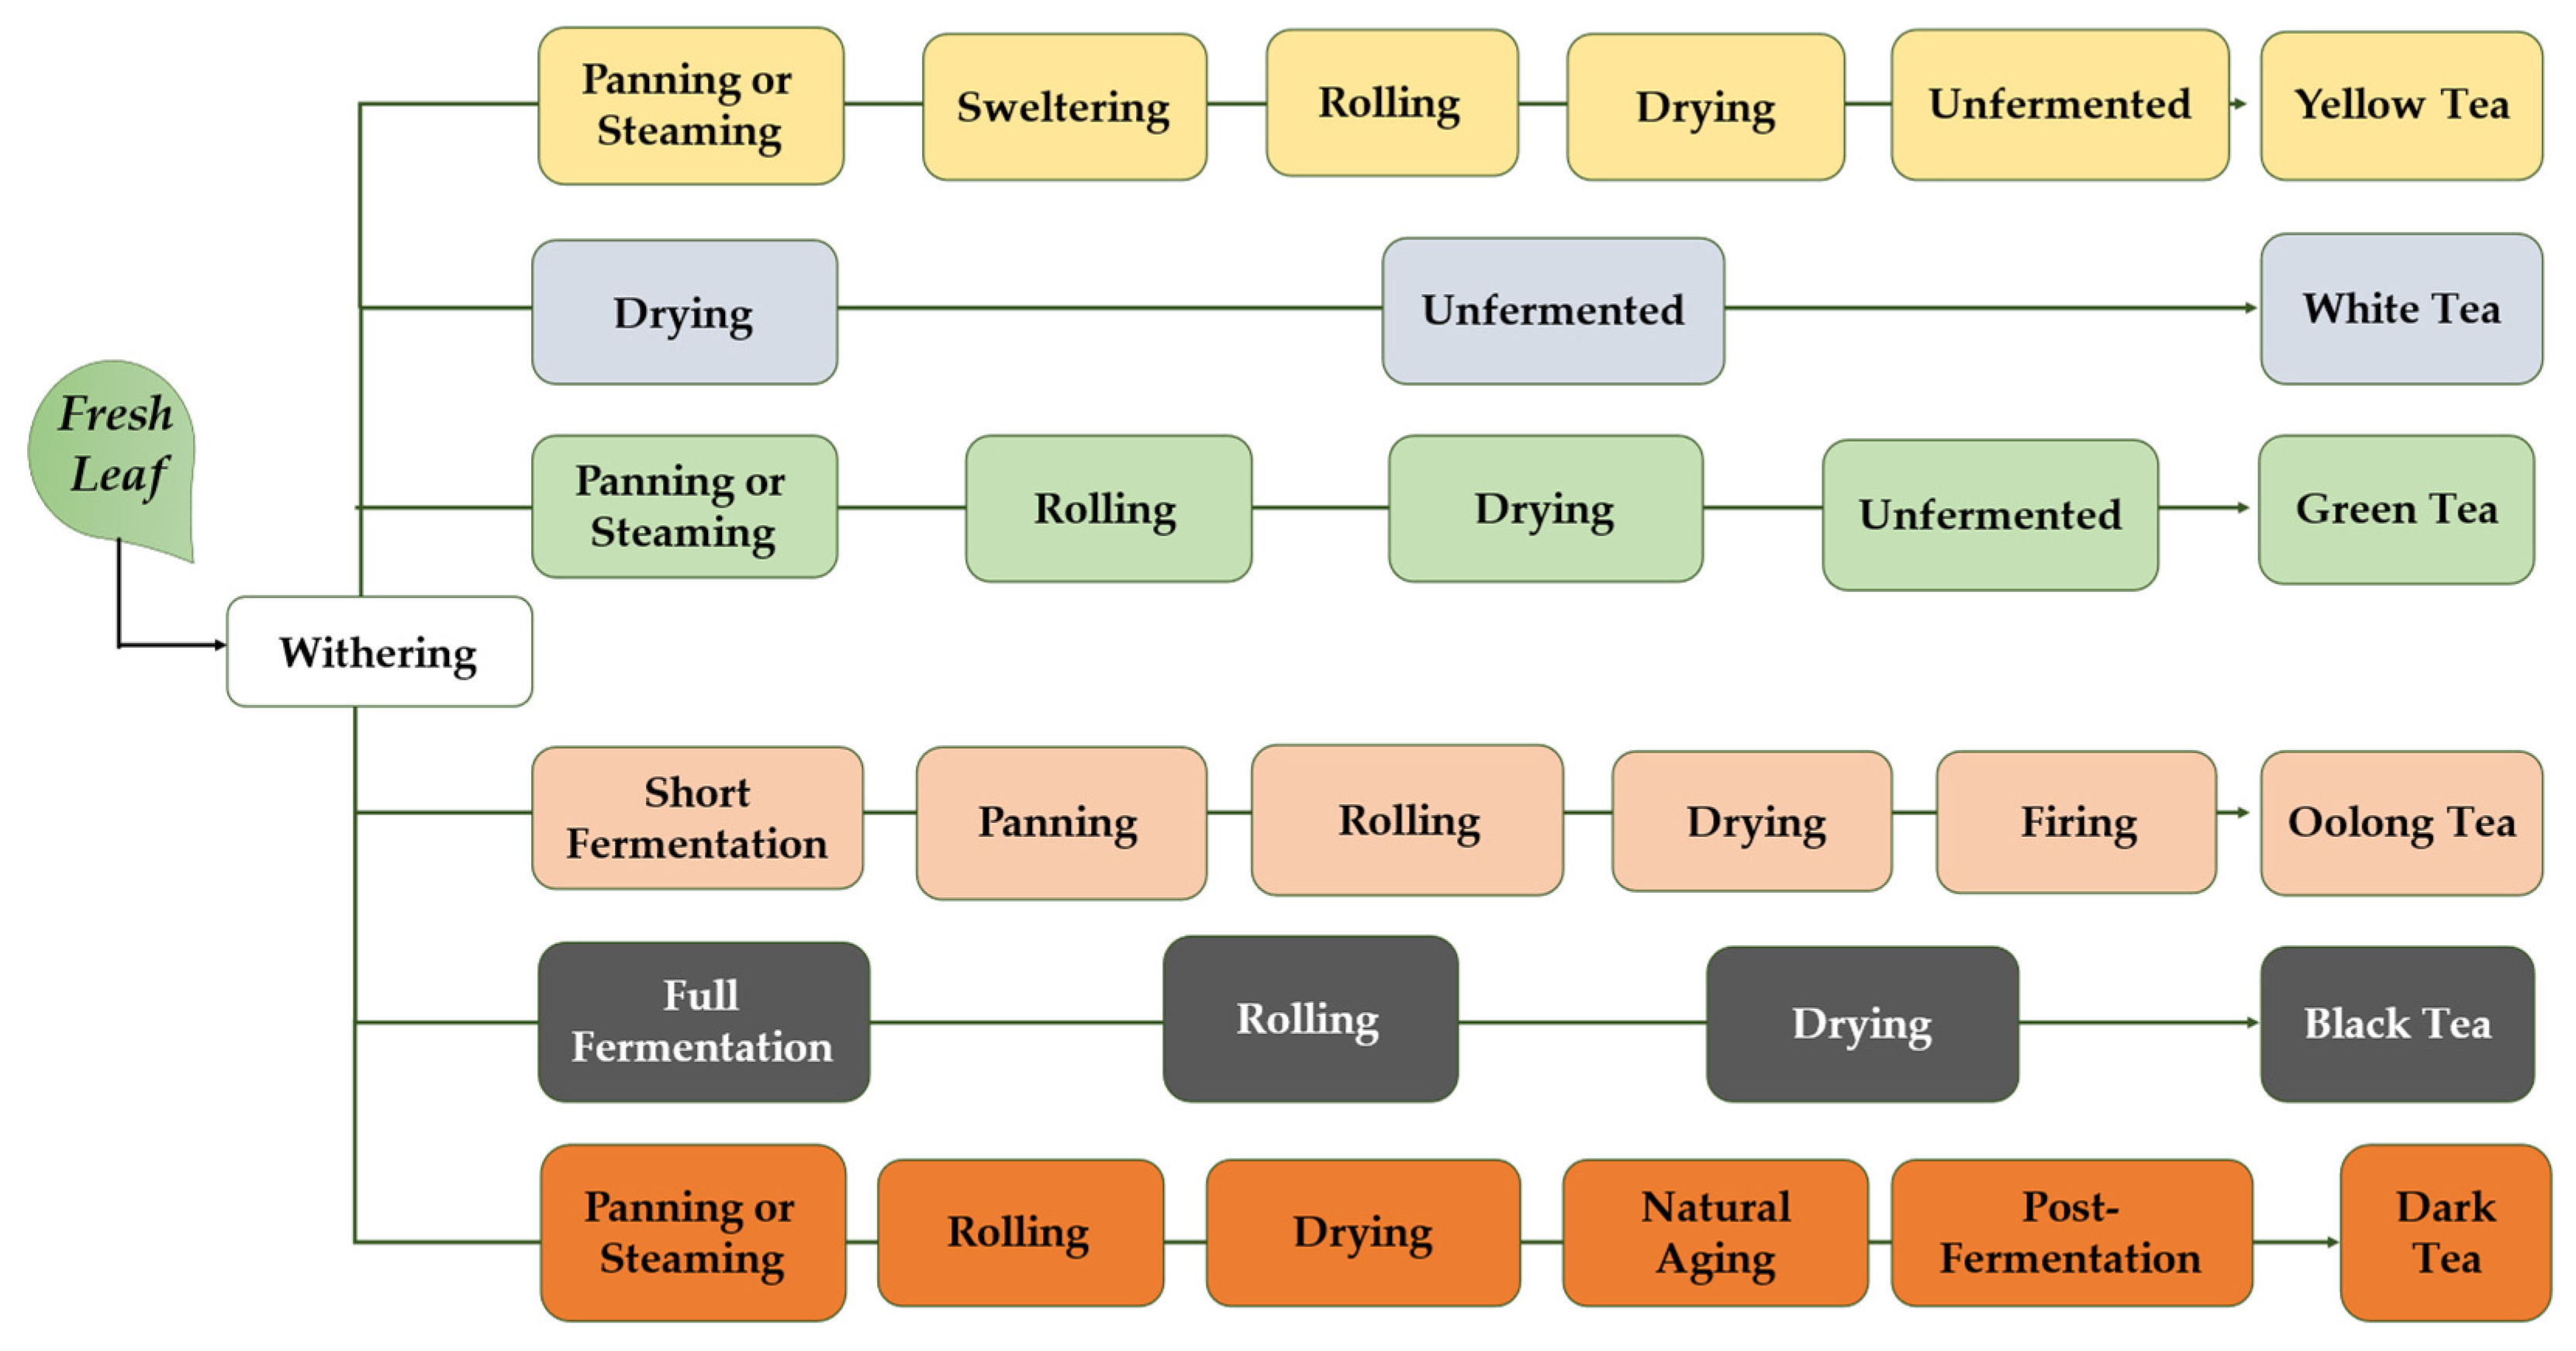
Figure 1. Tea processing technologies [7].
Beverages 08 00018 g001
Figure 2. Experimental and water extraction conditions for tea samples.
Beverages 08 00018 g002
Figure 3. Total phenolic content (TPC) in green tea samples (mg GAE/g). (a) TPC for green tea infusion at T = 80 °C for different infusion times and types of water; (b) TPC for green tea infusion at T = 100 °C for different infusion times and types of water. Error bars are ± standard deviation. Same letters indicate a significant difference according to the ANOVA test (p < 0.05).
Beverages 08 00018 g003
Figure 4. Total phenolic content (TPC) in black tea samples (mg GAE/g). (a) TPC for black tea infusion at T = 80 °C for different infusion times and different types of water; (b) TPC for black tea infusion at T = 100 °C for different infusion time and different types of water. Error bars are ±standard deviation. Same letters indicate a significant difference according to the ANOVA test (p < 0.05).
Beverages 08 00018 g004
Figure 5. TPC of green tea infusion (mg GAE/g) prepared at different pH values between 3 and 9, in distilled water; in buffer solution, and in natural mineral water at 100 °C for 10 min. Error bars are ±standard deviation. Same letters indicate a significant difference according to the ANOVA test (p < 0.05).
Beverages 08 00018 g005
Figure 6. ABTS radical scavenging activity of green tea infusion, at T = 80 °C (a) and at T = 100 °C (b); and of black tea samples, at T = 80 °C (c) and at T = 100 °C (d); in distilled water; in natural mineral water, and in tap water. Error bars are ±standard deviation. Same letters indicate a significant difference according to the ANOVA test (p < 0.05).
Beverages 08 00018 g006
Figure 7. DPPH radical scavenging activity of green tea infusion (a,b), at T = 80 °C (a) and at T = 100 °C (b); and of black tea samples (c,d) at T = 80 °C (c) and at T = 100 °C (d); in distilled water, in natural mineral water, and in tap water. Error bars are ±standard deviation. Same letters indicate a significant difference according to the ANOVA test (p < 0.05).
Beverages 08 00018 g007
Table 1. Physiochemical characteristics of natural mineral, tap, and distilled water.
ParameterUnitNMWTPDW
Electrical conductivity at 20 °CµS/cm6685716.8
pH-7.067.507.00
Fixed residuemg/L440408<1
Hardness13.333.5<0.01
Calcium (Ca2+)mg/L124104.0-
Magnesium (Mg+)mg/L29.418.70-
Sodium (Na+)mg/L4.04.1-
Potassium (K+)mg/L1.20.97-
Bicarbonate (HCO3)mg/L498399-
Sulfates (SO42−)mg/L17.216.60-
Chlorides (Cl)mg/L6.66.5-
Nitrates (NO3)mg/L22.99-
Nitrites (NO2)mg/L<0.002<0.01-
Publisher’s Note: MDPI stays neutral with regard to jurisdictional claims in published maps and institutional affiliations.