Article

A Modified Brewing Procedure Informed by the Enzymatic Profiles of Gluten-Free Malts Significantly Improves Fermentable Sugar Generation in Gluten-Free Brewing

Department of Food Science, College of Agricultural Sciences, The Pennsylvania State University, University Park, State College, PA 16802, USA
*
Author to whom correspondence should be addressed.
Beverages 2021, 7(3), 53; https://doi.org/10.3390/beverages7030053
Submission received: 14 June 2021 / Revised: 13 July 2021 / Accepted: 15 July 2021 / Published: 21 July 2021
(This article belongs to the Special Issue Featured Papers in Malting, Brewing and Beer Section)

Abstract

:
The mashing step underpins the brewing process, during which the endogenous amylolytic enzymes in the malt, chiefly β-amylase, α-amylase, and limit dextrinase, act concurrently to rapidly hydrolyze malt starch to fermentable sugars. With barley malts, the mashing step is relatively straightforward, due in part to malted barley’s high enzyme activity, enzyme thermostabilities, and gelatinization properties. However, barley beers also contain gluten and individuals with celiac disease or other gluten intolerances should avoid consuming these beers. Producing gluten-free beer from gluten-free malts is difficult, generally because gluten-free malts have lower enzyme activities. Strategies to produce gluten-free beers commonly rely on exogenous enzymes to perform the hydrolysis. In this study, it was determined that the pH optima of the enzymes from gluten-free malts correspond to regions already typically targeted for barley mashes, but that a lower mashing temperature was required as the enzymes exhibited low thermostability at common mashing temperatures. The ExGM decoction mashing procedure was developed to retain enzyme activity, but ensure starch gelatinization, and demonstrates a modified brewing procedure using gluten-free malts, or a combination of malts with sub-optimal enzyme profiles, that produces high fermentable sugar concentrations. This study demonstrates that gluten-free malts can produce high fermentable sugar concentrations without requiring enzyme supplementation.

Graphical Abstract

1. Introduction

Celiac disease is an autoimmune disorder causing damage to the small intestine when a gluten-sensitive individual consumes gluten [1]. Other gluten-related disorders are poorly characterized and involve varying degrees of sensitivity [2]. The only treatment for gluten-sensitive individuals is to avoid gluten in the diet. Beer is traditionally derived from barley, wheat, or rye, which are all gluten-containing grains. Gluten is a complex set of proteins that persist through the brewing process. In particular, the gliadins in wheat, hordeins in barley, and secalins in rye are proteins rich in proline and glutamine that resist degradation by intestinal enzymes and illicit an immunogenic response in a gluten-sensitive individual [3,4]. Research has been conducted to remove these proteins from beer using separation, filtration, or enzymatic methods [5,6]. While these treatments are effective at reducing gluten levels, the safety of these treated beers for gluten-sensitive individuals is not certain [7]. Research from Fiedler et al. [8] and Fiedler et al. [9] showed that gluten peptides, including those with known immunogenic sequences, could still be detected by mass spectrometry in enzymatically-treated beers. This suggests that the only certain method to make gluten-free (GF) beers is to utilize GF ingredients. Some GF ingredients include teff, millet, sorghum, rice, corn, buckwheat, amaranth, and quinoa as these GF grains do not contain the offending gluten proteins.
The first step in the brewing process is the mashing step, wherein hot water is added to milled malt, forming the mash. The malt contains amylolytic enzymes, namely β-amylase, α-amylase, and limit dextrinase (LD), which when activated begin to hydrolyze the starch to fermentable sugars (FS). The sugary liquid resulting from the mash is called wort, and the FS provide the primary food source for yeast during fermentation. β-amylase is an exo-acting enzyme that cleaves the α-1,4 linkages on the non-reducing ends of amylose and amylopectin producing maltose. α-amylase is an endo-acting enzyme that cleaves the α-1,4 linkages on the interior of chains of amylose and amylopectin producing smaller oligosaccharides. LD is the sole debranching enzyme in malt which cleaves the α-1,6 linkages in limit dextrins, which are the products formed when β-amylase and α-amylase can no longer act [10]. Limit dextrins are a distribution of oligosaccahrides with single or multiple α-1,6 linkages, and the branch point prevents additional enzymatic hydrolysis by β-amylase or α-amylase. [11] Limit dextrinase acts to debranch these dextrins providing additional substrates to β-amylase and α-amylase. These three enzymes work concurrently in the mash to hydrolyze the starch to FS. Quality barley malts will have high levels of activity of these enzymes and generate worts with a high concentration of FS.
Previous research on the usage of various GF grains as brewing ingredients has shown that GF malts are generally lower in β-amylase and α-amylase, but in some cases are higher in LD compared to barley [12,13,14,15,16,17]. Due to the lower activity, many of these studies have focused on optimizing malting procedures, with respect to moisture content, germination time, and temperature to produce GF malts with higher total enzyme activities. The optimization in these studies generally involves germination temperatures warmer than typically used for barley, and lower kilning temperatures in attempts to retain additional activity. However, the resulting worts have still largely been characterized by lower FS compared to barley. Many of these investigations have used barley-based mashing procedures, and while some add modifications, the results are only moderately successful and largely do not address potential enzymatic and physical differences in GF malts compared to barley. Besides the potential enzymatic differences, a known key physical difference in GF malts is that the gelatinization temperatures of the starch are higher than in barley. At the gelatinization temperature, the starch granule structure is destroyed, providing substrates for these amylolytic enzymes. The starch needs to be gelatinized for efficient enzymatic degradation [18], but at higher temperatures, enzyme denaturation will occur [19]. Good mashing procedures will balance time, temperature, and pH to ensure high enzyme activity for efficient starch degradation. In GF malts, efficient starch degradation is difficult to achieve, and the general conclusions of these previous studies were that while GF malts are viable brewing ingredients, it was the low enzyme activity that was the key limiting factor in GF malts. We hypothesize that the low enzyme activity was not the primary limiting factor, rather that mashing procedures used for barley are sub-optimal for GF malts, but that GF malts could successfully be utilized if improved mashing procedures were developed.
The objective of this study was to profile the pH and temperature optima and thermostability of these enzymes more thoroughly across several GF malts in order to inform the development of modified mashing procedures that may improve the FS profiles generated overall, and the production of maltose specifically. The present study challenges the notion that the low enzyme activity of GF malts is an inherent limiting factor and demonstrates that mashing procedures tailored to the enzymatic and physical properties of these malts can produce FS levels comparable to what is typically achieved with barley.

2. Materials and Methods

2.1. Materials

Unmalted brown and ivory teff (The Teff Company, Boise, ID, USA), unmalted sorghum (Bob’s Red Mill, Milwaukie, OR, USA), pale millet malt, pale buckwheat malt, yellow corn malt (Grouse Malt House Wellington, CO, USA), pale rice malt (Eckert Malting & Brewing, Chico, CA, USA), premium 2-row barley malt (Great Western Malting, Vancouver, WA, USA) and caramel-150 malt (Viking Malt, Lahti, Finland) were purchased from commercial sources.
In this study, all enzymes and mashing treatments were performed using malted grains, and all references to the malts are listed more simply as the grain name for brevity (i.e., barley, teff, sorghum, rice, millet, corn, and buckwheat all refer to malted forms of these grains), and all results refer to these malts specifically.
P-nitrophenol, malic acid, maleic acid, DL-dithiothreitol (DTT), bovine serum albumin (BSA), D-(+)-glucose ≥99.5%, D-(-)-fructose ≥99%, D-(+)-maltose monohydrate ≥99%, sucrose ≥99.5%, and ethylenediaminetetraacetic acid (EDTA) were purchased from Sigma-Aldrich (St. Louis, MO, USA). Sodium acetate trihydrate, 50% sodium hydroxide solution, calcium chloride dihydrate, tris(hydroxymethyl)aminomethane (TRIS), and L(+)-rhamnose monohydrate 99% were purchased from Fisher Scientific (Hampton, NH, USA). Maltotriose >95% and maltotetraose >90% were purchased from Megazyme Ltd. (Bray, Wicklow, Ireland). Lactic acid (88%) was purchased from LD Carlson Co. (Kent, OH, USA).

2.2. Teff and Sorghum Malting

Brown and ivory teff were malted individually according to a method described by Di Ghionno, Marconi, Lee, Rice, Sileoni and Perretti [13] with minor modifications. Samples of teff were initially washed 3 times with deionized water to remove dirt and debris. The rinsed teff was then steeped in deionized water for 3 h at room temperature (RT), followed by a 2 h air rest, and a final 2 h steep in fresh deionized water. The teff was then drained and left to germinate in the dark for 4 days at RT in an incubator (Fisher Scientific Isotemp Incubator 655D, Waltham, MA, USA). The teff malt was redistributed every 12 h to prevent clumping of the forming rootlets. After germination, the malt was kilned according to the following regimen: 20 h at 30 °C, 2 h at 60 °C, and 3 h at 65 °C. The grains were stirred intermittently during kilning to ensure uniform drying. Malting was performed for both teff varieties in triplicate, and the dried malt was stored in a −20 °C freezer.
Sorghum was malted based on a modified procedure from de Meo et al. [20] and Adewale and Oladejo [21]. The sorghum was washed as described above. Sorghum was steeped for 2.5 h at RT, followed by a 1.5 h air rest at RT, and the steep and air rest were repeated once more. The sorghum was then left to germinate for 72 h at 30 °C in the same incubator with the same agitation as above. After germination, the malted sorghum was kilned for 24 h at 55 °C. Sorghum malting trials were performed in triplicate and dried malt was stored in a −20 °C freezer.

2.3. General Enzyme Extraction and Assay Procedure

Samples of all malts (barley, ivory teff, brown teff, sorghum, millet, rice, corn, and buckwheat) were ground with a mortar and pestle, passed through a standard testing 250 µm mesh sieve (VWR International, Radnor, PA, USA), and stored in a −80 °C freezer before extraction and use in the enzyme assays.
The activities of β-amylase, α-amylase, and LD were determined spectrophotometrically using commercially available activity kits (Betamyl−3, Ceralpha, and PullG6 methods). These colorimetric activity kits use a p-nitrophenol linked to a specified substrate in the presence of secondary enzymes to relate the release of p-nitrophenol and increase in absorbance of the reaction well at 400 nm to the activity of the enzyme of interest. While the measurements of the activities of the enzymes under different pH and temperature conditions necessitated deviation from the manufacturer’s procedures, the enzyme extraction and general assay procedure described here were standardized. Assays were performed in 96-well microplates with the volumes of extract, substrate, and stopping reagent used being 10× less than in the kit instructions. Reaction length and temperature were the same as in the kit instructions, except for the temperature optima experiments described below.
Enzymes were extracted from experimental malts using methods described by Evans [22] and by Cornaggia et al. [23]. In brief, extraction was performed by adding 1 mL of 100 mM maleic acid solution (pH 5.5) containing 1 mg/mL BSA, and 25 mM DTT to 65 ± 5 mg ground malt. The mixture was vortexed for 5 s to mix and suspend the flour, and the enzymes were extracted overnight at RT without further mixing. At the end of the extraction, the mixture was centrifuged for 10 min at 1000× g (Centrifuge 5702, A-4-38 Rotor, Eppendorf AG, Hamburg, Germany), and aliquots of this initial enzyme extract were then diluted in the appropriate reaction buffer (described in Section 2.4) for incubation with the specific substrate. All extractions were performed with the added DTT to measure the total amount of β-amylase and limit dextrinase activity. The total activity measurement was chosen instead of the free activity (i.e., without adding DTT) to ensure sufficient activity was extracted from the low-activity malts to produce a detectable signal.
After reaction termination with the appropriate stopping reagent, the absorbance was recorded at 400 nm using a Multiskan GO microplate spectrophotometer (Thermo Scientific, Waltham, MA, USA). Activity measurements were performed in triplicate for each pH and temperature optima and thermostability experiments with each condition having its own blank. One unit of enzyme activity (U) was defined as the amount of enzyme present to release 1 µmol of p-nitrophenol in one minute at the specified reaction conditions. Concentrations of p-nitrophenol produced were quantified using a standard curve of p-nitrophenol in an equivalent solution of the enzyme extract and stopping reagent.

2.4. Determination of pH Optima of β-Amylase, α-Amylase, and Limit Dextrinase

While the pH conditions of the standard assay correspond to regions of good activity in barley malt, modified buffer systems were required to determine the optimal pH range of the β-amylase, α-amylase, and LD in GF malts. For the β-amylase series, the modified buffer was a solution of 50 mM malic acid, 50 mM maleic acid, 1 mM EDTA, and 1 mg/mL BSA. The pH of this modified buffer was adjusted with 4 M NaOH to pH 4.5–7.5 in 0.5 pH increments to cover the expected optimal range. For α-amylase, the modified buffer was a solution of 25 mM malic acid, 25 mM maleic acid, and 2 mM calcium chloride adjusted to pH 4.5–7.5. For LD, the modified buffer was a solution of 50 mM malic acid and 50 mM maleic acid adjusted to pH 4.5–7.5.
To modify the pH of the LD extracts by dilution, without increasing the reaction time, the extract was concentrated. A 10 kDa molecular weight cut-off microcentrifuge filter (VWR International, Radnor, PA, USA) was used to concentrate LD. The initial enzyme extract (0.5 mL) was added to the filter and centrifuged for 12 min at 14,000× g (Beckman Coulter, Microfuge 16, Brea, CA, USA). The volume of retentate was measured and used to calculate the concentration factor, which was included in the activity calculation. Aliquots of the concentrated enzyme extract were diluted in the appropriate buffer series, and the activity assay and calculation of activity was performed as described, with the concentration factor included in the calculation of LD activity. The pH of the assayed extracts was measured using a Thermo Orion 3 Star pH meter (Thermo Fisher Scientific, Waltham, MA, USA).

2.5. Determination of the Temperature Optima of β-Amylase, α-Amylase, and Limit Dextrinase

After the optimal pH range of β-amylase, α-amylase, and limit dextrinase were determined in each malt, additional aliquots of the initial enzyme extracts were then diluted in the appropriate reaction buffer to the optimal pH range and the assay was performed at 50, 60, and 70 °C. For each assay, 100 µL of diluted extract and the appropriate amount of substrate were dispensed into microcentrifuge tubes. The diluted extract and substrate solution were incubated for 2 min at the selected temperature prior to initiating the reaction. After the addition of the stopping reagent the microcentrifuge tubes were rapidly cooled in an ice bath and centrifuged for 4 min at 5000× g (Beckman Coulter, Microfuge 16, Brea, CA, USA). The centrifugation precipitated denatured protein from the reaction solution and prevented turbidity interference in the absorbance measurement. After centrifugation, the total reaction volumes were dispensed into a microplate and the calculation of activity was performed as described.

2.6. Determination of the Thermostability of β-Amylase, α-Amylase, and Limit Dextrinase

The initial enzyme extracts were diluted in the appropriate reaction buffer to the optimal pH range of the selected enzyme, and 200 µL of each diluted extract was added to 0.65 mL microcentrifuge tubes. The extracts were incubated at 50, 60, or 70 °C for 60 min, after an initial 2 min come-up time to equilibrate the diluted extracts to the selected temperature. After equilibration, samples were removed at 0, 10, 20, 40, and 60 min and rapidly cooled in an ice bath. Extracts were centrifuged for 4 min at 5000× g to remove denatured protein. After centrifugation aliquots of the supernatant were added to a 96-well microplate and the activity assays and calculation of activity was performed as described.

2.7. Standardization of Micromashing Experiments

To standardize a set of mashing protocols across a panel of malts, several parameters were held constant across treatments. Each malt (200 g) was milled in a Retsch SR200 Hammer Mill (Retsch GmbH, Haan, Germany) to pass a 200 µm screen and kept at RT until use. Mashing water was 0.7 mM calcium chloride in 18.2 MΩ-cm resistivity water. A total of 30 mL mashing water and 5 g of malt was used in each mash, with an initial liquor-to-grist ratio (L:G) of 15 mL mashing water to 5 g of malt flour. This was suitable for all samples except buckwheat, which required a L:G of 4:1 due to high viscosity. Sparging is the addition of more water at the termination of the mash to rinse the spent grains and extract additional sugars. Sparging was completed in two batches with the sparge volume being the difference between the total volume of 30 mL and water previously added. At the end of the mash, the temperature was raised to 80 °C to halt enzyme activity before continuing to the sparge and boil. The pH adjustments were performed using a 0.5 M lactic acid solution. For samples that required an acid addition of more than 1% total volume, the strike mashing water volume was decreased to maintain constant volume of 30 mL.

2.8. Micromashing Treatments Overview

A summary of the mashing treatments and the processing steps is shown in Table 1. A total of five mashing treatments were performed on all GF malts. The treatments were an inactivated enzymes (IE) mash, an infusion mash without pH adjustment (IM) based on the Modified Infusion Mash described by Cornaggia et al. [23], an infusion mash with pH adjustment to approximately 5.3 (pH-IM), an extended time infusion mash at a lower temperature (XT), and a modified decoction procedure (ExGM) inspired by the Schmitz process [24]. The barley control was a recipe of 80% premium 2-row barley base malt and 20% caramel-150 barley malt, a highly kilned malt variety that is non-enzymatic and used in recipes for adding flavor and color. The barley control was only subjected to the IM protocol. The barley recipe and the IM protocol were chosen to more model the types of recipes and procedures craft brewers utilize in practice [23]. Most beers sacrifice enzymatic activity for the additional flavor imparted by more highly kilned malts. This modification was utilized to simulate the fermentable sugar output of a real-world wort. The seven GF malts were subjected to each of the five treatments. An additional teff malt trial was required to complete these experiments and was pooled with the remaining ivory and brown teff, and the enzyme analysis of the pooled teff is provided in Table S1. A recipe of 60% millet, 25% rice, and 15% buckwheat, termed GFB1, was developed as an initial investigation into the suitability of combining GF malts and was only subjected to the ExGM treatment. All mashes and analyses were performed in duplicate.

2.9. Mashing Procedure

The strike water, sparge water, mashing vessels (50 mL centrifuge tubes), and wort fractions were held in thermostated water baths, with temperatures confirmed against secondary thermometers. The strike water is the water added to begin the mash and its temperature is higher than the target mashing temperature to account for the temperature differential between the hot mashing water and the awaiting grain. The strike temperature targets are system dependent and were determined empirically. Malt flour (5 ± 0.01 g) was added to a 50 mL centrifuge tube. The strike water was added, stirred with a spatula to mix, placed in the mashing water bath, and the timer started. For the treatments with pH adjustment, lactic acid (0.5 M) was added immediately after the strike water addition. Mashing vessels were mixed every ten minutes for the duration of the mashing treatment.
After the elapsed mashing time, the mashing vessels were placed in an awaiting boiling water bath and their temperatures were increased to 80 °C. Once at 80 °C, the mashing vessels were centrifuged for 5 min at 3220× g (Centrifuge 5810 R, A-4-62 Rotor, Eppendorf, Hamburg, Germany) to separate the first wort from the spent grain to simulate the lautering phase of brewing. After 5 min, the first wort was decanted into a sterile 50 mL centrifuge tube and held above 70 °C. To the spent grain, the first sparge water fraction (held above 70 °C) was added, stirred to resuspend the grain, and held above 70 °C for 10 min. After 10 min, the first sparge was centrifuged for 5 min at 3220× g and the second wort fraction was combined with the first. This sparge process was repeated using the final sparge water fraction but held above 70 °C for 5 min. All three wort fractions were combined, and the mass of the spent grain was recorded.
Once all wort fractions were combined in the sterile centrifuge tube, the tube was placed in an awaiting boiling water bath and the combined wort was brought to 100 °C and held for 1.5 min to ensure enzyme inactivation and to improve the microbial stability. After the boil, the tubes were loosely capped and placed in an ice bath to cool. The mass of the cooled collected wort was recorded, and a sample of the wort was collected using a disposable pipette sanitized with 70% ethanol. These samples were clarified by centrifugation for 10 min at 3000× g (Centrifuge 5702, A-4-38 Rotor, Eppendorf, Hamburg Germany). The remaining wort in the 50 mL tube was centrifuged for 5 min at 3220× g, and stored at −20 °C. The pH of the sampled wort was measured using a Thermo Orion 3 Star pH meter (Thermo Fisher Scientific, Waltham, MA, USA), and the specific gravity (SG) of the clarified wort was measured using an Anton Paar EasyDens (Anton Paar, Graz, Austria) with automatic temperature correction to 20 °C. A portion of the clarified wort (1 mL) was dispensed into a 1.7 mL microcentrifuge tube to be used for fermentable sugar analysis. The samples were stored at −20 °C prior to thawing and dilution for further analysis.
The IE treatment followed this same procedure, except immediately after addition of the strike water the mashing vessel was brought to a minimum of 99 °C for 1.5 min to inactivate enzymes, cooled to 65 °C, and then subjected to the remainder of the IM procedure. The mashing vessels reached the inactivation temperature within approximately 5 min to minimize the starch hydrolysis that may occur during the temperature ramp.
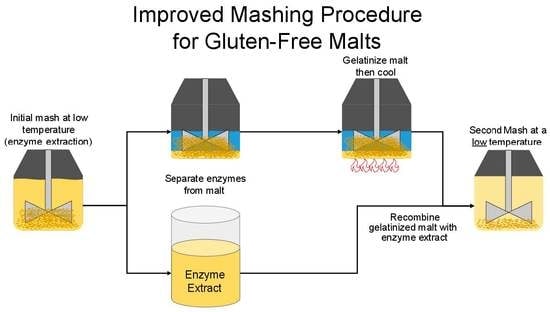
The ExGM procedure consisted of an initial enzyme extraction for 30 min at 55 °C. After extraction, the enzyme extract and grain were separated via centrifugation (5 min at 3220× g). The enzyme extract was decanted into a sterile 50 mL centrifuge tube and held at 55 °C. To the separated grain, 5 mL of mashing water was added and the grain resuspended. The grain was placed in a boiling water bath and brought to 90 °C for 1.5 min to gelatinize the starch. After 1.5 min the gelatinized grain was cooled to 55 °C, the enzyme extract added back, mixed, and then held for 2 h at 55 °C. The remaining procedure was followed as described above, reducing the sparge volume by the 5 mL of water used for gelatinization.
As mentioned above, buckwheat required a L:G of 4:1 (20 mL of strike water); and for the IE, IM, pH-IM, and XT treatments, the sparge was split into two batches of 5 mL. For the ExGM treatment, a single 5 mL sparge was performed to maintain the total volume at 30 mL.

2.10. Measuring Fermentable Sugar Output via High-Performance Anion-Exchange Chromatography with Pulsed Amperometric Detection (HPAEC-PAD)

Samples held in microcentrifuge tubes were removed from the freezer, equilibrated to RT, mixed, and centrifuged for 12 min at 14,000× g (Beckman Coulter, Microfuge 16, Brea, CA). The centrifugation removed retrograded starch and precipitated protein from the wort and served as a purification step prior to HPAEC-PAD analysis. Following a similar sample preparation method described by Langenaeken et al. [25], samples of wort were mixed with an internal standard solution of rhamnose and diluted to contain 10 mg/L of rhamnose. Diluted wort samples containing rhamnose were filtered through 0.45 µm nylon syringe filters (VWR International, Radnor, PA, USA) into 1.5 mL autosampler vials.
Quantification of FS was performed on a Thermo-Dionex ICS-5000+ chromatography system, equipped with an electrochemical detector with a gold on polyester disposable working electrode. Separation was performed with CarboPac PA1 guard (4 × 50 mm) and analytical (4 × 250 mm) columns. The CarboQuad quadruple waveform was used for detection as recommended by the manufacturer. Sample injections were 25 µL and the column and detector compartments were held at 30 °C. Separation was achieved using a multistep gradient program consisting of a 3-eluent system, 100 mM NaOH (A), 100 mM NaOH and 100 mM sodium acetate (B), and 300 mM NaOH (C) at a constant flow of 1 mL/min. Eluents were prepared using a 50% sodium hydroxide solution and sodium acetate trihydrate. Sodium hydroxide was added to 0.2 µm nylon membrane filtered water or sodium acetate solution, and eluents were degassed immediately. The headspace was purged three times with nitrogen and bottles held at 6 psi of nitrogen pressure to minimize carbonate contamination. The gradient program was as follows: 0 to 6 min; 95% A and 5% B, 6 to 20 min; a linear increase from 5% B to 100% B, 20 to 31 min; 100% B, 31.1 to 40 min; 100% C, 40 to 44 min; 100% C to 95% A and 5% B, finally, 44 to 52 min; 95% A and 5% B, re-equilibrating to starting conditions. FS were identified via standards and were quantified using a series of a mixed standard solution containing glucose, fructose, sucrose, maltose, and maltotriose, and a series of a standard solution of maltotetraose each containing 10 mg/L of rhamnose.

2.11. Statistical Analysis

Statistical analyses were performed using Minitab 19 (Minitab, State College, PA, USA). Fermentable sugar outputs were analyzed via one-way ANOVA using a Dunnett’s post hoc test, with barley total FS as the control (α = 0.05). Additional testing was performed on the ExGM treatments with fermentable sugar outputs comparable to barley to determine differences in the individual sugar concentrations. Analyses were performed using one-way ANOVA with Tukey’s Honestly Significant Difference post hoc test (α = 0.05). RStudio (version 1.4.1106 Boston, MA, USA) with the SensoMineR package (version 1.26) was used to perform the Principal Component Analysis (PCA) analysis of the wort outputs parameters [26].

3. Results

3.1. pH Optima of β-Amylase, α-Amylase, and Limit Dextrinase

The effect of pH on the major mashing enzymes was profiled using the modified buffers and the general assay procedure explained in the methods section. While the standard reaction conditions, as given in the manufacturer’s procedure, would still likely correspond to regions of activity of the enzymes in GF malts, we hypothesized that the individual enzymes within each malt might show different optima across the pH range investigated. Differences in pH optima would provide some rationale for specific modifications to mashing procedures individualized to the GF malts. However, this was largely not the case as shown in Figure 1A–C. To keep the assay procedure standardized, the only parameter that was changed across grains was the dilution factor in order to maintain sufficient degradation of the substrate for detection. Although the same buffers were used, the measured pH ranges and values were not identical. Some samples with low activity required more concentrated extracts for detection, which led to truncated profiles. Additionally, as observed in the mashing experiments, the buffering capacity of the grains were different, and this with variable dilution factors could explain measured pH values differing from the pH of the modified buffers. Nonetheless, the profiles demonstrate the effect of pH on enzyme activity in the pH range most relevant to brewing. For β-amylase (Figure 1A), the optimal range for barley and the teff samples were similar, between pH 5 and 6. For sorghum and millet, the magnitude of activity was approximately 7× lower than barley, and there did not appear to be any major effect of pH on activity across the range tested. For buckwheat, the pH optima appeared to be at or below a pH of 4.5, although high relative activity (~70%) was still observed at approximately pH 5.3. For α-amylase (Figure 1B) in barley, teff, and sorghum the optimal range was clearly between 5 and 5.5. In millet, rice, and corn, the effect of pH was less pronounced, but these enzymes were still active in the same range as barley, teff, and sorghum. LD (Figure 1C) showed little pH effect on activity across the measured range. Rice was the exception where activity continued to increase with increasing pH, and its optimum was found at approximately pH 6.5.
From a magnitude perspective, three key trends were observed. First, barley had more β-amylase and α-amylase activity than any GF malt tested (7.36 U/g and 107 U/g in barley, respectively vs. 6.14 U/g and 28.18 U/g, the maximum observed from ivory teff). The second was that five of the seven GF malts had more LD activity than barley (>82.45 U/kg vs. 64.86 U/kg in barley). These two trends have been observed in other previous work investigating GF malts [12,13,14,15,16,17]. The third trend was that rice, corn, and buckwheat malts were characterized by low or no enzyme activity (<6 U/g α-amylase in rice and corn, <50 U/kg LD in corn and buckwheat). It is important to note specifically that β-amylase was not detected in rice or corn and α-amylase was not detected in buckwheat, as this played a major role in the results of the subsequent mashing experiments.
A typical mash pH for traditional brewing is approximately 5.5, although this can be affected by the selected mashing conditions (e.g., the L:G ratio). There is also some evidence that suggests that lowering the pH further may be beneficial in releasing the enzymes from their inhibitors [27,28]. Given the normal mashing target pH, and the pH profiles observed here, it was determined that a single mash pH target of 5.3 would be suitable for maintaining high activity across all grains and enzymes. This target of 5.3 was used pH for the subsequent mashing experiments.

3.2. Temperature Optima of β-Amylase, α-Amylase, and Limit Dextrinase

The optimal temperatures of barley’s enzymes are 50 °C for β-amylase, 60 °C for α-amylase, and approximately 60 °C for LD. [27,29]. Similar for pH optima, we hypothesized that GF malts would maintain some activity at the temperature optima of barley’s enzymes, and the temperatures traditionally used in mashing procedures, but that individual differences in optimal temperature would provide additional rationale for tailoring mashing procedures to the GF malts. However, as was observed with the pH profiles, this was largely not the case. As shown in Figure 1D–F, the temperature optima for all enzymes in all grains was generally between 50 and 60 °C, with all enzymes displaying lower activity at 70 °C. For β-amylase, buckwheat followed the same trend as barley, with 50 °C being optimal. In contrast, teff, sorghum, and millet showed an optimum at 60 °C. For α-amylase, the optima were 60 °C for all malts. For LD there appeared to be no difference between 50 and 60 °C in any malt. A variation of the general assay procedure, described in Appendix A, confirmed that the optima obtained were representative of the malts and not due to denaturation of the secondary enzymes in the substrate solutions (Figure S1).
For mashing purposes, maximizing activity across all the enzymes is important, and so a temperature between 50 and 60 °C seemed a likely target. However, the assay kits used only measure activity in a relatively short time frame, and choosing the optimal temperature is not just defined by high activity over a short time, but rather more by high activity sustained over the length of the mash. Consequently, the thermostability of the enzymes must be considered.

3.3. Thermostability of β-Amylase, α-Amylase, and Limit Dextrinase

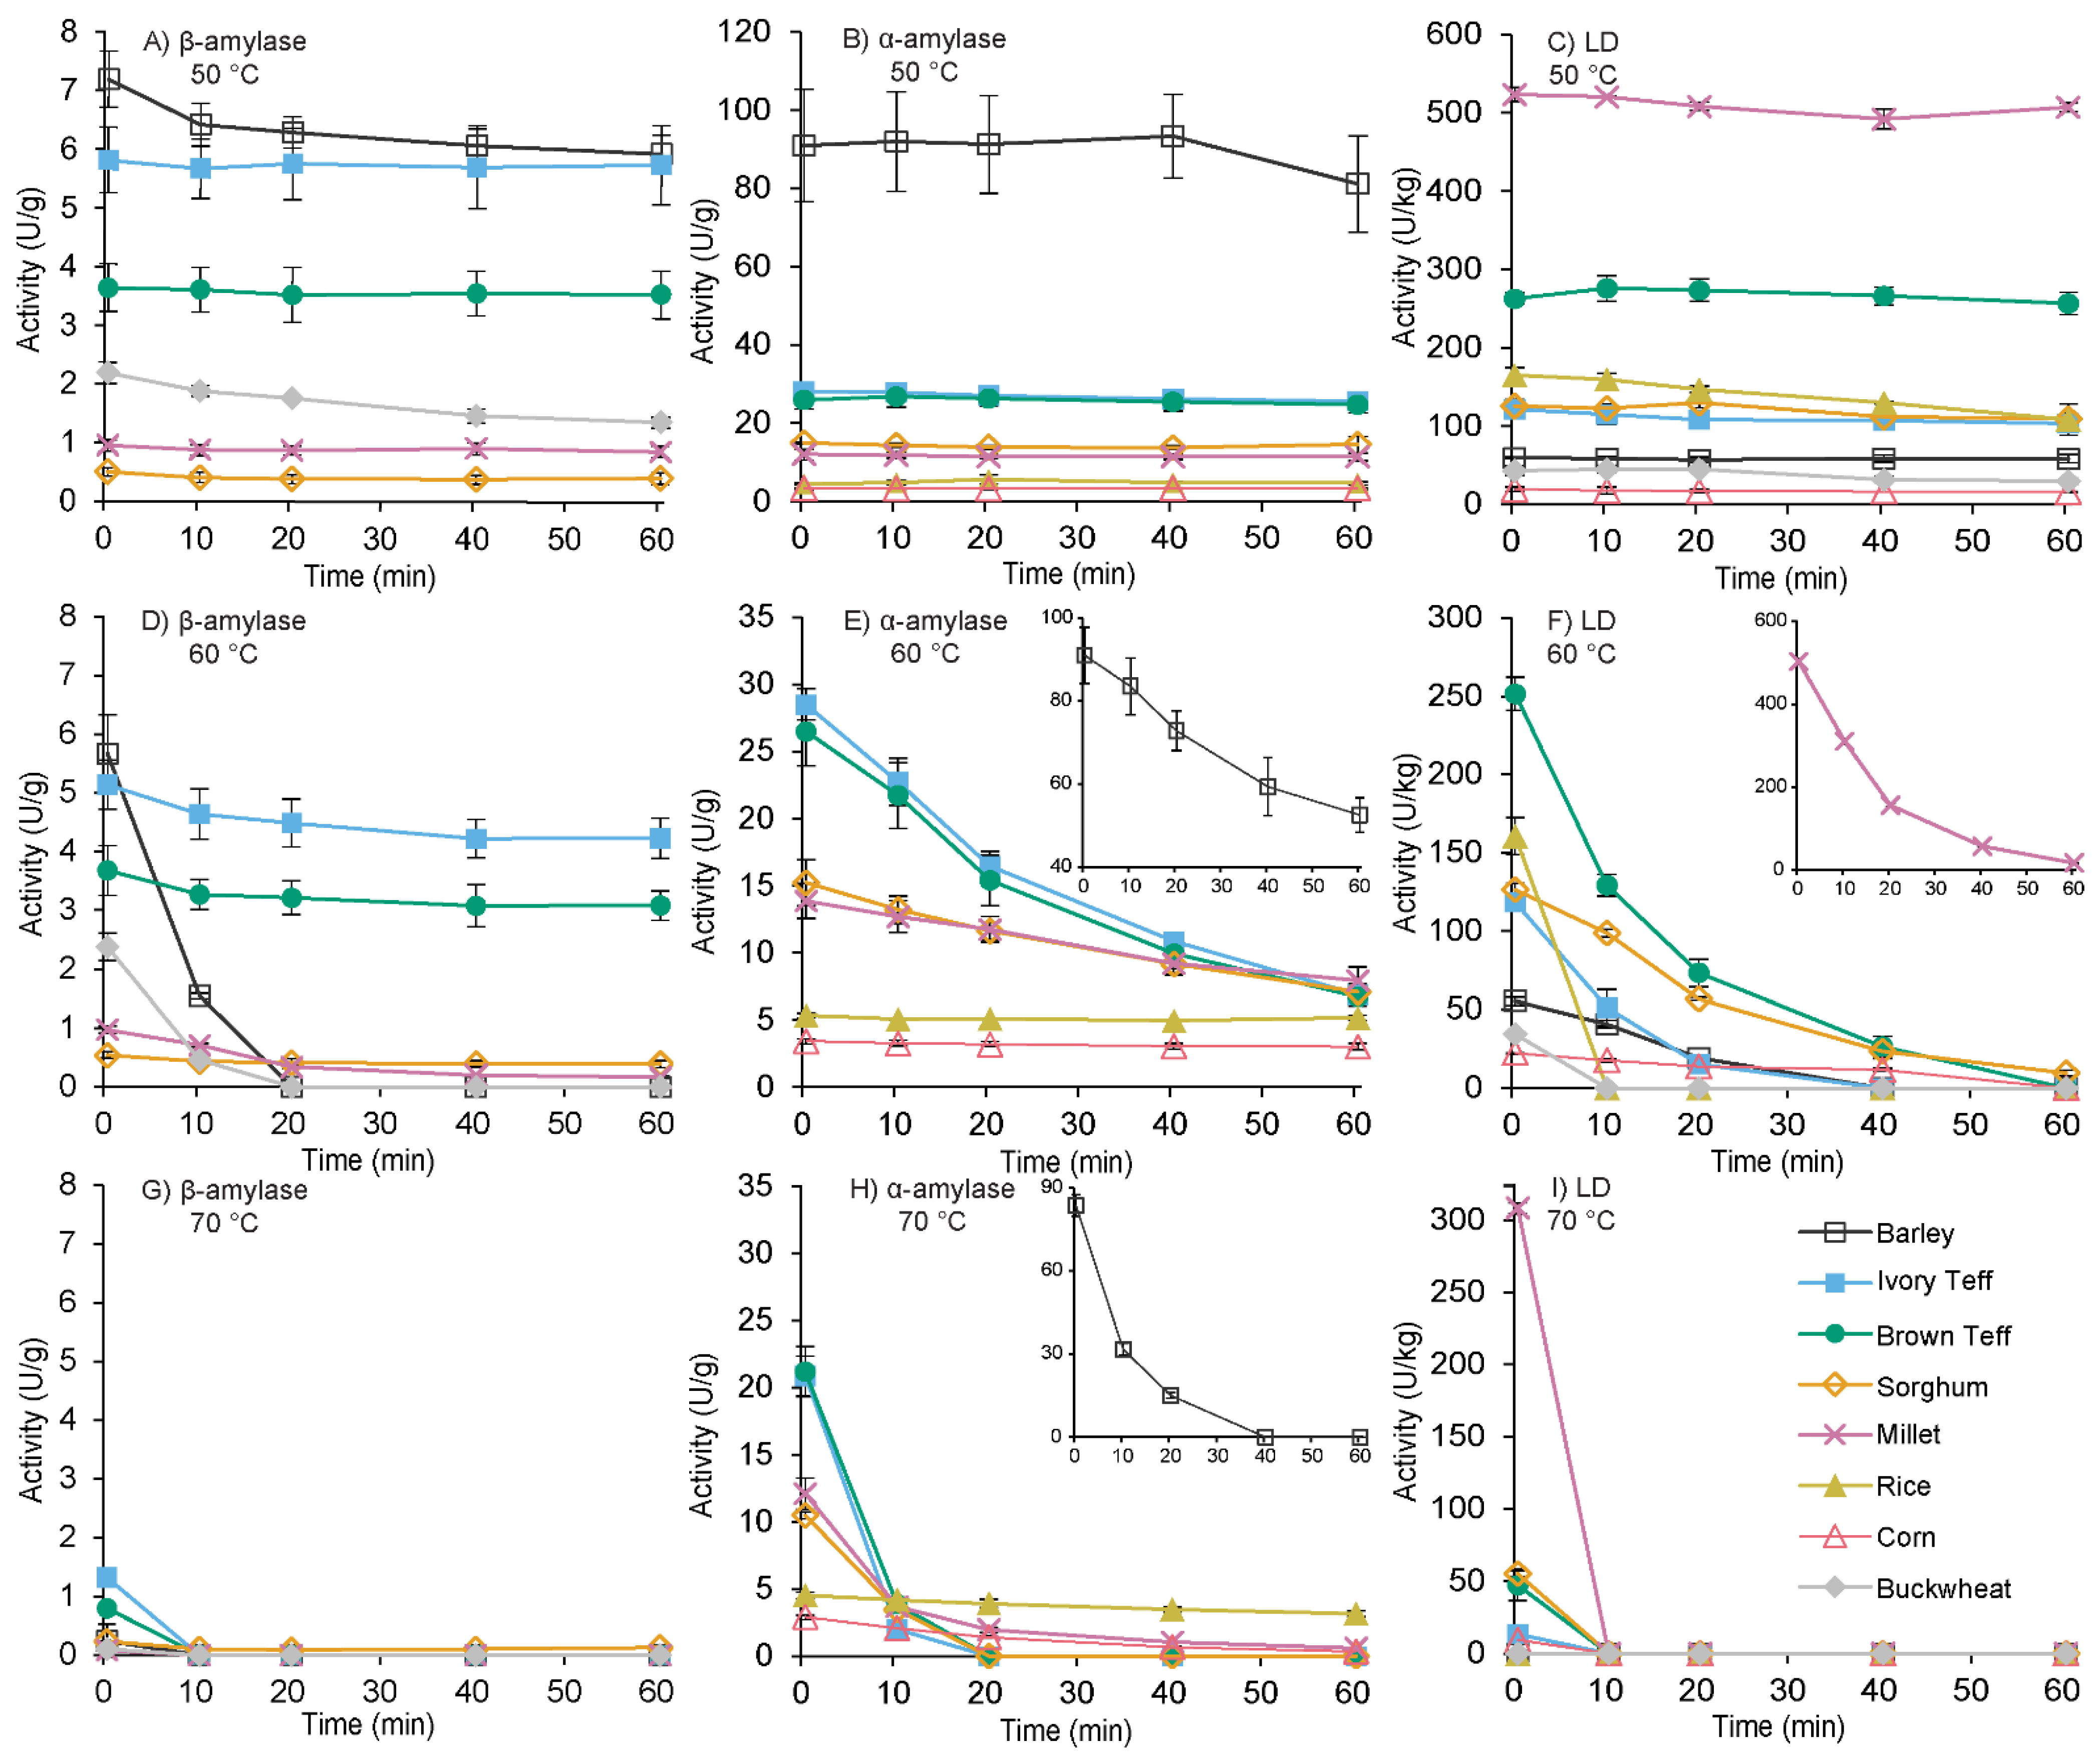
The β-amylase, α-amylase, and LD extracts from each of the malts were incubated at 50, 60, and 70 °C for 60 min to assess their thermostability. A common mashing protocol used by craft brewers is mashing at a temperature of 65 °C for approximately 60 min [28], and so this timeframe was chosen to be consistent with conventional procedures. The results of the thermostability experiments are shown in Figure 2, β-amylase (Figure 2A,D,G), α-amylase (Figure 2B,E,H), and LD (Figure 2C,F,I). The first obvious trend was that most of the enzymes had good stability at 50 °C for 60 min (~100% remaining activity), and only barley β-amylase, buckwheat β-amylase, and rice LD showed some inactivation at that temperature, although ≥60% relative activity remained after one hour. The second observed trend was that at 70 °C, most enzymes denatured rapidly with significant loss of activity within the initial 2 min equilibration. As previously reported in barley, α-amylase appeared to be the most thermostable of the enzymes [10], and this trend was observed here as well, with teff being the notable exception when examined at 60 °C: teff β-amylase maintained a higher fraction of activity at the end of the hour compared to its α-amylase. However, at 70 °C, teff β-amylase was denatured within 10 min, and α-amylase within 20 min. One of the more interesting observations was that corn and rice α-amylase, despite their low activity, were wholly thermostable at 60 °C. Corn was inactivated within the hour at 70 °C, but rice maintained approximately 70% of its activity after 60 min at 70 °C. Additional incubations for rice were performed at 80 and 90 °C. At 80 °C, activity was maintained in rice for at least 40 min, but at 90 °C was inactivated within 10 min (Figure S2).
The optimum mashing temperature for these enzymes is a balance between the increased activity of the enzymes at a higher temperature, and the rate of deactivation of those enzymes at that temperature. For example, with LD the activity at 60 °C was not determined to be different to that at 50 °C after a 30 min reaction time, however the thermostability curve indicates a steady loss of activity at 60 °C over this time frame. Thus, at 60 °C the activity of the enzyme is higher, but the proportion of active enzyme steadily decreases over the reaction time, ultimately matching the concentration of p-nitrophenol produced at 50 °C. As mentioned, a common mashing procedure for barley is maintaining a temperature of 65 °C for 60 min. In the context of the thermostability curves for barley observed here, at 65 °C β-amylase and LD would be inactivated rapidly. Although the 60 min mash at 65 °C works for barley, results here suggest that the amount of time for which these enzymes are active in a mash is limited but sufficient to generate the requisite FS.
This observation begets three questions. First, is the thermostability of the enzymes in the native system better than in these diluted buffers? According to De Schepper et al. [30], the answer is most likely yes. The authors performed similar temperature optima and thermostability experiments to what is described here for β-amylase and α-amylase in different barley samples and observed similar temperature optima and thermostabilities. They then compared those activities to the activity over the course of an actual barley mash and determined that β-amylase specifically was more thermostable in the native system. In their step mash system, β-amylase began slowly inactivating at 62 °C but was rapidly inactivated above 62 °C. The second question then is, if β-amylase, and presumably LD given the thermostabilities observed in Figure 2, are inactivating at a temperature of 65 °C, what minimum amount of activity is required to produce a fermentable sugar output typical for barley? The third question is then, how long is the window of opportunity open for enzyme activity before the starch hydrolysis plateaus, either due to completion or enzyme denaturation? We therefore sought to answer these questions with mashing experiments involving GF malts with optimized pH and temperature profiles.

3.4. Mashing Experiments

Besides the enzymes, another crucial aspect of the mash is the gelatinization of the malt starch, which involves starch granule hydration and swelling. At the gelatinization temperature (GT), the granule structure is destroyed, and the contents solubilize into the aqueous phase, allowing for enzyme action. Below the GT, starch granules are resistant to enzymatic degradation [18]. In barley, gelatinization of its large granules (10–20 µm diameter) begins at approximately 56 °C, allowing for its enzymes to degrade the starch at common mashing temperatures of 62–65 °C [25]. In the GF malts, the reported GTs are much higher than barley, approaching or exceeding 70 °C [3,4,31,32]. Table 2 provides the range of gelatinization temperatures typical for barley malts and the selected gluten-free malts observed in other studies. These higher GTs and the thermostability results shown in Figure 2 show an apparent incongruity. Below the GT, the starch cannot be hydrolyzed efficiently, but bringing the temperature of the mash to the GT of the GF malts would denature the enzymes. This is not an issue in barley, where the temperature regions of enzyme activity and gelatinization overlap; however, in GF malts, they do not.
The mashing treatments were then designed to investigate whether both the low enzyme activity and higher GT hurdles could be overcome. The infusion mash (IM) and pH-adjusted infusion mash (pH-IM) treatments served to model the fermentable outputs of GF malts using common barley mashing procedures with and without pH adjustment. The inactivated enzymes (IE) treatment showed how much latent FS was in the system in the absence of enzymatic activity, and what could be attributed to each of the mashing treatments. The extended time infusion mash (XT) treatment addressed the main conclusion from the thermostability results, i.e., total activity can be improved by maintaining enzyme activity over a longer time at a lower temperature but did not ensure gelatinization. The final treatment, ExGM, was inspired by the Schmitz process; a scarcely used method for barley [24]. The ExGM procedure was developed specifically to maintain the enzyme activity but still ensure starch gelatinization. This method produces an enzyme Extract during the initial phase, which is then separated from the grains. The isolated malt starch is then Gelatinized and cooled. The enzyme extract is reintroduced, and a second Mash is performed (ExGM). What results is a mashing procedure that gelatinizes the starch without denaturing enzyme activity and includes a second mash at a lower temperature that retains enzyme activity but would not gelatinize the starch.
The length of the second mash in the ExGM procedure (2 h) was chosen after initial attempts with 1 and 1.5 h led to incomplete digestions. The XT samples were held for the same total time as the ExGM samples. The mashing temperature of 55 °C was chosen based on the temperature optima experiments, adjusted with the assumption that the thermostability of the enzymes would be improved in the native system. As mentioned above, the buffering capacity of the grains differed and the volume of 0.5 M lactic acid required to change the pH to approximately 5.3 ranged from 35 µL (for corn) to 900 µL (for buckwheat). The measured specific gravities (SG) and final pH of the collected worts and a discussion of the results are provided in Table S2 and Appendix A, respectively.
Total fermentable sugar (FS) content is the sum of glucose, fructose, sucrose, maltose, and maltotriose concentrations. Maltotetraose is not fermentable by most brewing yeasts and served as a marker of the non-fermentable dextrin fraction of the wort. The concentrations of each sugar, the total FS, and the fraction (%) of glucose and maltose in the FS output were used in a Principal Component Analysis to evaluate how the malts and mashing treatments related to one another overall. The resulting PCA biplot for the first two dimensions, capturing 75.4% of the total variance, is shown in Figure 3. Four general groups appear, (1) the buckwheat mashing treatments in the top left quadrant, driven by their FS outputs being comprised of mostly glucose, although they had low concentrations of FS overall, (2) the IE mashing treatments together with rice and corn samples in the bottom left, characterized by comparatively high levels of sucrose, (3) the teff, sorghum, and millet malts that underwent IM, pH-IM, and XT mashing procedures that center around the origin, indicating intermediate levels of FS, and finally (4) the teff, sorghum, millet and GFB1 grains that underwent the ExGM mashing procedure on the right-hand side of the PCA, indicating more similar sugar composition to the barley control, characterized by high levels of maltose, maltotriose, and total FS. As shown by the loading scores, sample separation along the first dimension, accounting for nearly half of the total variance (PC1; 49.8%), is driven mostly by differences in maltose, maltotriose, and total FS concentrations, with samples on the left-hand side showing lower concentrations of these parameters than those on the right. The major vertical separation (PC2; 25.6%) results from differences in sucrose concentration, with samples located at the bottom of the PCA biplot showing higher levels of sucrose. This demonstrates that only the five ExGM samples were comparable to barley in their FS composition.
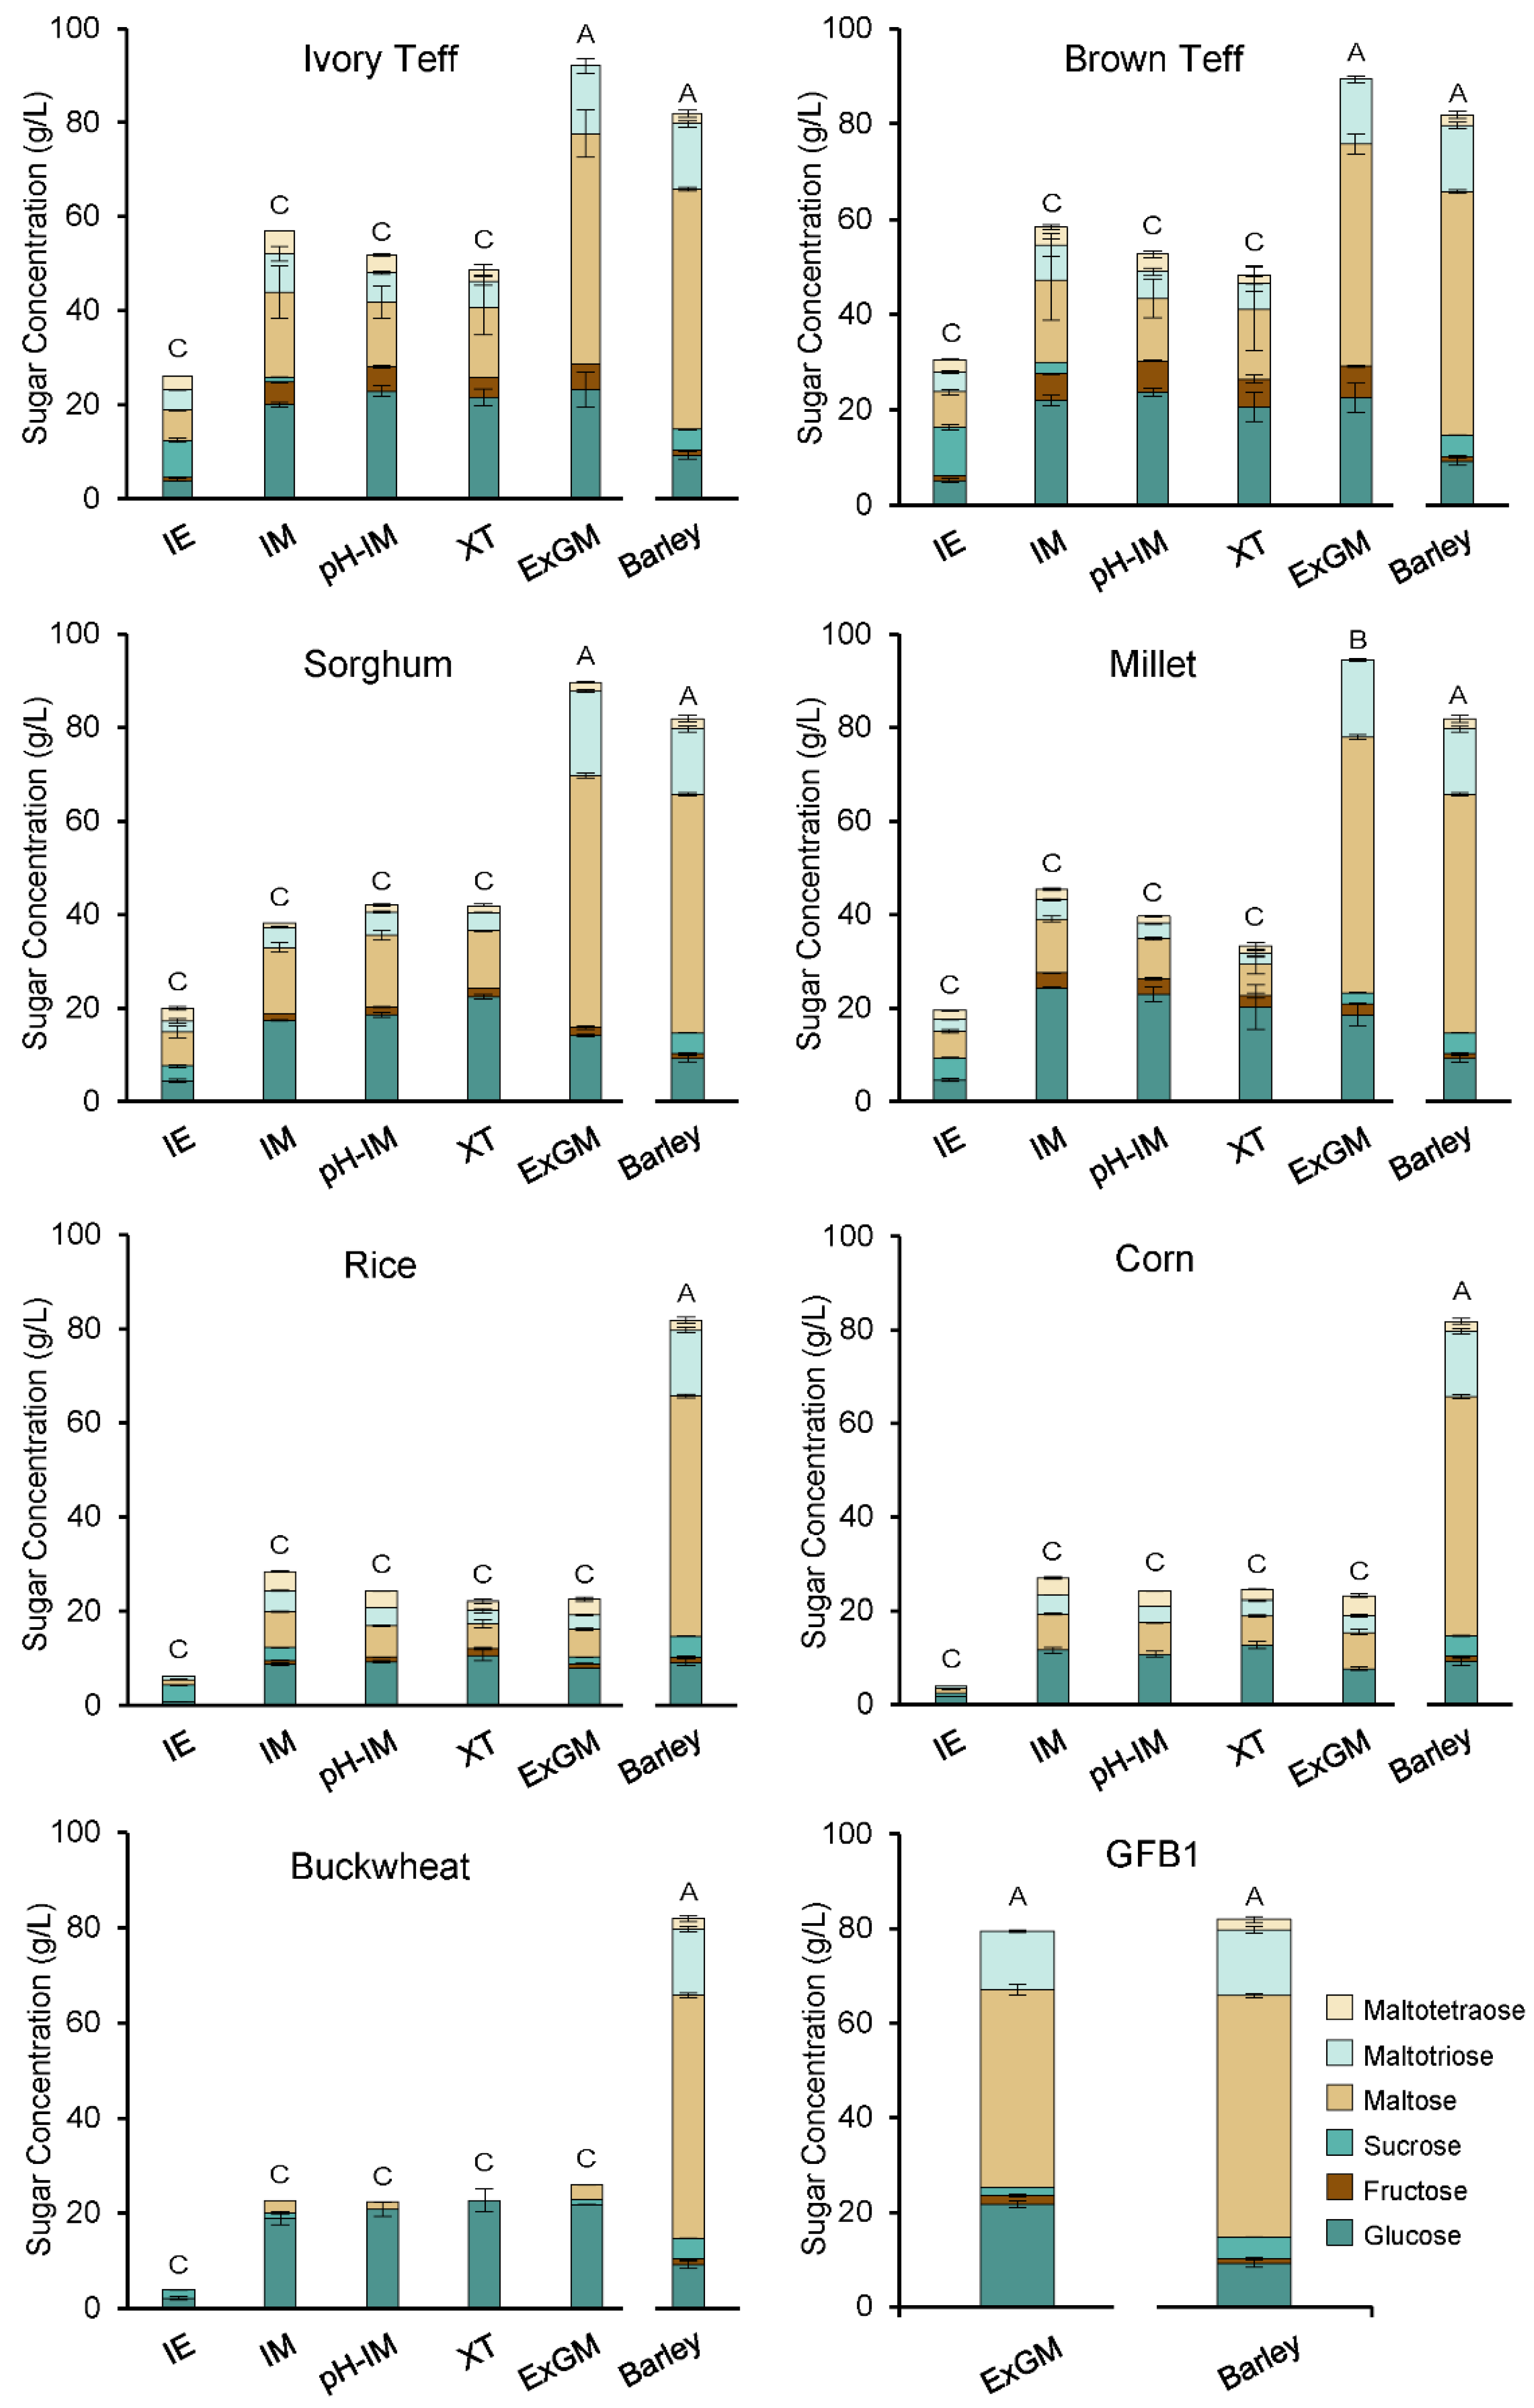
The sugar outputs of each treatment are grouped by malt and each shown compared to barley in Figure 4. It was observed that the IM, pH-IM, and XT mashing treatments produced some additional sugar (~20 g/L), when compared to the IE treatments, but were unsuccessful overall in comparison to barley. The results of the Dunnett’s post hoc testing on FS showed that the teff, sorghum and GFB1 ExGM samples were not significantly different from barley (p > 0.05). While the millet ExGM samples were significantly different from barley, they contained more FS overall (94.46 g/L vs. 77.48 g/L for barley). The ExGM treatment was not successful for rice, corn, or buckwheat, and as mentioned in Section 3.1, these malts did not contain a full suite of amylolytic enzymes. Rice and corn lacked β-amylase, and consequently produced little maltose. In the chromatograms of these ExGM samples, peaks were observed after maltotetraose in the 100 mM sodium acetate portion of the gradient, which are most likely significant concentrations of unidentified dextrins (data not shown). Combined with little maltose production in these samples, the dextrins suggest α-amylase activity, but that FS generation overall was hindered by a lack of β-amylase. Buckwheat lacked α-amylase but had one of the higher β-amylase activities measured in the GF malts. Paradoxically, very little maltose was generated in any of the buckwheat treatments. An explanation for this could be that these enzymes need to work in tandem: without α-amylase activity there is little available substrate being generated for β-amylase, leading to little maltose production. It seemed the lack of FS generation in rice, corn, and buckwheat appeared due to their lacking β-amylase or α-amylase. However, this did not mean that they were not viable brewing ingredients. As shown in Figure 4, when a combination of millet, rice, and buckwheat (GFB1) was subjected to the same ExGM treatment, a FS output comparable to barley was generated. This combination of malts ensured that all three key enzymes were present and shows that these GF malts can be utilized in a complementary manner to reach FS concentrations similar to barley.
Looking at the only successful treatment (ExGM), Table 3 summarizes the individual sugars and SG measured in the ExGM treatments of the teff, sorghum, millet, and GFB1 malts compared to barley. All GF samples contained significantly more glucose and fructose, and significantly less sucrose than barley. They also contained similar amounts of maltose, although some grains (teff, GFB1) contained lower amounts of maltose, sorghum and millet showed higher maltose concentrations than barley. Only the maltose concentrations of barley and GFB1 differed significantly from each other. Maltotriose concentrations were also similar, with sorghum having the highest and GFB1 the lowest. Maltotetraose was only observed in the barley and sorghum samples. It is possible that the GF malts also have higher α-glucosidase activity than barley, which may explain the increased glucose generation. Likewise, sucrose was a major component of the FS in the IE samples (>19%), and the low concentration or absence of sucrose in most of the remaining GF worts suggests that there may be some endogenous invertase activity.
Beyond the total FS, the concentration of individual sugars is also important. It has been reported that in worts with a higher % of glucose, higher concentrations of esters and fusel alcohols are formed during fermentation [33,34]. A high amount of glucose can also lead to the inhibition of maltose utilization by yeast, with a rule of thumb to keep glucose, fructose, and sucrose concentrations below 25% of the total FS profile [35,36,37]. In previous investigations using GF malts, the worts contained high relative concentrations of glucose and moderate to low concentrations of maltose (~50% glucose, ~30 g/L maltose or lower) [12,37,38]. While the increased production of esters and fusel alcohols is not necessarily a negative, understanding the underlying carbohydrates and potential fermentation implications will be important when developing GF recipes. The secondary goal of these experiments was to determine if the GF malts could also produce high concentrations of maltose. In the IM, pH-IM, and XT samples, glucose was the major component (>37% compared to 12% in barley). In the successful ExGM samples, maltose became the dominant sugar (≤25% glucose and >52% maltose compared to 66% maltose in barley), indicating, that although these samples tend to produce more glucose than barley, their major FS was still maltose.
Returning to the two unanswered questions of how much enzyme activity is needed and for how long, the results here suggest that it is much lower than expected. Despite the low β-amylase and α-amylase activities of the GF malts, high concentrations of FS could be produced. As shown by De Schepper, Michiels, Buvé, Van Loey and Courtin [30] and Saarni et al. [39] in barley, the majority of the FS are generated in an approximate 20–25 min window. In barley, its high enzyme activity is only required for a short period of time. In GF malts, enzyme action is required over a much longer period to counteract the low activity. The key conclusion here being, that the magnitude of activity is not limiting in GF malts provided all three enzymes are present and improved mashing procedures are implemented. This is not to say that the magnitude of activity is irrelevant, rather producing better GF malts with higher activity will make this process even more efficient.
Extending these results back to a barley system, as concluded by De Schepper, Michiels, Buvé, Van Loey and Courtin [30], normal mashing procedures do not utilize barley’s enzymes to the maximum extent, and while an ExGM procedure is unnecessary when using barley, taking into account gelatinization and enzyme thermostabilities, perhaps there is still room for improvement. LD appears the limiting factor in barley, and wort fermentability is more correlated to LD activity [29]. Implementing an ExGM protocol that preserves LD activity could also be a potential avenue to the formation of barley beers with very low dextrin and residual sugar concentrations.

4. Conclusions

We hypothesized that individual differences in the pH and temperature optima of GF malt enzymes would provide a rationale to tailor mashing procedures to those differences. Instead, it was observed that in general the pH and temperature optima were not different from barley. The enzymes did differ in thermostability, indicating that in most cases using normal mashing procedures at temperatures commonly used for barley, the already lower enzyme activity in GF malts is lost rapidly. However, when the ExGM procedure was implemented, viable FS outputs can be generated from GF malts that are similar to or even exceed the FS outputs of barley. The ExGM decoction separates the enzymes from the starch, allowing for an additional processing step to gelatinize the starch without denaturing the enzymes. This process also implements a low-temperature mash that preserves the enzyme activity extracted from GF malts, so that their lower activity can be maintained over a longer time frame. Together, these two conditions allow for more efficient starch degradation and the formation of a GF wort with a high fermentable sugar concentration. In the remaining treatments, where these two conditions were not met, fermentable sugar generation was much lower than what can be typically generated when using barley.
While the results shown here demonstrate a process that increases fermentable sugar formation from gluten-free malts for use in brewing, free amino nitrogen (FAN) also plays a key role in yeast nutrition but was not addressed. It is possible that improving the enzymatic conditions for starch degradation might also improve protein degradation and increase FAN, but what results from the subsequent fermentation of these higher FS worts has yet to be investigated. Another limitation is the small scale of the mashes performed. The small scale made heating and cooling rapid and separation easier. The time and energy costs associated with the steps in the ExGM process are not insignificant for commercial breweries. Similarly, while convenient to use centrifugation here, the inherent differences in the size or presence of husk material in GF malts may limit the adaptability to current industrial lautering operations. Additional investigations into the gelatinization properties of these GF malts, their downstream processing, and additional process optimization is needed to improve the efficiency of this process and its applicability to industrial breweries. Nonetheless, the ExGM process can generate high FS from a variety of GF malts without exogenous enzymes and provides a new avenue of investigation for the production of GF beer.

5. Patents

A U.S. provisional patent application (Serial No. 63/178,107) has been filed for the mashing procedures developed herein.

Supplementary Materials

The following are available online at https://www.mdpi.com/article/10.3390/beverages7030053/s1, Figure S1: Activity of barley β-amylase, rice α-amylase, and millet limit dextrinase as measured using the general assay procedure and using the thermal inactivation method described in SM1.1. Data represent the mean (n = 3) ± standard deviations. Table S1: Enzyme analysis of the pooled teff samples used in the mashing experiments compared to the teff samples used for the enzyme profiling. Activity was measured at optimum pH and at 40 °C using the general assay procedure. The major differences in the malt used for the mashing samples was that they were lower in β-amylase. While this demonstrates there were differences amongst the teff malting trials, the pooled ivory and brown teff sampleswere still successful in generating fermentable sugars when used with the ExGM procedure, despite having lower β-amylase activity than the sample used for the enzyme analysis,. Data represent the mean (n = 3) ± standard deviations. Figure S2: Rice α-amylase thermostability at 80 and 90 °C. Activity is expressed as the total remaining activity after incubation at each selected time point. Data represent the mean (n = 3) ± standard deviations, and some error bars are contained within data points. Table S2: Measured SG and final wort pH of collected mash samples. Data represent the mean (n = 2) ± standard deviations. Table S3: Expanded mashing treatment overview.

Author Contributions

Conceptualization, A.J.L., R.J.E., and D.W.C.; methodology, A.J.L., R.J.E., and D.W.C.; formal analysis, A.J.L., R.J.E., H.H., and D.W.C.; investigation, A.J.L.; resources, R.J.E. and D.W.C.; writing—original draft preparation, A.J.L.; writing—review and editing, A.J.L., R.J.E., H.H., and D.W.C.; visualization, A.J.L. and H.H.; supervision, R.J.E. and D.W.C.; project administration, R.J.E. and D.W.C.; funding acquisition, D.W.C. and R.J.E. All authors have read and agreed to the published version of the manuscript.

Funding

This work was funded, in part, through technical assistance grants to D. Cockburn and R. Elias (PO 63019432 and PO63019744) by the Pennsylvania Department of Agriculture through the Pennsylvania Malt and Brewed Beverage Industry Promotion Board. This work was also supported by USDA National Institute of Food and Agriculture Federal Appropriations to D. Cockburn (project PEN04650 accession no. 1015962), R. Elias (project PEN04522, accession no. 0233376), and H. Hopfer (project PEN04624, accession no. 1013412).

Data Availability Statement

Available data pertinent to the results of this study are reported in the manuscript and the Supplementary Materials.

Acknowledgments

The authors would like to thank Gregory Ziegler in the Department of Food Science at the Pennsylvania State University for providing the unmalted ivory and brown teff, and for help with the malt milling for the mashing experiments. The authors would also like to thank Brendan Ledley for his advice regarding figure layout and design.

Conflicts of Interest

The funders had no role in the design of the study; in the collection, analyses, or interpretation of data; in the writing of the manuscript, or in the decision to publish the results. A U.S. provisional patent application (Serial No. 63/178,107) has been filed for the mashing procedures developed herein.

Appendix A

Appendix A.1. Supplementary Methods 1.1. Confirmation of Temperature Optima

The activity kits are reliant on the action of secondary enzymes in the substrate mixture to release the p-nitrophenol, after action by β-amylase, α-amylase, or limit dextrinase, and so it was possible that the activity measurements at higher temperature were being depressed due to the inactivation of these secondary enzymes. Whereby, more substrate may have been degraded by the enzyme of interest, but the p-nitrophenol was not released by the secondary enzymes. To test this, samples of barley for β-amylase, and millet for limit dextrinase were incubated at 50, 60, and 70 °C, and rice for α-amylase at 60, 70, and 80 °C, but at the termination of the reaction the TRIS stopping reagent was not added, rather the samples were placed in a block heater at 99 °C and held for 90 s. This heating step inactivated all enzymes present in the solution, confirmed by a significant increase in turbidity of the samples. After thermal inactivation, the samples were cooled to RT in an ice bath. The samples were then incubated for 5 min at 40 °C and an additional aliquot of the substrate solution, containing the active form of the secondary enzymes, was added. This second reaction was run at 40 °C for the same length of time as the standard assay, either 10 min or 30 min. At the termination of this reaction, the appropriate TRIS stopping reagent was added, the samples centrifuged, and the activity was measured and calculated following the general procedure. A blank was treated the same, as an additional aliquot of the substrate would increase the background absorbance of the reaction well, regardless of additional activity. The second aliquot of substrate containing the secondary enzymes would develop additional color if there was any partially degraded substrate. These samples were chosen because barley and millet had the highest β-amylase and limit dextrinase activity, respectively, and rice had thermostable α-amylase. The results in Figure S1, show for barley and millet, the same optima trend was observed, suggesting that the values at 60 and 70 °C obtained were representative of the malt enzymes, and not depressed by inactivation of the secondary enzymes. For rice, additional activity was observed at 60 and 70 °C using this method in comparison to the general procedure, but 60 °C was still the clear optimum. For rice, the same reaction was also run at 80 °C, and only there a large divergence between the two methods was seen (Figure S1B). As mentioned, rice had a thermostable α-amylase, and it seems likely that the additional activity observed at 70 and 80 °C was due primarily to rice α-amylase’s thermostability, and that the general temperature optima procedure was still representative of the remaining malt enzymes.

Appendix A.2. Supplementary Results 1.1. Specific Gravity Measurements

Specific gravity is a common measurement used by brewers to indicate the amount of material extracted into the aqueous phase during mashing and stands as a proxy indicator for the fermentable sugars. In barley, a higher specific gravity generally equates to more fermentable sugars and eventually a higher alcohol-by-volume. However, as shown in Table S2 for GF malts, SG alone seems to be a poor indicator of fermentable sugar concentrations. While the ExGM samples generally had higher specific gravities overall, the remaining treatments generally also still had high specific gravities. However, as the results in Figure 4 showed, much lower fermentable sugars concentrations. While SG is a simple measurement that brewers can perform without the need for expensive lab equipment, its value is minimized without context. In barley and in the ExGM samples where good enzyme activity and starch degradation occurs, SG will relate broadly to the fermentable sugars. However, without this assured starch degradation, as shown by the low fermentable sugar concentration in the IE, IM, pH-IM, and XT results shown in Figure 4, the measurement can be confounded by any partially degraded starch and long-chain dextrins that are soluble and affect density but are not fermentable.

References

  1. Fasano, A.; Catassi, C. Celiac Disease. N. Engl. J. Med. 2012, 367, 2419–2426. [Google Scholar] [CrossRef]
  2. Cabrera-Chávez, F.; Dezar, G.V.A.; Islas-Zamorano, A.P.; Espinoza-Alderete, J.G.; Vergara-Jiménez, M.J.; Magaña-Ordorica, D.; Ontiveros, N. Prevalence of Self-Reported Gluten Sensitivity and Adherence to a Gluten-Free Diet in Argentinian Adult Population. Nutrients 2017, 9, 81. [Google Scholar] [CrossRef] [PubMed]
  3. Hager, A.-S.; Taylor, J.P.; Waters, D.M.; Arendt, E.K. Gluten free beer—A review. Trends Food Sci. Technol. 2014, 36, 44–54. [Google Scholar] [CrossRef]
  4. Rubio-Flores, M.; Serna-Saldívar, S.O. Technological and Engineering Trends for Production of Gluten-Free Beers. Food Eng. Rev. 2016, 8, 468–482. [Google Scholar] [CrossRef]
  5. Akeroyd, M.; Van Zandycke, S.; Hartog, J.D.; Mutsaers, J.; Edens, L.; Berg, M.V.D.; Christis, C. AN-PEP, Proline-Specific Endopeptidase, Degrades All Known Immunostimulatory Gluten Peptides in Beer Made from Barley Malt. J. Am. Soc. Brew. Chem. 2016, 74, 91–99. [Google Scholar] [CrossRef]
  6. Watson, H.; Vanderputten, D.; Van Landschoot, A.; Decloedt, A. Applicability of different brewhouse technologies and gluten-minimization treatments for the production of gluten-free (barley) malt beers: Pilot- to industrial-scale. J. Food Eng. 2019, 245, 33–42. [Google Scholar] [CrossRef]
  7. Tanner, G.J.; Colgrave, M.L.; Howitt, C.A. Gluten, Celiac Disease, and Gluten Intolerance and the Impact of Gluten Minimization Treatments with Prolylendopeptidase on the Measurement of Gluten in Beer. J. Am. Soc. Brew. Chem. 2014, 72, 36–50. [Google Scholar] [CrossRef]
  8. Fiedler, K.L.; Panda, R.; Croley, T.R. Analysis of Gluten in a Wheat-Gluten-Incurred Sorghum Beer Brewed in the Presence of Proline Endopeptidase by LC/MS/MS. Anal. Chem. 2018, 90, 2111–2118. [Google Scholar] [CrossRef]
  9. Fiedler, K.L.; Cao, W.; Zhang, L.; Naziemiec, M.; Bedford, B.; Yin, L.; Smith, N.; Arbuckle, M.; Lopez-Hernandez, A.; Jackson, L.S. Detection of gluten in a pilot-scale barley-based beer produced with and without a prolyl endopeptidase enzyme. Food Addit. Contam. Part A 2019, 36, 1151–1162. [Google Scholar] [CrossRef]
  10. Evans, E.; van Wegen, B.; Ma, Y.; Eglinton, J. The Impact of the Thermostability of α-Amylase, β-Amylase, and Limit Dextrinase on Potential Wort Fermentability. J. Am. Soc. Brew. Chem. 2003, 61, 210–218. [Google Scholar] [CrossRef]
  11. Enevoldsen, B.S.; Schmidt, F. Dextrins in brewing. J. Inst. Brew. 1974, 80, 520–533. [Google Scholar] [CrossRef]
  12. Ceccaroni, D.; Marconi, O.; Sileoni, V.; Wray, E.; Perretti, G. Rice malting optimization for the production of top-fermented gluten-free beer. J. Sci. Food Agric. 2019, 99, 2726–2734. [Google Scholar] [CrossRef] [PubMed]
  13. Di Ghionno, L.; Marconi, O.; Lee, E.G.; Rice, C.J.; Sileoni, V.; Perretti, G.I.F. Gluten-Free Sources of Fermentable Extract: Effect of Temperature and Germination Time on Quality Attributes of Teff [Eragrostis tef(zucc.) Trotter] Malt and Wort. J. Agric. Food Chem. 2017, 65, 4777–4785. [Google Scholar] [CrossRef]
  14. Gebremariam, M.M.; Zarnkow, M.; Becker, T. Effect of Drying Temperature and Time on Alpha-Amylase, Beta-Amylase, Limit Dextrinase Activities and Dimethyl Sulphide Level of Teff (Eragrostis tef) Malt. Food Bioprocess Technol. 2013, 6, 3462–3472. [Google Scholar] [CrossRef]
  15. Mezgebe, A.G.; Abegaz, K.; Taylor, J. Relationship between waxy (high amylopectin) and high protein digestibility traits in sorghum and malting quality. J. Cereal Sci. 2018, 79, 319–327. [Google Scholar] [CrossRef] [Green Version]
  16. Nic Phiarais, B.P.; Wijngaard, H.H.; Arendt, E.K. Kilning Conditions for the Optimization of Enzyme Levels in Buckwheat. J. Am. Soc. Brew. Chem. 2006, 64, 187–194. [Google Scholar] [CrossRef]
  17. Zarnkow, M.; Keßler, M.; Burberg, F.; Back, W.; Arendt, E.K.; Kreisz, S. The Use of Response Surface Methodology to Optimise Malting Conditions of Proso Millet (Panicum miliaceum L.) as a Raw Material for Gluten-Free Foods. J. Inst. Brew. 2007, 113, 280–292. [Google Scholar] [CrossRef]
  18. Mousia, Z.; Balkin, R.; Pandiella, S.; Webb, C. The effect of milling parameters on starch hydrolysis of milled malt in the brewing process. Process. Biochem. 2004, 39, 2213–2219. [Google Scholar] [CrossRef]
  19. Fox, G. Chapter 16—Starch in Brewing Applications. In Starch in Food, 2nd ed.; Sjöö, M., Nilsson, L., Eds.; Woodhead Publishing: Cambridge, MA, USA, 2018; pp. 633–659. [Google Scholar]
  20. Meo, B.; Freeman, G.; Marconi, O.; Booer, C.; Perretti, G.; Fantozzi, P. Behaviour of Malted Cereals and Pseudo-Cereals for Gluten-Free Beer Production. J. Inst. Brew. 2011, 117, 541–546. [Google Scholar] [CrossRef]
  21. Adewale, I.O.; Oladejo, A. Properties of the isoforms of α-amylase from kilned and unkilned malted sorghum (Sorghum bicolor). Carbohydr. Polym. 2009, 77, 105–109. [Google Scholar] [CrossRef]
  22. Evans, D.E. A More Cost- and Labor-Efficient Assay for the Combined Measurement of the Diastatic Power Enzymes β-Amylase, α-Amylase, and Limit Dextrinase. J. Am. Soc. Brew. Chem. 2008, 66, 215–222. [Google Scholar] [CrossRef]
  23. Cornaggia, C.; Evans, D.E.; Draga, A.; Mangan, D.; McCleary, B.V. Prediction of potential malt extract and beer filterability using conventional and novel malt assays. J. Inst. Brew. 2019, 125, 294–309. [Google Scholar] [CrossRef]
  24. de Clerck, J. A Textbook of Brewing; Siebel Institute of Technology: Chicago, IL, USA, 1994; Volume 1. [Google Scholar]
  25. Langenaeken, N.A.; De Schepper, C.F.; De Schutter, D.P.; Courtin, C.M. Different gelatinization characteristics of small and large barley starch granules impact their enzymatic hydrolysis and sugar production during mashing. Food Chem. 2019, 295, 138–146. [Google Scholar] [CrossRef] [PubMed]
  26. Le, S.; Husson, F. SensoMineR: A package for sensory data analysis. J. Sens. Stud. 2008, 23, 14–25. [Google Scholar] [CrossRef]
  27. Osman, A. The Advantages of Using Natural Substrate-Based Methods in Assessing the Roles and Synergistic and Competitive Interactions of Barley Malt Starch-Degrading Enzymes. J. Inst. Brew. 2002, 108, 204–214. [Google Scholar] [CrossRef]
  28. Bamforth, C.W. Barley and malt starch in brewing: A general review. Tech. Q. Master Brew. Assoc. Am. 2003, 40, 89–97. [Google Scholar]
  29. Stenholm, K.; Home, S. A New Approach to Limit Dextrinase and its Role in Mashing*. J. Inst. Brew. 1999, 105, 205–210. [Google Scholar] [CrossRef]
  30. De Schepper, C.; Michiels, P.; Buvé, C.; Van Loey, A.; Courtin, C. Starch hydrolysis during mashing: A study of the activity and thermal inactivation kinetics of barley malt α-amylase and β-amylase. Carbohydr. Polym. 2021, 255, 117494. [Google Scholar] [CrossRef]
  31. Zarnkow, M.; Keßler, M.; Back, W.; Arendt, E.K.; Gastl, M. Optimisation of the Mashing Procedure for 100% Malted Proso Millet (Panicum miliaceum L.) as a Raw Material for Gluten-free Beverages and Beers. J. Inst. Brew. 2010, 116, 141–150. [Google Scholar] [CrossRef]
  32. Wijngaard, H.; Arendt, E. Optimisation of a Mashing Program for 100% Malted Buckwheat. J. Inst. Brew. 2006, 112, 57–65. [Google Scholar] [CrossRef]
  33. Verstrepen, K.J.; Derdelinckx, G.; Dufour, J.-P.; Winderickx, J.; Thevelein, J.; Pretorius, I.; Delvaux, F.R. Flavor-active esters: Adding fruitiness to beer. J. Biosci. Bioeng. 2003, 96, 110–118. [Google Scholar] [CrossRef]
  34. Younis, O.S.; Stewart, G.G. Sugar uptake and subsequent ester and higher alcohol production by Saccharomyces cerevisiae. J. Inst. Brew. 1998, 104, 255–264. [Google Scholar] [CrossRef]
  35. Peinado, J.M.; Loureiro-Dias, M.C. Reversible loss of affinity induced by glucose in the maltose-H+ symport of Saccharomyces cerevisiae. Biochim. Biophys. Acta 1986, 856, 189–192. [Google Scholar] [CrossRef]
  36. Ernandes, J.R.; Williams, J.W.; Russell, I.; Stewart, G.G. Effect of yeast adaptation to maltose utilization on sugar uptake during the fermentation of brewer’s wort. J. Inst. Brew. 1993, 99, 67–71. [Google Scholar] [CrossRef]
  37. Di Ghionno, L.; Sileoni, V.; Marconi, O.; De Francesco, G.; Perretti, G.I.F. Comparative study on quality attributes of gluten-free beer from malted and unmalted teff [Eragrostis tef (zucc.) trotter]. LWT 2017, 84, 746–752. [Google Scholar] [CrossRef]
  38. Nic Phiarais, B.P.; Mauch, A.; Schehl, B.D.; Zarnkow, M.; Gastl, M.; Herrmann, M.; Zannini, E.; Arendt, E.K. Processing of a Top Fermented Beer Brewed from 100% Buckwheat Malt with Sensory and Analytical Characterisation. J. Inst. Brew. 2010, 116, 265–274. [Google Scholar] [CrossRef]
  39. Saarni, A.; Miller, K.V.; Block, D.E. A Multi-Parameter, Predictive Model of Starch Hydrolysis in Barley Beer Mashes. Beverages 2020, 6, 60. [Google Scholar] [CrossRef]
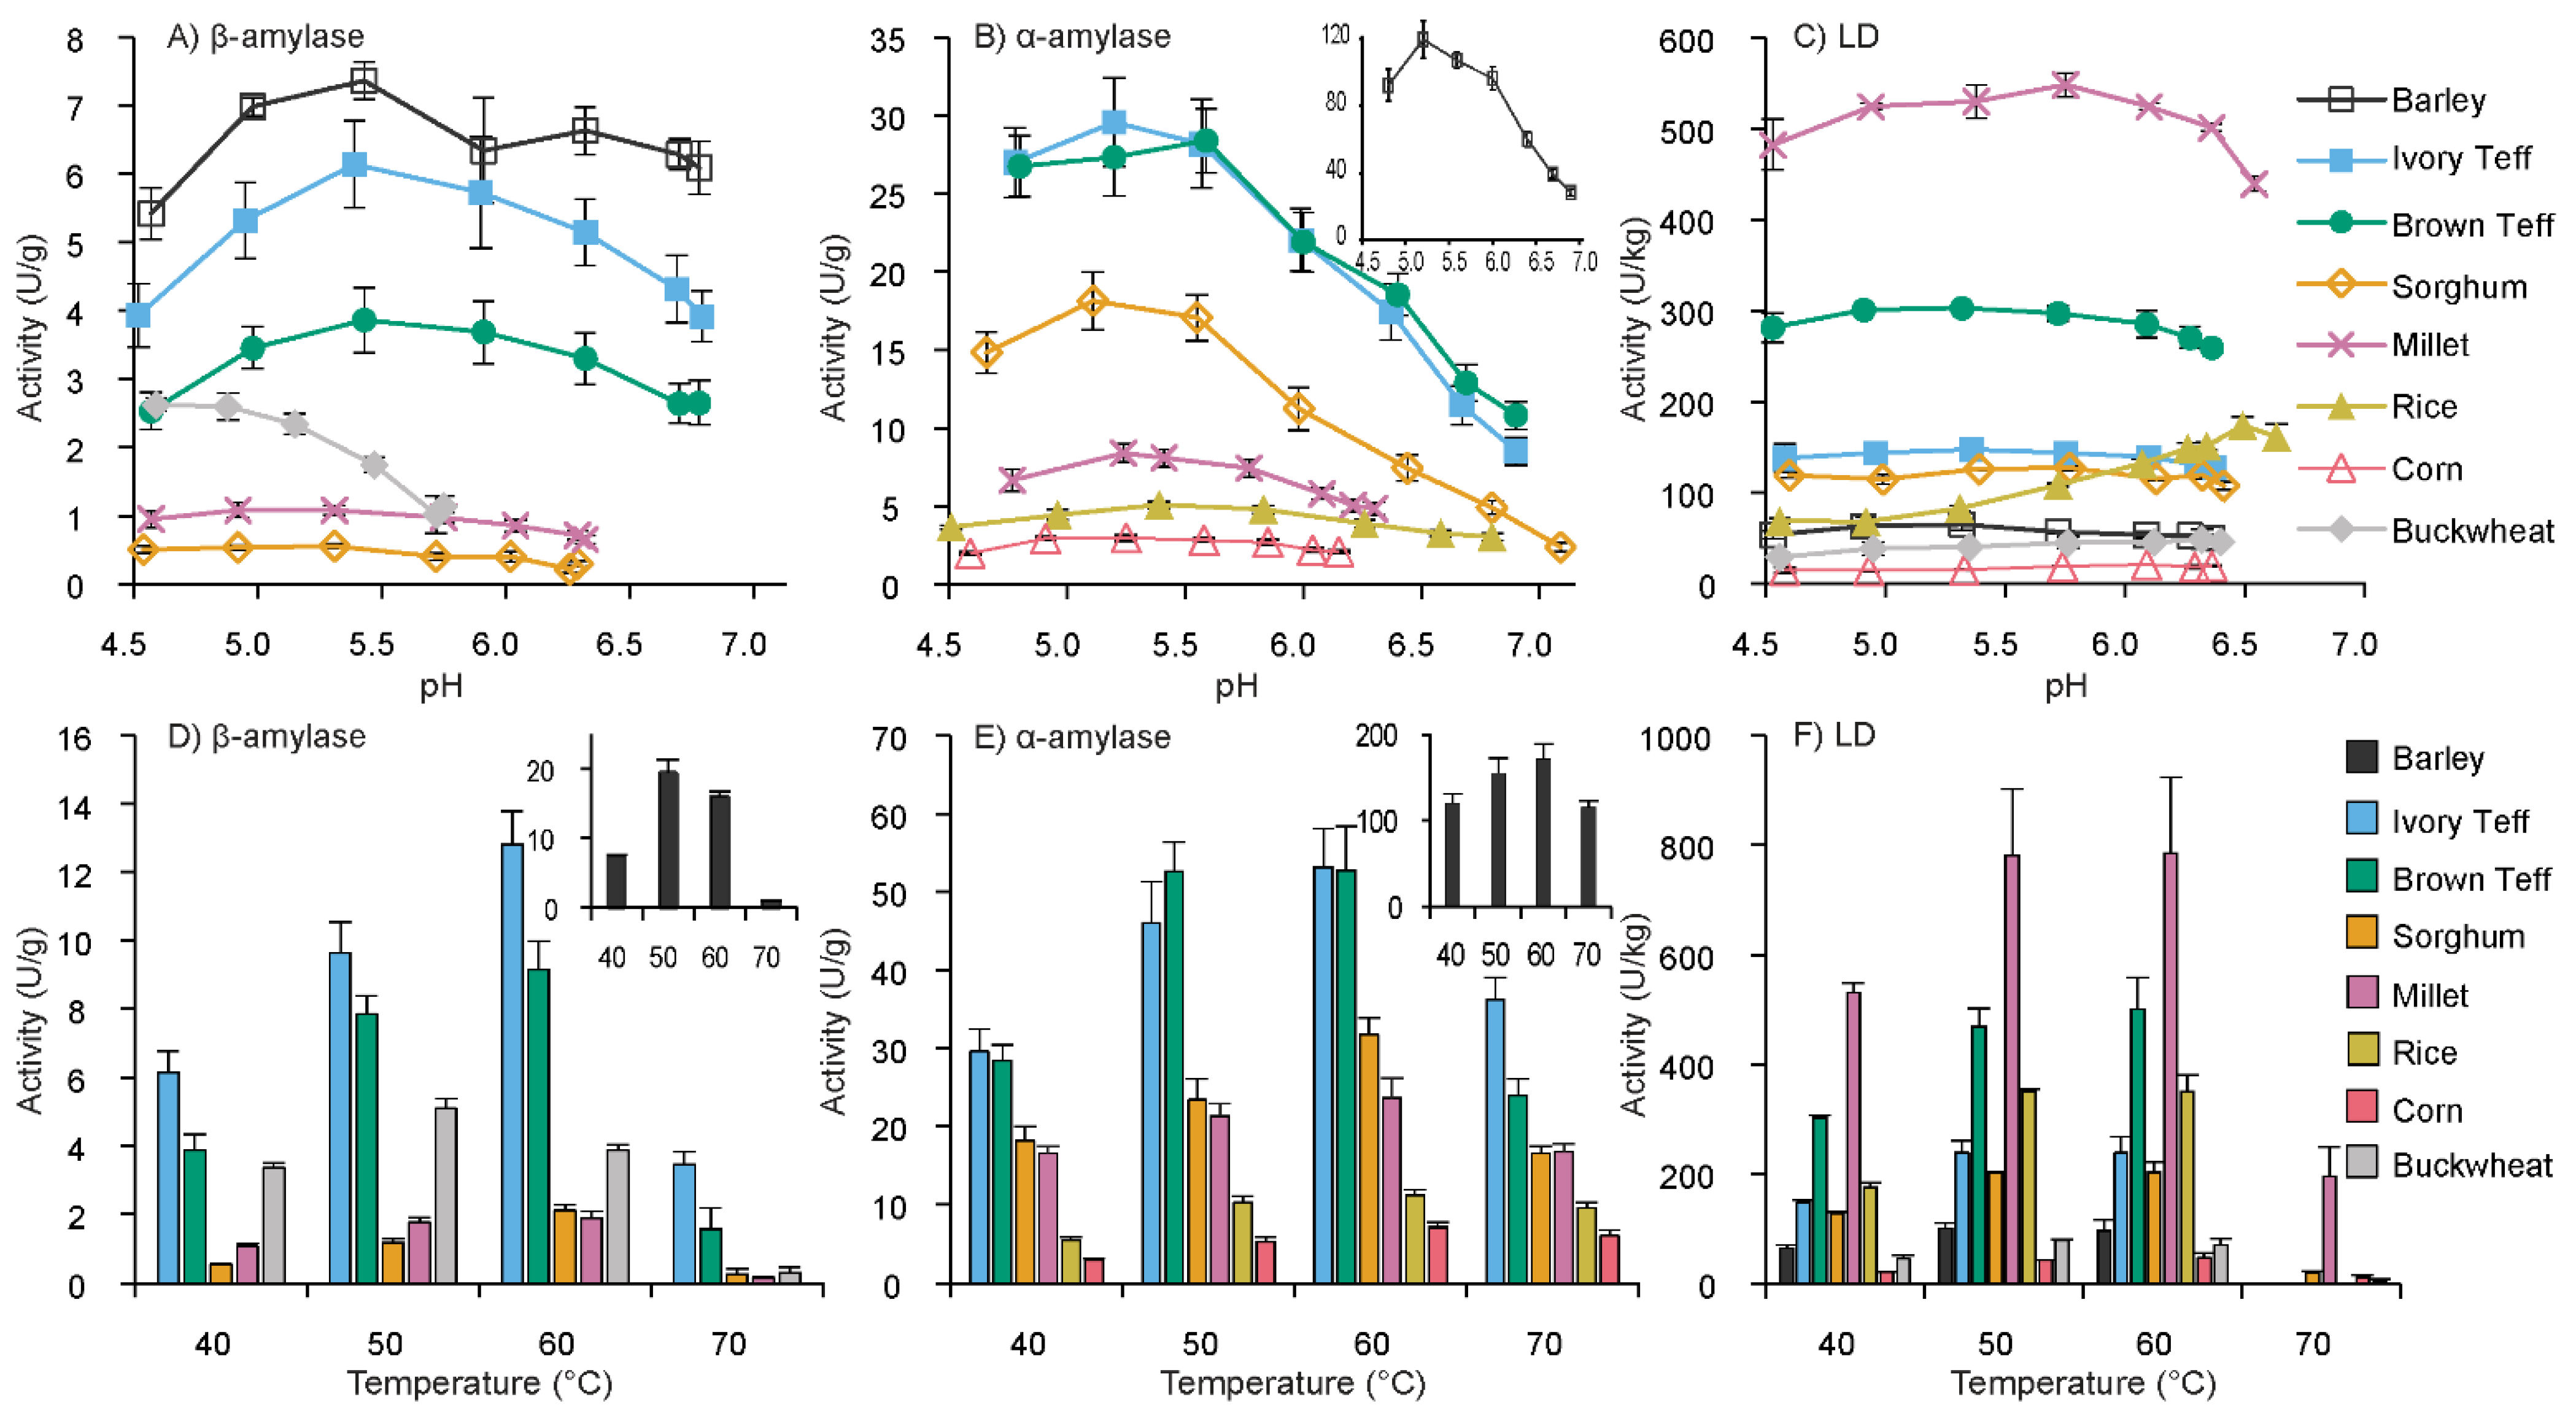
Figure 1. The effect of pH and temperature on the activities of β-amylase (A,D), α-amylase (B,E), and LD (C,F) in barley and GF malts as measured using the modified Betamyl-3, Ceralpha, and PullG6 methods described in Section 2.4. The insets in (B,D,E) are the observations of barley β-amylase and α-amylase as its high activity obscured the trends of the lower activity GF malts when plotted together. Data represent the means (n = 3) ± standard deviations, and some error bars are within the data points.
Beverages 07 00053 g001
Figure 2. The measured thermostability of the mashing enzymes, expressed as the amount of activity measured after incubation at 0, 10, 20, 40, and 60 min at 50, 60, and 70 °C. Time 0 min is designated after a 2 min come-up time to equilibrate the extracts to the selected incubation temperature. At 70 °C, in particular, this 2 min equilibration led to significant loss of activity across most enzymes. β-amylase (A,D,G) α-amylase (B,E,H), and LD (C,F,I) activities were determined using the method described in Section 2.8. Insets in E and H are barley α-amylase plotted individually to better show the deactivation of the GF malts’ α-amylase, and the thermostability of rice and corn α-amylase. The inset in F is the inactivation curve of millet LD at 60 °C in order to better show the denaturation of LD in the remaining malts. Data represent the means (n = 3) ± standard deviation, and some error bars are within data points.
Beverages 07 00053 g002
Figure 3. PCA biplot showing the sugar analysis results of the mashing experiments for each treatment for the first two dimensions. Individual mashes are labelled as Malt_Mashing Treatment. The variables as indicated by the vectors are the concentrations of the individual sugars measured, the sum of the fermentable sugars, with % glucose and % maltose corresponding to the percentage of glucose or maltose in the total fermentable sugar output of each wort. The mashing treatments outlined in Table 1 are: inactivated enzymes (IE), infusion mash (IM) pH-adjusted infusion mash (pH-IM), extended time infusion mash (XT), and the ExGM decoction (ExGM).
Beverages 07 00053 g003
Figure 4. The effect of mashing treatment on the generation of glucose, fructose, sucrose, maltose, maltotriose, and maltotetraose in GF malts as compared to barley mashed using the IM procedure. One-way ANOVA on total fermentable sugars with Dunnett’s post-toc test (α = 0.05) was used to determine significant differences in total fermentable sugars from the barley control. The mashing treatments outlined in Table 1 are: inactivated enzymes (IE), infusion mash (IM) pH-adjusted infusion mash (pH-IM), extended time infusion mash (XT), and the ExGM decoction (ExGM). The ExGM decoction maintains enzyme activity via mashing at a low temperature, but separates the enzyme from the starch allowing for gelatinization without enzyme denaturation. Samples labelled with letters differing from the barley control are significantly different. Data represent the means (n = 2) ± standard deviations, and some error bars overlap or are within series borders.
Beverages 07 00053 g004
Table 1. Summary of the mashing treatments performed and the processing steps therein. Combined cells show the recipe and processing parameters that were held constant across all grains and treatments. Mashes were produced and analyzed in duplicate. A version of this table with more detailed step-by-step instructions can be found in Table S3.
Treatments
Inactivated Enzymes
(IE)
Infusion Mash (IM)pH-Adjusted Infusion Mash (pH-IM)Extended Time Infusion Mash (XT)ExGM Decoction
(ExGM)
Liquor-to-Grist Ratio (3:1)15 mL Mashing Water: 5 g Malt Flour
Total Volume 30 mL
Mashing Schedule
Strike Temperature (°C)8080807070
Initial Mashing Temp (°C)6565655555
pH Adjustment to ~5.3NoNoYesYesYes
Stage 1Bring to
99 °C for
1.5 min
1 h
65 °C
1 h
65 °C
2 h 45 min
55 °C
(enzyme extraction) 30 min
55 °C
Stage 2Cool to
65 °C
---Separate enzyme extract from grain
Gelatinize and cool grain
Recombine extract with gelatinized grain
Stage 31 h
65 °C
---2 h
55 °C
End MashBring to 80 °C, centrifuge, and decant 1st wort into sterile 50 mL conical tube
SpargeSparge remaining water in two batches
Hold Sparge water and wort fractions >70 °C
Centrifuge each batch sparge and combine 2nd and 3rd fractions with the 1st wort
BoilBring collected wort to 100 °C for 1.5 min
Table 2. Reported gelatinization temperatures for barley and gluten-free malts.
MaltReported Gelatinization Temperature (°C)
Barley56–62 [25]
Teff66–78 [3]
Millet64–72 [17]
Sorghum71–80 [4]
Rice61–72 [3]
Corn64–75 [3]
Buckwheat67–74 [32]
Table 3. Summary of specific gravity measurements and wort sugars in the ivory teff, brown teff, sorghum, millet, and GFB1 ExGM samples compared to barley.
SampleSpecific Gravity @20 °C Glucose
(g/L)
Fructose
(g/L)
Sucrose
(g/L)
Maltose
(g/L)
Maltotriose
(g/L)
Maltotetraose
(g/L)
Barley1.046 ± 0.0019.18 ± 0.78
c
1.12 ± 0.14
d
4.42 ± 0.08
a
51.08 ± 0.41
a
13.93 ± 0.62
b, c
2.18 ± 0.68
a
Ivory Teff1.052 ± 0.00123.13 ± 3.77
a
5.48 ± 0.03
b
n.d.
d
49.11 ± 5.08
a, b
14.40 ± 1.55
b, c
n.d.
b
Brown Teff1.049 ± 0.00122.53 ± 3.07
a, b
6.61 ± 0.23
a
n.d.
d
46.65 ± 2.15
a, b
13.59 ± 0.73
b, c
n.d.
b
Sorghum1.048 ± 0.00114.09 ± 0.23
b, c
1.71 ± 0.32
c, d
n.d.
d
53.97 ± 0.57
a
18.03 ± 0.32
a
1.93 ± 0.14
a
Millet1.041 ± 0.00018.54 ± 2.21
a, b
2.38 ± 0.12
c
2.35 ± 0.05
b
54.72 ± 0.52
a
16.47 ± 0.21
a, b
n.d.
b
GFB11.043 ± 0.00121.70 ± 0.64
a, b
1.87 ± 0.25
c, d
1.86 ± 0.00
c
41.74 ± 1.08
b
12.31 ± 0.26
c
n.d.
b
Significant differences for each sugar between samples were assessed using a one-way ANOVA with Tukey’s HSD post hoc test (α < 0.05). Data represent the means (n = 2) ± standard deviations. Cells within each sugar column that do not contain the same letter are significantly different. Cells labelled n.d. indicates that sugar was not detected.
Publisher’s Note: MDPI stays neutral with regard to jurisdictional claims in published maps and institutional affiliations.