Article

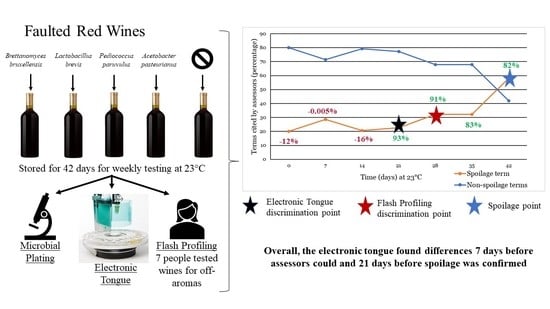
Detection of Red Wine Faults over Time with Flash Profiling and the Electronic Tongue

1
School of Food Science, Washington State University, Pullman, WA 99164, USA
2
School of Food and Advanced Technology, Massey University, Auckland 0745, New Zealand
*
Author to whom correspondence should be addressed.
Beverages 2021, 7(3), 52; https://doi.org/10.3390/beverages7030052
Submission received: 30 April 2021 / Revised: 16 July 2021 / Accepted: 19 July 2021 / Published: 21 July 2021
(This article belongs to the Special Issue Featured Papers in Wine, Spirits and Oenological Products Section)

Abstract

:
Wine faults, often caused by spoilage microorganisms, are considered negative sensory attributes, and may result in substantial economic losses. The objective of this study was to use the electronic tongue (e-tongue) and flash sensory profiling (FP) to evaluate changes in red wine over time due to the presence of different spoilage microorganisms. Merlot wine was inoculated with one of the following microorganisms: Brettanomyces bruxellensis, Lactobacillus brevis, Pediococcus parvulus, or Acetobacter pasteurianus. These wines were analyzed weekly until Day 42 using the e-tongue and FP, with microbial plate counts. Over time, both FP and e-tongue differentiated the wines. The e-tongue showed a low discrimination among microorganisms up to Day 14 of storage. However, at Day 21 and continuing to Day 42, the e-tongue discriminated among the samples with a discrimination index of 91. From the sensory FP data, assessors discriminated among the wines starting at Day 28. Non-spoilage terms were used to describe the wines at significantly higher frequency for all time points until Day 42, at which point the use of spoilage terms was significantly higher (p < 0.05). These results suggest that application of these novel techniques may be the key to detecting and limiting financial losses associated with wine faults.

Graphical Abstract

1. Introduction

Wine faults are any off flavors, taste, or mouthfeel attributes that occur during the winemaking process [1]. Significant financial losses can ensue when wine faults occur, due to the cost of storage and destruction [2]. Prominent sources of these wine faults are spoilage microorganisms, such as those within the genera Lactobacillus, Pediococcus, Acetobacter, and Brettanomyces. These spoilage microorganisms produce unique metabolites that can impart undesirable flavors or aromas [3]. In particular, Brettanomyces produces volatile phenols that can be described as smoky, sweaty, and barnyard [4,5,6,7]. Pediococcus produces β-D-glucan and acrolein that produce ropey, viscous, and oily mouthfeel attributes and can increase perceived bitterness [3,8,9]. Additionally, Lactobacillus produces lactic acid, diacetyl, and other secondary metabolites that can produce buttery and vinegar aromas [3,10,11,12]. Finally, Acetobacter can produce high amounts of acetic acid and ethyl acetate imparting a vinegar aroma on the final wine [3,13].
The influence that different metabolites have on the wine is dependent on the concentration and wine style [14]. At low concentrations, certain metabolites can impart complexity; however, at high concentrations certain metabolites negatively impact wine quality [15,16,17]. In particular, Brettanomyces’ metabolites, such as 4-ethylphenol and 4-ethylguaiacol, at concentrations less than 400 μg/L, increase complexity through an increase in spice, leather, and smoke aromatic notes, but at 620 μg/L, the elicited aromas cause the wine to be considered spoiled [15,16]. Therefore, early detection of metabolites from spoilage organisms is crucial to allow early remediation that may inhibit spoilage from further progressing.
Due to the high frequency of testing needed to detect a microbial infection, rapid testing methods are critical. Both rapid sensory and analytical methods are available, but limited research has been completed on their effectiveness in detecting and differentiating wine faults caused by spoilage microorganisms. Rapid sensory methods have increased in popularity due to the speed of data collection and analysis, as well as cost effectiveness [18]. One rapid sensory method is Flash Profiling (FP), originally introduced by Sieffermann [19] as a proposed variant to Free Choice Profiling [20]. Assessors are asked to determine sensory attributes that best differentiate all the samples and then rank the samples for each of the attributes they selected [21,22]. The utilization of FP has been used in a variety of products including wines [18,23], and hot served food products [24]. While specific research on wine faults has not been completed, the previous applications of the FP method indicate it may be an effective option for wine fault detection.
In addition to rapid sensory methods, analytical methods for fast differentiation among samples are available. Specifically, the electronic tongue (e-tongue) has been used as a rapid testing method for a wide variety of food products such as wines [25,26,27,28,29], dairy products [30,31,32], sweeteners [33,34], and spicy products [35,36]. The potentiometric e-tongue evaluates non-volatile compounds and similar to the human tongue can provide a “taste fingerprint” based on the sensory profile of the wine [29,35].
The Alpha MOS® e-tongue utilizes seven cross-selective polycarbonate coated sensors that select for different ions or compounds that are associated with the five basic tastes, as well as spicy and metallic [37]. A previous study determined that the e-tongue was able to differentiate among different wines spiked with varying levels of 4-EC, a Brettanomyces metabolite, at concentrations lower than the sensory threshold [29]. Similarly, the e-tongue has successfully been used to determine defects related to acetic acid concentrations in Apulian red wine [38]. These results indicate that the e-tongue may be a valuable tool in differentiating among wine faults and early detection of potential infections.
The objective of this study was to use the e-tongue and FP to evaluate changes in wine over time due to the presence of different spoilage microorganisms. Five common spoilage microorganisms were selected to determine if the e-tongue was able to differentiate among different spoilage microorganisms. Analysis on the inoculated red wine was completed weekly to determine the time point at which the e-tongue and the assessors could differentiate among the wine faults. Based on previous research, it was hypothesized that the e-tongue would differentiate among the inoculated wine samples before the human assessors would be able to. Overall, the data obtained in this study will help determine if the e-tongue can be a useful tool in the early detection of sensory changes elicited by spoilage microorganisms.

2. Materials and Methods

2.1. Materials

Yeast peptone dextrose and yeast/mold broth were obtained from Becton, Dickinson, and Company (Sparks, MD, USA). Agar was purchased from Acros Organics (Morris, NJ, USA). Fructose, glucose, ethanol, and hydrogen peroxide were purchased from Fisher Scientific, (Waltham, MA, USA). Sodium chloride, hydrochloric acid, and sodium-L-glutamate solutions were acquired from Alpha Mos (Tolouse, France) for e-tongue conditioning, calibration, and diagnostic procedures.

2.2. Yeast Strains and Starter Cultures

Brettanomyces bruxellensis strains I1A and F3 were acquired from the Washington State University culture collection and grown on yeast peptone dextrose (YPD) agar incubated at 28 °C [39]. Starter cultures were prepared by transferring a single colony from YPD agar to 50 mL of yeast and mold (YM) broth. Following incubation for 4 days at 28 °C, 1 mL of culture was transferred to 50 mL of YM broth containing 5% (v/v) ethanol. After 4 days of incubation under the same conditions, 1 mL of culture was transferred to YM broth containing 10% (v/v) ethanol. Cells were harvested in late exponential growth phase by centrifuging samples at 2000× g for 15 min, washing twice with 0.2 M Na2HPO4 (pH 7.0) buffer, and then resuspending in the same buffer prior to inoculation.

2.3. Bacterial Strains and Starter Cultures

Acetobacter pasteurianus ATCC 12873, Lactobacillus plantarum WS-16, and Pediococcus parvulus WS-29A were acquired from the Washington State University culture collection and grown on modified apple juice Rogosa (MR) agar [4] incubated at 28 °C. Starter cultures were prepared by transferring a single colony from MR agar to 50 mL of MR broth. Following incubation for 7 days at 28 °C, 1 mL of culture was transferred to 50 mL of MR broth containing 5% (v/v) ethanol. After 7 days of incubation under the same conditions, 1 mL of culture was transferred to MR broth containing 10% (v/v) ethanol. Cells were harvested in late exponential growth phase by centrifuging samples at 2000× g for 15 min, washing twice with 0.2 M Na2HPO4 (pH 7.0) buffer, and then resuspending in the same buffer prior to inoculation.

2.4. Wines

Merlot wine (Yakima Valley, WA, USA) from the 2018 vintage was obtained and free SO2 was removed using hydrogen peroxide. Sugars (1 g/L glucose, 1 g/L fructose) were added before the wine was sterile-filtered through 0.45 μm polyvinylidene fluoride cartridges (Millipore Sigma, Bellerica, MA, USA) housed in stainless-steel filter housings (Pall, Port Washington, NY, USA) into sterile 750 mL screw-capped bottles. 740 mL of wine was added to each bottle. Microorganisms were inoculated at 1 × 10⁴ CFU/mL into the bottles (n = 14 bottles per microorganism). Bottles were closed with screw caps, with the exception of bottles containing A. pasteurianus and an uninoculated control, which were sealed and halfway unscrewed to allow air flow. The air flow was important due to the growth requirements of A. pasteurianus [13]. Additionally, the inclusion of oxygen may increase oxidation, therefore a control with the same condition was included. Wines were stored at 23 °C for 42 days, with replicate bottles of each treatment (n = 5), in duplicate, and the controls (n = 2) removed for weekly analysis (Table 1).

2.5. Spoilage Microorganism Culturability

Prior to weekly sensory analysis, microorganism culturability was monitored by spiral plating (Autoplate 4000, Spiral Biotech, Bethesda, MD, USA) onto Wallenstein Laboratory agar (WL, Becton, Dickinson, and Company, Franklin Lakes, NJ, USA) for B. bruxellensis or MR for bacteria. When culturability declined, 1 mL of wine was spread plated onto media to detect low populations. All plates were incubated at 28 °C for 7 days prior to counting.

2.6. Flash Profiling

The sensory panel consisted of assessors (n = 7, 4 females and 3 males) age 22 to 45 with previous trained panel experience, not exclusive to alcoholic beverages. These assessors were recruited from the Washington State University community through electronic announcements. The use of human subjects for this study was approved by the Washington State University Institutional Review Board (IRB # 17595-001) and informed consent was obtained from all assessors prior to participation. All samples (n = 12) were evaluated in each session under white light in partitioned booths in the Washington State University Sensory Evaluation Facility in Pullman, WA., USA. The wines samples (30 mL) were poured 1 h prior to evaluation and covered with a petri dish and presented in ISO glasses with letter codes at 23 °C [22]. During the initial evaluation at Day 0, assessors had a brief orientation session to familiarize the assessors with the concept of FP, outline the procedures, and complete a practice evaluation. Each assessor was presented with all of the wine samples (n = 12) simultaneously. They were asked to identify the aroma attributes that best described the differences among the samples, and rank the samples based on those identified attributes from lowest to highest intensity [22]. Ties were allowed between the samples. Assessors were instructed to avoid hedonic terms. To facilitate aroma term generation, the Brettanomyces and red wine aroma wheel were provided during all evaluation sessions, as well as a list of terms generated after the first session [40,41]. FP was completed weekly for 42 days, starting on Day 0 immediately after inoculation, for a total of seven evaluation sessions.
To determine the extent of spoilage in the inoculated wines, the terms generated by the FP were categorized into two categories, traditional spoilage or non-spoilage terms. Traditional spoilage terms were identified using the categories with negative connotations (dairy, fermentation, earthy, chemical/solvent, rotten and putrid, animal, savory, and veggie) from the Brettanomyces aroma wheel [41]. Additional terms, such as geranium and mousy, were included based on their association with Lactobacillus and Pediococcus infections [3,12]. The percentage of spoilage-related terms compared to the overall term usage was used to indicate when spoilage occurred in the inoculated wine.

2.7. Electronic Tongue

The wines were analyzed using a potentiometric e-tongue (Astree® II electronic tongue unit, Alpha MOS®, Toulouse, France) at each time point immediately after FP was completed. The e-tongue utilizes seven cross-selective taste sensors (salty, sweet, bitter, umami, spicy, metallic, and sour), a reference electrode (Ag/AgCl) and the AlphaSoft software (ver. 12, Alpha MOS®, Toulouse, France). Instrument preparations and sampling parameters were followed according to manufacturers’ procedures and as previously described [29,35]. For each e-tongue run, the analysis sequence contained randomly selected treatments. Each treatment consisted of a group of four 25 mL beakers, in addition to a reference wine sample (Carlo Rossi Burgundy). Samples were separated by MilliQ water for a 10 s sensor cleaning. The reference samples allowed the comparison among samples from different runs. At each time point, three runs were completed to analyze all the samples. Until e-tongue analysis could be completed, opened wine bottles were flushed with nitrogen and kept at 4 °C to limit additional microorganism growth, with all samples being analyzed within two days of FP being completed.

2.8. Statistical Analysis

The FP data were analyzed using Generalized Procrustes Analysis (GPA) to produce consensus configurations for the samples and sensory attributes. Agglomerative Hierarchical Cluster (AHC) analysis was completed on the FP data to determine if any clusters existed among the samples. The z-test for two proportions was conducted on the frequency of spoilage and non-spoilage related terms (p ≤ 0.05). Statistical analysis was competed with XLSTAT Sensory 19 (Addinsoft, New York, NY., USA). The electronic tongue data were analyzed using the Astree AlphaSoft software (ver. 12, Alpha MOS®, Toulouse, France) to calculate the discrimination index (DI); the software was also used to perform Principal Component Analysis (PCA) in order to visually determine differences among the samples. The discrimination index is a measurement of the overlap among the samples and the distance between the samples, giving an indication of how well the electronic tongue can differentiate among samples. Strong discrimination is indicated by a discrimination index above 80 [29]. The PCA biplots were plotted using R Base Graphics (ver. 4.0.3, R Core Team, Vienna, Austria) based on the loadings and scores from the PCA obtained from the AlphaSoft software.

3. Results

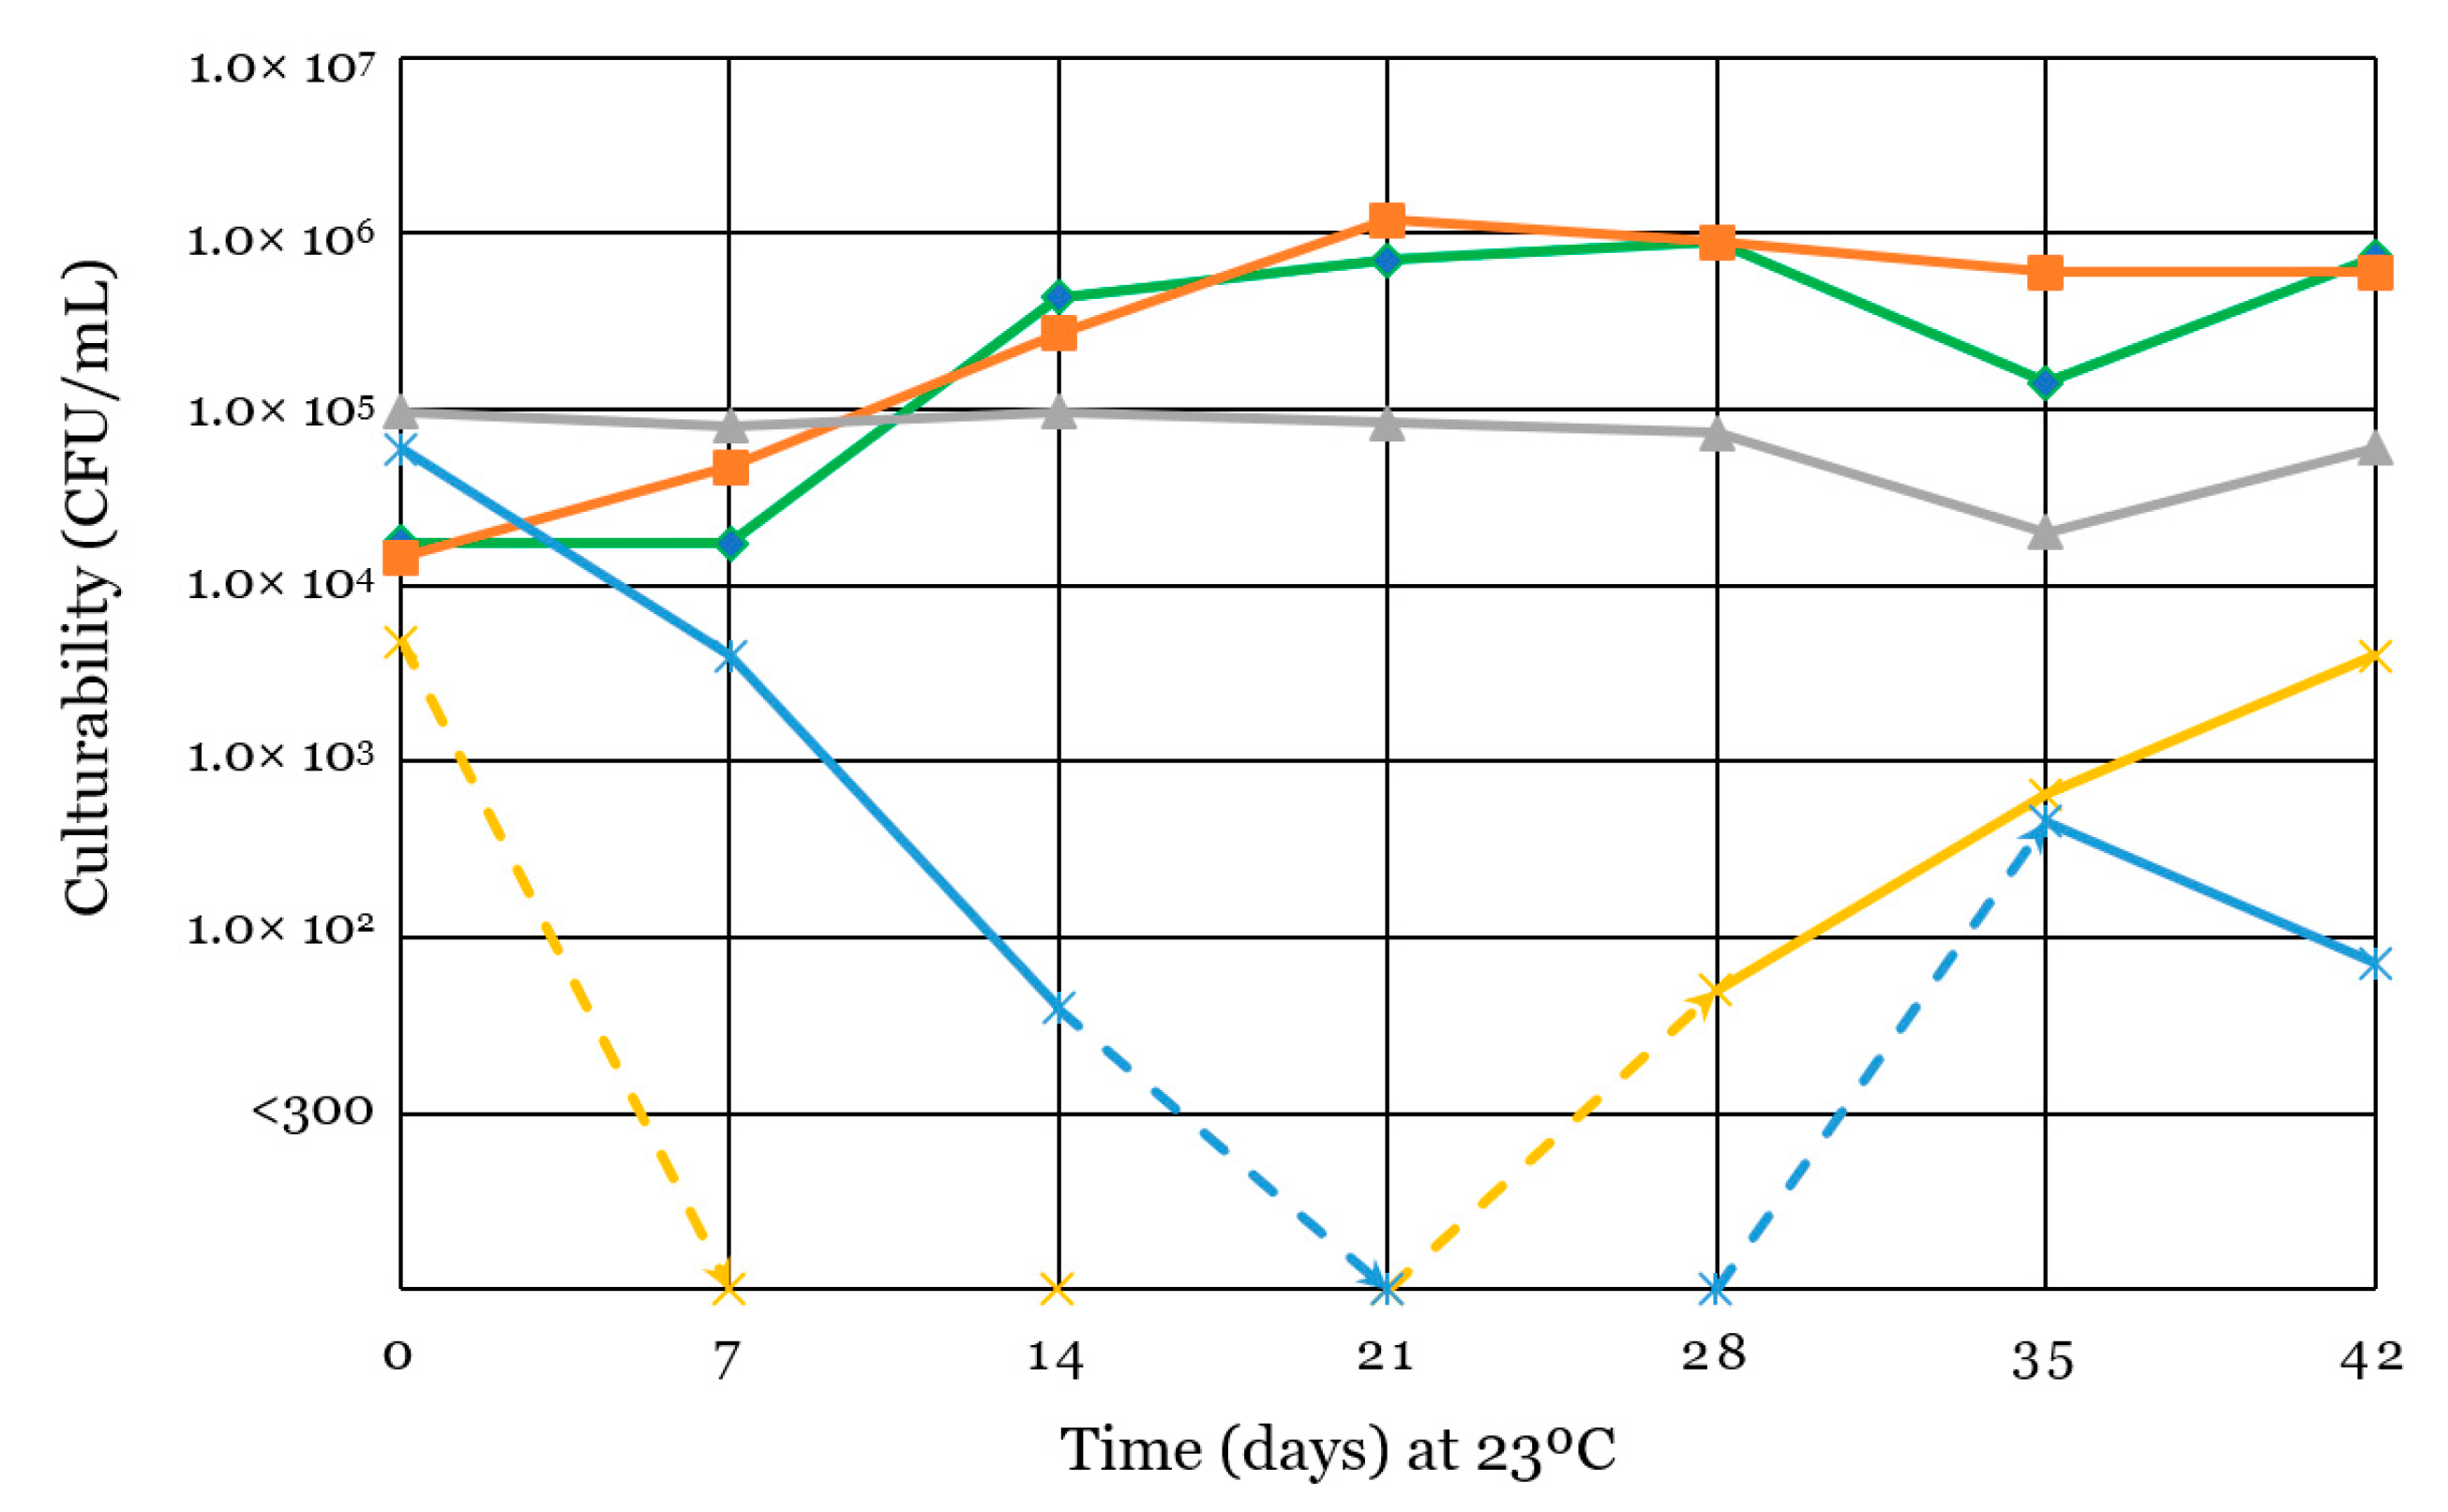
3.1. Culturability of Inoculated Microorganisms

After inoculation (~5 × 10⁵ CFU/mL) of Brettanomyces I1A, Brettanomyces F3, P. parvulus, A. pasteurianus, and L. brevis into the wine, populations of Brettanomyces I1A, Brettanomyces F3, and A. pasteurianus declined immediately by about 1 log (Figure 1). For both strains of Brettanomyces, the populations steadily increased for 21 days before reaching a relatively consistent population at roughly 1 × 10⁶ CFU/mL for the remaining storage time. Similar growth trends and CFU/ mL were observed in a previous study examining the influence of temperature and sulfur dioxide additions [42]. Previous studies have observed that as few as 104 CFU/mL of the Brettanomyces organism can cause medicinal, horsey, or barnyard-like aromas in red wine, indicating that the populations observed in this study would be sufficient to evoke sensory changes [43,44,45].
The remaining spoilage microorganisms displayed different growth trends compared to the Brettanomyces strains. P. parvulus maintained the initial inoculation levels for 21 days, before experiencing a slight decrease in CFU/ mL (Figure 1). The last two strains, A. pasteurianus and L. brevis, had similar growth trends. After inoculation, A. pasteurianus and L. brevis had a sharp decrease in population until reaching “too few to count” at Day 7 and 21, respectively. The decrease in population may be attributed to unfavorable environmental conditions. L. brevis prefers environments below 12.8% ethanol before growth is restricted and most red wine exceeds that concentration [46]. Similarly, A. pasteurianus prefers lower ethanol content wines and requires oxygen to fully grow [13]. To allow oxygen migration, the bottles were loosely sealed; however, this may not have allowed sufficient oxygen to encourage growth, as demonstrated by the sharp population decrease initially observed. After the sharp initial decrease, both A. pasteurianus and L. brevis increased in population after 14 to 7 days, respectively; however, the population never exceeded the initial inoculation population. Despite not exceeding the initial inoculation population, the microorganisms were still growing and producing metabolites that may have influenced the sensory characteristics of the wine [13].

3.2. Electronic Tongue

PCA was performed to determine the ability of the e-tongue to discriminate among the inoculated wine samples at each time point. At Day 14, the e-tongue had a DI of −16% when discriminating among the inoculated samples (Figure 2). The negative DI indicated overlap among some of the samples and therefore an inability to discriminate among the samples. In particular, L. brevis (Bottle 1 and 2), P. parvulus (Bottle 2), and the sealed control had substantial overlap. The PCA described 99.9% of the variation, with PC1 being associated with the response to the salty sensor and PC2 being associated with the bitter, metallic, and umami sensors. Similar results were observed for Day 0 and 7, with the e-tongue having various levels of negative DI.
Starting at Day 21, the e-tongue discriminated among the different inoculated wine samples with a strong discrimination index of 91 (Figure 3). Most of the variation among the samples was described by PC1 and was associated with the sweet sensor, describing 88.4% of the variation. Samples that were more similar to each other were placed closer to each other on the PCA, therefore the replicate bottles that were tested should be in similar areas on the PCA. Unexpectedly, the replicate bottles for the Brettanomyces samples were not closely related to each other on the PCA, displaying an almost contrasting relationship along PC1. This variation may have been caused by slightly varying amounts of available oxygen in the individual wine bottles, or by the natural variation found in Brettanomyces growth [13,45]. However, as the storage continued, the replicates were more closely related.
The ability to discriminate among the different inoculated wines after Day 21 of storage continued for the rest of the testing period, with discrimination indices exceeding 80%. These results indicate that at Day 21, the spoilage microorganisms produced sufficient metabolites to significantly affect the sensory characteristics of the wines. Previous studies have found that the e-tongue is able to detect subthreshold concentrations of varying chemicals, including 4-ethylcatechol in Merlot wines, and spicy compounds in water [29,31,35]. Therefore, the sensory changes in the inoculated wines at Day 21 are likely to be present at human threshold or subthreshold concentrations.
The ability to discriminate among samples based on by-products produced by common spoilage microorganisms using rapid analytical instruments was also found in other studies [29,38,47]. A previous study found that the electronic nose (e-nose), another rapid analytical instrument, detected differences in acetic acid perception caused by natural spoilage at a single timepoint [47]. A similar study used a combination of e-tongue and e-nose methods to evaluate wines exposed to the air at multiple timepoints, reporting that these methods could discriminate among samples from different timepoints [48]. However, in both of the previously mentioned studies, complementary sensory and microbial work were not undertaken.
Additionally, the difference from the control to the individual wine spoilage microorganisms was also evaluated. When compared to the control wine at Day 14, the e-tongue results for P. parvulus and L. brevis showed low DI, with overlapping occurring with the control. The discrimination index for A. pasteurianus was also negative, indicating an inability to discriminate among the samples, but the overlap was observed among the replicates instead of with the control. However, the e-tongue discriminated among the Brettanomyces strains. After Day 21, the e-tongue differentiated among the spoilage microorganisms and the control across all the microorganisms tested. As previously discussed, the variation between replicates may be caused by environmental factors, as well as by the natural growth variation between bottles [13,45].

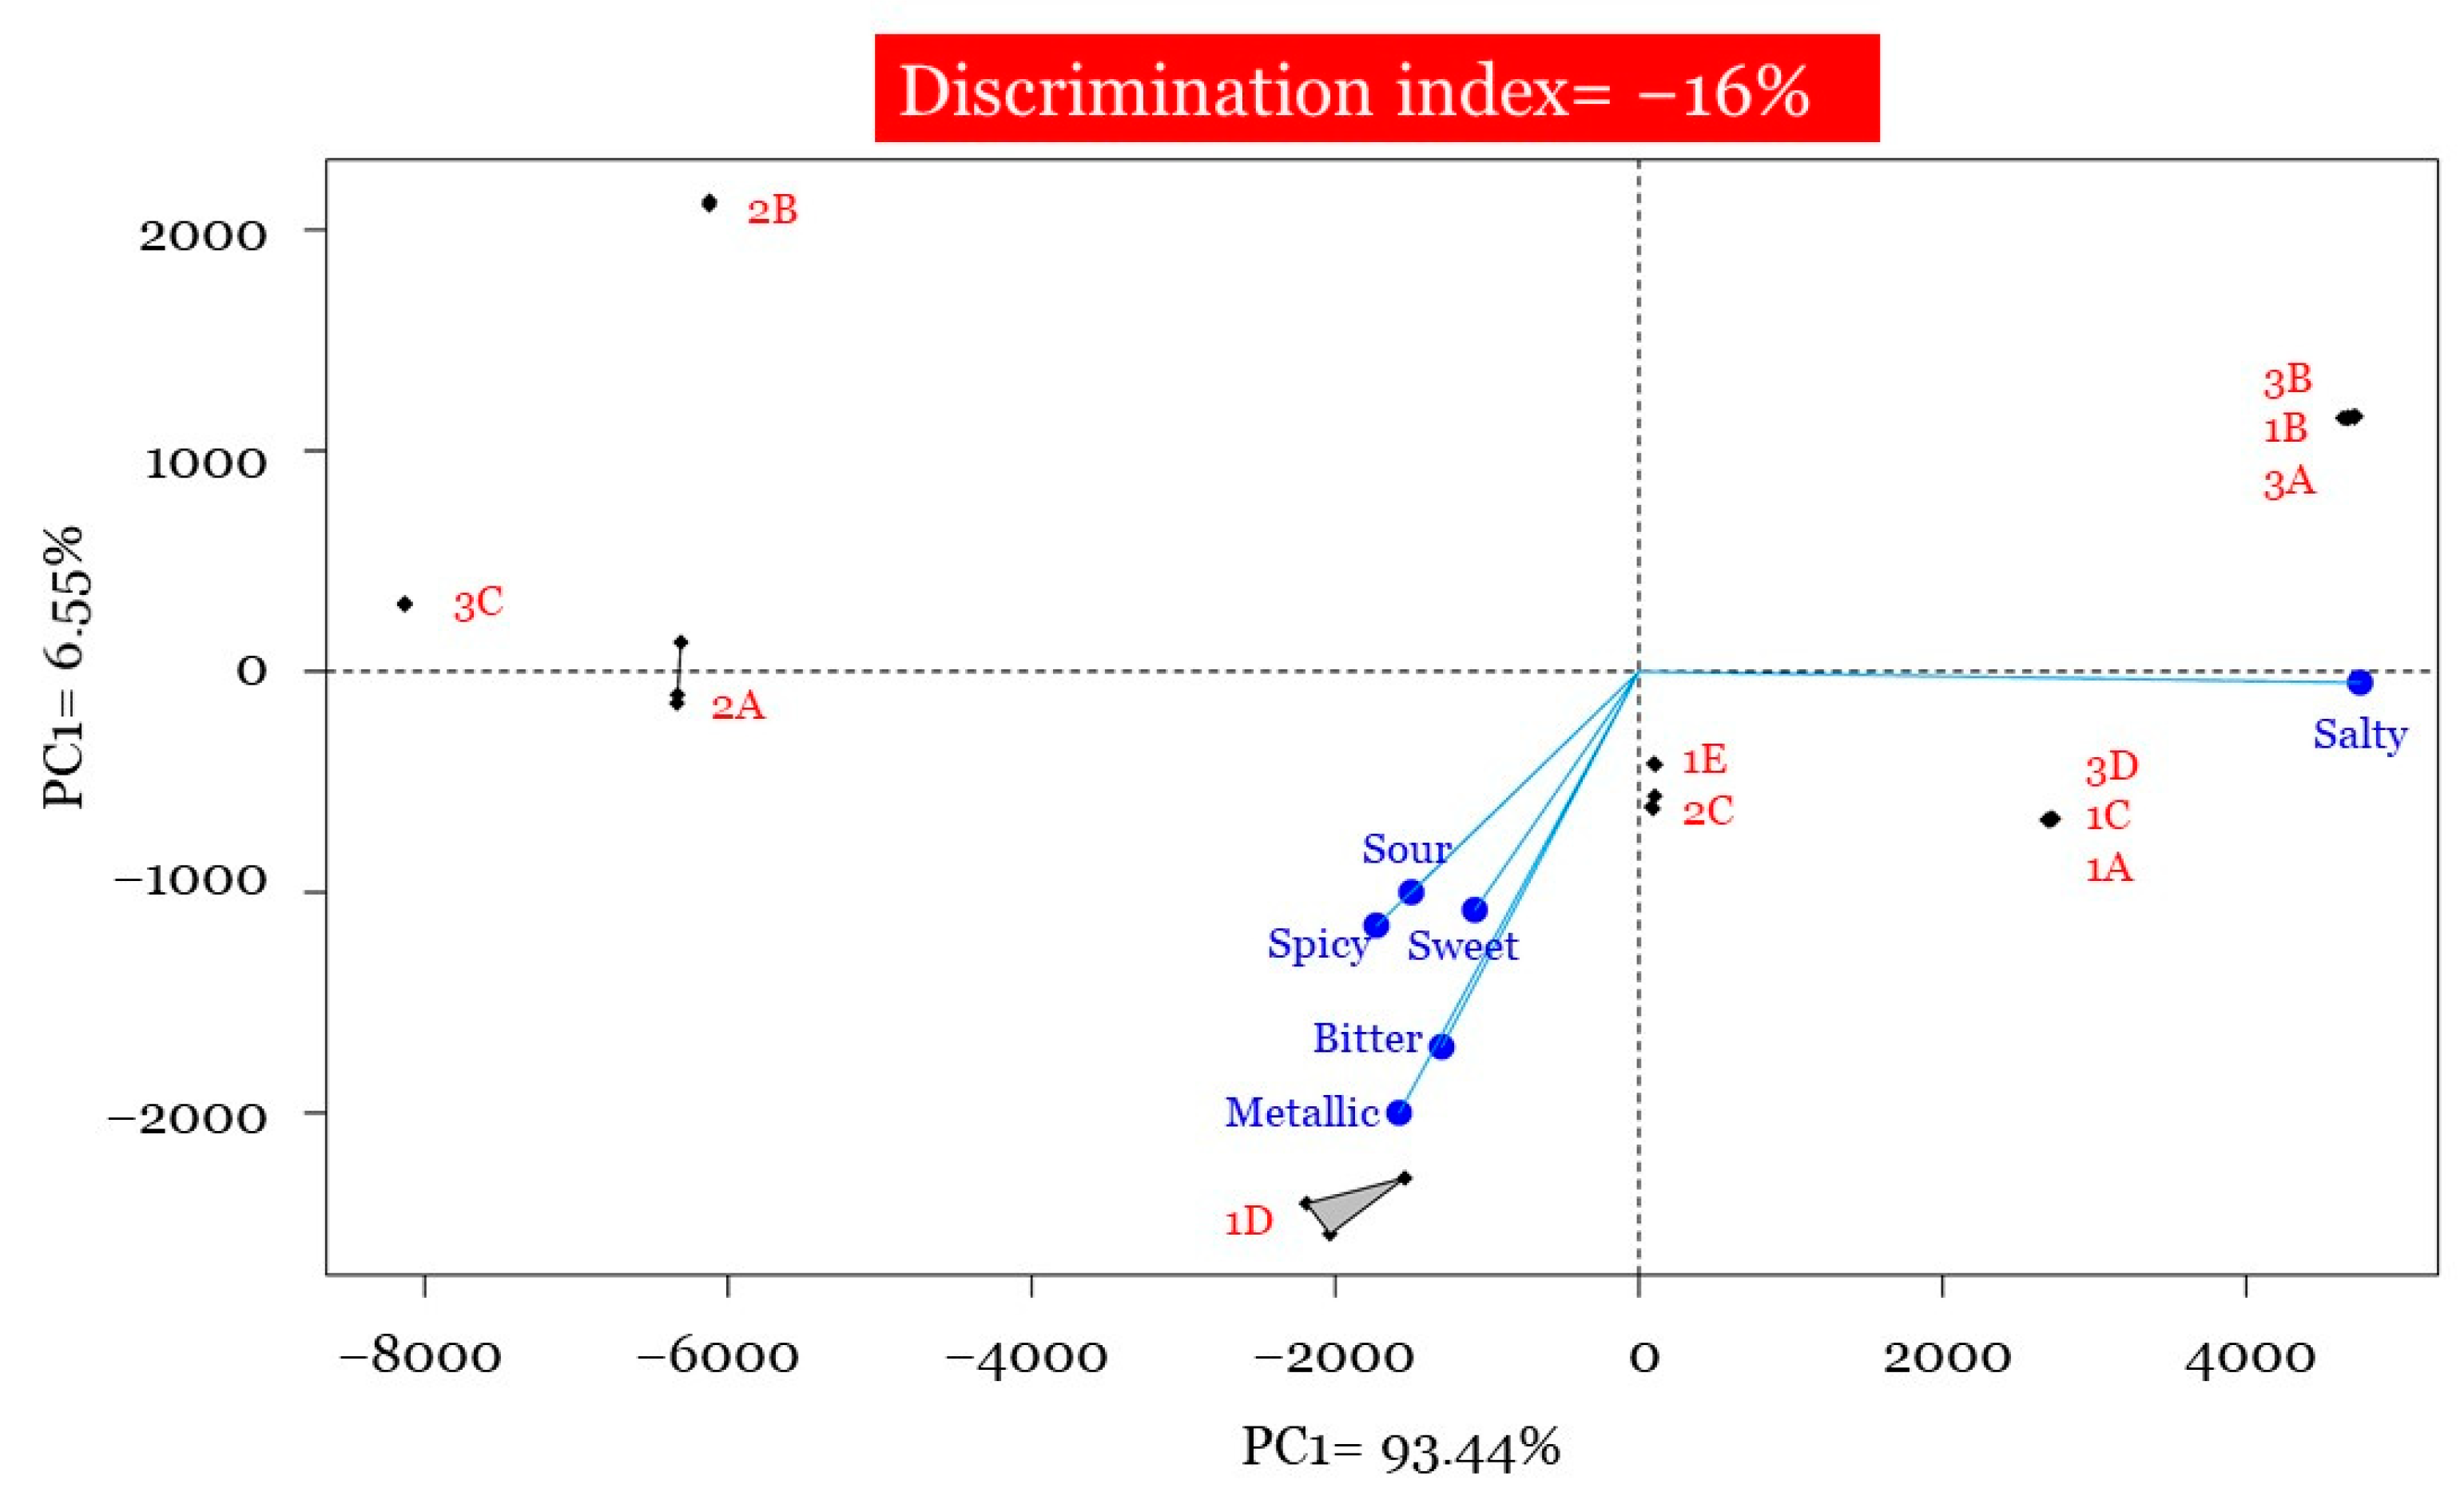
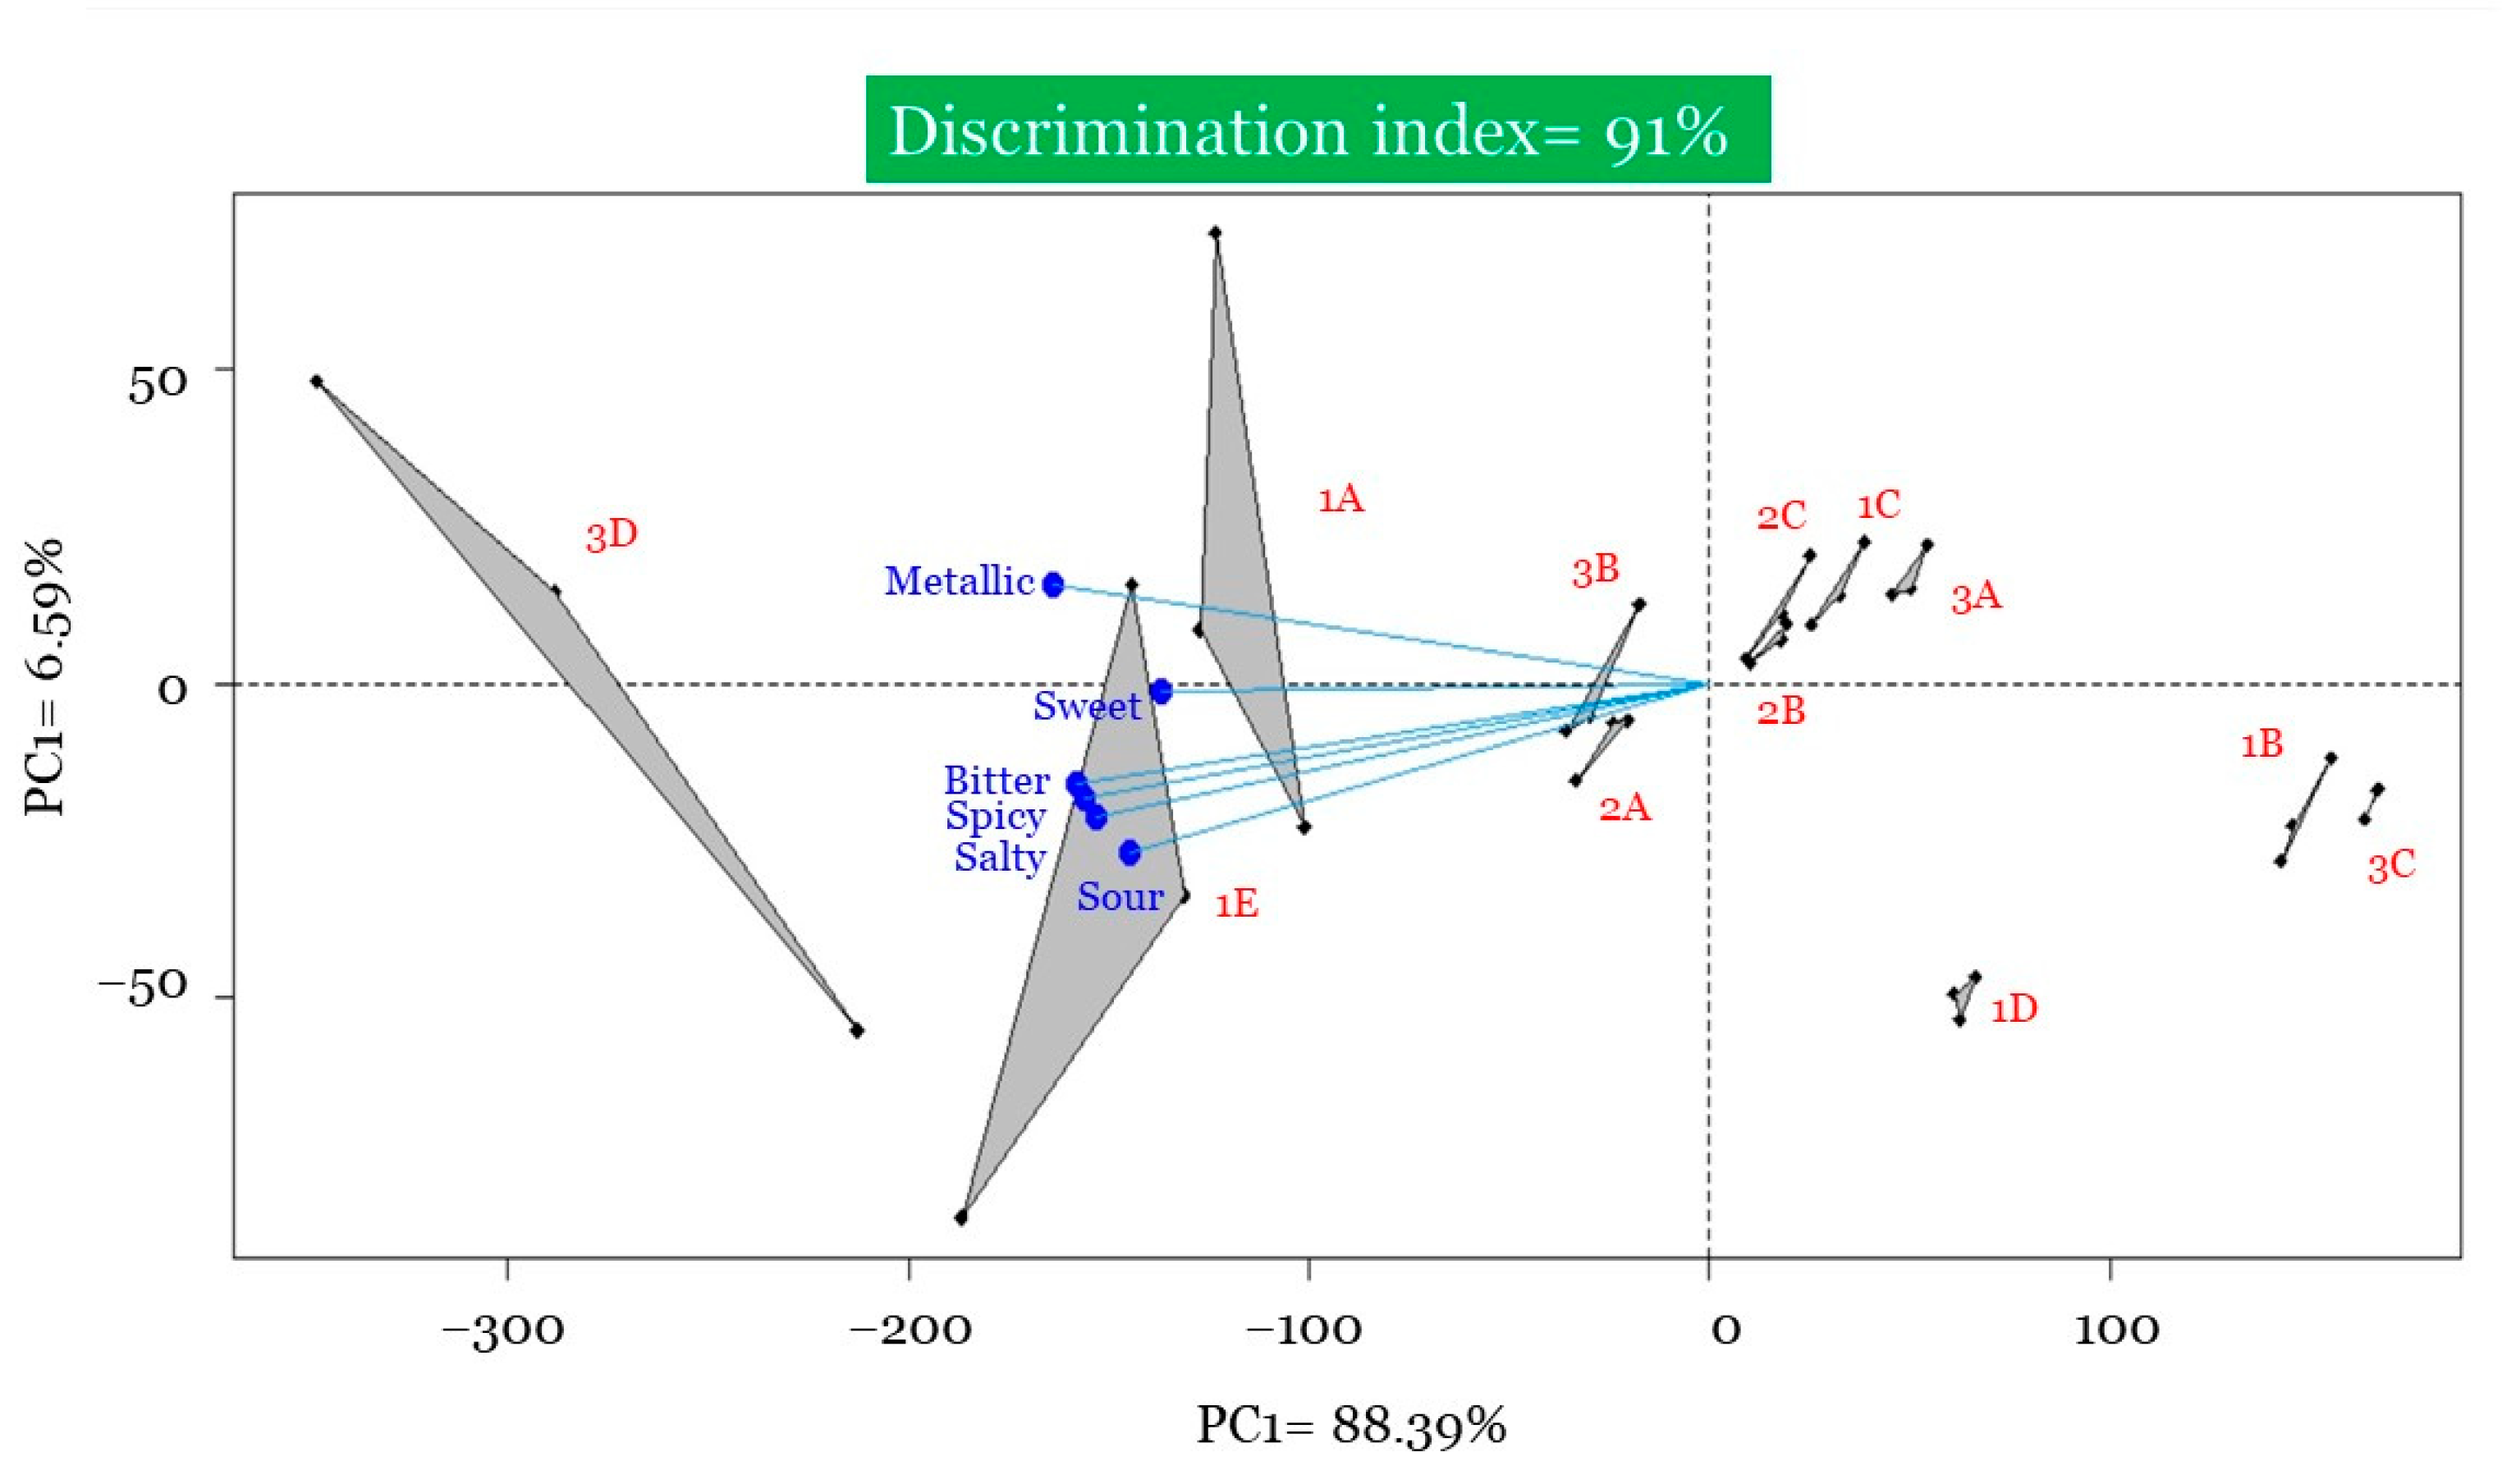
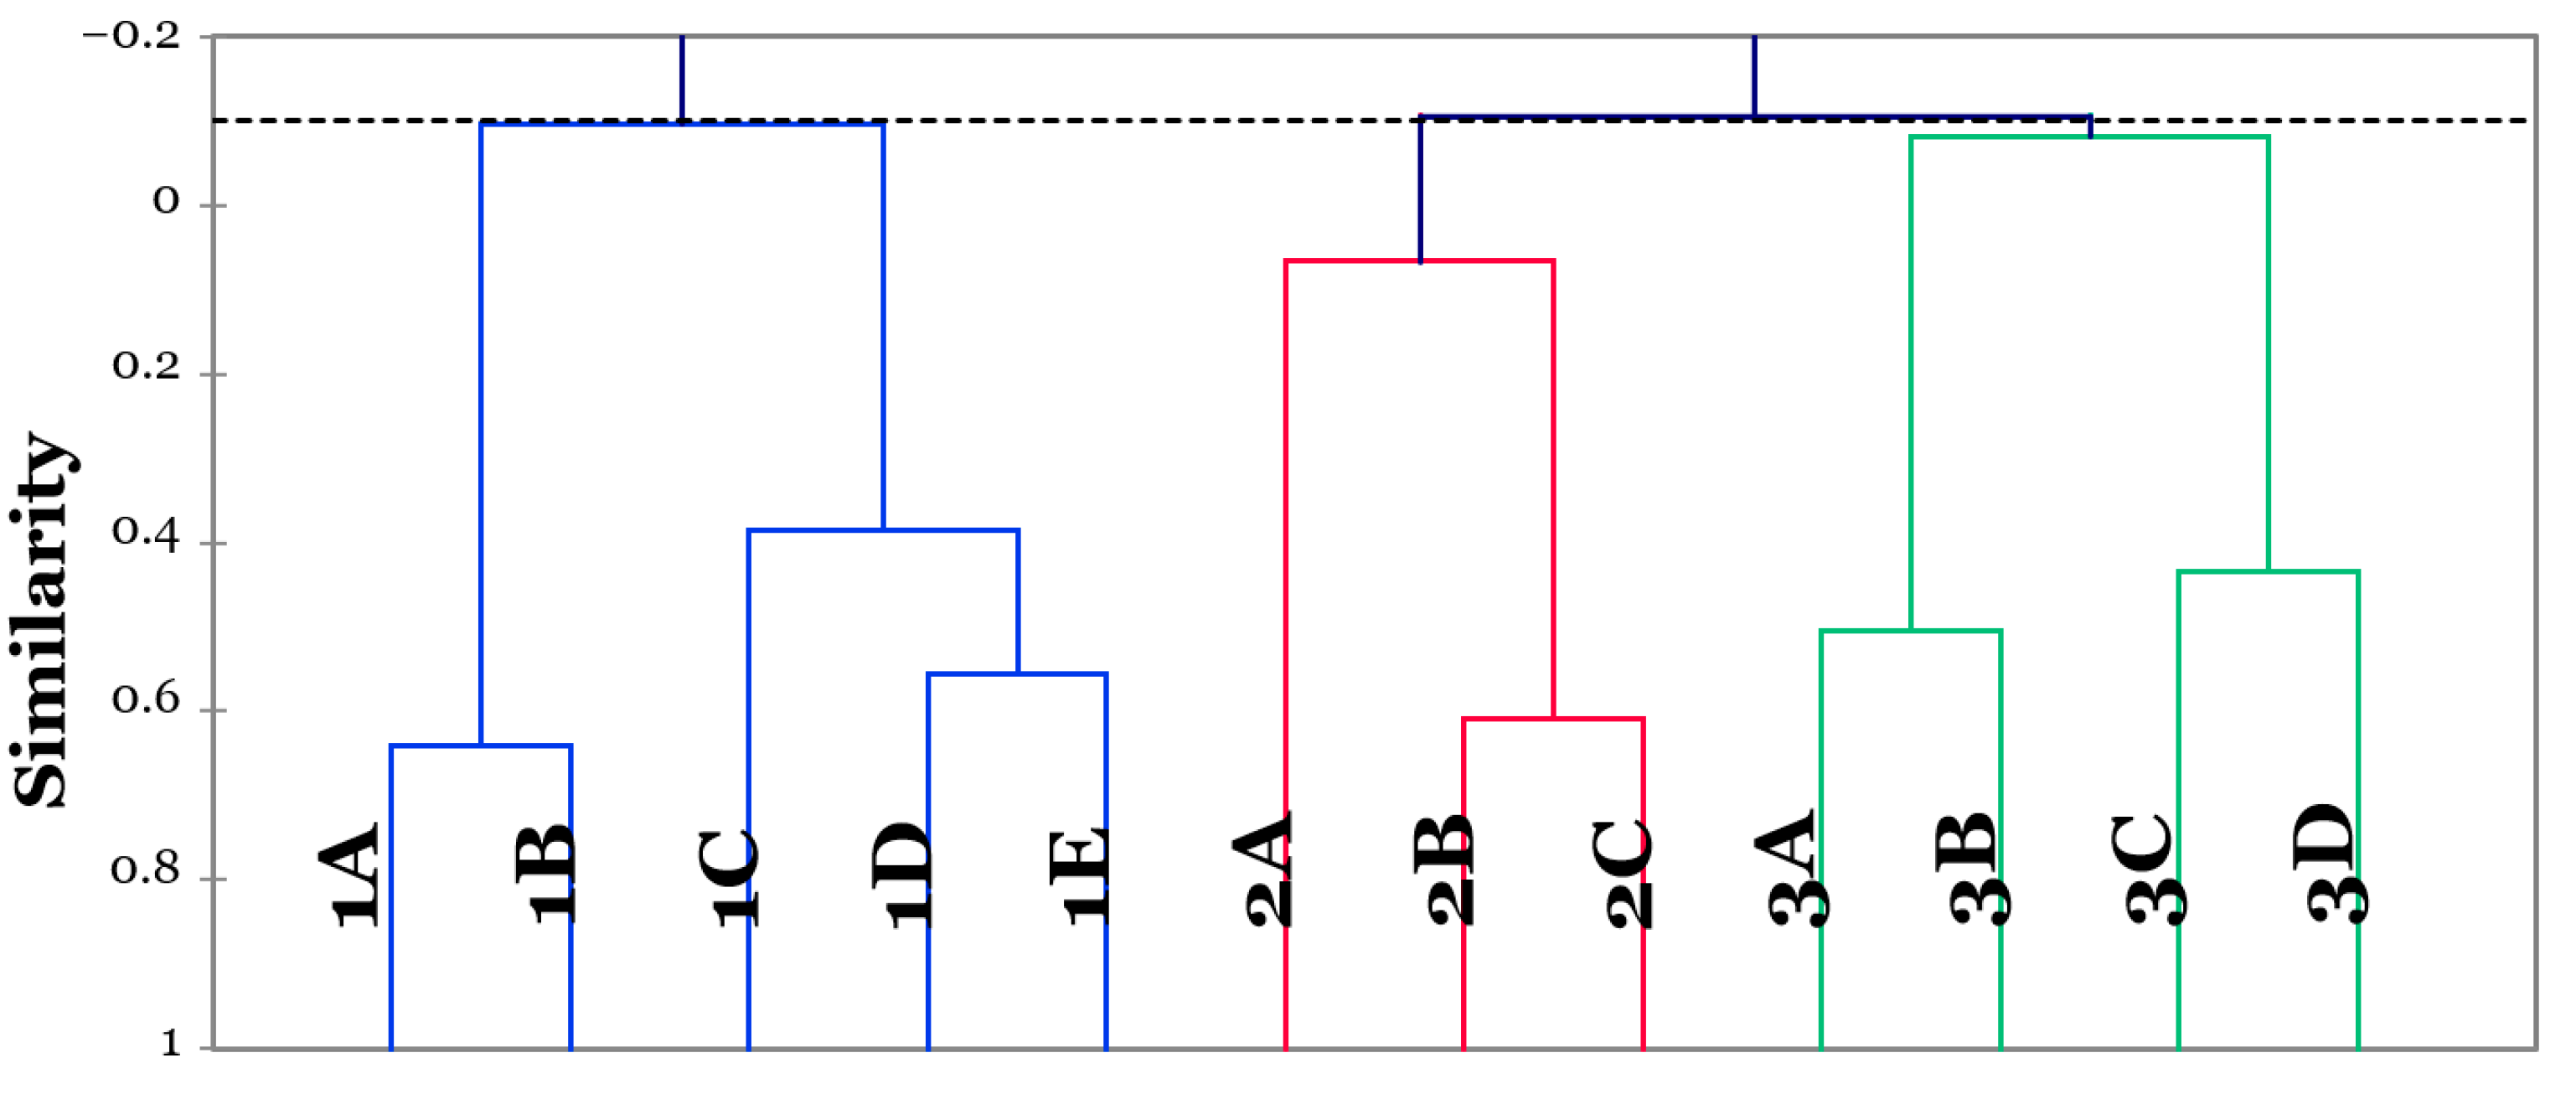
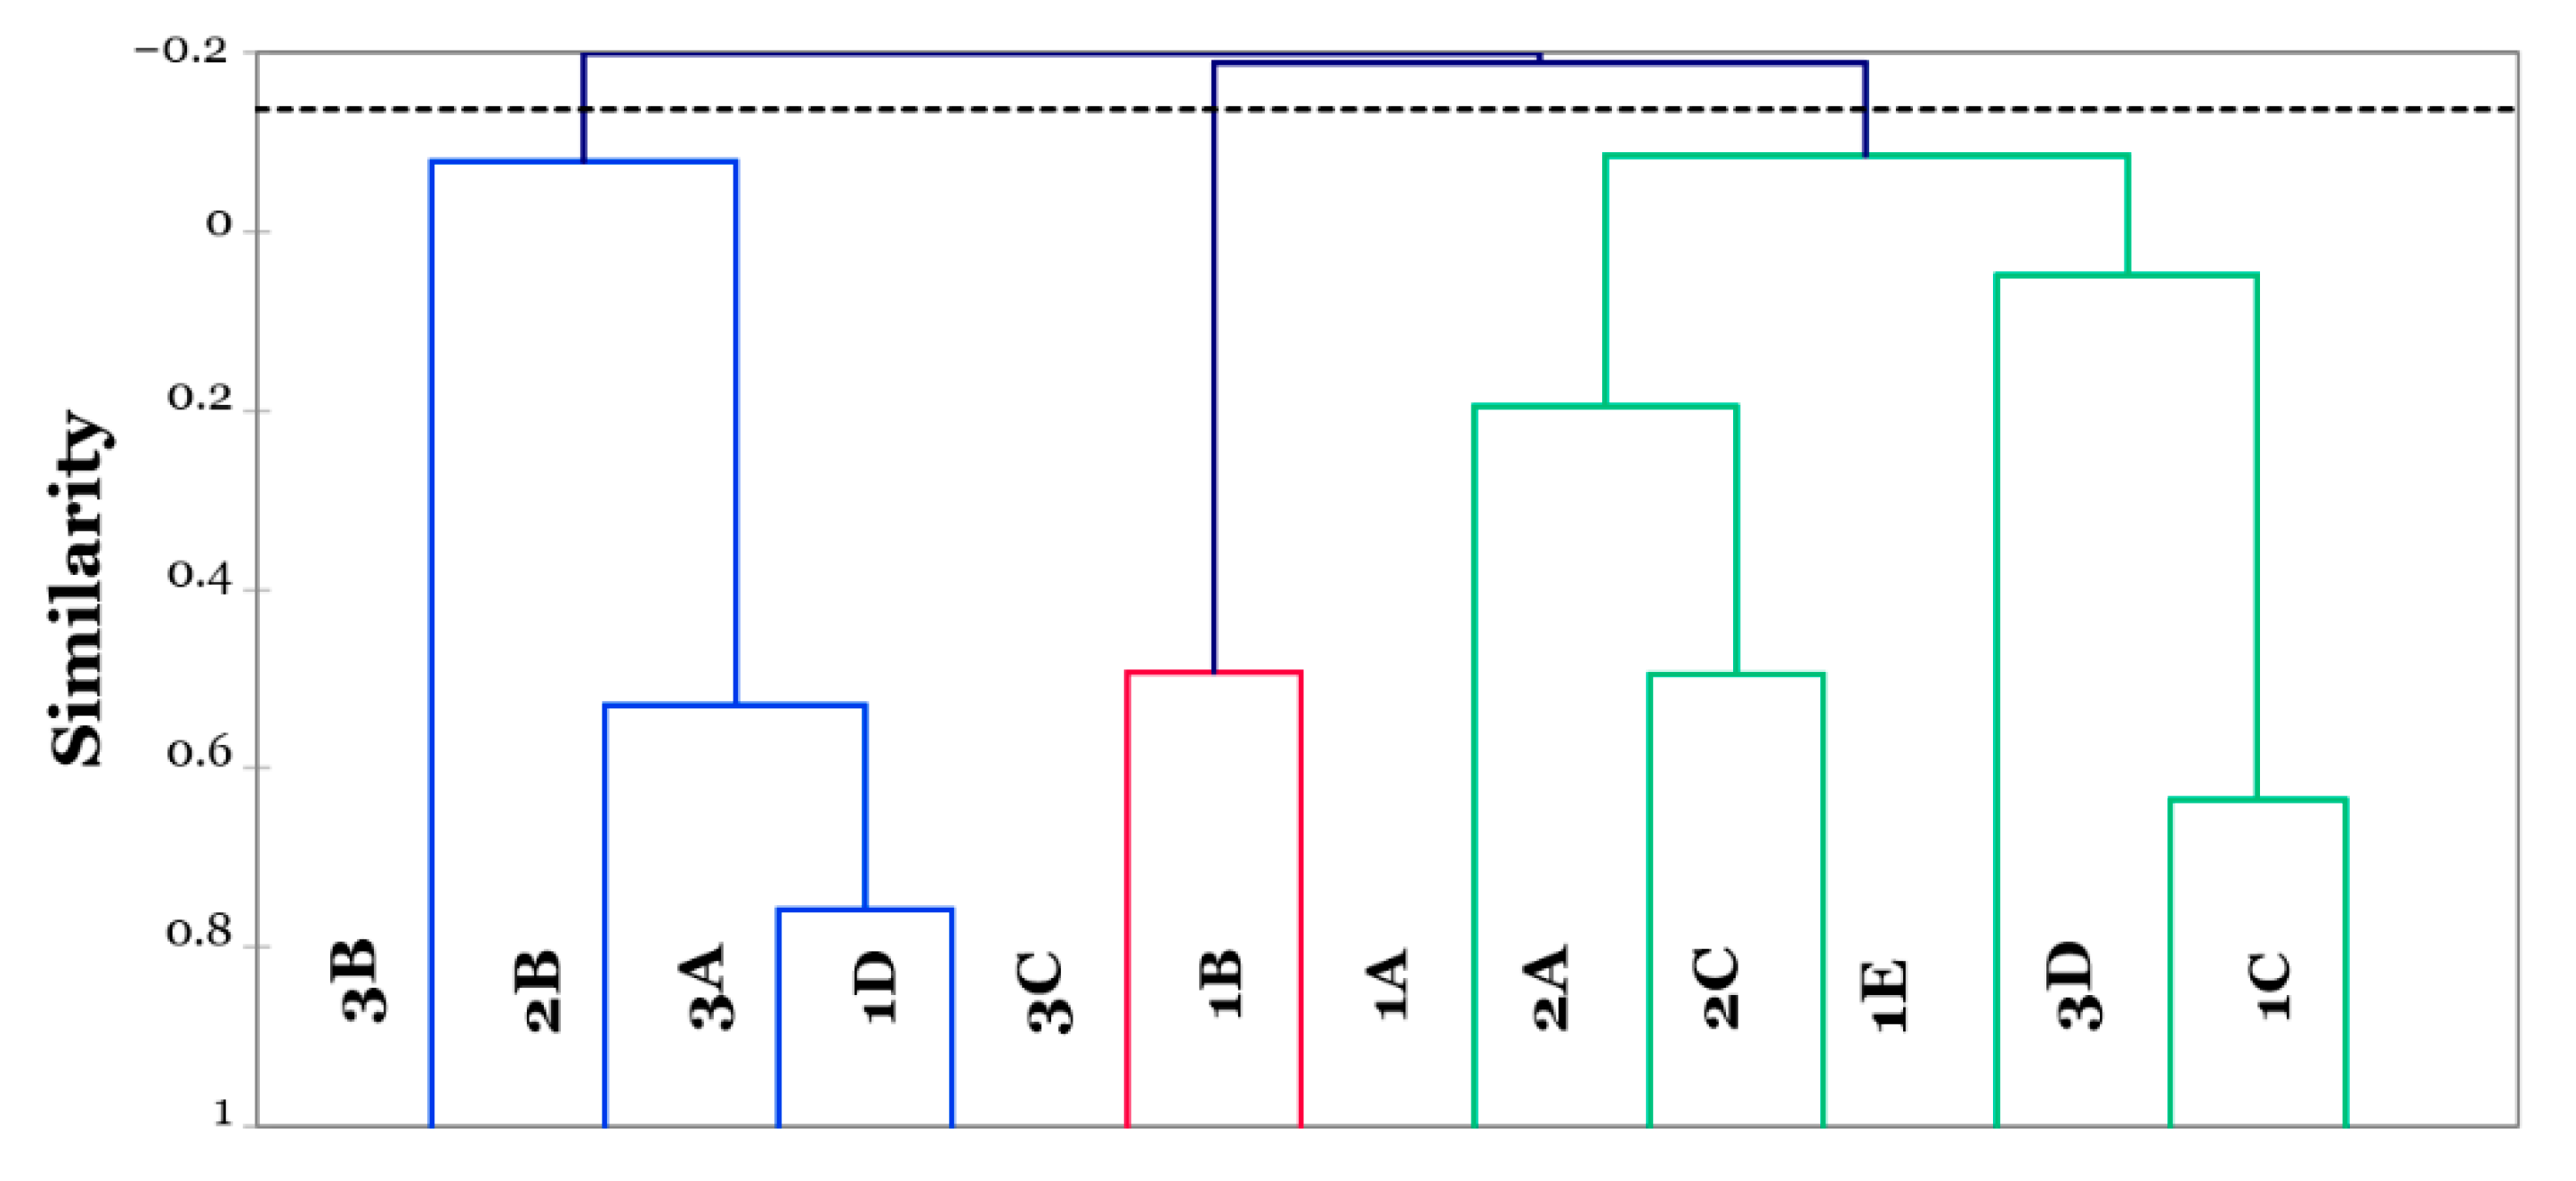
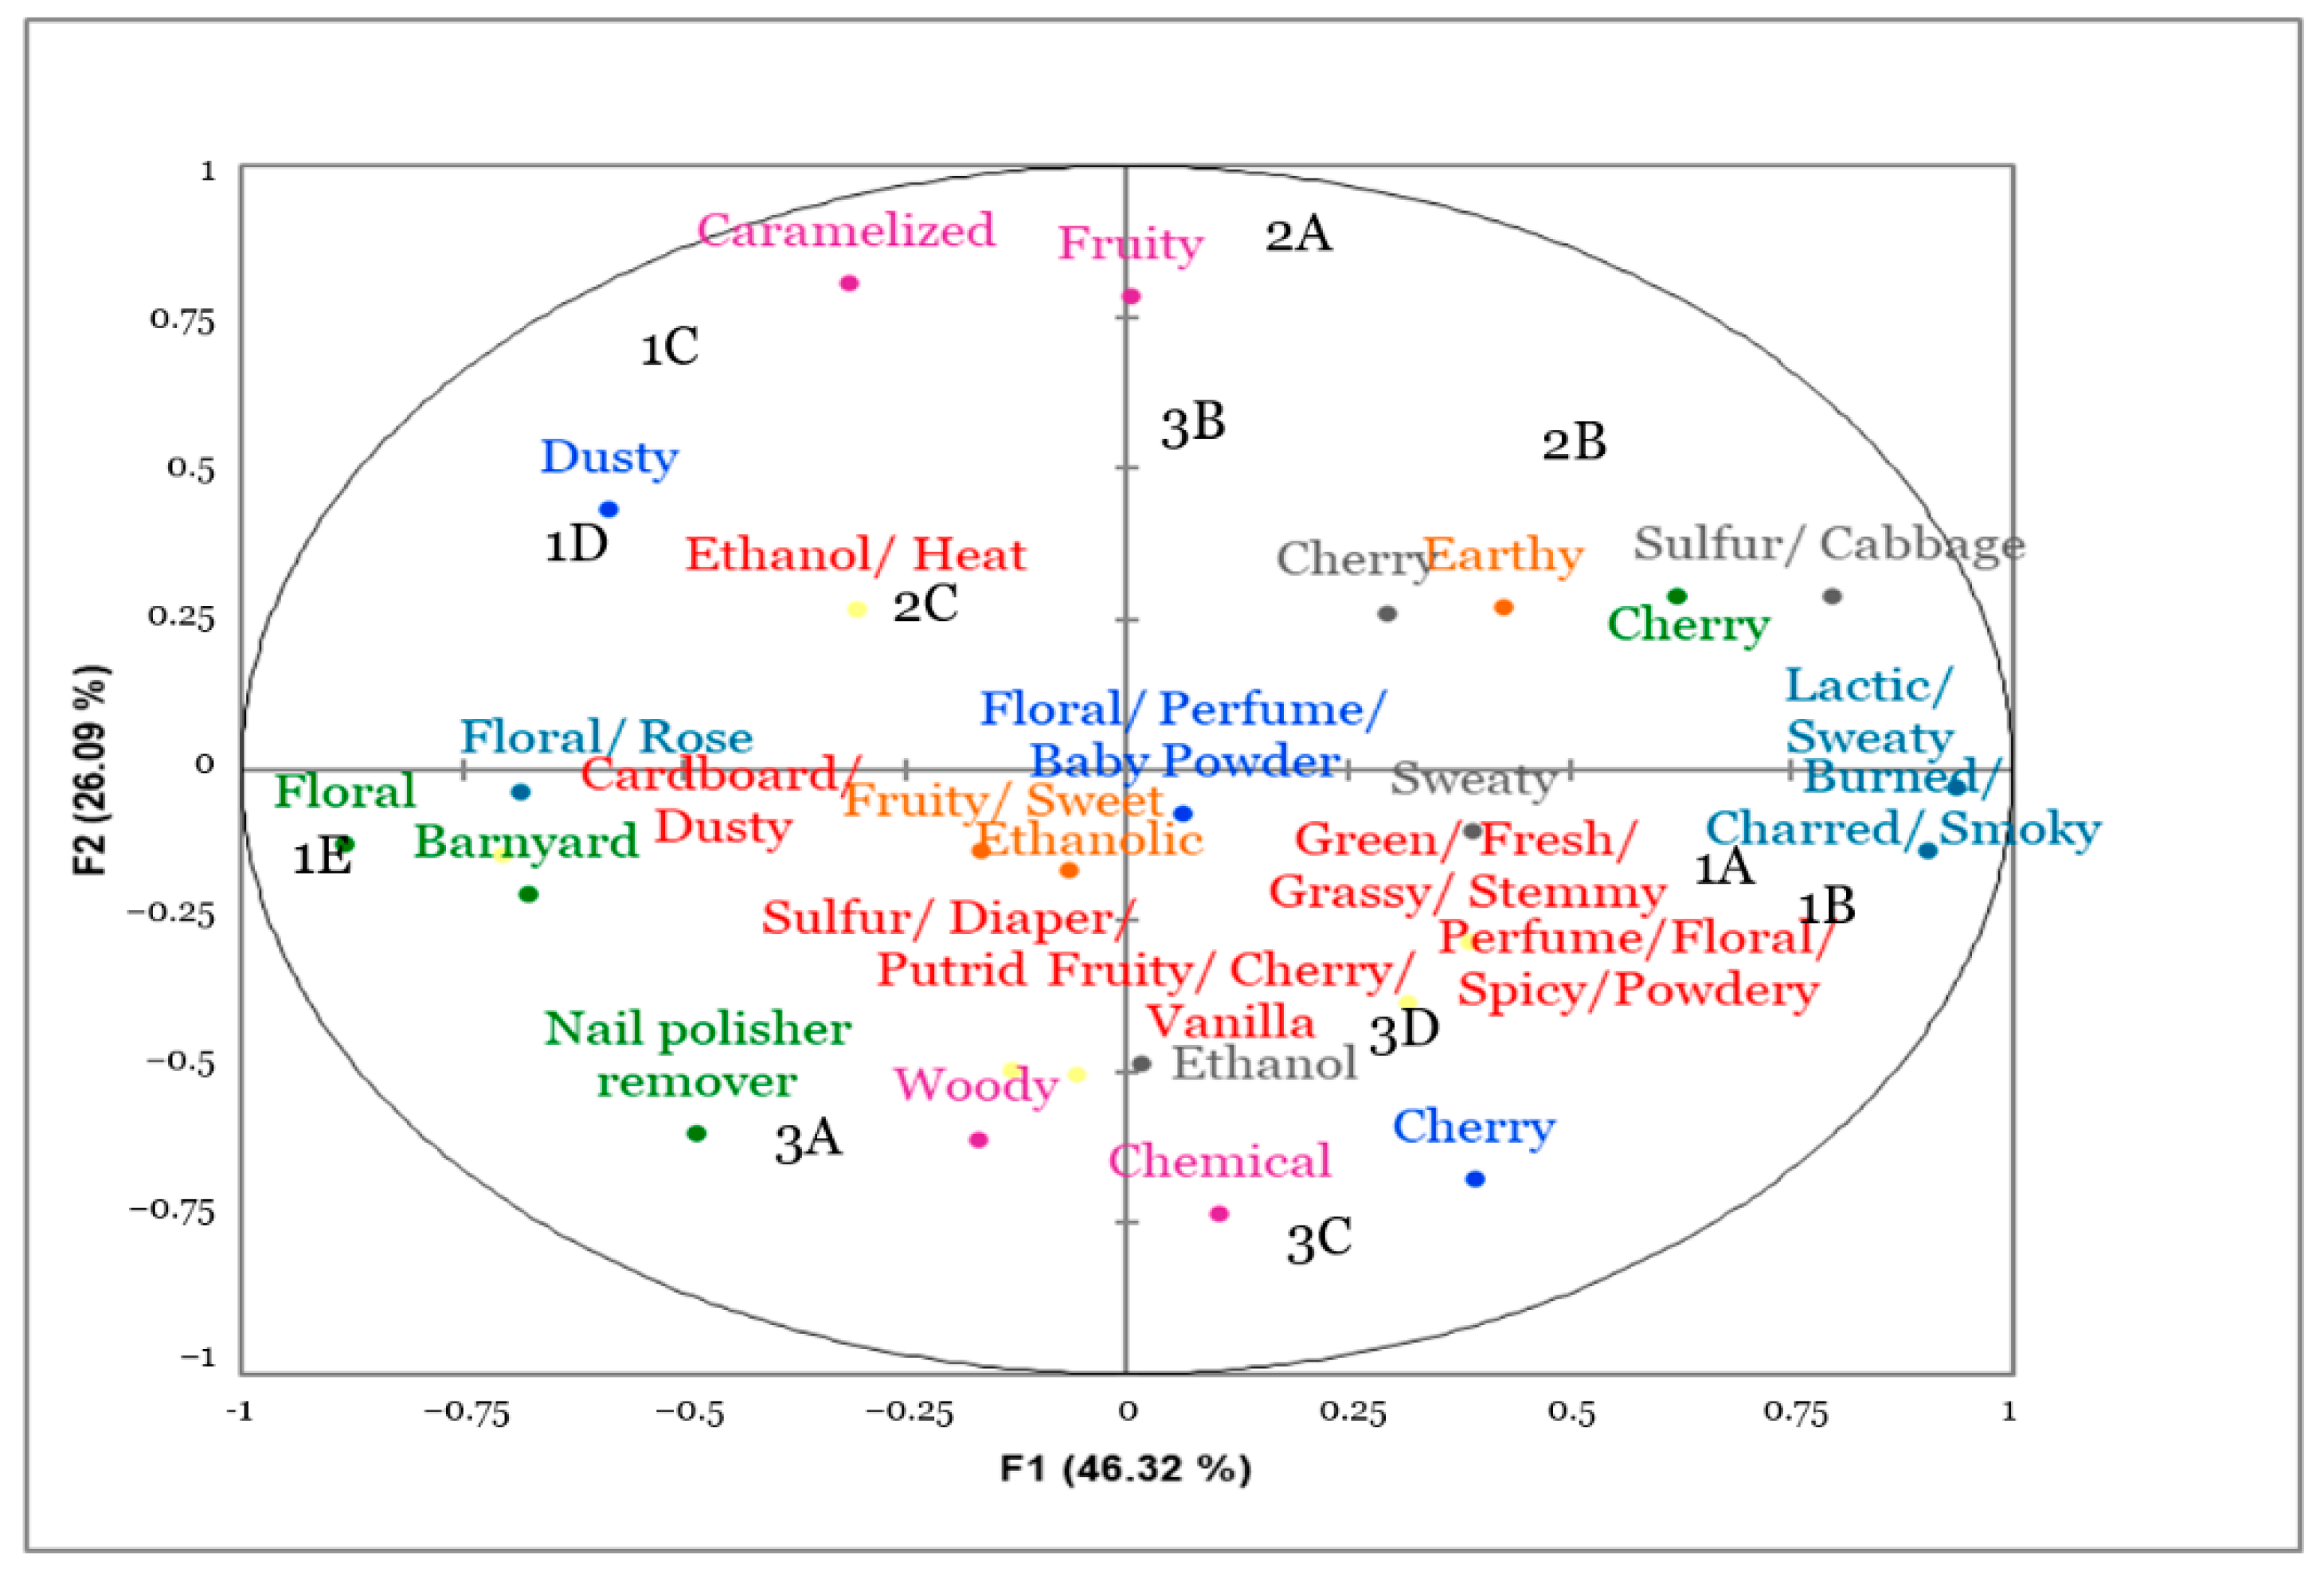
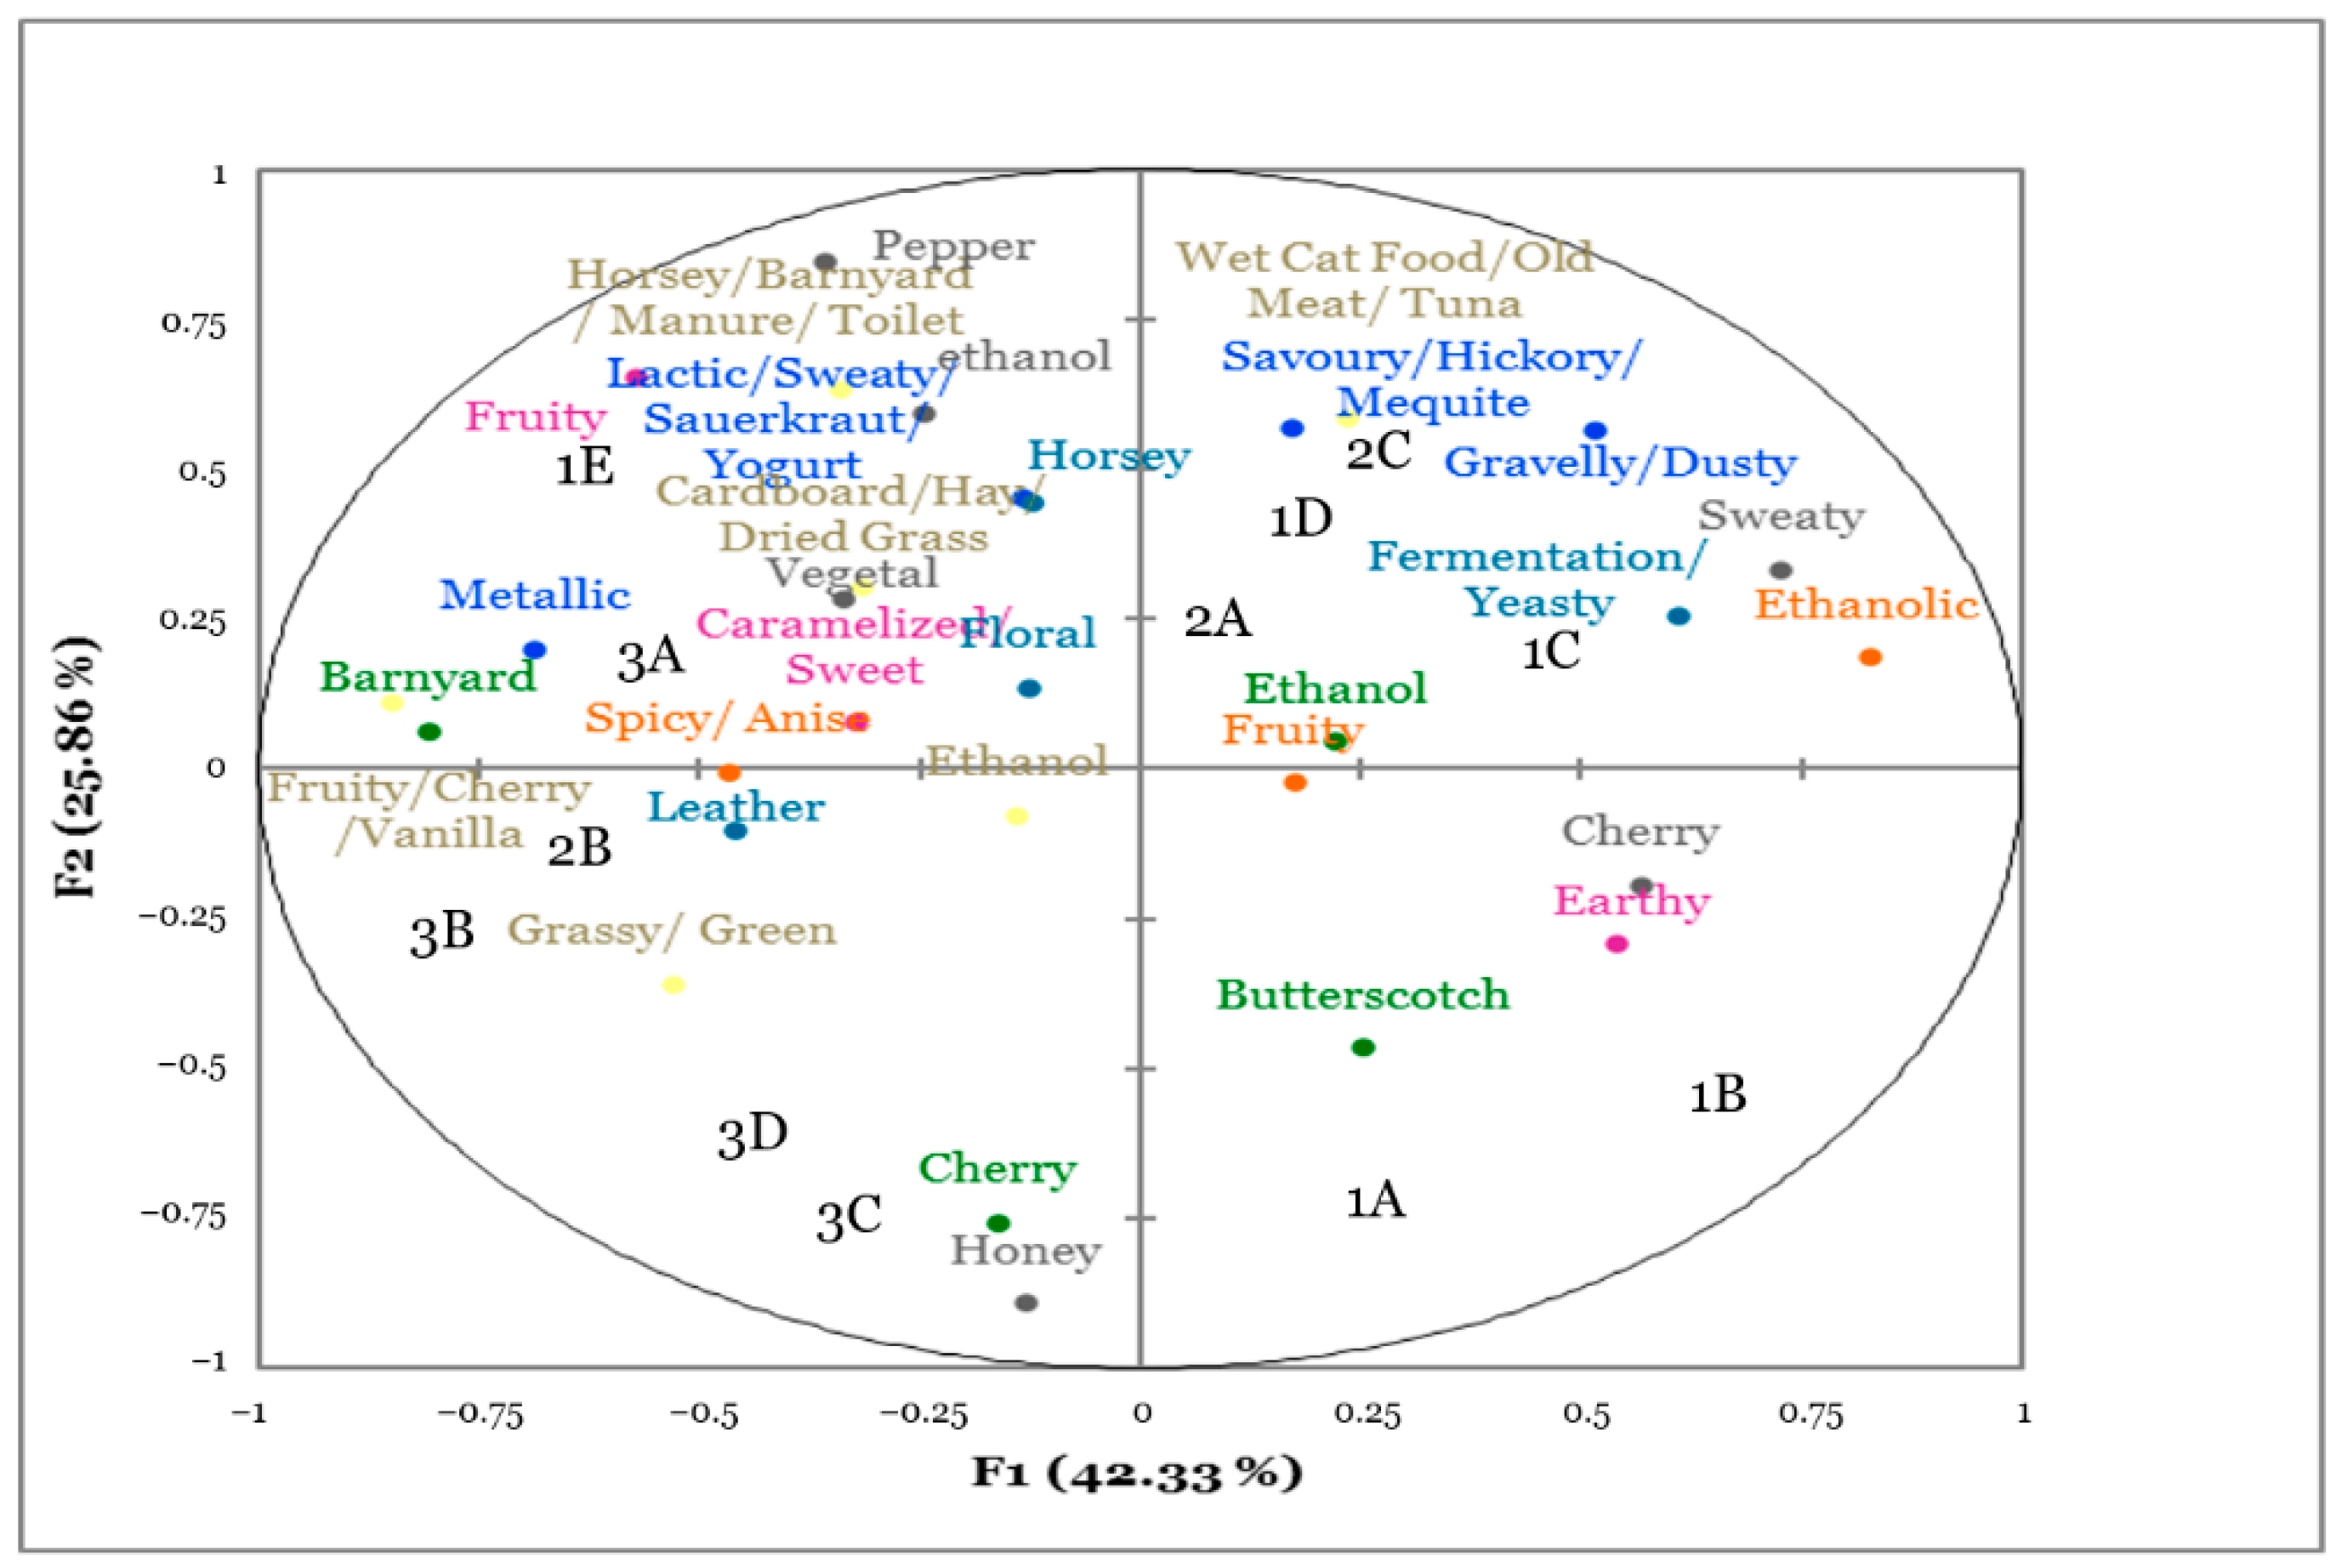
3.3. Flash Profiling

At each the seven time points, GPA was completed on the FP data. To determine when the assessors could detect differences among the inoculated wine samples, AHC was completed on the GPA data. The first instance of clustering was observed at Day 28 and three clusters were identified (Figure 4). Cluster one included Brettanomyces I1A (Bottle 2), Brettanomyces F3 (Bottle 1), sealed control, partially unscrewed control, and Acetobacter pasteurianus (Bottle 1). Cluster two included Pediococcus parvulus (Bottle 1), Lactobacillus brevis (Bottle 1), and Acetobacter Pasteurianus (Bottle 2). Cluster three included Pediococcus parvulus (Bottle 2), Lactobacillus brevis (Bottle 2), Brettanomyces I1A (Bottle 1), and Brettanomyces F3 (Bottle 2).
These clusters were different than what would be expected as the replicate bottles were placed into different clusters, with the exception of the uninoculated control and uninoculated partially unscrewed control. However, these clusters were similar to the groupings observed with the e-tongue, indicating that there were slight differences between the different replicates. These differences diminished over time as the identified clusters were primarily based on the inoculated wine microorganism at Day 42 of storage (Figure 5). At Day 42, Cluster one contained L. brevis (Bottle 1 and 2), the unsealed control and P. parvulus (Bottle 2), Cluster two contained Brettanomyces I1A (Bottle 1) and Brettanomyces F3 (Bottle 1), and Cluster three contained Brettanomyces I1A (Bottle 2), Brettanomyces F3 (Bottle 2), A. pasteurianus (Bottle 1 and 2), and the sealed control. Differences in the aromatic profile of the controls were observed, indicating that some oxidation may have occurred. However, the unsealed control was significantly different from the A. pasteurianus treatments (Bottle 1 and 2), which were also left unsealed. Therefore, A. pasteurianus significantly influenced sensory characteristics beyond oxidation. The influence of time suggested that the differences among samples observed at the beginning of the storage time may have been caused by different growth rates of the microorganisms in the replicate bottles. However, over time, the broader effect of the spoilage microorganisms was increasingly based on the identity of the microorganism.
The FP data at Day 28 were analyzed using GPA to visualize the assessor term usage in a consensus map (Figure 6). Each assessor generated three to seven terms at each time point, with the overall number of terms used varying among the time points. The FP mapping explained 72.3% of the variation among the samples. PC1 described 46.3% of the variation and was described as the relationship between sweaty, lactic, smokey, and spicy contrasted to floral, dusty, and barnyard notes. Both replicates of Brettanomyces I1A and F3 were located in the same quadrant and were described as smoky, spicy, floral, chemical, and cherry. These sensory characteristics are often associated with a Brettanomyces infection, especially at the earlier stages when the metabolites are at concentrations that may contribute to wine complexity [41].
The partially unscrewed and sealed uninoculated control were closely related to each other and were described by ethanol, dusty, and caramelized aromas (Figure 6). The groupings on the consensus map may not directly correlate to the clusters determined from AHC due to the inclusion of all the different principal components. The consensus mapping determined the ability of the experienced assessors to discriminate among the samples, as well as providing a sensory profile of the inoculated wines. Based on these results, the assessors differentiated among the aromas of the inoculated wine samples at Day 28. These results suggest that that the storage time at which these changes occurred would be between Day 21 and Day 28.
The consensus map visualized the assessors’ term usage at Day 42 from the FP data (Figure 7). The FP mapping explained 68.1% of the variation among the samples. PC1 described 42.3% of the variation and was described as the relationship between fruity, cherry, and ethanol contrasted to leather spicy, and barnyard. Both replicates of Brettanomyces I1A and F3 were in the bottom portion of the consensus map and were described as honey, butterscotch, and cherry. The P. parvulus, L. bacillus, and A. pasteurianus (Bottle 1) were clustered together and were described by notes such as lactic, metallic, and horsey. Between Day 28 and Day 42, there was a decrease in cited sensory terms associated with the Brettanomyces samples. Previous studies have found that as the Brettanomyces by-products (particularly ethyl-phenols) increase, the perception of fruity and varietal aromas decrease, even when these by-products are present at sub-threshold concentrations [49,50]. This effect may explain the results observed in this study. Similar to what was observed from AHC, most of the microorganism bottle replicates were in similar areas on the consensus map. While the Brettanomyces samples were not all present in the same cluster, the samples were characterized by similar terms. This result suggests that clustering may be based on the other principal components not displayed on the consensus map but otherwise included in the AHC. These results were also observed at the Day 28 time point.
In addition to utilizing the FP data for assessor consensus mapping, the term usage was visualized, with terms separated as being either spoilage-related or non-spoilage related (Figure 8). From Day 0 to Day 35, the assessors used non-spoilage related terms at significantly higher frequencies (p < 0.0001). However, at Day 42 of storage, the use of traditional spoilage terms was significantly higher than the use of non-spoilage terms, indicating a shift in sensory profile. The percentage of traditional spoilage terms, such as barnyard and medicinal, compared to the overall term usage, was relatively consistent for the first 35 days of storage (p > 0.05). Day 42 was the only time point that had a significant difference in traditional spoilage term usage based on storage (p < 0.05). At Day 42, 58% of the terms utilized to differentiate the inoculated wine samples were spoilage related, which was significantly higher (15%) than any other time point. The sharp increase in traditional spoilage terms indicated that between Day 35 and Day 42, the inoculated wines reached the point at which they had a significant increase in negative sensory characteristics, suggesting wine spoilage.

3.4. Study Limitations

In this study, only the aromatic profile of the wines was evaluated by the assessors. These aromatic changes are likely to be insufficient for a full explanation of the sensory changes in the wine conferred by the spoilage microorganisms. Similarly, this study did not evaluate the different enzymatic reactions that can occur during aging, from natural and microbiological sources, which have been shown to influence the sensory characteristics of the wine. Another limitation was the sampling schedule and the frequency of sampling. In the present study, wines were sampled weekly. More frequent sampling would be needed to determine exact times at which sensory changes occurred. Even though this study used weekly sampling, it does provide information regarding sampling frequency for future studies.
Additionally, this study only utilized a rapid sensory method instead of traditional descriptive analysis which may have provided a more robust examination of the sensory changes occurring over storage.
Future studies should also explore additional experimental conditions to expand generalizability of the results. In the present study, only one wine varietal and storage temperature were evaluated. Given that different spoilage microorganisms have different growth characteristics and metabolism, a greater range of storage temperatures would provide this additional information. The present study used Merlot, but future studies should explore other wine varietals to see if the relationships in the present study can be extended.

4. Conclusions

The ability of the e-tongue and FP to discriminate and detect wine faults caused by spoilage microorganisms was determined in Merlot wine. The e-tongue differentiated among the different wine faults starting at Day 21 of storage at 23 °C. From FP, assessors were able to start discriminating among the faulted wines starting at Day 28; however, a significant increase in traditional spoilage terms was not observed until Day 42. These results indicated that the e-tongue discriminated among faulted wines based on their non-volatile profile before the experienced assessors detected sensory changes in the volatile profile.
These results suggest that the e-tongue is a useful tool for early detection of wine faults and may provide winemakers with an opportunity for remediation. The application of these novel techniques (e-tongue partnered with FP) may be the key to limiting financial losses associated with wine faults by early detection and remediation.

Author Contributions

Conceptualization, V.D.P., C.G.E., and C.F.R.; methodology, V.D.P., T.C.-B., C.G.E., and C.F.R.; formal analysis, V.D.P. and C.D.; investigation, V.D.P., and T.C.-B.; writing-original draft preparation, V.D.P., and C.F.R.; writing-review and editing, V.D.P., C.D., C.G.E., T.C.-B., and C.F.R.; supervision, C.F.R.; funding acquisition, C.G.E. and C.F.R. All authors have read and agreed to the published version of the manuscript.

Funding

These authors acknowledge the financial support of the Northwest Center for Small Fruit Research. This work was partially supported by the USDA National Institute of Food and Agriculture, Hatch project with Accession# 1016366.

Institutional Review Board Statement

The study was conducted according to the guidelines of the Declaration of Helsinki, and approved by the Institutional Review Board of Washington State University (IRB# 17595-001; approved April 2019).

Informed Consent Statement

Informed consent was obtained from all subjects prior to their participation in the study.

Data Availability Statement

Data available on reasonable request due to restrictions e.g., privacy.

Conflicts of Interest

The authors declare no conflict of interest. The funders had no role in the design of the study; in the collection, analyses, or interpretation of data; in the writing of the manuscript, or in the decision to publish the results.

References

  1. AWRI. Wine Faults, Taints and Flavours. Australian Wine Research Institute. Available online: https://www.awri.com.au/industry_support/winemaking_resources/sensory_assessment/recognition-of-wine-faults-and-taints/ (accessed on 8 July 2020).
  2. Alcohol and Tobacco Tax and Trade Bureau (TTB). TTB: TAD: Wine-Common Audit Issues. TTBGov-Wine-Common Audit Issues. Available online: https://www.ttb.gov/wine/wine-common-audit-issues (accessed on 19 May 2015).
  3. Bartowsky, E.J. Bacterial spoilage of wine and approaches to minimize it. Lett. Appl. Microbiol. 2009, 48, 149–156. [Google Scholar] [CrossRef]
  4. Fugelsang, K.C.; Edwards, C.G. Wine Microbiology: Practical Applications and Procedures; Springer: New York, NY, USA, 2006. [Google Scholar]
  5. Suárez, R.; Suárez-Lepe, J.A.; Morata, A.; Calderón, F. The production of ethylphenols in wine by yeasts of the genera Brettanomyces and Dekkera: A review. Food Chem. 2007, 102, 10–21. [Google Scholar] [CrossRef]
  6. Malfeito-Ferreira, M.; Barata, A.; Loureiro, V. Wine spoilage by fungal metabolites. In Wine Chemistry and Biochemistry; Polo, C., Moreno-Arribas, M.V., Eds.; Springer: New York, NY, USA, 2009; pp. 615–645. [Google Scholar]
  7. Schumaker, M.R.; Chandr, M.; Malfeito-Ferreira, M.; Ross, C.F. Influence of Brettanomyces ethylphenols on red wine aroma evaluated by consumers in the United States and Portugal. Food Res. Int. 2017, 100, 161–167. [Google Scholar] [CrossRef] [Green Version]
  8. Davis, E.R.; Wibowo, D.; Fleet, G.H.; Lee, T.H. Properties of wine lactic acid bacteria: Their potential enological significance. AJEV 1988, 39, 137–142. [Google Scholar]
  9. Lonvaud-Funel, A.; Guilloux, Y.; Joyeux, A. Isolation of a DNA probe for identification of glucan-producing Pediococcus damnosus in wines. J. Appl. Bacteriol. 1993, 74, 41–47. [Google Scholar] [CrossRef]
  10. Sponholz, W.R. Wine spoilage by microorganisms. In Wine Microbiology and Biotechnology; Fleet, G.H., Ed.; Harwood Academic Publishers: New York, NY, USA, 1993; pp. 395–420. [Google Scholar]
  11. Liu, S.Q.; Pilone, G.J. A review: Arginine metabolism in wine lactic acid bacteria and its practical significance. J. Appl. Microbiol. 1998, 84, 315–327. [Google Scholar] [CrossRef]
  12. Lonvaud-Funel, A. Lactic acid bacteria in the quality improvement and depreciation of wine. Antonie Leeuwenhoek 1999, 76, 317–331. [Google Scholar] [CrossRef] [PubMed]
  13. Bartowsky, E.J.; Xia, D.; Gibson, R.L.; Feet, G.H.; Henschke, P.A. Spoilage of bottled red wine by acetic acid bacteria. Lett. Appl. Microbiol. 2003, 36, 307–314. [Google Scholar] [CrossRef] [Green Version]
  14. Francis, I.L.; Newton, J.L. Determining wine aroma from compositional data. Aust. J. Grape Wine 2005, 11, 114–126. [Google Scholar] [CrossRef]
  15. Chatonnet, P.; Dubourdie, D.; Boidron, J.; Pons, M. The origins of ethylphenols in wines. J. Sci. Food Agric. 1992, 60, 165–178. [Google Scholar] [CrossRef]
  16. Loureiro, V.; Malfeito-Ferreira, M. Spoilage yeasts in the wine industry. Int. J. Food Microbiol. 2003, 86, 23–50. [Google Scholar] [CrossRef]
  17. Bartowsky, E.J.; Henschke, P.A. The ‘buttery’ attribute of wine- diacetyl- desirability, spoilage and beyond. Int. J. Food Microbiol. 2004, 96, 235–252. [Google Scholar] [CrossRef]
  18. Liu, J.; Gronbeck, M.S.; Di Monaco, R.; Giacalone, D.; Bredie, W.L.P. Performance of flash profile and napping with and without training for describing small sensory differences in a model wine. Food Qual. Prefer. 2016, 48, 41–49. [Google Scholar] [CrossRef]
  19. Sieffermann, J.M. Le profil Flash: Un Outil Rapide et Innovant d’e’ Valuation Sensorielle Descriptive [Conference Paper Presentation]; The L’innovation: De l’ide’eau succe’s-Douzie’mes rencontres AGORAL: Paris, France, 2000. [Google Scholar]
  20. Williams, A.A.; Langron, S.P. The use of free-choice profiling for the evaluation of commercial ports. J. Sci. Food Agric. 1984, 35, 558–568. [Google Scholar] [CrossRef]
  21. Dairo, V.; Sieffermann, J.M. A comparison of 14 jams characterized by conventional profile and a quick original method, the flash profile. J. Food Sci. 2002, 67, 826–834. [Google Scholar] [CrossRef]
  22. Delarue, J. Flash profile, its evolution and uses in sensory and consumer science. In Rapid Sensory Profiling Techniques: Applications in New Product Development and Consumer Research; Delarue, J., Lawlor, J.B., Rogeaux, M., Eds.; Elsevier: New York, NY, USA, 2015; pp. 119–148. [Google Scholar]
  23. Liu, J.; Bredie, W.L.O.; Sherman, E.; Harbertson, J.F.; Heymann, H. Comparison of rapid descriptive sensory methodologies: Free-choice profiling, flash profile and modified flash profile. Food Res. Int. 2018, 106, 892–900. [Google Scholar] [CrossRef]
  24. Albert, A.; Varela, P.; Salvador, A.; Hough, G.; Fiszman, S. Overcoming the issues in the sensory description of hot served foods with a complex texture. Application of QDA, flash profiling and projective mapping using panels with different degrees of training. Food Qual. Prefer. 2011, 22, 463–473. [Google Scholar] [CrossRef]
  25. Legin, A.; Rudnitskaya, A.; Clapham, D.; Seleznev, B.; Lord, K.; Vlasov, Y. Electronic tongue for pharmaceutical analytics: Quantification of tastes and masking effects. Anal. Bioanal. Chem. 2004, 380, 36–45. [Google Scholar] [CrossRef] [PubMed]
  26. Rudinitskaya, A.; Rocha, S.M.; Legin, A.; Pereira, V.; Marques, J.C. Evaluation of the feasibility of the electronic tongue as a rapid analytical tool for wine age prediction and quantification of the organic acids and phenolic compounds. The case-study of Madeira wine. Anal. Chim. Acta 2010, 662, 82–89. [Google Scholar] [CrossRef] [PubMed]
  27. Campos, I.; Bataller, R.; Armero, R.; Gandia, J.M.; Soto, J.; Martinez-Manez, R.; Gil-Sanchez, L. Monitoring grape ripeness using a voltametric electronic tongue. Food Res. Int. 2013, 54, 1369–1375. [Google Scholar] [CrossRef]
  28. Diako, C.; McMahon, K.; Mattinson, S.; Evans, M.; Ross, C.F. Alcohol, tannins, and mannoprotein and their interactions influence the sensory properties of selected commercial merlot wines: A preliminary study. J. Food Sci. 2016, 81, S2039–S2048. [Google Scholar] [CrossRef]
  29. Diako, C.; Vixie, B.; Weller, K.M.; Dycus, D.A.; Ross, C.F. Determination of 4-ethylcatechol in a merlot wine using sensory evaluation and the electronic tongue. Int. J. Food Sci. Technol. 2017, 52, 2489–2496. [Google Scholar] [CrossRef] [Green Version]
  30. Newman, J.; O’Riordan, D.; Jacquier, J.C.; O’Sullivan, M. Masking of bitterness in dairy protein hydrolysates: Comparison of an electronic tongue and a trained sensory panel as means of directing the masking strategy. LWT 2015, 63, 751–757. [Google Scholar] [CrossRef]
  31. Lipkowitz, J.B.; Ross, C.F.; Diako, C.; Smith, D.M. Discriminating aging and protein-to-fat ration in cheddar cheese using sensory analysis and a potentiometric electronic tongue. J. Dairy Sci. 2018, 101, 1990–2004. [Google Scholar] [CrossRef] [PubMed]
  32. Walsh, E.A.; Diako, C.; Smith, D.M.; Ross, C.F. Influence of storage time and elevated ripening temperature on the chemical and sensory properties of white cheddar cheese. J. Food Sci. 2020, 85, 268–278. [Google Scholar] [CrossRef] [PubMed]
  33. Dyminski, D.S.; Paterno, L.G.; Takeda, H.H.; Bolini, H.; Mattoso, L.H.C.; Candido, L.M.B. Correlation between human and electronic tongues responses on the analysis of commercial sweeteners. Sens. Lett. 2006, 4, 403–408. [Google Scholar] [CrossRef]
  34. Waldrop, M.E.; Ross, C.F. Sweetener blend optimization using mixture design methodology and the electronic tongue. J. Food Sci. 2014, 79, S1782–S1794. [Google Scholar] [CrossRef] [PubMed]
  35. Paup, V.D.; Barnett, S.M.; Diako, C.; Ross, C.F. Detection of spicy compounds using the electronic tongue. J. Food Sci. 2019, 84, 2619–2627. [Google Scholar] [CrossRef]
  36. Schlossareck, C.; Ross, C.F. Electronic tongue and consumer sensory evaluation of spicy paneer cheese. J. Food Sci. 2019, 8, 1563–1569. [Google Scholar] [CrossRef]
  37. Nery, E.W.; Kubota, L.T. Integrated, paper-based potentiometric electronic tongue for the analysis of beer and wine. Anal. Chim. Acta 2016, 918, 60–68. [Google Scholar] [CrossRef]
  38. Lvova, L.; Yaroshenko, I.; Kirsanov, D.; Natale, C.D.; Paolesse, R.; Legin, A. Electronic tongue for brand uniformity control: A case study of Apulian red wines recognition and defects evaluation. Sensors 2018, 18, 2584. [Google Scholar] [CrossRef] [PubMed] [Green Version]
  39. Jensen, S.L.; Umiker, N.L.; Arneborg, N.; Edwards, C.G. Identification and characterization of Dekkera bruxellensis, Candida pararugosa, and Pichia guilliermondii isolated from commercial red wines. Food Microbiol. 2009, 26, 915–921. [Google Scholar] [CrossRef]
  40. Noble, A.C.; Arnold, R.A.; Buechsenstein, J.; Leach, E.J.; Schmidt, J.O.; Stern, P.M. Modification of a standardized system of wine aroma terminology. AJEV 1987, 38, 143–146. Available online: https://www.ajevonline.org/content/ajev/38/2/143.full.pdf (accessed on 12 February 2021).
  41. Joseph, L.; Albino, E.; Bisson, L.F. Creation and use of a Brettanomyces aroma wheel. Catal. Discov. Pract. 2017, 1, 12–20. [Google Scholar] [CrossRef]
  42. Zuehlke, J.M.; Edwards, C.G. Impact of sulfur dioxide and temperature on Culturability and viability of Brettanomyces bruxellensis in wine. J. Food Prot. 2013, 76, 2024–2030. [Google Scholar] [CrossRef] [PubMed]
  43. du Toit, M.; Pretorius, I.S. Microbial spoilage and preservation of wine: Using weapons for nature’s own arsenal. S. Afr. J. Enol. Vitic. 2000, 21, 74–96. [Google Scholar] [CrossRef] [Green Version]
  44. Loureiro, V.; Malfeito-Ferreira, M. Dekkera/Brettanomyces spp. In Food Spoilage Microorganisms; Blackburn, C.D.W., Ed.; Woodhead Publishing: Cambridge, UK, 2006; pp. 354–388. [Google Scholar]
  45. Wedral, D.; Shewfelt, R.; Frank, J. The challenge of Brettanomyces in wine. LWT 2010, 43, 1474–1479. [Google Scholar] [CrossRef]
  46. Jia, K.; Zhang, Y.; Li, Y. Systematic engineering of microorganisms to improve alcohol tolerance. Eng. Life Sci. 2010, 10, 422–429. [Google Scholar] [CrossRef]
  47. Gamboa, J.C.R.; Albarracin, E.S.; Silva, A.J.; Lima, L.L.A.; Ferreira, T.A. Wine quality rapid detection using a compact electronic nose system: Application focused on spoilage thresholds by acetic acid. LWT 2019, 108, 377–384. [Google Scholar] [CrossRef] [Green Version]
  48. Gil-Sanchez, L.; Soto, J.; Martinez-Manez, R.; Garcia-Breijo, E.; Ibanez, I.; Llobet, E. A novel humid electronic nose combined with an electronic tongue for assessing deterioration of wine. Sens. Actuators A Phys. 2011, 171, 152–158. [Google Scholar] [CrossRef]
  49. Filipe-Ribeiro, L.; Cosme, F.; Nunes, F.M. Reducing the negative sensory impact of volatile phenols in red wine with different chitosans: Effect of structure on efficiency. Food Chem. 2018, 242, 591–600. [Google Scholar] [CrossRef] [PubMed]
  50. Tempere, S.; Schaaper, M.H.; Cuzange, E.; de Lescar, R.; de Revel, G.; Sicardd, G. The olfactory masking effect of ethylphenols: Characterization and elucidation of its origin. Food Qual. Prefer. 2016, 50, 135–144. [Google Scholar] [CrossRef]
Figure 1. Culturability (CFU/mL) of Brettanomyces I1A (orange), Brettanomyces F3 (green), Pediococcus parvulus (grey), Acetobacter pasteurianus (yellow), and Lactobacillus brevis (blue) in Merlot wine stored at 23 °C over 42 days. A dashed line indicates that populations were below the detection limit.
Beverages 07 00052 g001
Figure 2. Principal component analysis of Merlot wine samples on Day 14 of storage at 23 °C as analyzed by the electronic tongue. Samples are labeled with names as described in Table 1. The discrimination index was −16.
Beverages 07 00052 g002
Figure 3. Principal component analysis of Merlot wine samples on Day 21 of storage at 23 °C as analyzed by the electronic tongue. Samples are labeled with names as described in Table 1. The discrimination index was 91.
Beverages 07 00052 g003
Figure 4. Dendrogram of the agglomerative hierarchical cluster analysis of the Flash Profiling data generated through Generalized Procrustes Analysis at Day 28 of storage of the Merlot wine at 23 °C. The three clusters are distinguished by color and based on similarity. Samples are labeled with names as described in Table 1. The broken line indicates the point at which truncation occurred.
Beverages 07 00052 g004
Figure 5. Dendrogram of the agglomerative hierarchical cluster analysis of the Flash Profiling data generated through Generalized Procrustes Analysis at Day 42 of storage of the Merlot wine. The three clusters are distinguished by color and based on similarity. Samples are labeled with names as described in Table 1. The broken line indicates the point at which truncation occurred.
Beverages 07 00052 g005
Figure 6. Generalized Procrustes Analysis of the Flash Profile data taken at Day 28 of 23 °C storage of the inoculated Merlot wine samples. Wine sample location is based on consensus mapping. Samples are abbreviated based on cluster and are labeled with names as described in Table 1. Displayed are the aroma terms used to describe the wines. Sensory terms are presented in a unique color for each assessor.
Beverages 07 00052 g006
Figure 7. Generalized Procrustes Analysis of the Flash Profile data taken at Day 42 of 23 °C storage of the inoculated Merlot wine samples. Wine sample location is based on consensus mapping. Samples are abbreviated based on cluster and are labeled with names as described in Table 1. Displayed are the aroma terms used to describe the wines. Sensory terms are presented in a unique color for each assessor.
Beverages 07 00052 g007
Figure 8. The percentage of spoilage and non-spoilage related terms utilized by the experienced assessors at each time point evaluations from Day 0 to Day 42. Evaluations were completed on the spoilage organism-inoculated Merlot wines. Traditional spoilage terms were aromas that were associated with negative sensory connotations based on the Brettanomyces aroma wheel. A * indicates significant differences (p < 0.001) between the usage of spoilage terms and non-spoilage terms.
Beverages 07 00052 g008
Table 1. Wine treatments evaluated by electronic tongue and Flash Profiling. Bottles were fully closed with screw caps (sealed) or partially unscrewed to allow air flow.
CodeInoculated MicroorganismClosureBottle Replicate
1ABrettanomyces I1ASealed2
1BBrettanomyces F3Sealed1
1CNoneSealed1
1DNonePartially unscrewed1
1EAcetobacter pasteurianusPartially unscrewed1
2APediococcus parvulusSealed1
2BLactobacillus brevisSealed1
2CAcetobacter pasteurianusPartially unscrewed2
3APediococcus parvulusSealed2
3BLactobacillus brevisSealed2
3CBrettanomyces I1ASealed1
3DBrettanomyces F3Sealed2
Publisher’s Note: MDPI stays neutral with regard to jurisdictional claims in published maps and institutional affiliations.

