Article

Perception of Aqueous Ethanol Binary Mixtures Containing Alcohol-Relevant Taste and Chemesthetic Stimuli

by
Margaret Thibodeau
1 and
Gary Pickering
1,2,3,4,5,*
1
Department of Biological Sciences, Brock University, St. Catharines, ON L2S 3A1, Canada
2
Cool Climate Oenology and Viticulture Institute, Brock University, St. Catharines, ON L2S 3A1, Canada
3
Department of Psychology, Brock University, St. Catharines, ON L2S 3A1, Canada
4
National Wine and Grape Industry Centre, Charles Sturt University, Wagga Wagga, NSW 2678, Australia
5
Sustainability Research Centre, University of the Sunshine Coast, Sippy Downs, QLD 4556, Australia
*
Author to whom correspondence should be addressed.
Beverages 2021, 7(2), 23; https://doi.org/10.3390/beverages7020023
Submission received: 8 April 2021 / Revised: 21 April 2021 / Accepted: 23 April 2021 / Published: 29 April 2021
(This article belongs to the Special Issue Feature Papers in Sensory Analysis of Beverages Section)

Abstract

:
Ethanol is a complex stimulus that elicits multiple gustatory and chemesthetic sensations. Alcoholic beverages also contain other tastants that impact flavour. Here, we sought to characterize the binary interactions between ethanol and four stimuli representing the dominant orosensations elicited in alcoholic beverages: fructose (sweet), quinine (bitter), tartaric acid (sour) and aluminium sulphate (astringent). Female participants were screened for thermal taste status to determine whether the heightened orosensory responsiveness of thermal tasters (n = 21–22) compared to thermal non-tasters (n = 13–15) extends to these binary mixtures. Participants rated the intensity of five orosensations in binary solutions of ethanol (5%, 13%, 23%) and a tastant (low, medium, high). For each tastant, 3-way ANOVAs determined which factors impacted orosensory ratings. Burning/tingling increased as ethanol concentration increased in all four binary mixture types and was not impacted by the concentration of other stimuli. In contrast, bitterness increased with ethanol concentration, and decreased with increasing fructose concentration. Sourness tended to be reduced as ethanol concentration increased, although astringency intensity decreased with increasing concentration of fructose. Overall, thermal tasters tended to be more responsive than thermal non-tasters. These results provide insights into how the taste and chemesthetic profiles of alcoholic beverages across a wide range of ethanol concentrations can be manipulated by changing their composition.

1. Introduction

According to the Global Status Report on Alcohol and Health in 2016, 43% of individuals over the age of fifteen worldwide were current consumers of alcoholic beverages [1]. Alcohol misuse is associated with several negative health and social effects including increasing the risk of cancer, neuropsychiatric disorders, cardiovascular disease, digestive diseases and accidental injury/death [1,2]. In contrast, moderate consumption of alcoholic beverages may also be associated with increased well-being including relaxation, creativity or the ability to express oneself [3] and reduced adverse cardiovascular events [4]. As a result, understanding factors that impact alcohol consumption is important to reduce the harm associated with alcohol misuse, while also providing valuable consumer information to the alcoholic beverage industry.
Alcohol consumption is influenced by several factors including gender, individual differences, genetics, social expectations and sanctions, interpersonal relationships, personality, demographics and socioeconomic status [5,6,7,8]. Consumers also identify flavour as one of the most important factors when purchasing alcoholic beverages [9,10]. Individuals who are more responsive to both taste and chemesthetic sensations tend to report lower liking and consumption of alcoholic beverages than those less responsive. It is possible that this reduction in liking may be due to increased responsiveness to the nominally aversive sensations (bitterness, irritation, sourness and astringency) that are commonly elicited by alcoholic beverages (reviewed in [11]). As alcoholic beverages are complex matrices that vary considerably in flavour and composition, our research sought to better understand how ethanol impacts the perception of prototypical stimuli that elicit sensations common in alcoholic beverages. Furthermore, we tested to see if/how these results were impacted by individual differences in taste perception (the thermal taste phenotype). Although olfactory stimuli also contribute to the flavour of alcoholic beverages, we have limited the scope of the current research to focus on taste (sweet, sour, bitter) and chemesthetic (astringent, burning/tingling) sensations.

1.1. Ethanol

The defining characteristic of alcoholic beverages is the presence of ethanol (ethyl alcohol), the primary product of fermentation. Ethanol concentrations vary with beverage style and are typically 3–7% (v/v) in beer, 11–16% (v/v) in wine and 35–45% (v/v) in spirits [11]. For simplicity and unless otherwise noted, ethanol concentrations are reported as %(v/v) throughout the manuscript. In aqueous solutions, ethanol elicits sweetness [12,13,14,15,16,17,18,19], bitterness [13,14,15,16,17,18,19], astringency [17] and irritation/burning [13,16,17,19,20,21]. Sourness is also reported is some studies but usually at low intensity or by only a small proportion of participants [14,15,18]. In real and model alcoholic beverages, ethanol concentration has also been shown to impact the perception of perceived viscosity, density and body [22,23,24]. Taken together, the literature strongly supports that ethanol is a complex stimulus capable of eliciting multiple taste and chemesthetic sensations.
The intensity and relative dominance of the sensations elicited by ethanol vary with concentration. Nolden and Hayes [17] asked participants to rate the intensity of five ethanol concentrations (4%, 8%, 16%, 32% and 48%) on generalized Labelled Magnitude Scales (gLMS). The bitterness, burning/tingling, drying and sweetness elicited by ethanol was roughly equivalent at 4% and was rated between “barely detectable” and “weak”. Sweetness increased slightly as ethanol concentration increased but remained at or below “weak”. Bitterness, drying and burning/tingling increased from around “weak” at 8% ethanol, to above “moderate” at 48% ethanol. Bitterness was rated as the most intense sensation at 8%, whereas burning/tingling was the most intense at higher ethanol concentrations (32% and 48%). The differences in intensity and dominance of the sensations elicited by ethanol likely drive the broad differences in the sensory properties of beer, wine and spirits.

1.2. Orosensory Interactions

The composition of alcoholic beverages varies widely across styles (beer, wine, spirits) and production practices can be used to optimize the flavour profile. Broadly speaking, other compounds that contribute to the taste and chemesthetic sensations elicited by alcoholic beverages include but are not limited to organic acids (sourness), hop resins (bitterness), sugars (sweetness), carbon dioxide (tingling/prickling), and tannins (astringency, bitterness [11]).
When consumers drink alcoholic beverages, they make quick judgements about the flavour. Nevertheless, flavour perception is complex phenomenon that involves integrating multi-modal sensory inputs including, taste, olfactory and chemesthetic responses (reviewed in: [25]). Psychophysical curves can be used to characterise the nature of the interaction between two compounds as additive, suppressive or synergistic [26]. If the combined intensity of two compounds can be predicted from the psychophysical curves of each individual compound, the combined intensity of the two compounds is said to be additive. Roughly, additive interactions occur when the intensity of the binary mixture is equal to the summed intensity of unary solutions of both components in the mixture (AB = A + B). If the combined intensity of two compounds is lower than predicted (AB < A + B), the interaction is suppressive [26]. For example, bitterness is typically supressed by the addition of a sweet stimuli [26,27]. Conversely, if the combined perceived intensity of two compounds is higher than predicted (AB > A + B), the interaction is synergistic [26]. As true synergy is difficult to measure, the more general term ‘enhancement’ is used to describe when the intensity of two compounds is greater than the intensity of each compound individually [26]. For example, bitterness tends to be enhanced by the addition of a sour stimuli [26,27]. Importantly, the nature of the interaction between two stimuli can vary based on concentration [26,27].

1.3. Ethanol and Taste/Chemesthetic Stimuli

To better understand how the compounds in alcoholic beverages interact with ethanol to elicit the flavour of alcoholic beverages, several studies have investigated the interactions that occur in binary mixtures of ethanol and spiked aqueous solutions. Although less ecologically valid than using real or model alcoholic beverages, these studies provide insights into how ethanol concentration may modify the perception of specific stimuli in alcoholic beverages.
Three studies have investigated the interaction between organic acids (citric acid, tartaric acid) and ethanol. In general, increased ethanol concentration leads to a decrease in sourness [28,29,30]. However, this trend is typically observed when pH and organic acid concentration are higher [29,30], and at lower organic acid concentrations, it is possible for ethanol to enhance the sourness [30]. However, astringency was not rated in any of these studies despite being elicited by both ethanol and organic acids [31], and thus is a potential confounding variable not yet accounted for in the literature.
The interaction between ethanol and sweet stimuli is concentration-dependent and likely impacted by the choice of sweet compound [28,32,33]. At higher concentrations (>12%), ethanol tends to suppress the sweetness of sugars. In contrast, at lower concentrations (<12%), ethanol can enhance or have no effect on the perceived intensity of sweet stimuli. However, the impacts of sweeteners on the sensations elicited by ethanol are less well understood, suggesting that further research into the interactions between sweet stimuli and ethanol is warranted.
The nature of the interactions between ethanol and other stimuli that elicit bitterness and/or astringency are largely uncharacterized. An aqueous tannin extract solution (0.4%) was described as less bitter and more astringent than when 5% ethanol was added [34]. Martin and Pangborn [28], found that adding ethanol to quinine solutions did not impact bitterness. However, although four concentrations of quinine (0.001% to 0.004%) and four concentrations of ethanol (4 to 16%) were included in the study, a full factorial design was not used, limiting the ability to draw wider conclusions from the results. Overall, more research is required to more fully characterize the interactions between ethanol and prototypical taste and chemesthetic stimuli.

1.4. Other Considerations: Thermal Taste

Although the perception of alcoholic beverages can vary based on their composition, individual differences in taste and chemesthetic perception also exist [35]. For example, thermal tasters (TT) are individuals that reliably experience taste sensations when their tongue is warmed and/or cooled, whereas thermal non-tasters (TnT) do not [36,37,38,39]. TT also rate the intensity of suprathreshold aqueous prototypical tastants and some trigeminal stimuli higher than thermal non-tasters (TnT; [19,36,37,38,39,40,41,42]. TT also rate the dominant orosensations elicited by beer [43] and wine [44] higher than TnT. Recently, Small-Kelly and Pickering [19] compared the responsiveness of TT and TnT to ethanol ranging from 2–10%. Although bitterness intensity was similar for TT and TnT at 2% and 4% ethanol, TT rated the bitterness of 5%, 7% and 10% ethanol solutions higher than TnT. The irritation/burning and sweetness of ethanol increased for both TT and TnT as the concentration of ethanol increased, but no group differences were identified. As only concentrations of ethanol below 11% have been examined to date, possible differences between TT and TnT in the sweetness and/or bitterness of ethanol at higher concentrations are yet to be determined. More research is required to understand how the differences in orosensory perception between TT and TnT impact their perception of alcoholic beverages. In addition, to the best of our knowledge, taste and chemesthetic interactions have not been investigated in TT and TnT. To address these gaps in the literature, we chose to screen all participation for thermal taste status before data collection.

1.5. Study Aims

Although interactions between ethanol and stimuli that elicit key orosensations in alcoholic beverages have been previously investigated, more research is needed to fully characterize the relationships. Here, we investigate the interactions between ethanol and four stimuli (fructose, quinine, aluminium sulphate and tartaric acid), which elicit taste and/or chemesthetic sensations that are common in alcoholic beverages. For each combination, a full-factorial design was used consisting of four concentrations of ethanol approximately representative of major beverage categories (0%-dealcoholized, 5%-beer, 13%-wine and 23%-spirits) and four concentrations of each stimulus (absent, low, medium and high). Trained participants rated six orosensations (sweet, sour, bitter, burning/tingling, astringency and other) when evaluating the samples using the gLMS. This strategy allowed for the interactions of both dominant and non-dominant sensations to be captured. In addition, the descriptive anchor terms on the gLMS allow for the ecological validity of the observed differences in intensity ratings to be characterized. Further, we were able to determine whether the increased orosensory responsiveness of TT compared to TnT, extends to binary mixtures, and whether the nature of the interactions differ based on thermal taste status. Taken together, the findings provide a more comprehensive understanding of the interactions between ethanol and taste/chemesthetic stimuli.

2. Materials and Methods

The study was divided into six 1-hour sessions. First, participants underwent thermal taste status screening (Session 1) followed by orosensory training (Session 2). Next, during the data collection phase, the order of Sessions 3A, 3B, 3C, 3D was randomized across participants. Although participants were encouraged to complete the full study, this randomization allowed for data from participants who completed a minimum of three sessions to be included, allowing for an increased sample size. Full details of the sessions are given below and an overview is provided in Figure 1.
Initially, a convenience sample of 142 participants was recruited from Brock University and the surrounding community to Session 1. Participants were eligible for the study if they were 19 to 40 years old, self-reported non-smokers, were free of tongue damage or abnormalities and did not have severe food allergies. Gender differences in taste perception exist [39,45], so to reduce their potential confounding effects, given our relatively small sample size, only female participants were eligible for the study. At the start of Session 1, participants were oriented to the gLMS and practiced using the scale by rating five remembered sensations. Participants that incorrectly rated the “brightness of a dimly lit restaurant” higher than the “brightness of the sun when staring directly at it” were also excluded from the study (n = 7). All data were collected in individual sensory booths at Brock University. To improve retention, participants were paid a modest honorarium for their participation or were provided credit towards select courses. Written informed consent was obtained from all participants. All procedures were cleared by the Brock University Bioethics Research Board (17-168) and were in accordance with the Declaration of Helsinki.
48 participants (29 TT and 19 TnT) completed Session 2. Others were excluded because they were non-classifiable (54), they dropped out of the study (10 TT, 3 TnT) or they were identified as TT (20) after the recruitment target for TT had been met. The number of participants per session varied slightly as follows; Session 3A (21 TT and 13 TnT), Session 3B (22 TT and 14 TnT), Session 3C (22 TT and 15 TnT) and Session 3D (21 TT and 14 TnT). Overall, 18 TT and 13 TnT completed all six sessions.

2.1. Thermal Taste Screening (Session 1)

Thermal taste screening was performed using the methods of Mitchell et al. [46], which are an adapted version of the methods first used by Bajec and Pickering [37]. Readers are referred to Appendix A for full details of the TTS screening protocol. Of the 135 individuals that completed Session 1, 59 TT, 22 TnT, and 54 non-classifiable participants were identified.

2.2. Training (Session 2) and Data Collection (Sessions 3A–3D)

2.2.1. Orosensory Stimuli

To investigate the interactions in alcoholic beverages, four stimuli were selected to represent commonly elicited sensations: sweet (D-Fructose UltraPure Grade; BioShop, Burlington, ON, Canada), bitter (Quinine monohydrochloride; SAFC Supply Solutions, St. Louis, MO, USA), sour (L-(+)-Tartaric acid; SAFC Supply Solutions, St. Louis, MO, USA) and astringent (Aluminium sulphate; Sigma-Aldrich, St. Louis, MO, USA). A literature search was conducted to identify potential concentrations for each stimuli [37,47,48,49,50]. Two rounds of bench testing followed (data not shown), leading to the identification of three concentrations of each stimuli (low, medium and high; Table 1). The aim was to select concentrations for the stimuli that were perceptually different, miscible with all ethanol levels, and tolerated by participants.
Three ethanol (Beverage grade, Ethyl Alcohol 95% Kosher, Storechem Alcohols Ltd., Burlington, ON, Canada) concentrations were chosen to represent different beverages types; 5% (v/v) for beer, 13% (v/v) for wine and 23% (v/v) for distilled spirits [11]. Although most distilled spirits are typically 35–45% ethanol, 23% ethanol was chosen to ensure that the total volume of pure ethanol each participant was exposed to during each session was below one standard drink. This choice increased the participants’ tolerance of the samples and reduced the risk of inebriation, allowing for all samples for each taste stimulus and ethanol combination to be evaluated during the same session. Distilled spirits are often diluted to this concentration before sensory evaluation in industry [51]. Furthermore, 23% is below the upper discrimination taste threshold for ethanol, which Lachenmier et al. [52] estimate is approximately 40%. Samples prepared from mixing two stimuli (ethanol and one other) will be referred to as binary solutions. In contrast, samples with only one stimulus (ethanol or one other) will be referred to as unary solutions.
A concentrated stock solution of each stimulus was prepared volumetrically with pure water (Millipore RiOs 16 Reverse Osmosis System, Millipore Sigma, Burlington, MA, USA). Stock solutions were well mixed and then further combined/diluted with pure water order to obtain the desired unary and binary solutions (see below for full details). Tartaric acid and fructose solutions (stock and samples) were discarded within 7 days of preparing the stock solution, regardless of when the final samples were prepared. Similarly, quinine solutions and alum solutions were discarded within 36 h and 12 h, respectively. Solutions were stored in the fridge when not in use and sample solutions were brought to room temperature on the day of testing.
During Sessions 2 and 3A–3D, 10 mL blind-coded (3-digit) samples were presented to participants in 2 oz portion cups with lids to prevent ethanol evaporation. Unless otherwise noted, all samples were evaluated using a sip-and-spit protocol. Participants were instructed to take the entire sample, swirl for 5 s, expectorate and then rate the maximum intensity of the sensation on a gLMS 10 s after expectorating. Participants were required to rinse with filtered water between samples, and soda crackers were available ad libitum. All intensity ratings were collected using individual gLMS [53].

2.2.2. Session 2

As participants were recruited from the community and did not have any formal sensory evaluation training, a brief orosensory training session was held before data collection. Each participant was required to complete three tasks (Figure 1), which were administered using Compusense Cloud (Compusense Inc., Guelph, ON, Canada).
First, as part of the ranking task, participants were asked to familiarize themselves with the sensation elicited by unary solutions representing sweet (fructose), astringency (aluminium sulphate), sour (tartaric acid) and bitter (quinine). One sensation at a time, participants were presented with a set of three samples, one each of the low, medium and high intensity concentrations. For each set of solutions, participants were told what the primary orosensation elicited was and asked to familiarize themselves with it (Table 1; for example, sweet for fructose). To ensure that participants were actively engaged in the familiarization task, they were asked to rank the three samples in order of intensity. Both the order of sample sets and the order of samples within a set were randomized. One-minute breaks were enforced between sample sets.
Second, as part of the identification task, participants were presented with a flight of four samples: one each of the medium intensity fructose, aluminium sulphate, tartaric acid and quinine. Participants were asked to taste each sample one at a time and identify the primary sensation elicited from six options (sweet, bitter, sour, astringent, no sensation or other). As the aim of this task was to help train participants, after each sample feedback was automatically provided for correct (“Great job! Sample (3-digit code) is (correct orosensation)”) or incorrect responses (“Sample (3-digit code) typically tastes (correct orosensation)”). Samples were randomized and one-minute breaks were enforced between sample sets.
Third, to familiarize participants with burning/tingling, they were presented with a ~5 mL sample of aqueous Capsaicin (Sigma-Aldrich, St. Louis, MO, USA). Participants were asked to extend their tongue and briefly dip the tip into the solution. The capsaicin solution was prepared in two steps. First a saturated stock solution was prepared by adding 30.5 mg/L of capsaicin to water and stirring gently. Second, 1.965 mL of the supernatant was further dissolved in water, yielding a maximum capsaicin concentration of 1.2 mg/L. Bench testing showed that it could reliably elicit a mild burning/tingling sensation, which was well tolerated by all participants.

2.2.3. Session 3A–3D

Data collection was performed across four sessions where each session was used to investigate the interaction between ethanol and one stimulus: 3A (fructose), 3B (aluminium sulphate), 3C (tartaric acid) and 3D (quinine). Although the samples varied between sessions based on the stimulus of interest, the same method was used in each session. To illustrate the method, a detailed description of Session 3A is provided below and can be used as a model for Sessions 3B–3D.
In Session 3A, participants were presented with sixteen 10 mL samples consisting of 1 pure water, 3 unary solutions of ethanol (5%, 13%, 23%), 3 unary solutions of fructose (low, medium, high) and 9 binary solutions of ethanol and fructose. Binary solutions were prepared using a 3 × 3 design so that one of each combination of ethanol (5%, 13%, 23%) and fructose (low, medium, high) was included. Samples were presented in randomized order. Using the sip-and-spit protocol from Session 2, participants tasted each of the samples and rated the maximum intensity of the sweet, sour, bitter, astringency, burning/tingling and other on a separate gLMS for each sensation. To reduce the potential effects of ethanol desensitization on intensity ratings [54], minimum 2-minute breaks were enforced between samples, the maximum ethanol concentration of any one sample was 23% and participants were instructed to rinse with water at least once between samples. Water and soda crackers were also available ad libitum if participants desired further palate cleansing between samples. As nasal irritation thresholds for ethanol are up to 1000 times lower than ethanol taste thresholds, participants wore nose clips during all tastings [15].

2.3. Data Analysis

All data analysis was performed using XLSTAT Version 2020.3.1 (Addinsoft, New York, NY, USA) and Microsoft® Excel® for Mac Version 16.43 (Microsoft®). Significance for all analyses was set at P = 0.05. All graphics were generated using in RStudio Version 1.1.463 (RStudio, Inc., Boston, MA, USA) using ggplot2 (Version 3.2.1; [55]) and gridExtra Version 2.3 [56].

2.3.1. Data Treatment

Maximum intensity ratings (sweet, sour, bitter, astringent, burning/tingling) were log transformed using the formula (log10 (intensity rating +1)) for all gLMS responses to improve normality [37,40]. Although log transformations do not always improve the normality of data collected using the gLMS [57], a visual comparison of histograms showed that log transformation improved the normality of the data (data not shown). The non-normality of the log transformed data is likely attributable to the large number of absent or low intensity responses for the non-dominant orosensations elicited by the stimuli.
Unary solutions of ethanol (5%, 13%, 23%) and water were tasted in all four data collection sessions (3A–3D). Data for participants that did not complete all data collection sessions were excluded to eliminate context effects due to differences in the binary solutions presented across the sessions. In addition, the mean of log transformed intensity ratings were calculated by averaging responses for all four sessions. As the other unary solutions (fructose, aluminium sulphate, tartaric acid, quinine) and all binary solutions were only tasted once, no means were calculated and data from all participants that completed the session were included.

2.3.2. Orosensory Training

Results from orosensory training were examined to briefly assess the discrimination and identification ability of participants (29 TT, 19 TnT). The discriminatory ability of TT and TnT was assessed by counting the number of times each participant correctly ranked the low and high intensity sample of each stimuli (fructose, aluminium sulphate, tartaric acid and quinine) during the ranking task. The ability of participants to identify orosensations was assess by counting the number of stimuli correctly identified by each participant during the identification task. To assess whether TT and TnT performed equally, Mann–Whitney U was used to compare scores for both tasks as data was not normally distributed (Shapiro Wilks, P < 0.001).

2.3.3. Unary Solutions

Data for the unary solutions from Sessions 3A–3D were analyzed to better characterize the perception of ethanol. Boxplots were generated for each orosensation and 2-way ANOVA with interactions was used to investigate the impact of thermal taste status (TT and TnT) and ethanol concentration (5%, 13%, 23%) on mean orosensory ratings. Effect size was calculated for all main effects and interactions to assess the relative importance of each. Effect sizes were considered small, medium or large, when η2p values exceeded 0.01, 0.06, or 0.140, respectively [58]. Although the data were not normally distributed (data not shown), ANOVA is largely robust to deviations from normality. A stimulus concentration*TTS interaction has been reported for saccharine but not sucrose or sodium chloride [40]. Thus, as most studies on orosensory responsiveness and TTS included only a single concentration of a tastant or did not test for interactions [37,39,40,59], the decision to employ ANOVA despite this limitation was made. Importantly, ANOVA allowed for the interaction between stimulus concentration and thermal taste status to be tested, which is not possible to the best of our knowledge using the non-parametric alternative Kruskal–Wallis. As a precaution, non-parametric statistics (Kruskal–Wallis) were also applied using six groups (TT-low, TT-medium, TT-high, TnT-low, TnT-medium, TnT-high) and confirmed that similar results were observed. Furthermore, all data was log transformed (see Section 2.3.1) as transformation improved normality.
Participants also tasted low, medium and high intensity solutions of fructose (Session 3A), aluminium sulphate (Session 3B), tartaric acid (Session 3C) and quinine (Session 3D). Intensity scores for the unary solutions of each stimulus (low, medium, high) were extracted from the respective sessions and the same data analysis approach used to investigate ethanol perception was used. Boxplots were generated to visualize the data and used to select the attributes for further analysis. Two-way ANOVA comparing intensity ratings by concentration (low, medium, high) and thermal taste status (TT, TnT) were completed for the sweetness of fructose, the astringency and sourness of aluminium sulphate, the sourness and astringency of tartaric acid, and the bitterness of quinine.

2.3.4. Binary Mixtures

Data for the binary solutions from Sessions 3A–3D were analyzed to better characterize interactions between ethanol and four stimuli (fructose, aluminium sulphate, tartaric acid, quinine). Data from each session were assessed separately and the approach described below for ethanol and fructose (Session 3A) was applied to the other sessions. Separate three-way ANOVAs were performed to compare the intensity of the sweetness, bitterness, sourness, astringency and burning/tingling elicited for the nine binary solutions of fructose and ethanol. Factors included in the model were thermal taste status (TT, TnT), ethanol concentration (5%, 13%, 23%), fructose concentration (low, medium, high) and all two-way interactions.
Binary interactions between two stimuli can be modelled using the isobole method to better determine whether true enhancement or suppression has occurred [60,61,62]. Importantly, good dose–response models are required for unary solutions of both components of the binary mixture as they are used to generate the values used in the interaction calculations [60]. To identify good candidates for modelling using the isobole method, simple linear regression was performed to determine whether stimulus concentration (log transformed) could be used to significantly predict intensity ratings for each sensation (sweet, sour, bitter, astringent or burning/tingling) for each set of unary solutions (ethanol, fructose, tartaric acid, aluminium sulphate quinine). Two candidates were identified for modelling: the astringency of aluminium sulphate/ethanol binary solutions and the bitterness of quinine/ethanol binary solutions. In both cases, linear models for both stimuli predicted the intensity of the orosensation of interest. The index of interaction (I) was calculated for each pair using the formula (cA/CA) + (cB/CB), where A and B are the two compounds in the binary mixture and “cA” and “cB” are the actual concentration of the compounds A and B. “CA” and “CB” are the concentrations of compounds A and B needed to achieve the same intensity as in the binary mixture, as predicted from the linear models of the unary solutions. The compounds in the binary mixture supressed, enhanced or had no effect on the perception of orosensations when “I” was above 1.1, below 0.9 or between 0.9 and 1.1, respectively [62].

2.3.5. Other Considerations

Ethanol is a complex stimulus that elicits multiple orosensations and the number of sensations elicited varies between participants [14]. To determine if/how these patterns are impacted by thermal taste status, the number of scales used by TT and TnT was compared. Similarly, to intensity scores, only the data of participants that completed all data collection sessions were included. Scale use was calculated in two steps. For each session (3A–3D), the number of scales used was determined by counting the number of scales with ratings above “no sensation” (0 on gLMS) for each concentration of ethanol (5%, 13%, 23%) and water. As participants were provided with six scales (sweet, bitter, sour, astringent, burning/tingling, other), scores ranged for 0 to 6 (0 = no scales, 6 = all scales). Second, the mean number of scales used for each participant was calculated by averaging the number of scales used for each sample in Sessions 3A–3D. As the data was not normally distributed, Mann–Whitney U (TT vs. TnT) and kernel density estimates were generated for TT and TnT to compare the distribution of scores. Furthermore, as Mann–Whitney U compares group medians, any differences in scale use found will not be driven by outliers. The same approach was also used to compare the number of scales used by TT and TnT in response to the other unary (fructose, aluminium sulphate, tartaric acid, quinine) and all binary mixtures. However, unlike ethanol and water, these samples were only tasted by participants once, so raw scores were used instead of means.

3. Results

3.1. Orosensory Training

Although the training provided in Session 2 was brief, the participants’ ability to discriminate the samples and correctly identify the sensations was considered sufficient. During the ranking task, 82% (24 TT, 15 TnT) of participants who completed Session 2 (29 TT; 19 TnT), were able to discriminate the low intensity and high intensity samples for all stimuli by ranking each set in the correct order. The remaining participants were also largely successful as they ranked three (4 TT, 4 TnT) or two (1 TT) of low and high intensity samples in the correct order. The number of stimuli for which low and high concentrations were correctly discriminated did not differ between TT (M = 3.8, SD = 0.5) and TnT (M = 3.8, SD = 0.4), (Ustandardized > 0.001, P = 0.976). During the identification task, 28 participants (58%; 16 TT, 12 TnT) correctly identified all four stimuli. Of the remaining participants, 11 correctly identified three stimuli (7 TT, 4 TnT), seven correctly identified two stimuli (4 TT, 3 TnT) and two correctly identified two stimuli (2 TT). The number of stimuli correctly identified did not differ between TT (M = 3.3, SD = 1.0) and TnT (M = 3.5, SD = 0.8), (Ustandardized > 0.001, P = 0.555). As TT and TnT had sufficient and equivalent abilities to both identify and discriminate the key orosensations, no participants were excluded based on these results.

3.2. Unary Solutions

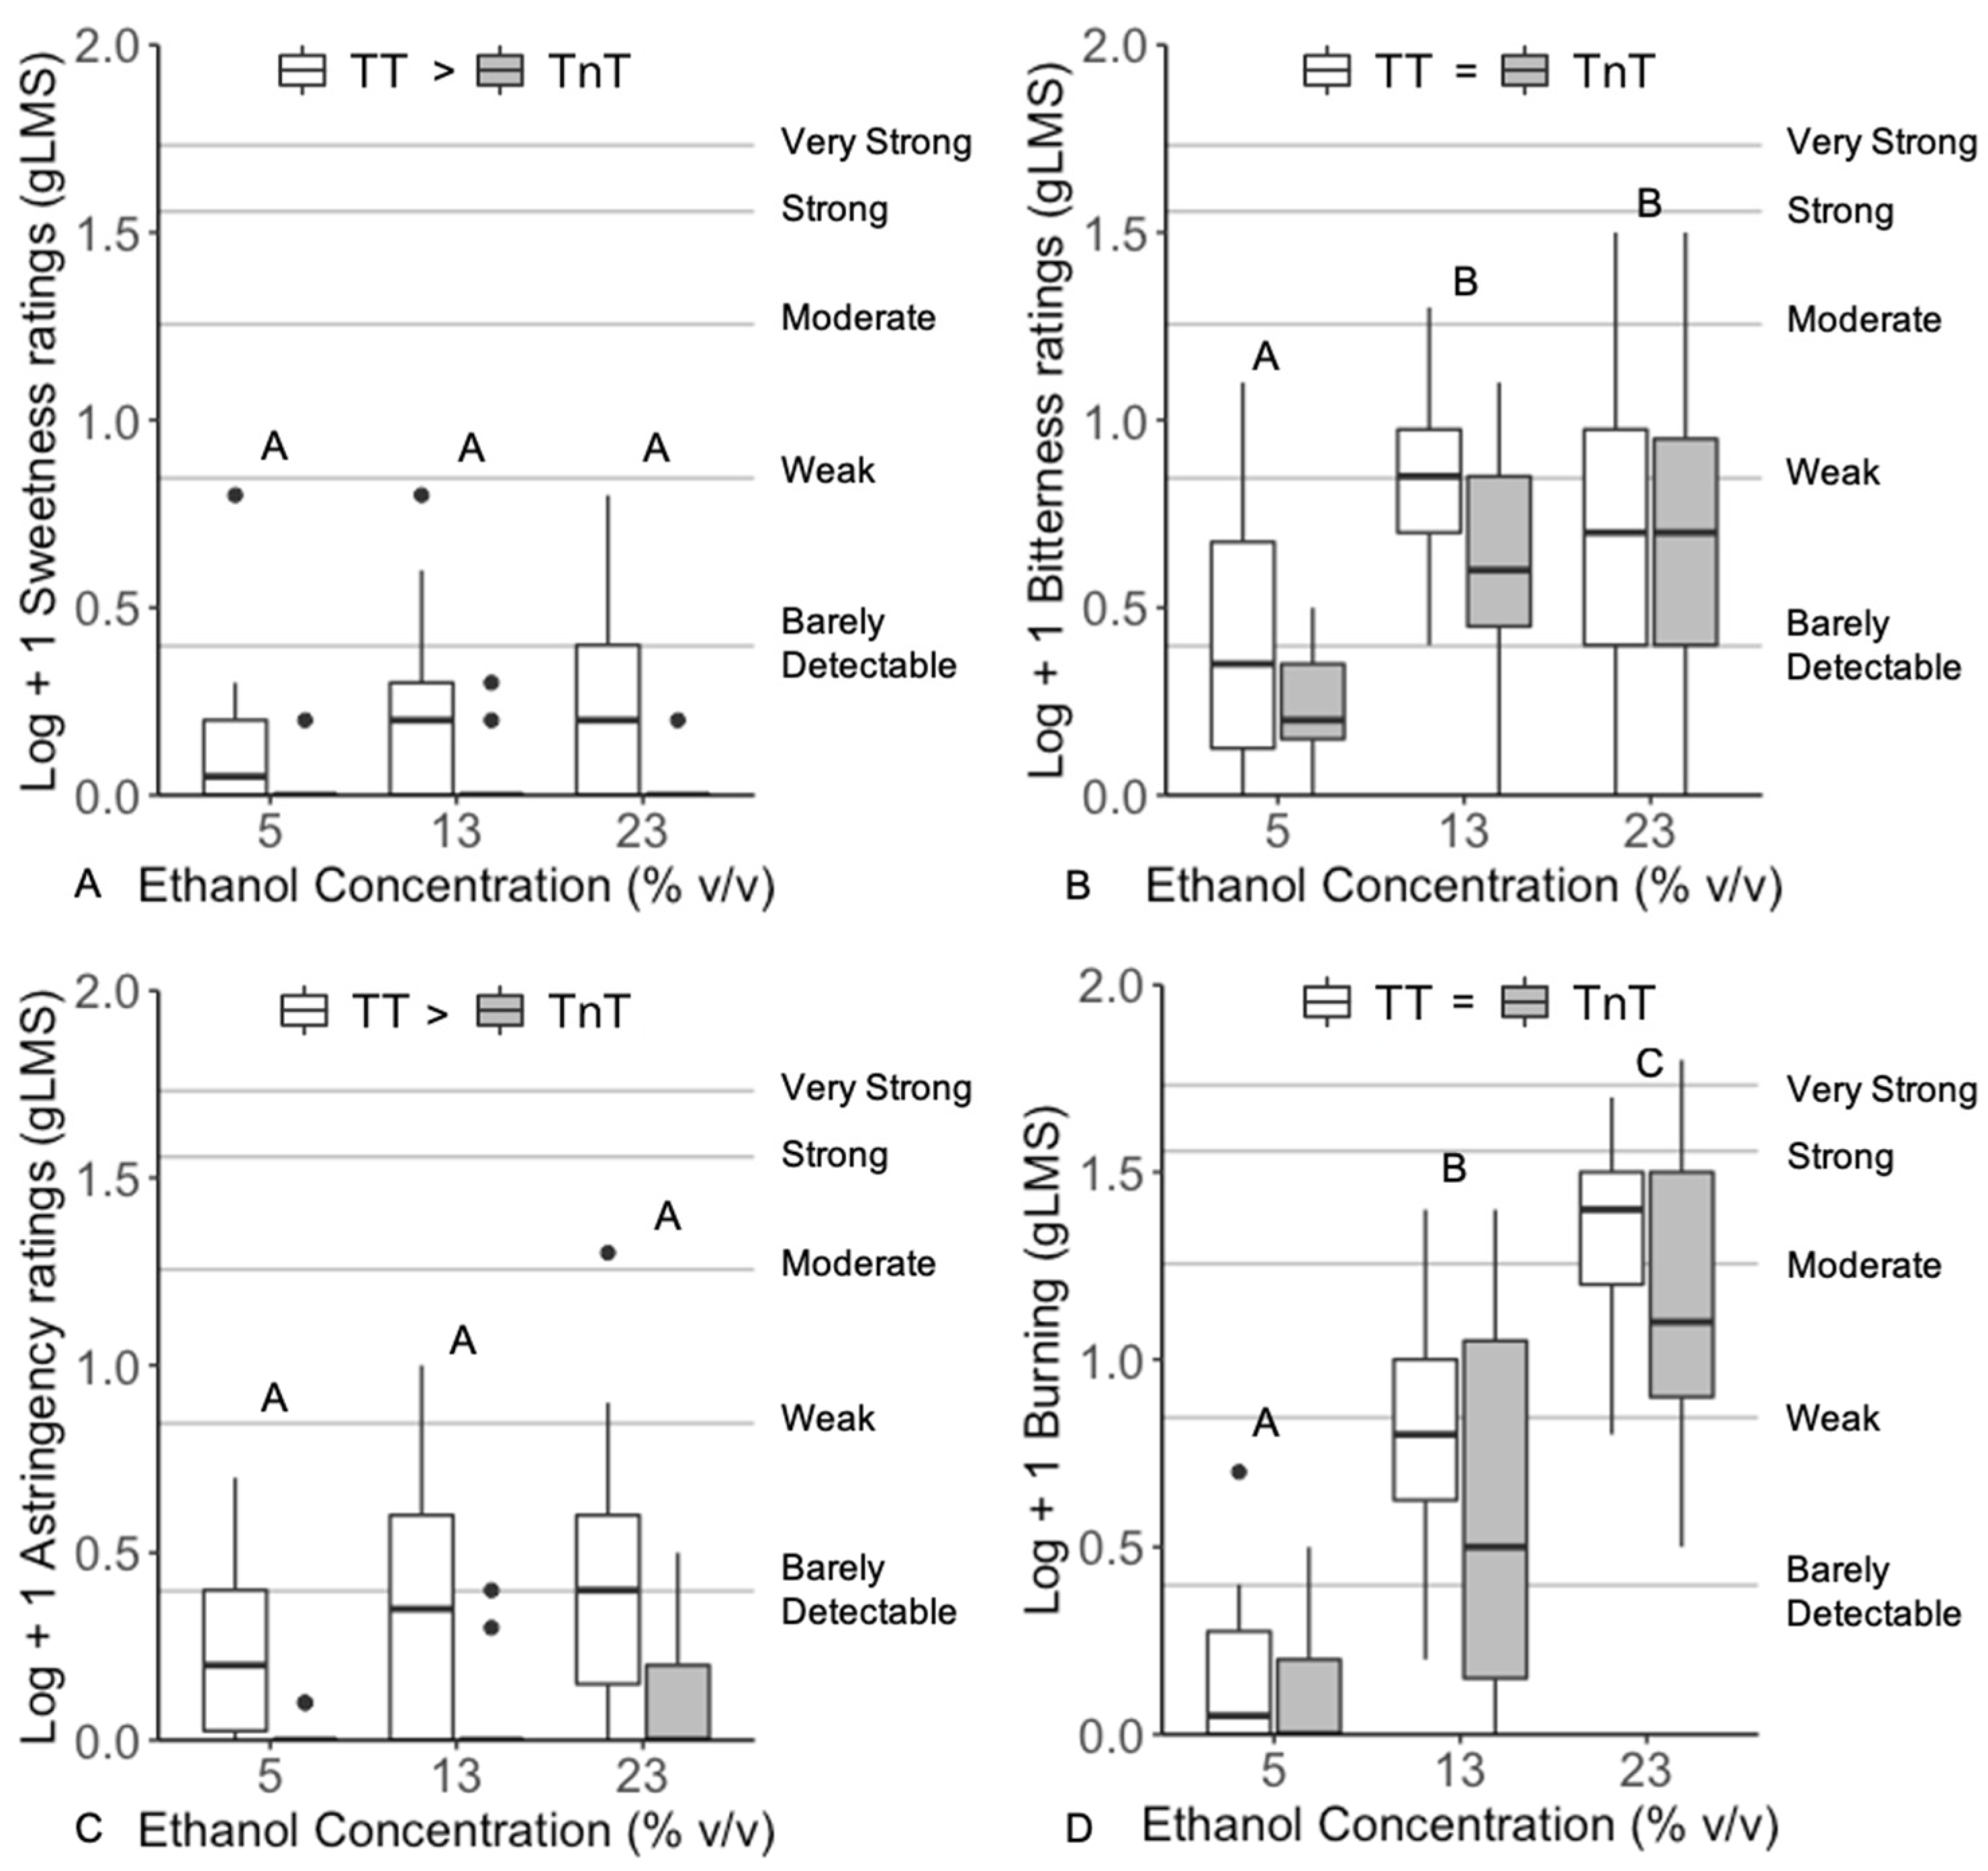
Overall, ethanol elicited sweetness, bitterness, astringency and burning/tingling but not sourness, with intensity varying with concentration (Figure S1). To better characterize the sensations elicited, 2-way ANOVAs were performed for each sensation with thermal taste status (TT and TnT) and concentration (5%, 13%, 23%) as the independent variables (Figure 2, Table S1). Increasing ethanol concentration led to an increase in bitterness (F(2, 86) = 10.2, P < 0.001) and burning/tingling (F(2, 86) = 95.9, P < 0.001). Similar non-significant results were found for astringency (F(2, 86) = 2.7, P = 0.070). The sweetness of ethanol did not vary with ethanol concentration (F(2, 86) = 1.2, P = 0.294). TT were significantly more responsive to sweetness (F(1, 86) = 17.4, P < 0.001) and astringency (F(1, 86) = 23.0, P < 0.001), while the similar results for bitterness (F(1, 86) = 3.6, P = 0.059) and burning/tingling (F(1, 86) = 3.1, P = 0.083) were not significant. When effect sizes were compared (Table 2), large effects were found based on ethanol concentration for the dominant sensations (bitterness, burning/tingling), and for thermal taste status for the non-dominant intensity sensations (sweetness, astringency). No significant interactions were found, suggesting the response patterns of TT and TnT do not vary based on ethanol concentration.
Unary solutions of fructose and quinine each elicited one primary sensation (Figures S2 and S3), sweetness and bitterness, respectively. In contrast and as expected [31,63], tartaric acid and aluminium sulphate each elicited two orosensations (sourness and astringency), although the dominant sensation differed between the two (Figures S4 and S5). For these sensations/stimulus pairs (Figure 3, Table S1), 2-way ANOVAs were used to compare the intensity ratings based on thermal taste status (TT and TnT) and concentration (low, medium, high). As expected, increased concentration also led to increased intensity for the dominant sensations elicited by fructose (sweetness; F(2, 101) = 58.0, P < 0.001), quinine (bitterness; F(2, 104) = 3.6, P = 0.030), tartaric acid (sourness; F(2, 110) = 18.5, P < 0.001) and aluminium sulphate (astringency; F(2, 104) = 15.5, P < 0.001). The intensity of non-dominant sensations also increased significantly for aluminium sulphate (sourness; F(2, 104) = 11.9, P < 0.001) but not for tartaric acid (astringency; F(2, 110) = 1.9, P = 0.149). TT were more responsive than TnT to the sweetness of fructose (F(1, 101) = 15.0, P < 0.001) and the sourness of aluminium sulphate (F(1, 104) = 13.2, P < 0.001). A significant interaction between thermal taste status and aluminium sulphate concentration was found for the perception of sourness (Figure 3E). Whereas TT rated the sourness of the high concentration of aluminium sulphate as more intense than the low concentration, TnT ratings did not differ for the same samples (F(2, 104) = 4.2, P = 0.018). No other main effects nor interactions were found (Table S1).

3.3. Binary Mixtures

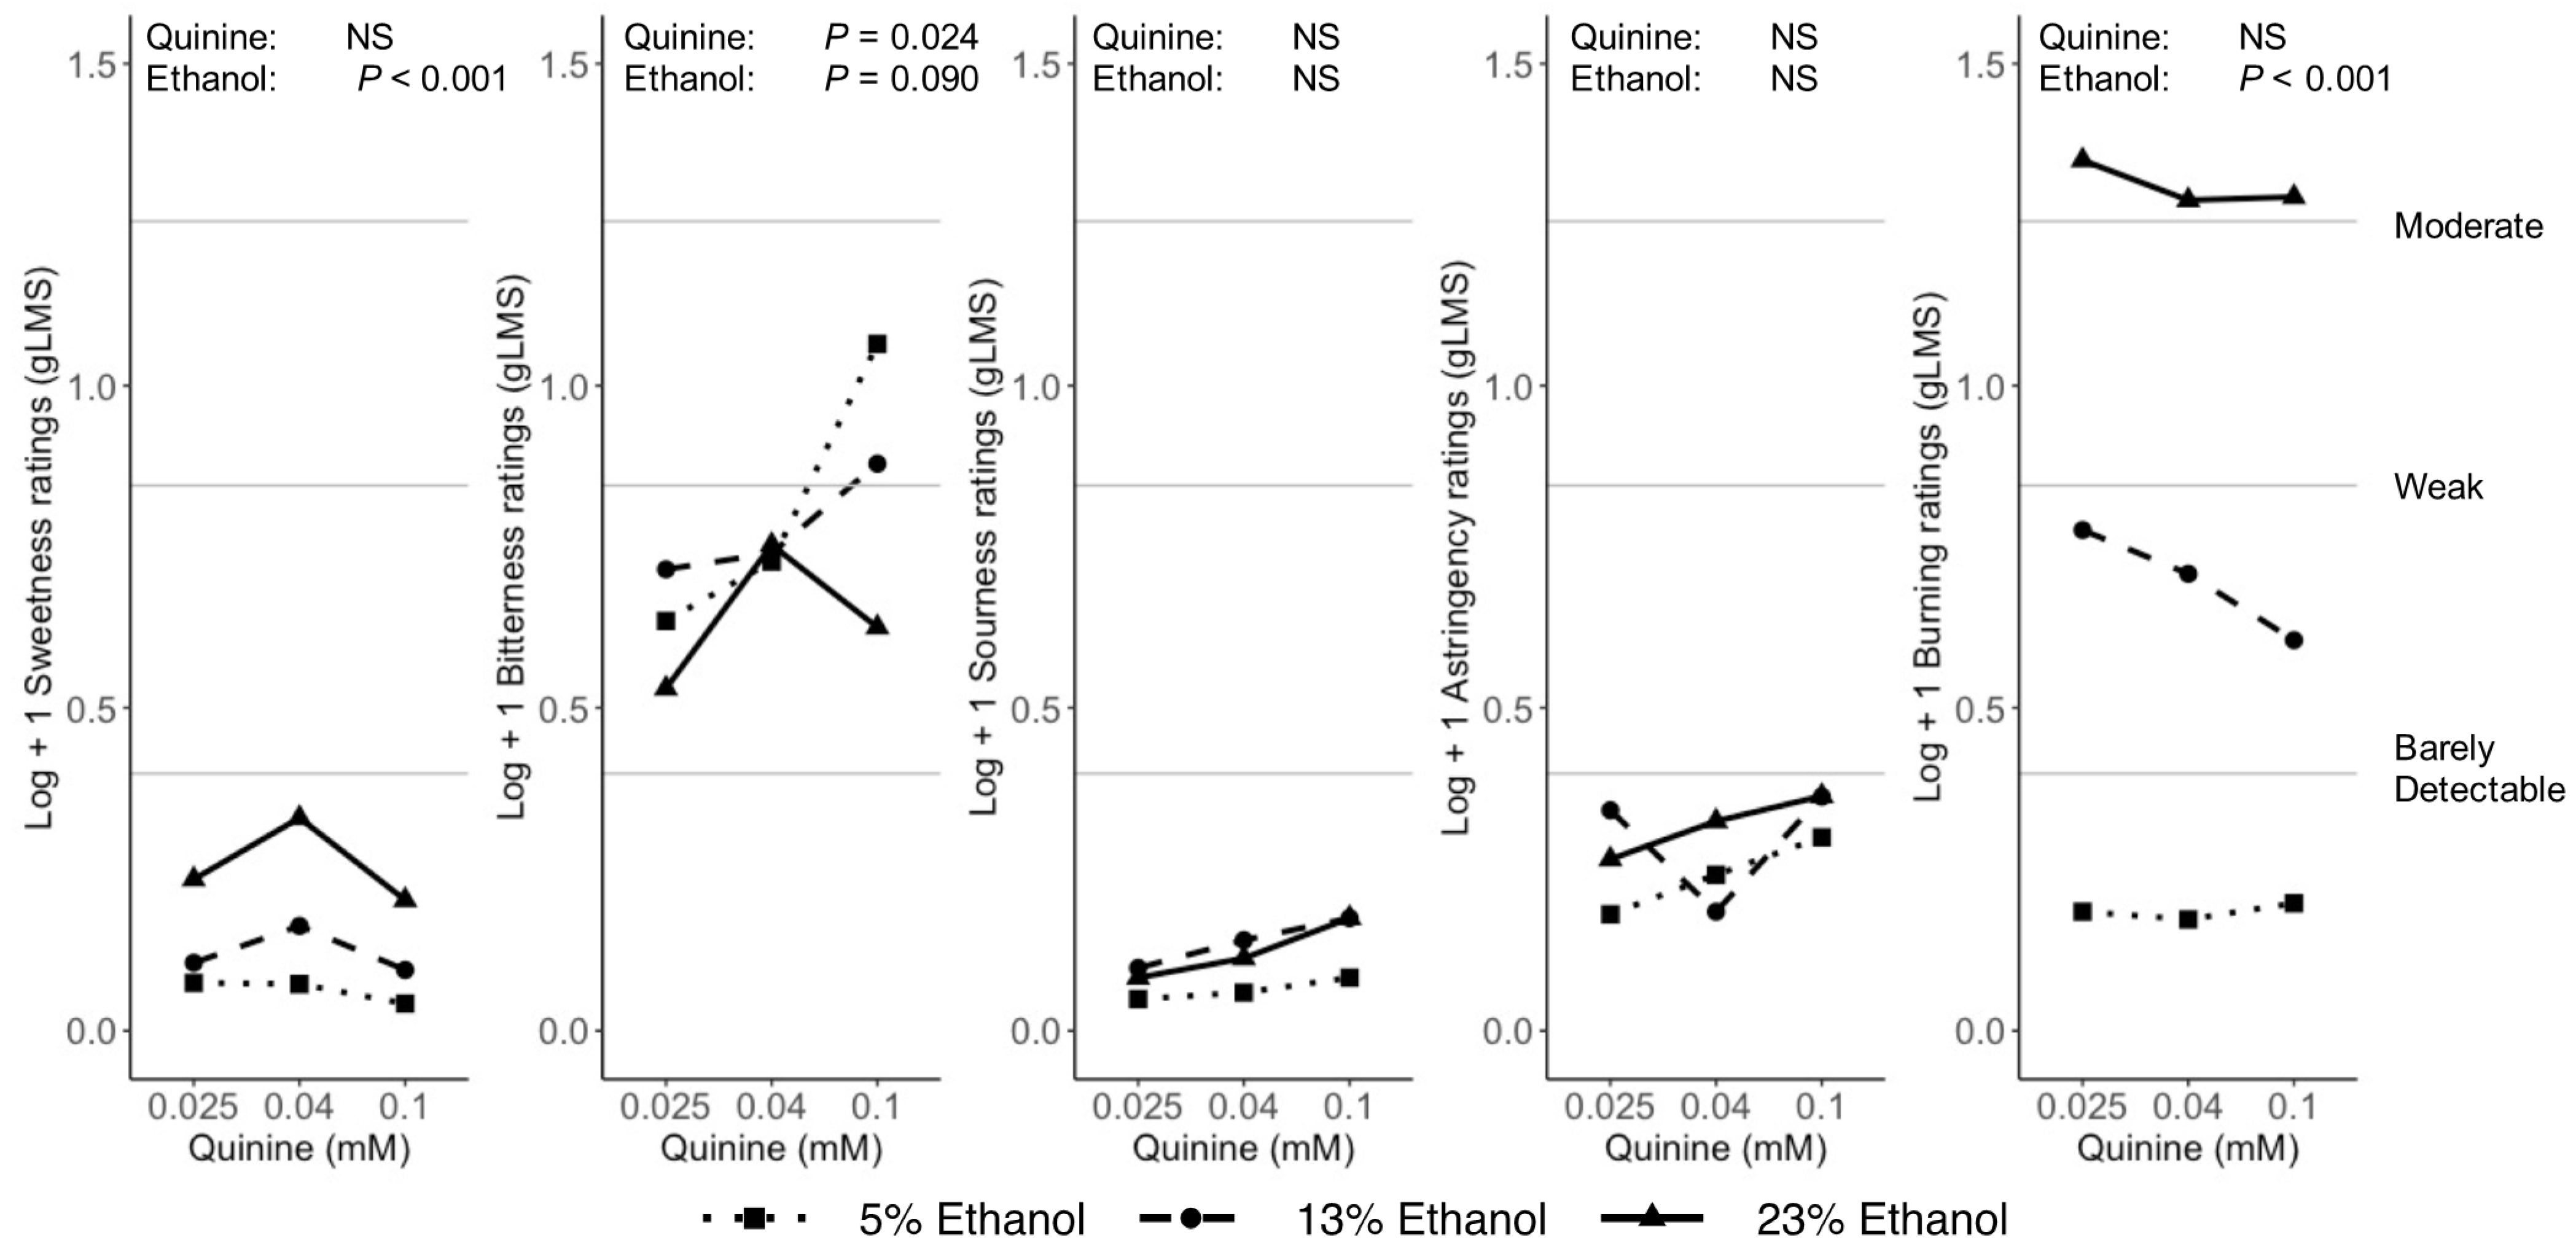
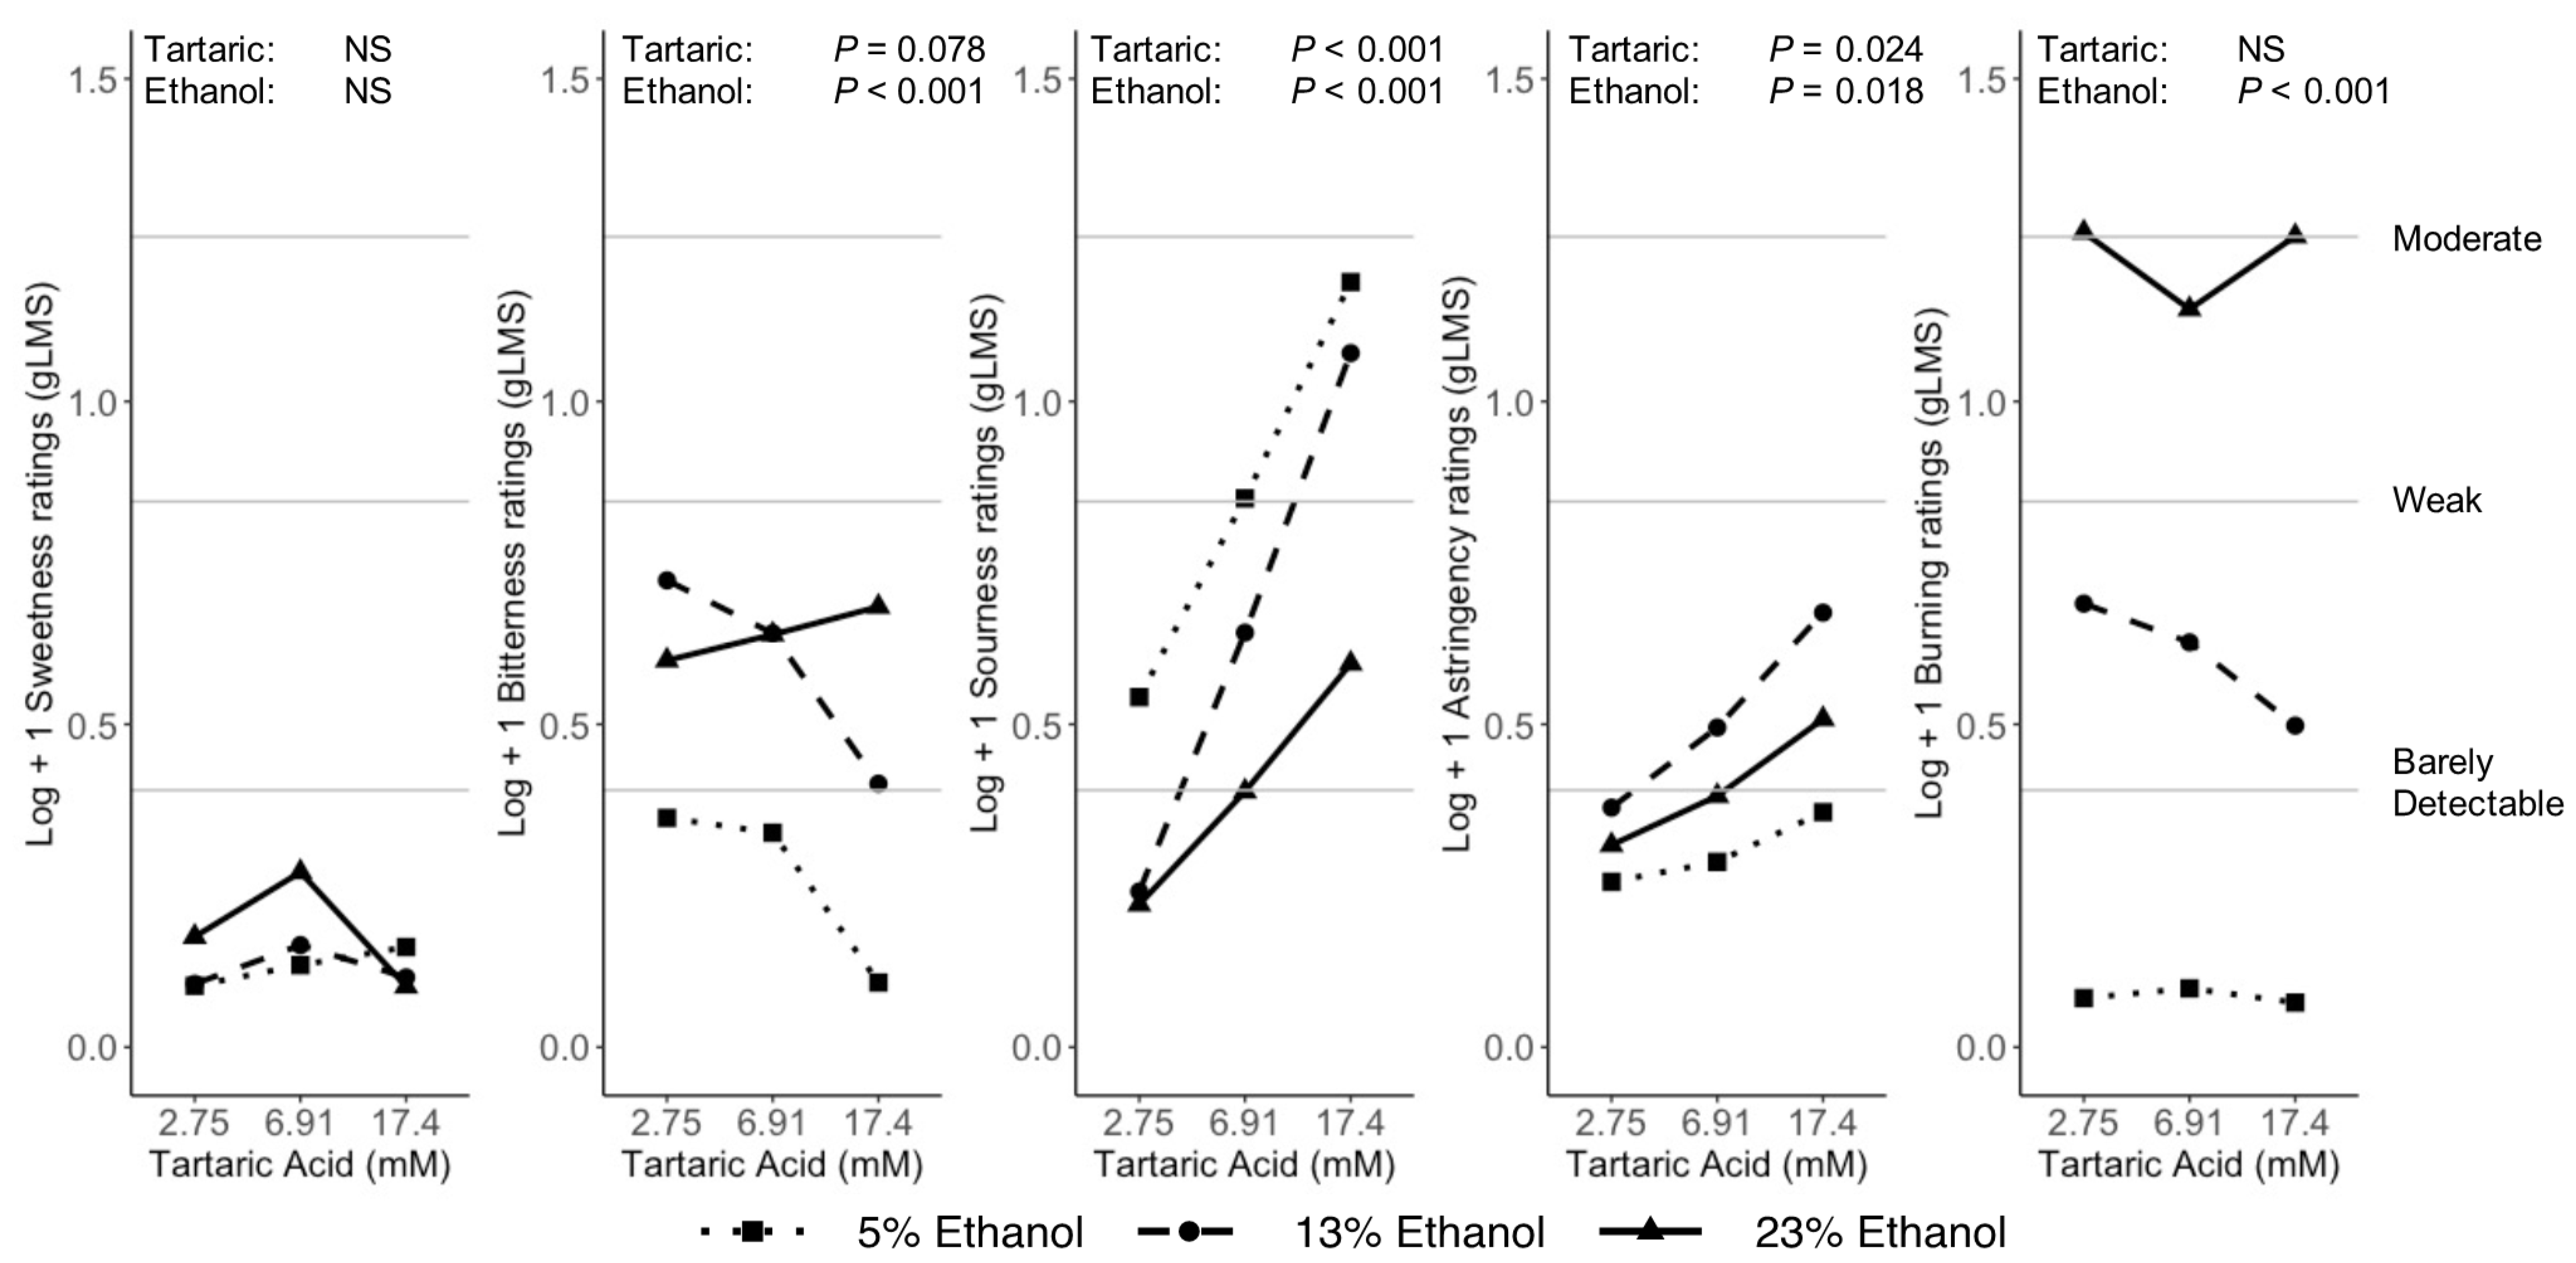
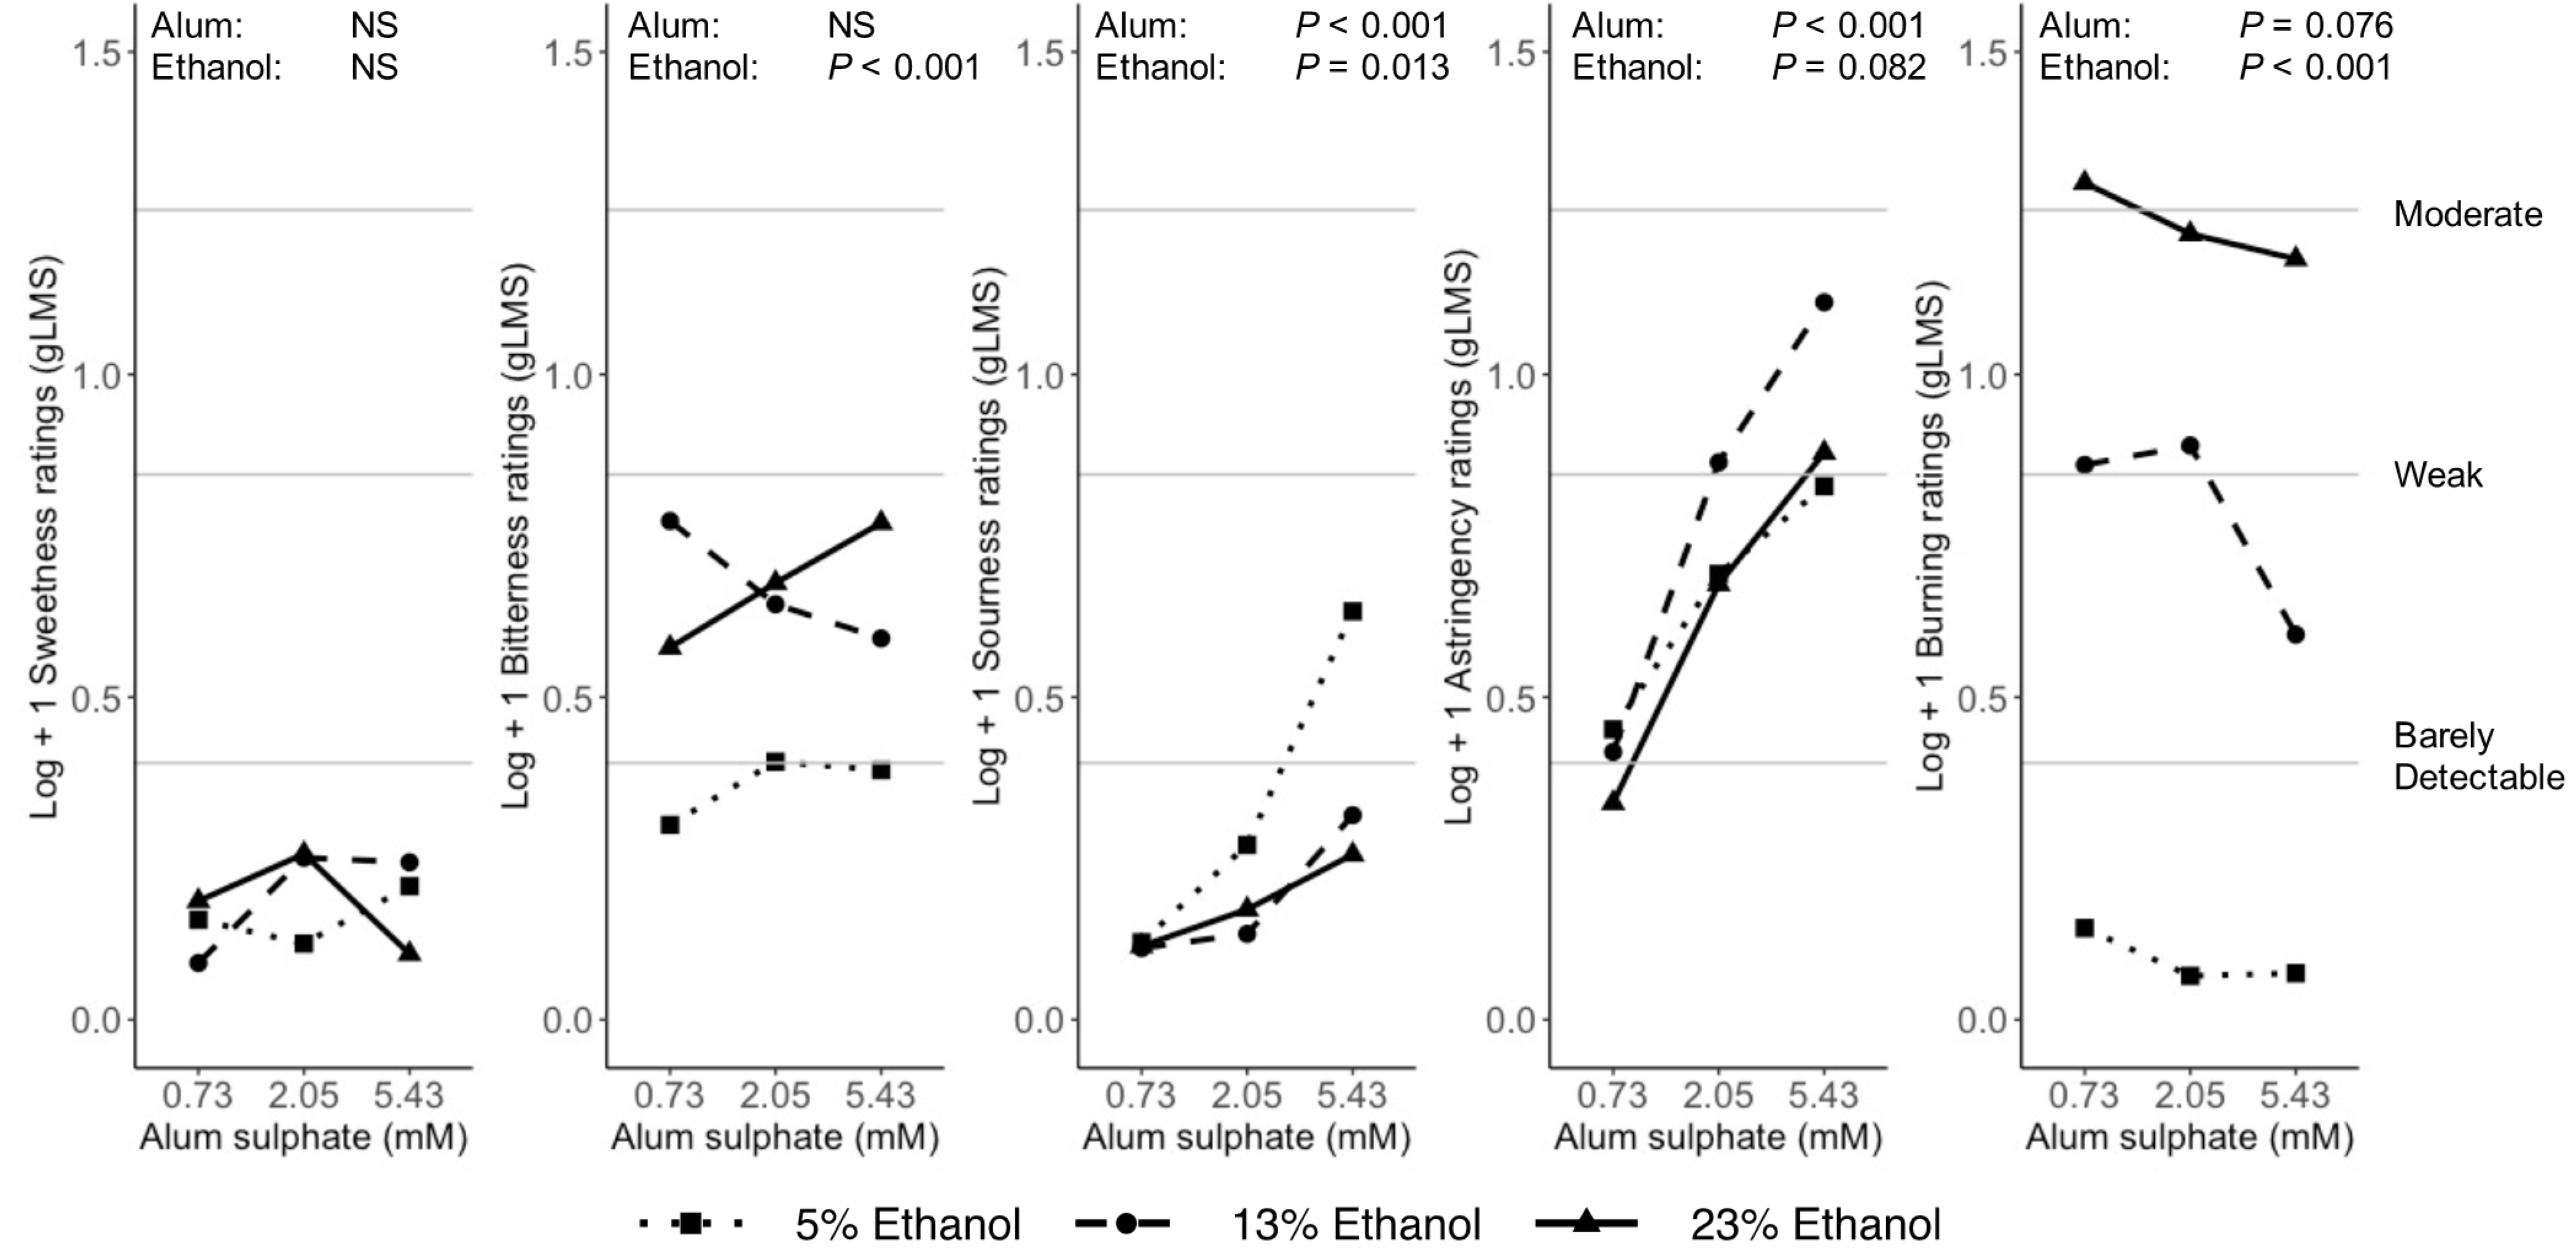
To better understand how differences in the composition of alcoholic beverage impact their perception, binary mixtures of ethanol and four stimuli (fructose, aluminium sulphate, tartaric and quinine) were examined (Figure 4, Figure 5, Figure 6 and Figure 7). Results of 3-Way ANOVAs comparing the impacts of ethanol concentration (5%, 13%, 23%), changes in the concentration of the other stimuli (low, medium, high) and thermal taste status (TT, TnT) are provided in Table S2 and results are described below.
Ethanol concentration significantly impacted the perception of bitterness and burning/tingling and similar results were observed across all binary mixture types. In binary mixtures of ethanol with fructose, tartaric acid or aluminium sulphate, samples with 5% ethanol were less bitter than those with 13% or 23% ethanol. In contrast, bitterness did not vary significantly with ethanol concentration in quinine/ethanol mixtures. For all binary solution types, as ethanol concentration increased, ratings of burning/tingling also increased significantly. Regardless of the type of stimulus used in the binary mixture with ethanol, the burning/tingling of 5%, 13% and 23% had a similar intensity.
Ethanol concentration impacted the perception of sweetness, sourness and astringency (Figure 4, Figure 5, Figure 6 and Figure 7), although effects varied based on the binary mixture type.
Sweetness decreased as ethanol concentration increased in mixtures with fructose, but the opposite was true in mixtures with quinine. The sweetness did not vary with alcohol concentration in mixtures with aluminium sulphate or tartaric acid. Sourness decreased significantly as ethanol concentration increased in binary mixtures with tartaric acid and aluminium sulphate. No difference in sourness based on ethanol concentration was found in mixtures with fructose or quinine. In binary mixtures with tartaric acid (Figure 6), 13% ethanol was the most astringent and 5% ethanol was the least astringent. However, neither 5% nor 13% ethanol differed significantly from the 23% ethanol mixture. In contrast, the astringency in binary mixtures of ethanol and fructose increased between 5% and 13% ethanol, but did not differ between 13% and 23% ethanol (Figure 4). However, a significant interaction between ethanol concentration and thermal taste status showed that this result was only true for TT. Astringency was not impacted by ethanol concentration in binary mixtures with quinine or aluminium sulphate.
The fructose, quinine, tartaric acid and aluminium sulphate concentrations also impacted the perception of their respective binary mixtures (Figure 4, Figure 5, Figure 6 and Figure 7, Table S2). Quinine, aluminium sulphate and tartaric acid concentration predominantly impacted only the orosensations commonly elicited by their respective unary solutions. Increasing the concentration of quinine in binary mixtures with ethanol increased the bitterness (Figure 5). In binary solutions of ethanol and tartaric acid (Figure 6) or aluminium sulphate (Figure 7), both sourness and astringency increased significantly as the concentration of tartaric acid or aluminium sulphate increased. Similarly, increasing the concentration of fructose in binary mixtures with ethanol also increased the sweetness. However, increasing the fructose concentration also resulted in lower intensity of bitterness and astringency (Figure 4).
Thermal tasters had higher mean orosensory ratings than TnT for binary mixtures of ethanol and fructose (sweetness, astringency, burning/tingling), quinine (sweet), tartaric acid (bitter, sour) and aluminium sulphate (sweet, astringent; P < 0.05; Table S2). Significant differences in the burning/tingling of aluminium sulphate were also found based on thermal taste status, although TT and TnT could not be separated by the means separation test (Table S2). Regardless of significance, TT rated all the orosensations elicited by each of the binary mixtures higher than did TnT. An interaction between thermal taste status and ethanol concentration for burning/tingling in binary mixtures of ethanol and quinine showed TT more responsive to 23% ethanol, but not 5% or 13% ethanol. Overall, the results strongly support the hypothesis that TT are more responsive than TnT.

Index of Interaction

The isobole method was used to better characterize interactions in the binary mixtures. First, intensity ratings were modelled based on the concentration of stimuli in the unary solutions (ethanol, fructose, quinine, tartaric acid, aluminium sulphate). Simple linear regression was performed to determine which sensations (sweet, sour, bitter, astringency, burning/tingling) could be used to predict intensity ratings based on unary solution concentrations (Table S3). The intensity of bitterness (F(1, 86) = 14.2, P < 0.001, R2 = 0.14), astringency (F(1, 86) = 4.5, P = 0.038, R2 = 0.05) and burning/tingling (F(1, 86) = 182.6, P < 0.001, R2 = 0.69) could be predicted by ethanol concentration. Similarly, sensations elicited by unary solutions of fructose (sweetness), aluminium sulphate (sour, astringent, bitter), tartaric acid (sourness) and quinine (bitterness) could be predicted from their concentration (Table S3). As expected, the slopes in the linear regressions were consistent with the boxplots for the unary solutions (Figures S1–S5). Based on the regression results, the bitterness of quinine/ethanol mixtures and the astringency of aluminium sulphate/ethanol mixtures were selected for analysis using the isobole method (see Material and Methods—Binary mixtures). In binary mixtures, the bitterness was suppressed for all combinations of ethanol and quinine (Table 3). Similarly, the astringency was suppressed for eight of the nine combinations of ethanol and aluminium sulphate (Table 4). The only exception was 13% ethanol and 2.05 mM aluminium sulphate, where astringency was additive.

3.4. Other Considerations

As TT are more responsive than TnT to the orosensations elicited by both the unary solutions and binary mixtures, we sought to determine whether the number of scales used to describe the samples also differed. Kernel-density estimates were generated for all the samples (Figure 8, Figures S6–S10) and Mann–Whitney U was used to compare the median number of scales used by TT and TnT (Tables S4–S8). TT used significantly more scales than TnT to describe water (U = 169.5, P = 0.001), 5% ethanol (U = 143.0, P = 0.009), 13% ethanol (U = 153.0, P = 0.012), 140 mM fructose (low intensity; U = 182.5, P = 0.032), 2.05 mM aluminium sulphate (medium intensity; U = 213.5, p = 0.021) and 5.43 mM aluminium sulphate (high intensity; U = 217.0, P = 0.015). Similarly, TT used mores scales to describe some binary solutions; 5% ethanol/960 mM fructose (U = 191, P < 0.001), 13% ethanol/0.73 mM aluminium sulphate (U = 220.5, P = 0.007), 5% ethanol/5.43 mM aluminium sulphate (U = 205.0, P = 0.040) and 23% ethanol/6.91 mM tartaric acid (U = 215, P = 0.027).

4. Discussion

4.1. Unary Solutions

Consistent with prior literature, ethanol elicited sweetness, bitterness, astringency and burning/tingling [12,13,14,15,16,17,18,19,20,21]. The three ethanol concentrations (5%, 13%, 23%) differed significantly based on bitterness and burning/tingling, but no differences were found for sweetness or astringency. When ethanol from the concentrations typical in beer (5%) and wine (13%) were compared, both the bitterness and the burning/tingling sensations increased with ethanol concentration. However, when ethanol concentrations typical in wine (13%) and diluted spirits (23%) were compared, only burning/tingling increased with ethanol concentration. Although simple dilution may be an appropriate strategy to reduce the burning of an alcoholic beverage, it may not be sufficient to reduce the aversive sensations of bitterness or astringency for all starting concentrations of ethanol. More research is required to better characterize the implication of these findings in actual alcoholic beverages, especially in cases where producers are seeking to develop low or reduced ethanol products with flavour profiles similar to their full-strength counterparts.
Mean ratings of the orosensations elicited by ethanol were lower than those previously reported [17,19]. Despite the use of similar protocols (choice of scale, volume, whole mouth rinse), methodological differences may explain the lower ratings in the current study. Burning/tingling ratings were likely reduced as participants in the current study were required to wear nose clips to prevent ethanol from eliciting these sensations in the nasal cavity [15]. More research is needed to determine whether nasal occlusion disrupts cross-modal interactions between nasal burning/tingling and the other sensations rated, reducing their intensity. It is also possible that as both unary and binary solutions were presented in the same session, the inclusion of the higher intensity binary mixtures reduced the overall intensity ratings of the unary ethanol solutions due to a context effect [64,65]. Importantly, the relative dominance of sensations and relative intensity of each ethanol concentration was maintained.

4.2. Binary Mixtures

4.2.1. Sweet

The impact of ethanol concentration on the sweetness of the binary solutions varied based on the non-ethanol stimuli included in the mixture. In binary mixtures with quinine and ethanol, sweetness increased as ethanol concentration increased (Figure 5). In contrast, in binary mixtures with fructose (Figure 4), higher ethanol concentration was associated with reduced sweetness. As fructose elicits higher levels of sweetness than ethanol, it is likely that the other and more dominant sensations elicited by ethanol (bitterness, burning/tingling) suppressed the sweetness of fructose. Our results are consistent with Hoopman et al. [32] who found that the overall intensity of aqueous solutions of sweet stimuli is reduced as the concentration of ethanol increases from ~12% to 35% (v/v; reported as 10–30% w/w) ethanol. However, when binary mixtures of 0%, 5% and 12% ethanol and the same sugars were compared the overall intensity does not vary or may even increase as ethanol concentration increases [32]. Although Hoopman et al. [32] showed that the effect of ethanol on sweetness varied with concentration, the results should be interpreted with caution as only overall intensity was measured. That is, it is unclear if/how overall intensity was a useful proxy for the sweetness of the samples. Mixed results were also reported by Martin and Pangborn [28] who found that aqueous sucrose solutions were sweeter when ethanol was added during a forced choice exercise, but when the samples were rated no differences in sweetness intensity were found. Meanwhile, Calviño et al. [33] found that in mixtures with aspartame, sweetness did not vary with ethanol concentration (0–8%).
Ethanol concentration also impacts the intensity of sweetness of alcoholic beverages at low concentrations. In model beer (0–4.5%), sweetness increases with ethanol concentration [66]. In contrast, in wine and model wine solutions, sweetness intensity does not vary with ethanol concentration over the range 7–14% [23,24,67,68]. Taken together, the current study and prior literature demonstrate that the impact of ethanol on the perception of sweetness depends on the concentration of both ethanol and the other stimuli in the mixture.

4.2.2. Bitter

Bitterness did not vary with ethanol concentration in binary mixtures with quinine. This result replicates the findings of Martin and Pangborn [28] but is not consistent with the results from the other binary mixture types or with studies in alcoholic beverages. In binary mixtures of ethanol and stimuli that did not elicit bitterness (fructose, tartaric acid, aluminium sulphate), bitterness was significantly lower at 5% ethanol than at 13% or 23%, matching the results observed in the unary solution of ethanol. In real and model alcoholic beverages (cider, beer, wine) increased ethanol concentration is associated with higher bitterness in most [23,34,66,67,68,69,70,71,72,73,74,75] but not all [76] studies. It is possible that the bitterness elicited by quinine, which increased with quinine concentration, may have masked any effects of ethanol bitterness. Nevertheless, the isobole method results showed that bitterness was suppressed in binary mixtures of ethanol and quinine. More research is required to determine if/how bitterness varies in binary mixtures of ethanol and other bitter compounds.
In binary mixtures of ethanol and fructose, increasing fructose concentration reduced bitterness. This finding is not unexpected as adding sweet stimuli to model alcoholic beverages also decreases bitterness in most [34,66,67,77] but not all [74] studies. Increasing organic acid concentration decreases the bitterness in model wine [73] but the opposite has been found in cider [34]. The current study found that tartaric acid or aluminium sulphate concentration did not impact bitterness in binary mixture with ethanol. Thus, the impact of sour/astringent stimuli in binary mixtures with ethanol may be matrix dependent. Overall, the current study and prior literature demonstrate that the bitterness of ethanol and alcoholic beverages can be manipulated by changing their composition.

4.2.3. Sour

When ethanol was mixed with tartaric acid or aluminium sulphate, the impact of ethanol concentration on sourness followed the same pattern. In both binary mixture types, as the concentration of ethanol increased the sourness decreased, suggesting a robust effect. The findings are consistent with previous studies on organic acid and ethanol mixtures [28,29]. Additionally, consistent with our study, Guirao et al. [30] found that as ethanol concentration increases, sourness decreases, although this observation only held when both the ethanol and citric acid concentrations were high. The impact of ethanol concentration on the sourness of alcoholic beverages is less clear. When dealcoholized model or real red wines (0%) were compared to wines with ethanol (6–16%; [74,78]), sourness was lower in the wines with ethanol. However, sourness does not vary with different concentrations of ethanol in model and real wines in most [67,74,78] but not all studies [71]. More research is needed to fully characterize the interactions between ethanol and organic acids in aqueous solutions and alcoholic beverages. In particular, studying a wider range of organic acid concentrations while simultaneously measuring pH is recommended.

4.2.4. Astringency

As expected, the astringency of aluminium sulphate and ethanol mixtures increased as aluminium sulphate concentration increased. This finding is consistent with observations in unary solution of aluminium sulphate (Figure 3F, Figure S5) and in studies where astringent stimuli (phenolics) are added to model or real wine [73,74,75]. Ethanol did not impact the astringency of binary ethanol and aluminium sulphate mixtures. However, in binary mixtures with both tartaric acid and fructose, 5% ethanol was less astringent than 13% ethanol. The impact of ethanol concentration on astringency in real and model alcoholic beverages varies across studies [34,67,72,73,74,75,78], thus the conflicting findings are not unexpected. The isobole method showed that the astringency in the binary mixtures of ethanol and aluminium sulphate was suppressed for most mixtures (Table 4). Together, the results suggest that simply mixing any concentration of ethanol with aluminium sulphate reduced the astringency similarly.
In binary solutions of ethanol and tartaric acid, both compounds impacted the perception of astringency. As tartaric acid increased so did the astringency of binary mixtures with ethanol. This result is not consistent with astringency perception in the unary solutions (Figure 3D, Figure S4) nor studies in model wine [73]. However, some studies have shown that astringency is increased in wine when pH is decreased [73,78]. Together, the results suggest that changes in astringency associated with organic acids are likely driven by changes in pH rather than actual concentration. As the binary mixtures in the current study were simple and therefore not highly buffered, it is possible that the change in tartaric acid concentration also led to changes in pH.
In binary mixtures of fructose and ethanol, samples with 5% ethanol were less astringent than samples with 13% or 23%. Previous research showed that adding fructose or glycerol did not impact the astringency of wine [67,74]. However, the concentrations used were much lower (fructose, 1–11 mM; glycerol, 100 mM). As fructose itself does not elicit astringency (Figure S2), it is likely that the fructose suppressed the astringency from ethanol.

4.2.5. Burning/Tingling

Regardless of the stimuli mixed with ethanol, burning/tingling always increased as ethanol concentration increased (Figure 4, Figure 5, Figure 6 and Figure 7). This result is consistent with most [23,24,66,67,70,74,75] but not all [76] previous research in wine and beer (model or real). The relative intensity of the burning/tingling was the same for all four binary mixture types and in unary solutions (Figure 4, Figure 5, Figure 6 and Figure 7). Burning/tingling ratings were well differentiated between ethanol concentrations typically found in beer (5%; below barely detectable), wine (13%; between barely detectable and weak) and in dilute spirits (23%; moderate). Together, the results suggest that burning/tingling is a key sensory characteristic of alcoholic beverages and is likely a key differentiator of styles.
The concentration of non-ethanol stimuli in the binary mixture did not impact the burning/tingling ratings. This finding was unexpected as previous research showed that adding sweet compounds to model solutions, beer or wine led to decreased ratings of burning/tingling-like sensations in most [24,33,66,67,77] but not all [74] studies. In addition, adding phenolics to white wine increased burning/tingling at lower ethanol concentrations (>12.5%) but had no effect on red wine [75]. It is possible that the current study failed to capture the impacts of non-ethanol stimuli on burning/tingling as participants were required to wear nose clips. This choice limited the burning/tingling to the oral cavity, eliminating the impacts of nasal irritation from ethanol [15]. In addition, the use of a wider range of ethanol concentrations than most studies and the choice of label (burning/tingling vs. heat, irritation, pungency, warming, hotness) may have limited our ability to detect small but significant changes in burning/tingling. More research is required to determine, if/how the burning/tingling of ethanol is impacted by non-ethanol stimuli. Furthermore, collecting information using scales with descriptive anchor terms, such as the gLMS, would allow researchers to determine whether differences found are ecologically valid or likely too small for a consumer to detect.

4.3. Thermal Taste Status

As expected, TT were more responsive than TnT to many of the sensations elicited by the unary solutions [36,37,38,39]. Importantly, the current study also demonstrated that TT are also more responsive to both dominant and non-dominant sensations in binary mixtures. Although not all sample intensities varied with thermal taste status, such as the bitterness of quinine, no instances of TnT being more responsive than TT were found. Despite differences in responsiveness, relatively few interactions were reported between thermal taste status and stimuli concentration in the binary solutions. This observation suggests that despite the increased responsiveness of TT compared to TnT, the relative intensity of sensations elicited in binary mixtures is the same for both phenotypes. If true, changing the composition of alcoholic beverages to optimize flavour will lead to similar changes in the taste and chemesthetic profile of the product for both TT and TnT, albeit at different absolute intensities. Further research is encouraged to determine whether this finding is generalizable to different combinations of binary compounds in more complex samples or in solid food products.
Nolden and Hayes [17] found that individuals who were more responsive to ethanol also tended to consume alcoholic beverages less frequently. Variation in ethanol responsiveness between TT and TnT reported here and in the literature [19] suggest that differences in alcoholic beverage consumption may be partially attributable to thermal taste status. As the dominant sensations elicited by ethanol are nominally aversive, it is possible that the increased responsiveness of TT compared to TnT may also lead to lower alcohol consumption. However, to date only limited differences between TT and TnT in monthly alcohol consumption have been reported [79]. Thibodeau et al. [80] found that alcohol consumption was not always linearly associated with orosensory responsiveness. Individuals with intermediate responsiveness to bitterness and astringency, tended to drink more alcohol than low or high responders [80]. The authors attribute this observation to the fact that the flavour of alcoholic beverages is likely be optimized by producers for the ‘average’ consumer. Importantly, alcoholic beverages are one of a growing number of products for which a wide variety of styles and flavours are available. Thus, research into the impact of TTS or other taste-related phenotypes is needed to determine if, rather than reducing their consumption of alcoholic beverages, consumers instead shift their consumption towards alcoholic beverages that are optimized for their palate. All other factors being equal (e.g., price, availability, social context), each consumer likely selects alcoholic beverages that best balance the taste sensations, chemesthetic sensations and aromas they find appetitive with the ones they aversive find aversive. By considering the volume and the proportion of alcoholic beverages consumed across categories (e.g., beer vs. wine), types (e.g., red wine vs. white wine) or styles (e.g., dry white wine vs. sweet white wine), a more nuanced picture of alcohol consumption can be obtained. Furthermore, empirical research where consumers create their optimal alcoholic beverage (e.g., mix your own cocktail), may also provide insights into how taste impacts the consumption of alcoholic beverages at the individual level. Importantly, empirical research would allow for more control over the many intrinsic and extrinsic factors that also impact alcohol consumption [81].
For unary solutions of ethanol, effects sizes were higher for the non-dominant attributes (sweetness and astringency) than the dominant attributes (bitterness and burning/tingling). These findings likely resulted from the increased number of scales used by TT compared to TnT when describing ethanol (Figure 8) and aluminium sulphate (Figure S6). The simplest explanation for this finding is that TT have lower detection thresholds than TnT, and thus experience a wider range of low intensity sensations. However, suprathreshold intensity ratings and detections thresholds are not always associated [38,49,82]. Additionally, only detection thresholds for sucrose have been shown to differ between TT and TnT when taste (sucrose, sodium chloride, caffeine), trigeminal (capsaicin, N-ethyl-2-isopropyl-5-methylcyclohexanecarboxamide) and aroma (ethyl butyrate, isoamyl acetate) were examined [38]. Thus, differences in detection thresholds may not explain the differences in scale use between TT and TnT.
TT and TnT did not differ in their ability to identify the primary orosensation elicited by a stimulus after a familiarization task, nor to discriminate different concentrations of the same stimulus. In both cases, TT and TnT performed equally, suggesting that the increased responsiveness of TT compared to TnT did not impact these tasks. However, as the data was collected during a training session, the results should be interpreted with caution. That is, during the identification task participants were provided with feedback after each sample, replicate samples were not included to re-test their abilities, and the ability to discriminate samples was limited to comparing low and high intensity stimuli. Thus, TT and TnT may differ in their ability to discriminate stimuli closer in intensity, a hypothesis that is supported by the lower discrimination thresholds of TT for tartaric acid in white wine reported by Pickering and Kvas [83]. Further research is encouraged to determine whether these preliminary results apply to a wider range of stimuli and in broader contexts.

4.4. Limitations and Other Considerations

A key limitation of our study was the number of sensations rated as absent (0 on the gLMS) resulting in zero-inflated data. Despite log transformation the data remained right-skewed, which was largely attributed to the zeros in the data set. Although zero-inflated data is common in psychological research [84], it limited our ability to treat stimulus concentrations as a continuous variable. Instead, concentrations were treated as a categorical variable in the ANOVA, which is more robust to deviations from normality than ANCOVA [85]. Although more extensive analysis of interactions using the isobole method was planned, it was not possible and only a limited regression analysis performed. Readers are advised to interpret the results of the regression analysis (Table S3) with caution as R2 values are low, likely due to the right-skew of the data. Similarly, interactions results for the isobole analyses (Table 3 and Table 4) should be treated as preliminary due to the limitations of the underlying regressions [60]. Nevertheless, the isobole results demonstrate that in binary mixtures of ethanol and quinine or aluminium sulphate, bitterness and astringency are (respectively) largely suppressed. These results may be due to mixture suppression, which is common when solution complexity is increased [26]. Where appropriate the index of interaction was calculated, determining whether enhancement or suppression has truly occurred and complementing the ANOVA, where potential interactions can be inferred but not tested.
Although other studies have investigated the interactions between ethanol and alcohol-related taste and chemesthetic stimuli, the current study was designed to address important gaps in the literature. With the exception of Martin and Pangborn [28], previous studies on binary mixtures of ethanol with taste/chemesthetic stimuli only investigated a single stimulus or a group of stimuli that elicited the same orosensation. By examining stimuli that elicit four different orosensations, we were able to determine if/how changes in ethanol concentration impacted each of the binary mixture types. For example, burning/tingling increased as ethanol concentration increased in all four binary mixture types and was not impacted by the concentration of other stimuli. In contrast, adding ethanol decreased the sweetness in binary mixtures with fructose but the opposite was true in binary mixtures with quinine. Furthermore, providing participants with six scales when rating the binary solutions reduced the risk of attribute dumping, allowing for a more complete understanding of the interactions between the stimuli. For example, previous studies on the interactions between organic acid and ethanol [28,29,30], did not measure the astringency elicited in the samples despite the fact that organic acid elicit both sensations [31]. As participants in the current study rated both the sourness and astringency of the binary mixtures of ethanol and tartaric acid, we were able to demonstrate that increasing the ethanol concentration reduced the sourness while simultaneously increasing the astringency of the binary mixtures.
Finally, by screening participants for thermal taste status, we were able to investigate the impacts of individual taste differences on the perception of binary mixtures. Importantly, few interactions were found between thermal taste status and the concentrations of ethanol and/or the other stimuli in the binary mixtures. These results suggest that despite differences in the magnitude of the sensations elicited, the nature of interactions (enhancement and/or suppression) was the same in both groups. Sex is not associated with differences in TTS classification [37,38,39]. Nevertheless, as the study only included female participants, more research with males is encouraged to determine whether sex-related differences exist. Additionally, as our sample size is relatively small, such expansion would allow for an examination of our findings with a larger sample. More work is also encouraged to determine whether trends exist for other taste-related phenotypes where differences in the perception of ethanol have been reported (e.g., 6-n-propylthiouracil (PROP) taster status [54,86,87]. Together, the results of the current study provide insights into how the taste and chemesthetic profile of alcoholic beverages can be manipulated by changing their composition. More research is encouraged to determine if/how the trends reported here apply in more complex mixtures and in real alcoholic beverages, especially in beer and spirits, as most published research uses model or real wines.

Supplementary Materials

The following are available online at https://www.mdpi.com/article/10.3390/beverages7020023/s1, Table S1: Two-way ANOVA and Kruskal–Wallis analyses comparing intensity ratings by thermal taste status (TT and TnT) and stimulus concentration (low, medium, high) for orosensations elicited by unary solutions. Table S2: Three-way ANOVA comparing the intensity of orosensations elicited by binary mixtures. Table S3: Simple linear regressions used to predict the intensity of orosensations based on the concentration of unary solutions of stimuli. Tables S4–S8: Summary of Mann–Whitney U results comparing the mean number of scales used by TT and TnT when rating water, unary solutions (Table S4) and binary mixtures (Tables S5–S8). Figures S1–S5: Boxplots of mean responsiveness to orosensations elicited by unary solutions of ethanol (Figure S1), fructose (Figure S2), quinine (Figure S3), tartaric acid (Figure S4) and alum sulphate (Figure S5). Figures S6–10: Kernel density estimates of the mean number of scales used by thermal tasters and thermal non-tasters when rating unary aqueous solutions (Figure S6) and binary mixtures (Figures S7–S10).

Author Contributions

Conceptualization, M.T. and G.P.; methodology, M.T. and G.P.; formal analysis, M.T. and G.P.; investigation, M.T.; data curation, M.T.; writing—original draft preparation, M.T.; writing—review and editing, M.T. and G.P.; visualization, M.T.; supervision, G.P.; project administration, M.T.; funding acquisition, G.P. All authors have read and agreed to the published version of the manuscript.

Funding

This research was funded by a Natural Sciences and Engineering Research Council of Canada Discovery Grant (11733181) to G.P.

Institutional Review Board Statement

The study was conducted according to the guidelines of the Declaration of Helsinki, and approved by the Institutional Review Board of Brock University (17-168, approved 1/25/2018).

Informed Consent Statement

Informed consent was obtained from all subjects involved in the study.

Data Availability Statement

The data presented in this study are available on request from the corresponding author. The data are not publicly available to maintain the confidentiality of participants.

Acknowledgments

Hannah Pickering, Stephanie Small-Kelly and Jessica Mitchell are sincerely thanked for assistance with collecting data. The contribution of the participants is gratefully acknowledged.

Conflicts of Interest

The authors declare no conflict of interest.

Appendix A

Thermal taste screening (Session 1)
Before training (Session 2) and data collection (Session 3A–3D), participants underwent TTS screening. First, participants were trained on the gLMS to ensure that ratings were generalized across all possible sensations. To this end, participants were asked to write down the strongest imaginable sensation they could think of, painful or otherwise, at the top of a blank gLMS [42]. Participants were then verbally oriented to the gLMS and asked to rate the intensity of five remembered stimuli. Next, labelled 20 mL aqueous solutions were presented to participants to familiarize them with sensations that might be elicited during thermal stimulation later in the session, as it can increase the number of TT identified [39]. These samples were prepared with pure water (Millipore RiOs 16 Reverse Osmosis System, Millipore Sigma, Burlington, MA, USA) and were exemplars of sweet (sucrose 85.58 g/L; BioShop, Burlington, ON, Canada), sour (citric acid 0.62 g/L; Fisher Scientific, Fair Lawn, NJ, USA), bitter (quinine monohydrochloride dehydrate 0.011 g/L; SAFC Supply Solutions, St. Louis, MO, USA), metallic (cupric sulphate 0.25 g/L; Sigma-Aldrich, St. Louis, MO, USA), salty (sodium chloride 10.5 g/L; Sigma-Aldrich, St. Louis, MO, USA), and umami (L-glutamic acid monosodium salt hydrate 21.14 g/L; Sigma-Aldrich, St. Louis, MO, USA), the most common sensations reported by TT [88]. Participants tasted each sample using a sip-and-spit protocol and rated the maximum intensity of each on a gLMS.
Thermal stimulation was performed using a 64 mm2 computer-controlled Peltier device with a thermocouple feedback attached to a toothbrush-sized water-circulated heat sink (thermode). Warming cycles started at 35 °C, then cooled to 15 °C before final re-warming to 40 °C and holding for 1 s. As only the warming portion of the cycle was of interest, participants were asked to rate the maximum intensity of sensations during the re-warming phase of the cycle (from 15 °C to 40 °C). Cooling cycles started at 35 °C, subsequently cooling to 5 °C and holding for 10 s. As no warming occurs during this cycle, participants were asked to rate the maximum intensity of sensations through the entire cycle [37].
Before collection of thermal taste responses, participants underwent four training runs to become familiar with the temperature cycles and the thermode. Participants rated the maximum intensity of the temperature elicited when the thermode was applied to the palm and the vermillion border of the lip during both warming and cooling trials. Next, the experimenter applied the thermode to each participant’s extended tongue. Three locations on the edge of the tongue (the most anterior tip of the tongue, ~1 cm to the right of the midline and ~1 cm to the left of the midline) were tested in randomized order. 12 runs were performed for each participant in two blocks. Each block consisted of three warming cycles (one per location) followed by three cooling cycles (one per location). After each trial, participants were instructed to rate the intensity on the gLMS of any oral sensations perceived, including temperature, on eight individual scales titled heat or cold, sweet, salty, sour, bitter, umami, metallic and other. Participants were tested using all combination of two temperature regimes and at three locations on the tongue, as testing under all six conditions leads to increased identification of TT [88].
Thermal taste status classification was determined using the methods of Bajec et al. [37] as this scheme has been successfully used for previous data collected from the available thermode, it has been validated in a large data set and it has good concordance with most of the schemes [39]. TT were defined as participants who reported the same, thermally elicited taste sensation above weak on the gLMS (>6 mm) during both replicates of the same location during the same temperature regime. TnT were defined as participants who reported no taste-related orosensation during thermal elicitation.

References

  1. World Health Organization. Global Status Report on Alcohol and Health 2018; Poznyak, V., Rekve, D., Eds.; World Health Organization: Geneva, Switzerland, 2018; ISBN 978-92-4-156563-9. [Google Scholar]
  2. Barbor, T.F.; Higgins-Biddle, J.C.; Saunders, J.B.; Monteiro, M.G. The Alcohol Use Disorders Identification Test. Guidelines for Use in Primary Care; World Heath Organization: Geneva, Switzerland, 2001. [Google Scholar]
  3. Park, C.L.; Grant, C. Determinants of positive and negative consequences of alcohol consumption in college students: Alcohol use, gender, and psychological characteristics. Addict. Behav. 2005, 30, 755–765. [Google Scholar] [CrossRef]
  4. Krenz, M.; Korthuis, R.J. Moderate ethanol ingestion and cardiovascular protection: From epidemiologic associations to cellular mechanisms. J. Mol. Cell Cardiol. 2012, 52, 93–104. [Google Scholar] [CrossRef] [Green Version]
  5. Nolen-Hoeksema, S. Gender differences in risk factors and consequences for alcohol use and problems. Clin. Psychol. Rev. 2004, 24, 981–1010. [Google Scholar] [CrossRef]
  6. Tepper, B.J. Nutritional implications of genetic taste variation: The role of PROP sensitivity and other taste phenotypes. Annu. Rev. Nutr. 2008, 28, 367–388. [Google Scholar] [CrossRef]
  7. Fu, D.; Riordan, S.; Kieran, S.; Andrews, R.A.; Ring, H.Z.; Ring, B.Z. Complex relationship between TAS2R receptor variations, bitterness perception, and alcohol consumption observed in a population of wine drinkers. Food Funct. 2019, 10, 1643–1652. [Google Scholar] [CrossRef] [PubMed]
  8. Chartier, K.G.; Karriker-Jaffe, K.J.; Cummings, C.R.; Kendler, K.S. Environmental influences on alcohol use: Informing research on the joint effects of genes and the environment in diverse U.S. populations. Am. J. Addict. 2017, 26, 446–460. [Google Scholar] [CrossRef] [PubMed]
  9. Bruwer, J.; Buller, C. Consumer behaviour insights, consumption dynamics, and segmentation of the Japanese wine market. J. Int. Consum. Mark. 2012, 24, 338–355. [Google Scholar] [CrossRef]
  10. Small-Kelly, S. Taste responsiveness and beer behavior. MSC Thesis, Brock University, St. Catharines, ON, Canada, 2018. [Google Scholar]
  11. Thibodeau, M.; Pickering, G.J. The role of taste in alcohol preference, consumption and risk behavior. Crit. Rev. Food Sci. Nutr. 2019, 676–692. [Google Scholar] [CrossRef] [PubMed]
  12. Berg, H.; Filipello, F.; Hinreiner, E.; Webb, A. Evaluation of thresholds and minimum difference concentrations for various constituents of wines. II. Sweetness: The effect of ethyl alcohol, organic acids and tannin. Food Tech. 1955, 9, 138–140. [Google Scholar]
  13. Wilson, C.W.M.; O’Brien, C.; MacAirt, J.G. The effect of metronidazole on the human taste threshold to alcohol. Br. J. Addict. 1973, 68, 99–110. [Google Scholar] [CrossRef] [PubMed]
  14. Scinska, A.; Koros, E.; Habrat, B.; Kukwa, A.; Kostowski, W.; Beinkowski, P. Bitter and sweet components of ethanol taste in humans. Drug Alcohol. Depend. 2000, 60, 199–206. [Google Scholar] [CrossRef]
  15. Mattes, R.D.; DiMeglio, D. Ethanol perception and ingestion. Physiol. Behav. 2001, 72, 217–229. [Google Scholar] [CrossRef]
  16. Allen, A.L.; McGeary, J.E.; Hayes, J.E. Polymorphisms in TRPV1 and TAS2Rs associate with sensations from sampled ethanol. Alcohol. Clin. Exp. Res. 2014, 38, 2250–2560. [Google Scholar] [CrossRef] [PubMed] [Green Version]
  17. Nolden, A.A.; Hayes, J.E. Perceptual qualities of ethanol depend on concentration, and variation in these percepts associates with drinking frequency. Chem. Percept. 2015, 8, 149–157. [Google Scholar] [CrossRef] [PubMed] [Green Version]
  18. Nolden, A.A.; McGeary, J.E.; Hayes, J.E. Differential bitterness in capsaicin, piperine, and ethanol associates with polymorphisms in multiple bitter taste receptor genes. Physiol. Behav. 2016, 156, 117–127. [Google Scholar] [CrossRef] [Green Version]
  19. Small-Kelly, S.; Pickering, G. Variation in orosensory responsiveness to alcoholic beverages and their constituents—The role of the thermal taste phenotype. Chem. Percept. 2020, 13, 45–58. [Google Scholar] [CrossRef]
  20. Green, B.G. The sensitivity of the tongue to ethanol. Ann. Acad. N. Y. Sci. 1987, 510, 315–317. [Google Scholar] [CrossRef]
  21. Green, B.G. Spatial and temporal factors in the perception of ethanol irritation on the tongue. Percept. Psychosphys. 1988, 44, 108–116. [Google Scholar] [CrossRef] [PubMed]
  22. Pickering, G.; Heatherbell, D.; Vanhanen, L.; Barnes, M. The effect of ethanol concentration on the temporal perception of viscosity and density and white wine. Am. J. Enol. Vitic. 1998, 49, 306–318. [Google Scholar]
  23. Nurgel, C.; Pickering, G. Contribution of glycerol, ethanol and sugar to the perception of viscosity and density elicited by model white wines. J. Texture Stud. 2005, 36, 303–323. [Google Scholar] [CrossRef]
  24. Gawel, R.; Van Sluyter, S.; Waters, E.J. The effects of ethanol and glycerol on the body and other sensory characteristics of Riesling wines. Aus. J. Grape Wine Res. 2007, 13, 38–45. [Google Scholar] [CrossRef]
  25. Spence, C. Multisensory flavor perception. Cell 2015, 161, 24–35. [Google Scholar] [CrossRef] [Green Version]
  26. Keast, R.S.J.; Breslin, P.A.S. An overview of binary taste-taste interactions. Food Qual. Prefer. 2003, 14, 111–124. [Google Scholar] [CrossRef] [Green Version]
  27. Wilkie, L.M.; Capaldi Phillips, E.D. Heterogeneous binary interactions of taste primaries: Perceptual outcomes, physiology, and future directions. Neurosci. Biobehav. Rev. 2014, 47, 70–86. [Google Scholar] [CrossRef]
  28. Martin, S.; Pangborn, M. Taste interaction of ethyl alcohol with sweet, salty, sour and bitter compounds. J. Sci. Fd Agric. 1970, 21, 653–655. [Google Scholar] [CrossRef] [PubMed]
  29. Zamora, M.C.; Goldner, M.C.; Galmarini, M.V. Sourness-sweetness interactions in different media: White wine, ethanol and water. J. Sens. Stud. 2006, 21, 601–611. [Google Scholar] [CrossRef]
  30. Guirao, M.; Driano, E.J.G.; Evin, D.; Calviño, A. Psychophysical assessments of sourness in citric acid-ethanol mixtures. Pecerpt. Mot. Ski. 2013, 117, 868–880. [Google Scholar] [CrossRef]
  31. Sowalsky, R.A.; Noble, A. Comparison of the effects of concentration, pH, anion species on astringency and sourness of organic acid. Chem. Senses 1998, 23, 343–349. [Google Scholar] [CrossRef] [Green Version]
  32. Hoopman, T.; Birch, G.; Serghat, S.; Portmann, M.-O.; Mathlouthi, M. Solute-solvent interactions and the sweet taste of small carbohydrates. Part II: Sweetness intensity and persistence in ethanol-water mixtures. Food Chem. 1993, 46, 147–153. [Google Scholar] [CrossRef]
  33. Calviño, A.M. Regional Tongue sensitivity for sweetness and pungency of ethanol-aspartame mixtures. Percept. Mot. Ski. 1998, 86, 51–58. [Google Scholar] [CrossRef] [PubMed]
  34. Lea, A.G.H.; Arnold, G.M. The phenolics of cider: Bitterness and astringency. J. Sci. Food Agric. 1978, 29, 478–483. [Google Scholar] [CrossRef]
  35. Hayes, J.E.; Keast, R.S.J. Two decades of supertasting: Where do we stand? Physiol. Behav. 2011, 104, 1072–1074. [Google Scholar] [CrossRef] [PubMed] [Green Version]
  36. Green, B.G.; George, P. “Thermal taste” predicts higher responsiveness to chemical taste and flavour. Chem. Senses 2004, 29, 617–628. [Google Scholar] [CrossRef]
  37. Bajec, M.R.; Pickering, G.J. Thermal taste, PROP responsiveness, and perception of oral sensations. Physiol. Behav. 2008, 95, 581–590. [Google Scholar] [CrossRef]
  38. Yang, Q.; Hollowood, T.; Hort, J. Phenotypic variation in oronasal perception and the relative effects of PROP and thermal taster status. Food Qual. Prefer. 2014, 38, 83–91. [Google Scholar] [CrossRef] [Green Version]
  39. Thibodeau, M.; Saliba, A.; Bajec, M.; Pickering, G. Examination and validation of classification schema for determining thermal taste status. Chem. Percept. 2019, 12, 69–89. [Google Scholar] [CrossRef]
  40. Green, B.G.; Alvarez-Reeves, M.; George, P.; Akirav, C. Chemesthesis and taste: Evidence of independent processing of sensation intensity. Physiol. Behav. 2005, 86, 526–537. [Google Scholar] [CrossRef]
  41. Bajec, M.R.; Pickering, G.J.; DeCourville, N. Influence of stimulus temperature on orosensory perception and variation with taste phenotype. Chem. Percept. 2012, 5, 243–265. [Google Scholar] [CrossRef]
  42. Hort, J.; Ford, R.A.; Eldeghaidy, S.; Francis, S.T. Thermal taster status: Evidence of cross-modal integration. Hum. Brain Mapp 2016, 37, 2263–2275. [Google Scholar] [CrossRef] [PubMed]
  43. Pickering, G.J.; Bartolini, J.-A.; Bajec, M.R. Perception of beer flavour associates with thermal taster status. J. Instit. Brew. 2010, 116, 239–244. [Google Scholar] [CrossRef]
  44. Pickering, G.J.; Moyes, A.; Bajec, M.R.; DeCourville, N. Thermal taster status associates with oral sensations elicited by wine. Aust. J. Grape Wine Res. 2010, 16, 361–367. [Google Scholar] [CrossRef]
  45. Michon, C.; O’Sullivan, M.; Delahunty, C.; Kerry, J. The investigation of gender-related sensitivity differences in food perception. J. Sens. Stud. 2009, 24, 922–937. [Google Scholar] [CrossRef]
  46. Mitchell, J.; Castura, J.C.; Thibodeau, M.; Pickering, G. Application of TCATA to examine variation in beer perception due to thermal taste status. Food Qual. Prefer. 2019, 73, 135–142. [Google Scholar] [CrossRef]
  47. Settle, R.; Meehan, K.; Williams, G.; Doty, R.; Sisley, A. Chemosensory properties of sour tastants. Physiol. Behav. 1986, 32, 619–623. [Google Scholar] [CrossRef]
  48. Schiffman, S.S.; Booth, B.J.; Losee, M.L.; Pecore, S.D.; Warwick, Z.S. Bitterness of sweetners as a function of concentration. Brain Res. Bull. 1995, 36, 505–513. [Google Scholar] [CrossRef]
  49. Keast, R.S.J.; Roper, J. A complex relationship among chemical concentration, detection threshold, and suprathreshold intensity of bitter compounds. Chem. Senses 2007, 32, 245–253. [Google Scholar] [CrossRef] [Green Version]
  50. Low, J.Y.; McBride, R.L.; Lacy, K.E.; Keast, R.S. Psychophysical evaluation of sweetness functions across multiple sweetners. Chem. Senses 2017, 42, 111–120. [Google Scholar] [CrossRef] [Green Version]
  51. Ickes, C.M.; Cadwallader, K.R. Effects of ethanol on flavour perception in alcoholic beverages. Chem. Percept. 2017, 10, 1–16. [Google Scholar] [CrossRef]
  52. Lachemeir, D.W.; Kanteres, F.; Rehm, J. Alcoholic beverage strength discrimination by taste may have an upper threshold. Alcohol. Clin. Exp. Res. 2014, 38, 2460–2467. [Google Scholar] [CrossRef]
  53. Bartoshuk, L.M.; Duffy, V.B.; Green, B.G.; Hoffman, H.J.; Ko, C.-W.; Lucchina, L.A.; Marks, L.E.; Snyder, D.J.; Weiffenbach, J.M. Valid across-group comparisons with labeled scales: The gLMS versus magnitude matching. Physiol. Behav. 2004, 82, 109–114. [Google Scholar] [CrossRef]
  54. Prescott, J.; Swain-Campbell, N. Responses to repeated oral irritation by capsaicin, cinnamaldehyde and ethanol in PROP tasters and non-tasters. Chem. Senses 2000, 25, 239–246. [Google Scholar] [CrossRef] [PubMed]
  55. Wickham, H. ggplot2: Elegant Graphics for Data Analysis; Springer-Verlag: New York, NY, USA, 2016; ISBN 9783319242774. [Google Scholar]
  56. Auguie, B. Miscellaneous Functions for “Grid” Graphics. 2017. Available online: https://cran.r-project.org/web/packages/gridExtra/index.html (accessed on 20 April 2021).
  57. Hayes, J.E.; Allen, A.L.; Bennett, S.M. Direct comparison of the generalized visual analog scale (gVAS) and general labeled magnitude scale (gLMS). Food Qual. Prefer. 2013, 28, 36–44. [Google Scholar] [CrossRef] [PubMed] [Green Version]
  58. Lakens, D. Calculating and reporting effect sizes to facilitate cumulative science: A practical primer for t-tests and ANOVAs. Front. Psychol. 2013, 4, 863. [Google Scholar] [CrossRef] [PubMed] [Green Version]
  59. Yang, Q.; Dorado, R.; Chaya, C.; Hort, J. The impact of PROP and thermal taster status on the emotional response to beer. Food Qual. Prefer. 2018, 68, 420–430. [Google Scholar] [CrossRef]
  60. Sühnel, J. Evaluation of interaction in olfactory and taste mixtures. Chem. Senses 1993, 18, 131–149. [Google Scholar] [CrossRef]
  61. Fleming, E.E.; Ziegler, G.R.; Hayes, J.E. Investigating mixture interactions of astringent stimuli using the isobole approach. Chem. Senses 2016, 41, 601–610. [Google Scholar] [CrossRef] [Green Version]
  62. Wang, G.; Hayes, J.E.; Ziegler, G.R.; Roberts, R.F.; Hopfer, H. Dose-response relationships for vanilla flavor and sucrose in skim milk: Evidence of synergy. Beverages 2018, 4, 73. [Google Scholar] [CrossRef] [Green Version]
  63. Peleg, H.; Bodine, K.K.; Noble, A.C. The influence of acid on astringency of alum and phenolic compounds. Chem. Senses 1998, 23, 371–378. [Google Scholar] [CrossRef] [Green Version]
  64. Schifferstein, H.N.J.; Frijters, J.E.R. Contextual and sequential effects on judgments of sweetness intensity. Percept. Psychosphys. 1992, 52, 243–255. [Google Scholar] [CrossRef] [Green Version]
  65. Ferris, S.; Kempton, R.; Muir, D. Carryover in sensory trials. Food Qual. Prefer. 2003, 14, 299–304. [Google Scholar] [CrossRef]
  66. Clark, R.A.; Hewson, L.; Bealin-Kelly, F.; Hort, J. The interactions of CO2, ethanol, hop acids and sweetener on flavour perception in a model beer. Chem. Percept. 2011, 4, 42–54. [Google Scholar] [CrossRef]
  67. Jones, P.R.; Gawel, R.; Francis, I.L.; Waters, E.J. The influence of interactions between major white wine components on the aroma flavour and texture of model white wine. Food Qual. Prefer. 2008, 19, 596–607. [Google Scholar] [CrossRef]
  68. Cretin, B.N.; Dubourdieu, D.; Marchal, A. Influence of ethanol content on sweetness and bitterness perception in dry wine. LWT 2018, 87, 61–66. [Google Scholar] [CrossRef]
  69. Poveromo, A.R.; Hopfer, H. Temporal check-all-that-apply (TCATA) reveals matrix interaction effects on flavor perception in a model wine matrix. Foods 2019, 8, 641. [Google Scholar] [CrossRef] [PubMed] [Green Version]
  70. Harwood, W.S.; Parker, M.N.; Drake, M. Influence of ethanol concentration on sensory perception of rums using check-all-that-apply. J. Sens. Stud. 2020, 35, e12546. [Google Scholar] [CrossRef]
  71. Fischer, U.; Noble, A.C. The effect of ethanol, catechin concentration, and pH on sourness and bitterness of wine. Am. J. Enol. Vitic. 1994, 45, 6–10. [Google Scholar]
  72. Vidal, S.; Courcoux, P.; Francis, L.; Kwitatkowski, M.; Gawel, R.; Williams, P.; Waters, E.; Cheynier, V. Use of an experimental design approach for evaluation of key wine components on mouth-feel perception. Food Qual. Prefer. 2004, 15, 209–217. [Google Scholar] [CrossRef]
  73. Fontoin, H.; Saucier, C.; Teissedre, P.-L.; Glories, Y. Effect of pH, ethanol and acidity on astringency and bitterness of grape seed tannin oligomers in model wine solution. Food Qual. Prefer. 2008, 19, 286–291. [Google Scholar] [CrossRef]
  74. Villamor, R.R.; Evans, M.A.; Ross, C.F. Effects of ethanol, tannin, and fructose concentrations on sensory properties of model red wines. Am. J. Enol. Vitic. 2013, 64, 342–348. [Google Scholar] [CrossRef]
  75. Gawel, R.; Van Sluyter, S.C.; Smith, P.A.; Waters, E.J. Effect of pH and alcohol on perception of phenolic character in white wine. Am. J. Enol. Vitic. 2013, 64, 425–429. [Google Scholar] [CrossRef]
  76. Frost, S.C.; Harbertson, J.F.; Heymann, H. A full factorial study on the effect of tannins, acidity, and ethanol on the temporal perception of taste and mouthfeel in red wine. Food Qual. Prefer. 2017, 62, 1–7. [Google Scholar] [CrossRef]
  77. Nurgel, C.; Pickering, G. Modeling of sweet, bitter and irritant sensations and their interactions elicited by model ice wines. J. Sens. Stud. 2006, 21, 505–519. [Google Scholar] [CrossRef]
  78. Demiglio, P.; Pickering, G.J. The influence of ethanol and pH on the taste and mouthfeel sensations elicited by red wine. J. Food Agric. Environ. 2008, 6, 143–150. [Google Scholar] [CrossRef]
  79. Thibodeau, M. Alcohol Consumption and Its Association with Thermal Taste Status and Oral Sensations. Ph.D. Thesis, Brock University, St. Catharines, ON, Canada, 2015. [Google Scholar]
  80. Thibodeau, M.; Bajec, M.; Pickering, G. Orosensory responsiveness and alcohol behaviour. Physiol. Behav. 2017, 177, 91–98. [Google Scholar] [CrossRef]
  81. Betancur, M.I.; Motoki, K.; Spence, C.; Velasco, C. Factors influencing the choice of beer: A review. Food Res. Int. 2020, 137, 109367. [Google Scholar] [CrossRef]
  82. Mojet, J.; Christ-Hazelhof, E.; Heifema, J. Taste perception with age: Pleasantness and its relationship with threshold sensitivity and supra-threshold intensity of five taste qualities. Food Qual. Prefer. 2005, 16, 413–423. [Google Scholar] [CrossRef]
  83. Pickering, G.J.; Kvas, R. Thermal Tasting and Difference Thresholds for Prototypical Tastes in Wine. Chem. Percept. 2016, 9, 37–46. [Google Scholar] [CrossRef]
  84. Yang, S.; Harlow, L.L.; Puggioni, G.; Redding, C.A. A comparison of different methods of zero-inflated data analysis and an application in health surveys. J. Mod. Appl. Stat. Methods 2017, 16, 518–543. [Google Scholar] [CrossRef]
  85. Field, A. Discovering Statistics Using IBM SPSS Statistics, 4th ed.; SAGE Publications Ltd.: London, UK, 2013. [Google Scholar]
  86. Bartoshuk, L.M.; Conner, E.; Grubin, D.; Karrer, T.; Kochenbach, K.; Palesco, M.; Snow, D.; Pelchat, M.; Danowski, S. PROP supertasters and the perception of ethyl alcohol. Chem. Senses 1993, 18, 526–527. [Google Scholar] [CrossRef]
  87. Duffy, V.B.; Peterson, J.M.; Bartoshuk, L.M. Associations between taste genetics, oral sensations and alcohol intake. Physiol. Behav. 2004, 82, 435–445. [Google Scholar] [CrossRef]
  88. Thibodeau, M.; Bajec, M.; Saliba, A.; Pickering, G. Homogeneity of thermal tasters and implications for mechanisms and classification. Physiol. Behav. 2020, 227, 113160. [Google Scholar] [CrossRef] [PubMed]
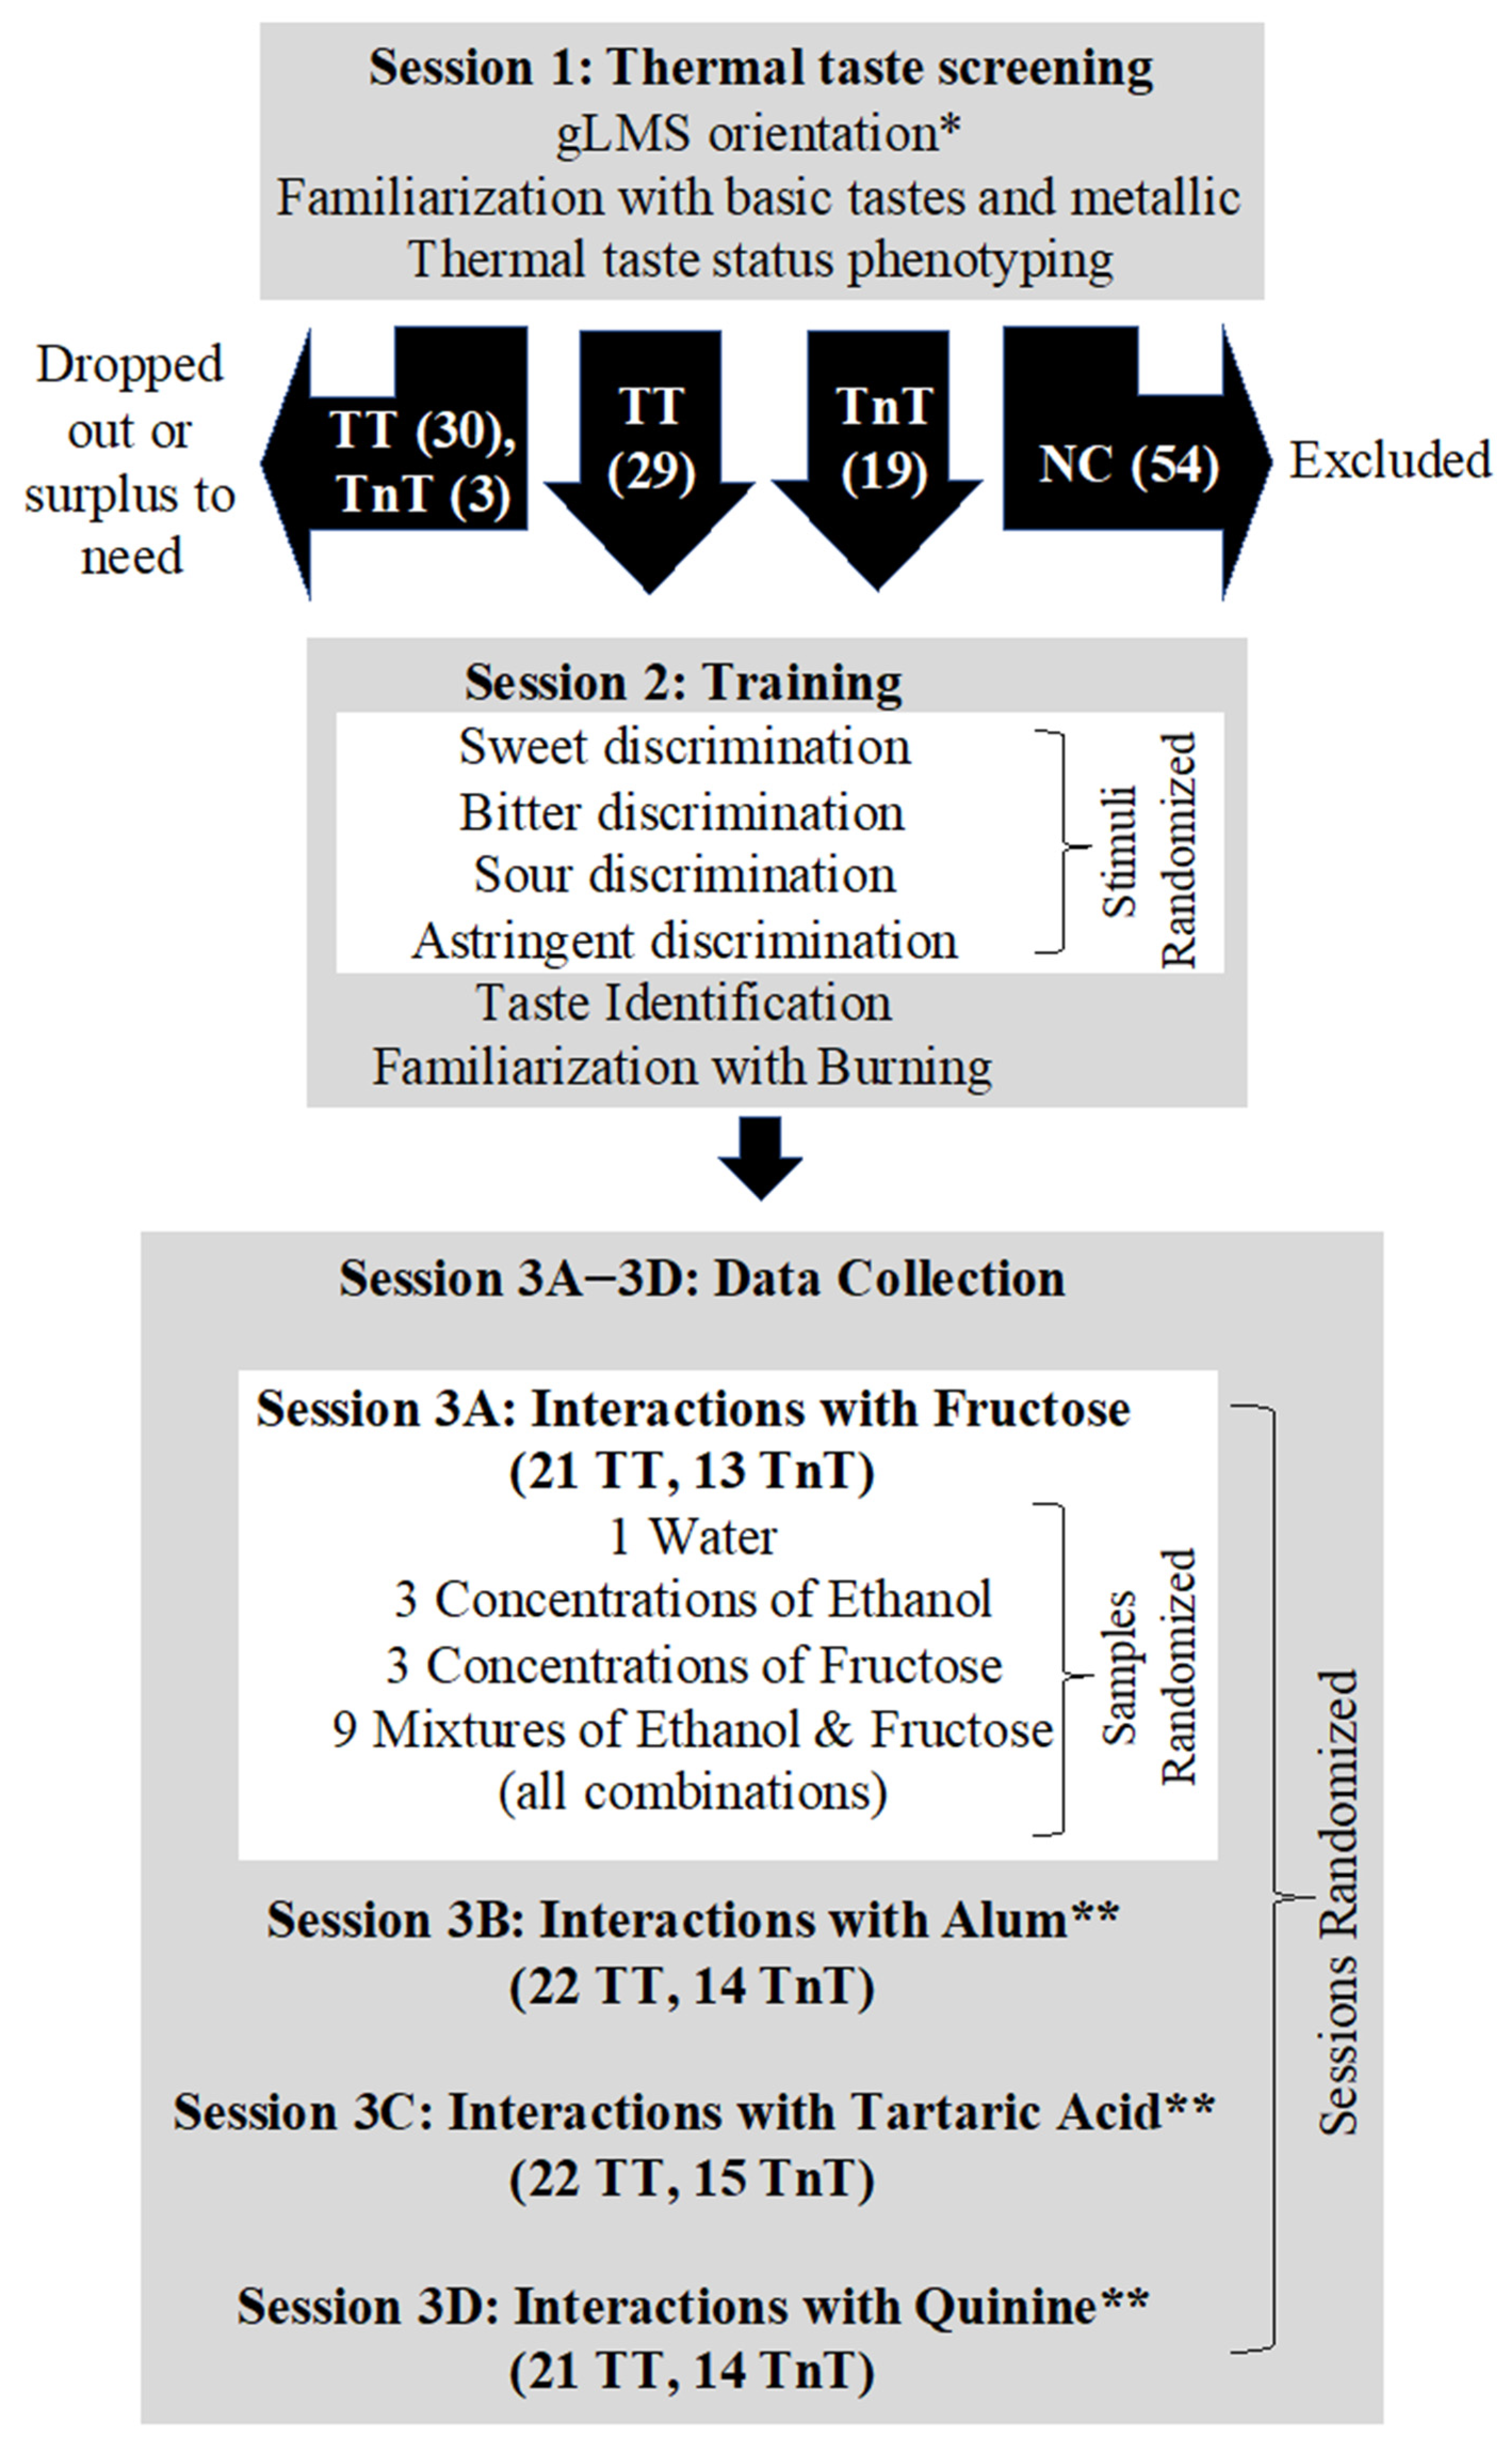
Figure 1. Overview of experimental design. (TT = thermal taster, TnT = thermal non-taster, NC = non-classifiable, * Note: Of the 142 eligible participants recruited to the study, only 135 completed Session 1. ** = Design per Session 3A except for unique stimulus compound).
Beverages 07 00023 g001
Figure 2. Boxplots of mean intensity elicited by unary solutions of ethanol by concentration (5, 13, 23% v/v) and thermal taste status (18 TT, 11 TnT) for sweet (A), bitter (B), astringent (C) and burning/tingling (D). Significant differences between concentrations are shown with different letters above the boxplots. Significant differences between TT and TnT are indicated by the mathematical symbols in the legend.
Beverages 07 00023 g002
Figure 3. Unary solution boxplots of the mean sweetness of fructose (A), bitterness of quinine (B), sourness of tartaric acid (C), astringency of tartaric acid (D), sourness of aluminium sulphate (E) and astringency of aluminium sulphate (F) by concentration (low, medium, high) and thermal taste status (TT, TnT). Significant differences between mean concentrations are shown with different letters above the boxplots. Significant differences between thermal tasters (TT, n = 21–22) and thermal non-tasters (TnT, n = 13–15) are indicated by the mathematical symbols in the legend.
Beverages 07 00023 g003
Figure 4. Mean ratings of sweetness, bitterness, sourness, astringency and burning/tingling in the binary solutions of ethanol (5%, 13%, 23% v/v) and fructose (140 mM, 280 mM, 960 mM). Significant differences are indicated from the p-values above each graph (NS = not significant). A full summary of the model including the effect of thermal taste status and 2-way interactions is included in Table S2.
Beverages 07 00023 g004
Figure 5. Mean ratings of sweetness, bitterness, sourness, astringency and burning/tingling in the binary solutions of ethanol (5%, 13%, 23% v/v) and quinine (0.025 mM, 0.040 mM, 0.100 mM). Significant differences are indicated from the p-values above each graph (NS = not significant). A full summary of the model including the effect of thermal taste status and 2-way interactions is included in Table S2.
Beverages 07 00023 g005
Figure 6. Mean ratings of sweetness, bitterness, sourness, astringency and burning/tingling in the binary solutions of ethanol (5%, 13%, 23% v/v) and tartaric acid (2.75 mM, 6.91 mM, 17.4 mM). Significant differences are indicated from the p-values above each graph (NS = not significant). A full summary of the model including the effect of thermal taste status and 2-way interactions is included in Table S2.
Beverages 07 00023 g006
Figure 7. Mean ratings of sweetness, bitterness, sourness, astringency and burning/tingling in the binary solutions of ethanol (5%, 13%, 23% v/v) and aluminium sulphate (0.73 mM, 2.05 mM, 5.43 mM). Significant differences are indicated from the p-values above each graph (NS = not significant). A full summary of the model including the effect of thermal taste status and 2-way interactions is included in Table S2.
Beverages 07 00023 g007
Figure 8. Kernel density estimates of the mean number of scales used by thermal tasters (TT, n = 18) and thermal non-tasters (TnT, n = 11) when rating unary aqueous solutions of ethanol (0%, 5%, 13% and 23% v/v). Dashed lines indicate the median values and p-values indicate whether the medians differ significantly (NS = not significant).
Beverages 07 00023 g008
Table 1. Orosensory stimuli and concentrations used in taste–taste interactions.
StimulusOrosensation(s) ElicitedUnitsConcentration
LowMediumHigh
FructoseSweetmM140280960
QuinineBittermM0.0250.0400.100
Tartaric acidSour (primary), astringentmM2.756.9117.4
AlumAstringent (primary), sourmM0.732.055.43
EthanolSweet, bitter, astringent, burning 1%(v/v)51323
1 Relative intensity varies with concentration.
Table 2. Summary of effect sizes for two-way ANOVAs comparing intensity ratings by thermal taste status (TT and TnT) and stimuli concentration (low, medium, high) to orosensations elicited by unary solutions of ethanol, fructose, quinine, tartaric acid and aluminium sulphate. Note: The effect size is considered small, medium, or large, when η2p values exceed 0.01 (light grey), 0.06 (dark grey), or 0.140 (black), respectively [58]. Levels of significance in the corresponding ANOVAs are denoted by “*” and “#”, when P < 0.05 or P < 0.10, respectively.
Effect Size (η2p)
StimuliEthanolFructoseQuinineTartaric acidAluminium sulphate
Orosensation BitterBurning/
Tingling
SweetAstringentSweetBitterSourAstringentAstringentSour
Factor in ANOVA
Thermal
taste status (TTS)
0.04 #0.04 #0.18 *0.22 *0.14 *<0.010.020.010.010.12 *
Stimulus
concentration (Conc)
0.20 *0.70 *0.030.06 #0.55 *0.07 *0.26 *0.040.24 *0.19 *
TTS*Conc<0.010.010.02<0.01<0.01< 0.01<0.01<0.01<0.010.08 *
Table 3. Isobole calculations for bitterness interactions in binary mixtures of ethanol and quinine (n = 35).
Ethanol
%
(v/v)
Quinine (mM)Mean log(Bitter) in Binary
Mixture
Actual log(Ethanol) Concentration
(cEtOH)
log(Ethanol) to Achieve the Same log(Bitterness) as in Mixture
(CEtOH)
Actual log(1
+ Quinine)
Concentration
(cQuinine)
Concentration of log(1 + Quinine) to Achieve the Same Bitterness as in
Mixture
(CQuinine)
Index of
Interaction (I)
Nature of
Interaction
50.0250.6350.6991.1410.0110.0141.41Suppression
50.0400.7270.6991.3100.0170.0221.31Suppression
50.1001.0650.6991.9340.0410.0531.14Suppression
130.0250.7151.1141.2890.0110.0211.38Suppression
130.0400.7401.1141.3340.0170.0231.57Suppression
130.1000.8791.1141.5900.0410.0361.84Suppression
230.0250.5301.3620.9470.0110.0044.24Suppression
230.0400.7531.3621.3570.0170.0241.70Suppression
230.1000.6251.3621.1220.0410.0134.50Suppression
Table 4. Isobole calculations for astringency interactions in binary mixtures of ethanol and aluminium sulphate (n = 36).
Ethanol %
(v/v)
Alum
Sulphate (mM)
Mean
log(Astringency) in Binary
Mixture
Actual log(Ethanol)
(cEtOH)
log(Ethanol) to Obtain the Mean log(Astringency) in Binary Mixture
(CEtOH)
Actual
log(Aluminium Sulphate)
(calum)
log(Aluminium Sulphate) to
Obtain the Mean
log(Astringency) in Binary Mixture
(CAlum)
Index of
Interaction (I)
Nature of
Interaction
50.730.4500.6991.920−0.137−0.0423.65Suppression
52.050.6910.6992.9070.3120.2651.42Suppression
55.430.8270.6993.4630.7350.4371.88Suppression
130.730.4151.1141.774−0.137−0.0872.20Suppression
132.050.8641.1143.6140.3120.4840.95Additive
135.431.1121.1144.6310.7350.7991.16Suppression
230.730.3361.3621.450−0.137−0.1871.67Suppression
232.050.6751.3622.8420.3120.2451.75Suppression
235.430.8791.3623.6750.7350.5031.83Suppression
Publisher’s Note: MDPI stays neutral with regard to jurisdictional claims in published maps and institutional affiliations.