Article

Phenolic Content of Apple Juice for Cider Making as Influenced by Common Pre-Fermentation Processes Using Two Analytical Methods

1
Tasmanian Institute of Agriculture, University of Tasmania, Private Bag 98 Sandy Bay, Tasmania 7001, Australia
2
WineTQ, P.O. Box 3, Monash 5342, Australia
*
Author to whom correspondence should be addressed.
Beverages 2019, 5(3), 53; https://doi.org/10.3390/beverages5030053
Submission received: 14 June 2019 / Revised: 29 June 2019 / Accepted: 12 August 2019 / Published: 22 August 2019
(This article belongs to the Special Issue Fruit Juices: Technology, Chemistry, and Nutrition)

Abstract

:
Pre-fermentation methods can influence the cider produced from apple juice. This study analyses the influence of pre-fermentation methods; maceration and press fractioning, on the total phenolic content of juice from four apple varieties; ‘Red Delicious’, ‘Pink Lady’, ‘Sturmer’, and ‘Bulmer’s Norman’. The must was macerated for 0 or 2 h and juice was collected at free run or under 200 kpa. Base juice characteristics and total phenolic content was analysed using the Folin–Ciocalteu method and spectrophotometric absorbance at 280 nm (A280), a method used for the analysis of white wine. Both methods of analysing the total phenolic content were used, measuring the same samples to determine if the methods are comparable. No interaction was found between pre-fermentation technique and the results varied by variety and analytical method. High pressure improved the phenolic extraction for ‘Bulmer’s Norman’ juice compared to free run juice when analysed by A280. Non-macerated juice had higher total phenolic content than macerated juice for ‘Red Delicious’ and ‘Pink Lady’ juice when analysed using the Folin–Ciocalteu method. There was a moderate positive correlation between the analytical methods.

1. Introduction

The style and flavour of cider depends on the apple varieties used [1,2,3], pre-fermentation processes employed for juice extraction [1,4] and the fermentation process itself [1,4,5]. The phenolic content of cider is a key indicator of quality, which can be accurately quantified using accepted laboratory methods [6]. Phenolic content influences many sensory factors of cider, including colour, taste, aroma and mouthfeel [6]. Therefore, understanding the contribution of phenolics to cider is crucial for maximising the quality and consistency. This includes investigating the impact of pre-fermentation processing methods on the extraction of phenolic compounds from the fruit, found in the highest concentration in the skin and seeds [1,7,8,9]. Apple variety is known to have a major influence on the final phenolic content in cider [1]. This is caused by varying quantities of phenolics between different varieties. However, the influence of pre-fermentation processes such as maceration and pressing on final phenolic is not understood.
Pre-fermentation methods such as maceration and pressing can influence the phenolic extraction, and lead to improvements in the quality of the cider product. Maceration is the process of allowing the apple pomace to oxidise after milling and before pressing [1,4]. Juice colouration occurs from oxidation, and pectin leaches out of the cell walls into the juice where natural enzymes begin to break it down, increasing the juice yield [1,7]. There is limited evidence of how the length of maceration time influences the phenolic content; however, early research suggests that for apple and grape juice, excessive oxidation of phenolics can lead to deterioration in the quality of the juice [10,11,12]. Jolicoeur [1] reported that the oxygen from the air causes browning of the pulp, and with this colour change the ‘mellowing’ of the bitterness and astringency of the resulting cider. In contrast, other research has supported the role of controlled oxidation to increase phenolic extraction at early stages of the cider making process and particularly for the production of wine, where it has been researched more intensely [10,13,14,15].
When the pomace is compressed for juice extraction, the pressure applied determines the press fraction and therefore is likely to influence the extraction of phenolic compounds. Greater applied pressure can cause skin and seeds to grind against each other and release tannins [9]. Free run fractions are therefore more likely to be lower in suspended solids and condensed phenols. Although cider producers favour certain press fractions for their desired influence on juice characteristics, there is limited research demonstrating the effect of pressing on juice phenolic content during cider production. In wine making, Eder [9] showed that the flavour and varietal character improved under increased press fractioning compared to free run.
Traditionally cider makers have utilised the Folin–Ciocalteu method [16] to determine the total phenolic content of the apple juice, however a simpler method has been developed for the wine industry which utilises a simple dilution and UV-vis spectrometry which provides a spectral phenolic fingerprint [17]. The sample’s absorbance is measured at 280 nm wavelength and recorded in absorbance units (AU) [18]. In wine, the wavelengths of 280 and 320 nm have been confirmed to represent the total phenolic and hydroxycinnamate content respectively [18], although this is yet to be confirmed for cider; recent research has demonstrated its effectiveness of application to cider [2].
In this study, we investigated how pre-fermentation methods, maceration and press fractioning, influence phenolic content of apple juice for cider making. The phenolic content was measured using a traditional method, the Folin–Ciocalteu method, as well as a rapid method used in white wine. We also explored the effect of these pre-fermentation methods on base cider characteristics: pH, titratable acidity (TA), total soluble sugars (TSS) and yeast assimilable nitrogen (YAN). We hypothesised that extended maceration time will lead to lower phenolic content of extracted apple juice and that juice extracted from later press fractions will have higher phenolic content. We also hypothesised that the pre-fermentation methods will not change the base cider characteristics. As phenolic content and base cider characteristics have been shown to vary between varieties, two dessert varieties, a culinary apple variety and a traditional cider variety were used to test these hypotheses. Because of the many decisions available to cider makers during the fermentation process, the resulting variability to the final cider produced is considerable, and for this reason this trial concentrated on the pre-fermentation process only.

2. Materials and Methods

2.1. Experimental Design

Two dessert apple varieties, ‘Red Delicious’ and ‘Pink Lady’, one cider variety, ‘Bulmer’s Norman’ and one culinary variety ‘Sturmer’ were sourced from commercial orchards in the Huon Valley and Spreyton in Tasmania, Australia. Apples were removed from orchards aligned with commercial harvest and were separated into three replicates for each variety, and approximately 20 kg of each varietal replicate was milled using a high-speed hammer mill. The apple pomace produced was split into two 20 L buckets with a 28 cm diameter filling approximately half of each bucket. One bucket was used for immediate pressing (no maceration) and the other set aside for two hours of maceration. According to Jolicoeur [1], two to four hours of maceration is sufficient time to achieve the effect of maceration, as too long may increase the risk of contamination. Maceration occurred at approximately 15 °C. For pressing, the apple pomace was placed in a muslin bag and pressed in a horizontal flat-bed water bag press (custom built by Solutions in Stainless, Tasmania, Australia). The pomace was poured into the bag placed in the press to ensure that the initial free run juice was captured. The bag, acting as a filter, prevented unwanted solids being included in the juice. Free run juice was captured from the instant the pomace was poured into the press, to when the press reached a pressure of 200 kPa, at which time the bucket capturing the juice was swapped with a new one. This first bucket of juice was considered the free run treatment. The second juice sample was collected from 200 kPa until juice ceased to flow from the pomace under sustained pressure. This second sample was considered the pressure extraction treatment. Juice was then funnelled into labelled 500 mL amber swing-top wire-bail bottles and two bottles were filled with juice from each treatment. Potassium metabisulphite (Chem-Supply, Gillman, SA, Australia), was added to each bottle at 50 ppm, and the bottles were stored at 4 °C.
The four resulting treatments with three replicates for each variety were:
-
No maceration and free run;
-
No maceration and pressure extraction;
-
2-hr maceration and free run;
-
2-hr maceration and pressure extraction.

2.2. Juice Quality Analysis

Prior to analysis, samples were centrifuged for 10 min at 4000 rpm. Juice samples were brought to room temperature and titratable acidity (TA) and pH were measured using an autotitrator (metrohm, 702 Sm Titrino, Switzerland) where TA was measured in g/L of malic acid. Total soluble solids (TSS) was measured in Brix with a hand-held digital refractometer (A. Kruss Optronic, Hamburg, Germany).
Yeast assimilable nitrogen (YAN) of the apple juice was calculated by adding the ammonia nitrogen (AN) to the primary amino acid nitrogen (PAAN). AN and PAAN were determined using analysis kits from Vintessential laboratories, designed for grape juice and wine as reported in Carew, et al. [19].
The AN was measured according to the protocol outlined in the ‘Enzymatic Analysis Kit for the Determination of Ammonia in Grape Juice and Wine’. For each sample, 0.5 mL of buffer, 0.05 mL of NADH, 0.95 mL of distilled water and 0.05 mL of sample was pipetted into a disposable UV quartz cuvette (all from batch N-352-6, Brand-GMHB, Wetheim, Germany). After mixing well and leaving for 5 min, absorbances were read. A total of 0.01 mL of GIDH was added and mixed and left to sit for 20 min before the absorbances were measured again using a spectrophotometer (SPECTROstar Nano, BMG LABTECH, Windsor, NSW, Australia). The standard was prepared the same way, but 0.05 mL of the sample reagent was added instead of sample. To prepare the blank, 1 mL of distilled water was added rather than 0.95 mL.
The PAAN content of the apple juice was determined using an alkaline buffer, N-acetyl-L-cysteine (NAC) and Orthophthaldialdehyde (OPA). A total of 1 mL of buffer, 0.45 mL of NAC and 0.025 mL of standard or sample was pipetted into disposable UV quartz cuvettes (all from batch N-352-6, Brand-GMHB, Wetheim, Germany). For the blank, 0.025 mL of distilled water was added instead of sample or standard. After mixing well, absorbances were read. A total of 0.5 mL of OPA was added into the cuvettes, mixed and left for 10 min before reading absorbances again using a spectrophotometer.
To determine phenolic content of the juices produced, both the Folin–Ciocalteu and a spectrophotometric method for measuring total phenolics in wine [20] (referred to from now on as the A280 method) were utilised and the consistency of the results was compared. The Folin–Ciocalteu method was used because it is a commonly used method for cider analysis by cider producers, however, it is known that the reagents can be affected by other antioxidants in the juice besides phenols as well as sugars, proteins and sulphites [21]. For this reason, the A280 method was also used to measure the phenolics as it is not affected by sulphites. Sulphites will protect phenolics from oxidation but will not reverse it. Oxidation will not significantly affect A280. The A280 method is yet to be validated for using in cider, however recent studies have employed this method with reliable results [2]. Although the absolute values of both methods differ because of the different measurements units, the results are comparable.
The Folin–Ciocalteu method uses reducing capacity, through electron transfer, which is expressed as phenolic content [22]. For the Folin–Ciocalteu method [16], two reagents (A and B) were required with reagent A prepared by adding 75 mL of Folin–Ciocalteu reagent to 750 mL of distilled water. Reagent B was prepared by dissolving 57.5 g of sodium carbonate in distilled water and made up to 500 mL. A total of 0.1 mL of juice was combined in a test tube with 5 mL of reagent A, mixed and left for 5 min before 3.5 mL of reagent B was added and mixed. The test tubes were incubated for 1 h in a water bather at 40 °C. Using quartz cuvettes (J-075-8 Brand-GMHB, Wetheim, Germany), the absorbance was measured at 765 nm with a spectrophotometer (SPECTROstar Nano, BMG LABTECH, Windsor, NSW, Australia). The total phenolic content was calculated from a standard calibration curve diluted at 0; 0.1; 0.2; 0.4; 0.6; 0.8 and 1.0 mg/mL and expressed in mg/mL of p-coumaric acid equivalents [16]. p-Coumaric acid is a hydroxycinnamic acid which is classified as one of the major polyphenol classes found in apples [7,23]. When using HPLC to determine the phenolic content of apple and any apple derivatives, p-coumaric acid is always found in high concentrations as a representative of one of the main phenolic compounds in apples [23,24,25]. The Folin–Ciocalteu method can be used with a range of standards such as gallic acid, tannic acid, catechin and pyrogallol [26]. As the results are expressed as single numbers, in this case milligrams per litre of p-coumaric acid equivalents, the unit is basically arbitrary [27]. For this purpose, Folin–Ciocalteu results are displayed as mg/mL.
The A280 method was also employed to quantify the total phenolics [20]. Juice samples were clarified by centrifugation, diluted 1/50 in 1 M HCl, using disposable quartz cuvettes and the samples were individually scanned between the wavelengths 200–600 nm with a spectrophotometer (SPECTROstar Nano, BMG LABTECH, Windsor, NSW, Australia) to collect phenolic spectral fingerprints [28]. Total phenolics were calculated using absorbance at 280 nm and measured in absorbance units (AU) [17,20]. A recent study using this method with apple cider showed peaks occurring at 280 nm, indicating total phenolics, as results have found in similar studies measuring the total phenolic content in wine [2,17,29].

2.3. Statistical Analysis

Spectrophotometric data for phenolic analysis was analysed to determine the phenolic profile differences using The Unscrambler (The Unscrambler X, V. 10.2, CAMO software, Magnolia, TX, USA). Principal component analysis of UV-visible spectra was used to determine the major drivers for juice phenolic composition related to treatment effects. All other data were analysed using SPSS (SPSS statistical package 16, IBM, Armonk, NY, USA) with a univariate general linear model approach to determine interactions between pre-fermentation treatments followed by paired t-tests to identify statistical differences between the means performed when necessary. Pearson’s correlations were completed between the spectrophotometric phenolic data sets obtained by the Folin–Ciocalteu and the A280 methods.

3. Results and Discussion

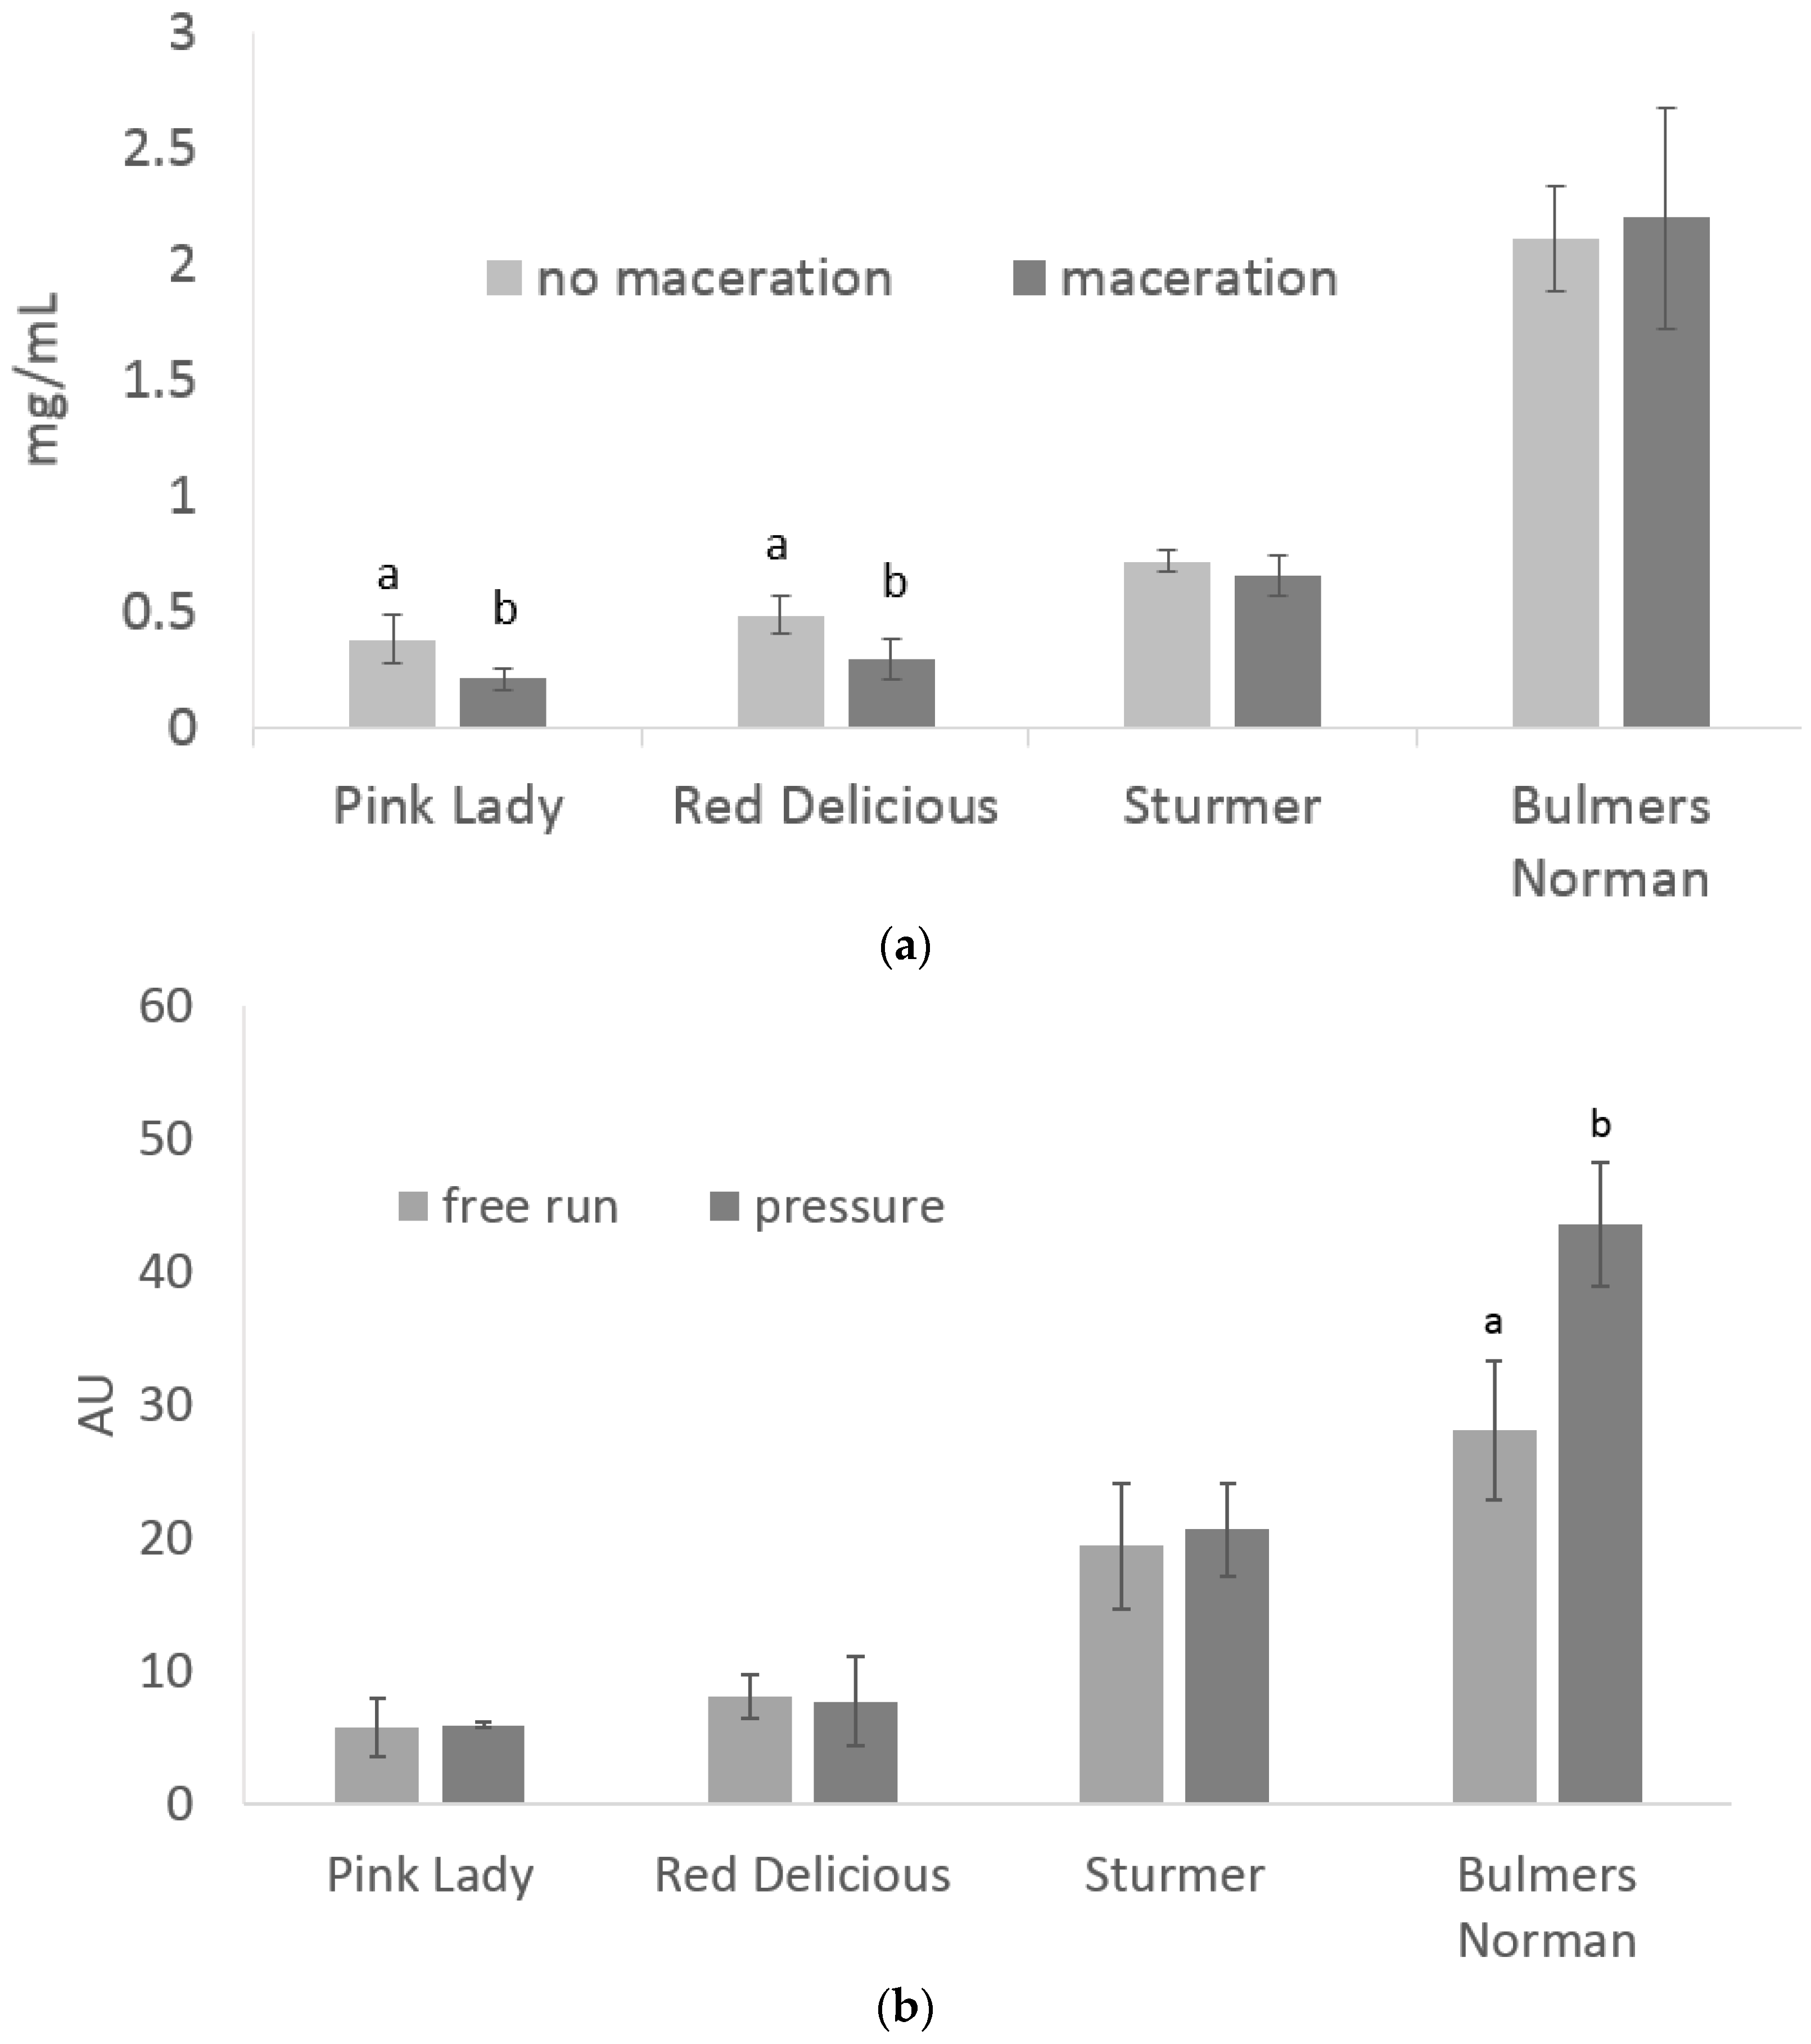
3.1. Total Phenolics under Maceration and Press Treatments

In general, the phenolic content of the extracted apple juice was strongly varietal dependant and the effects of pre-fermentation treatments varied between the method of phenolic measurement used and also between varieties (Figure 1). For the desert varieties, total phenolic content was relatively low when measured using both the Folin–Ciocalteu and A280 method. Using the Folin–Ciocalteu method, total phenolics for ‘Pink Lady’ ranged between 0.148 and 0.564 mg/mL, ‘Red Delicious’ between 0.215 and 0.586 mg/mL. Using the A280 method, total phenolics of ‘Pink Lady’ ranged between 2.98 and 9.19 AU, ‘Red Delicious’ between 3.79 and 14.17 AU. For the culinary variety ‘Sturmer’ total phenolics from the Folin Ciocalteu method ranged between 0.463 and 0.786 mg/mL and the A280 method ranged from 10.23 and 26.30 AU. For the cider variety ‘Bulmer’s Norman’ total phenolics were substantially higher, ranging from 1.257 and 3.105 mg/mL using the Folin–Ciocalteu method and from 18.82 to 53.17 AU using the A280 method.
For all varieties, there was no interaction between the two pre-fermentation treatments, however there were significant treatment effects for maceration when analysed with the Folin–Ciocalteu method and press fraction when analysed with the A280 method.
A consistent trend was observed using the Folin–Ciocalteu method of phenolic analysis for the dessert (‘Red Delicious’ and ‘Pink Lady’) and culinary (‘Sturmer’) apples for lower phenolic content when apple juice was macerated. This finding was significant for both dessert varieties where maceration decreased the total phenolic content of the juice when analysed using the Folin–Ciocalteu method (Figure 1a). When the juice was analysed using the A280 method, ‘Bulmer’s Norman’ juice extracted under pressure, had significantly higher phenolic content than free run juice (Figure 1b).
There is limited research investigating the impact of the length of maceration time on apple juice, especially between varieties and types of apples. The juice industry uses maceration, in combination with enzymatic treatments, to improve overall juice yield and facilitate the pressing operation [1,30], with little consideration given to phenolics. Other studies imply that maceration may influence phenolic content but do not allude to the nature of the effect [31].
Evidence has pointed to a decrease in phenolics following an extended period of oxidation between milling and pressing, which was supported in this study for the low phenolic varieties [1,4,30]. This is most likely due to the activity of the enzyme polyphenol oxidase, and other reactions causing oxidation of the polyphenols in the pomace [1,4,31,32]. During maceration, the oxidation process may lead to a higher proportion of procyanidins (tannins) to be adsorbed by the cell-wall matrix of the apple pomace, making it difficult to extract these phenolic compounds during pressing, leading to a decrease in the phenolic content of the resulting juice [4,30]. In the current study, total phenolics were measured rather than phenolic composition which is why the phenolic content of the apple varieties is scaled as either high or low as the actual makeup is unknown. Because the phenolic composition was not the focus of this study, it is unknown if the procyanidin content was significantly different between maceration treatments because of adsorption and driving the differences in total phenolics seen in this study.
Similarities exist between cider production and white wine making because of the fruit fermentation process. Although some practices may not have parallel outcomes, phenolic research in wine can provide some valuable learnings for cider research. In wine making, phenolics are also desirable, particularly tannins in red wine [18]. Rather than having a deleterious effect on phenolics in wine making, the maceration process can be used to increase the pigments, aroma and flavour compounds (which includes phenolics) extracted from grape skins [13]. In winemaking, the majority of the phenolics are found in the skin and seed, however, it is easier and more predictable to extract phenolics from the grape skin [18]. Within the wine literature, the evidence for the effect of maceration on phenolic content is contrasting, but the effect is generally thought to be positive [13]. Similarly, in wine, the overall phenolic concentration is more dependent on the variety than wine production practices [13,14,33].
No influence of maceration was found for juice from ‘Bulmer’s Norman’ apples, which had substantially higher phenolic content and sugar compared to the other varieties. Dessert and culinary varieties typically yield a lower concentration of phenolics compared to traditional cider varieties [30,34] as was confirmed in this study. Previous research has identified that the Folin–Ciocalteu method for determining phenolic content is compromised when sugar content is high, which may explain why the trend was not observed in the high sugar variety ‘Bulmer’s Norman’ [18]. Interestingly, the trend of lower phenolic content for juice not undergoing maceration was not observed when the juice was analysed for phenolics using the A280 method, suggesting that these methods may be measuring a different set of compounds. This is most likely due to Folin–Ciocalteu method being proven to have its total phenolic content measurements interfered with by other compounds in the solution reacting with the reagent [21]. Therefore, it is likely the results are not only representing the total phenolic content of the sample, but potentially also being spiked by another compound present in the sample.
It is possible that an influence of maceration was limited in this study due to the length of the maceration period, particularly for higher phenolic varieties such as ‘Bulmer’s Norman’. It is possible that the impact of maceration on apple juice extracted may be amplified when using longer maceration times. Traditional cider making methods allow maceration to take place over a full day, however, more modern practices range from two to four hours of maceration to reduce the risk of contamination [1]. A review on winemaking practices in red wines found that tannin increased with extended maceration but not anthocyanin as it was found that anthocyanins peak after four to five days of skin contact, with very little gain after 10 days [14]. Future research should consider a greater range of maceration times to clarify optimal maceration times prior to fermentation to benefit the total phenolic extraction with these varieties, as well as the application of maceration during fermentation as applied in the wine industry. Further research focus can also include varying the shape and size of maceration vessels and mixing the pomace at certain intervals to increase the chance of oxidation.
The significant difference between free run and juice extracted under pressure found using the A280 method (Figure 1b) suggests that extracting juice under pressure can increase the amount of phenolics in the resulting juice, when the total phenolic content of the apples juice is naturally high. This is most likely due to the effects of increased pressure on the cellular organelles in the fruit tissue, as phenolics are generally found in the acidic plant cell vacuole or in the cytoplasm [32]. Increased pressure results in a higher juice yield [35], so it is possible that the extra juice collected contains liquid from these areas in the cells with phenolics that will otherwise be lost in the pressed pulp. Pressing had very little impact on the quality measures of the three other varieties which indicates that press fraction techniques and infrastructure is less important for low phenolic varieties.
As with maceration, only two press fraction treatments were trialled in this study, a wider range of pressure may have shown a trend or a threshold in the relationship between pressure and total phenolic extraction. A potential influencing factor of the interaction between press fraction and total phenolic content is the maturity of the apples used. Previous studies have demonstrated the changing phenolic values that result from different varieties at varying harvest maturities [2,36,37]. Most of the apples used in the current study had plentiful free run juice after milling except for ‘Bulmer’s Norman’. Industry practice is to leave this variety on the tree until just prior to abscission, hence maximising maturity. This variety was more difficult to press and appeared to have a lower juice content, consequently, the free run juice did not flow as easily from the press as the other varieties. This may be related to their maturity at harvest or is a characteristic of this variety.

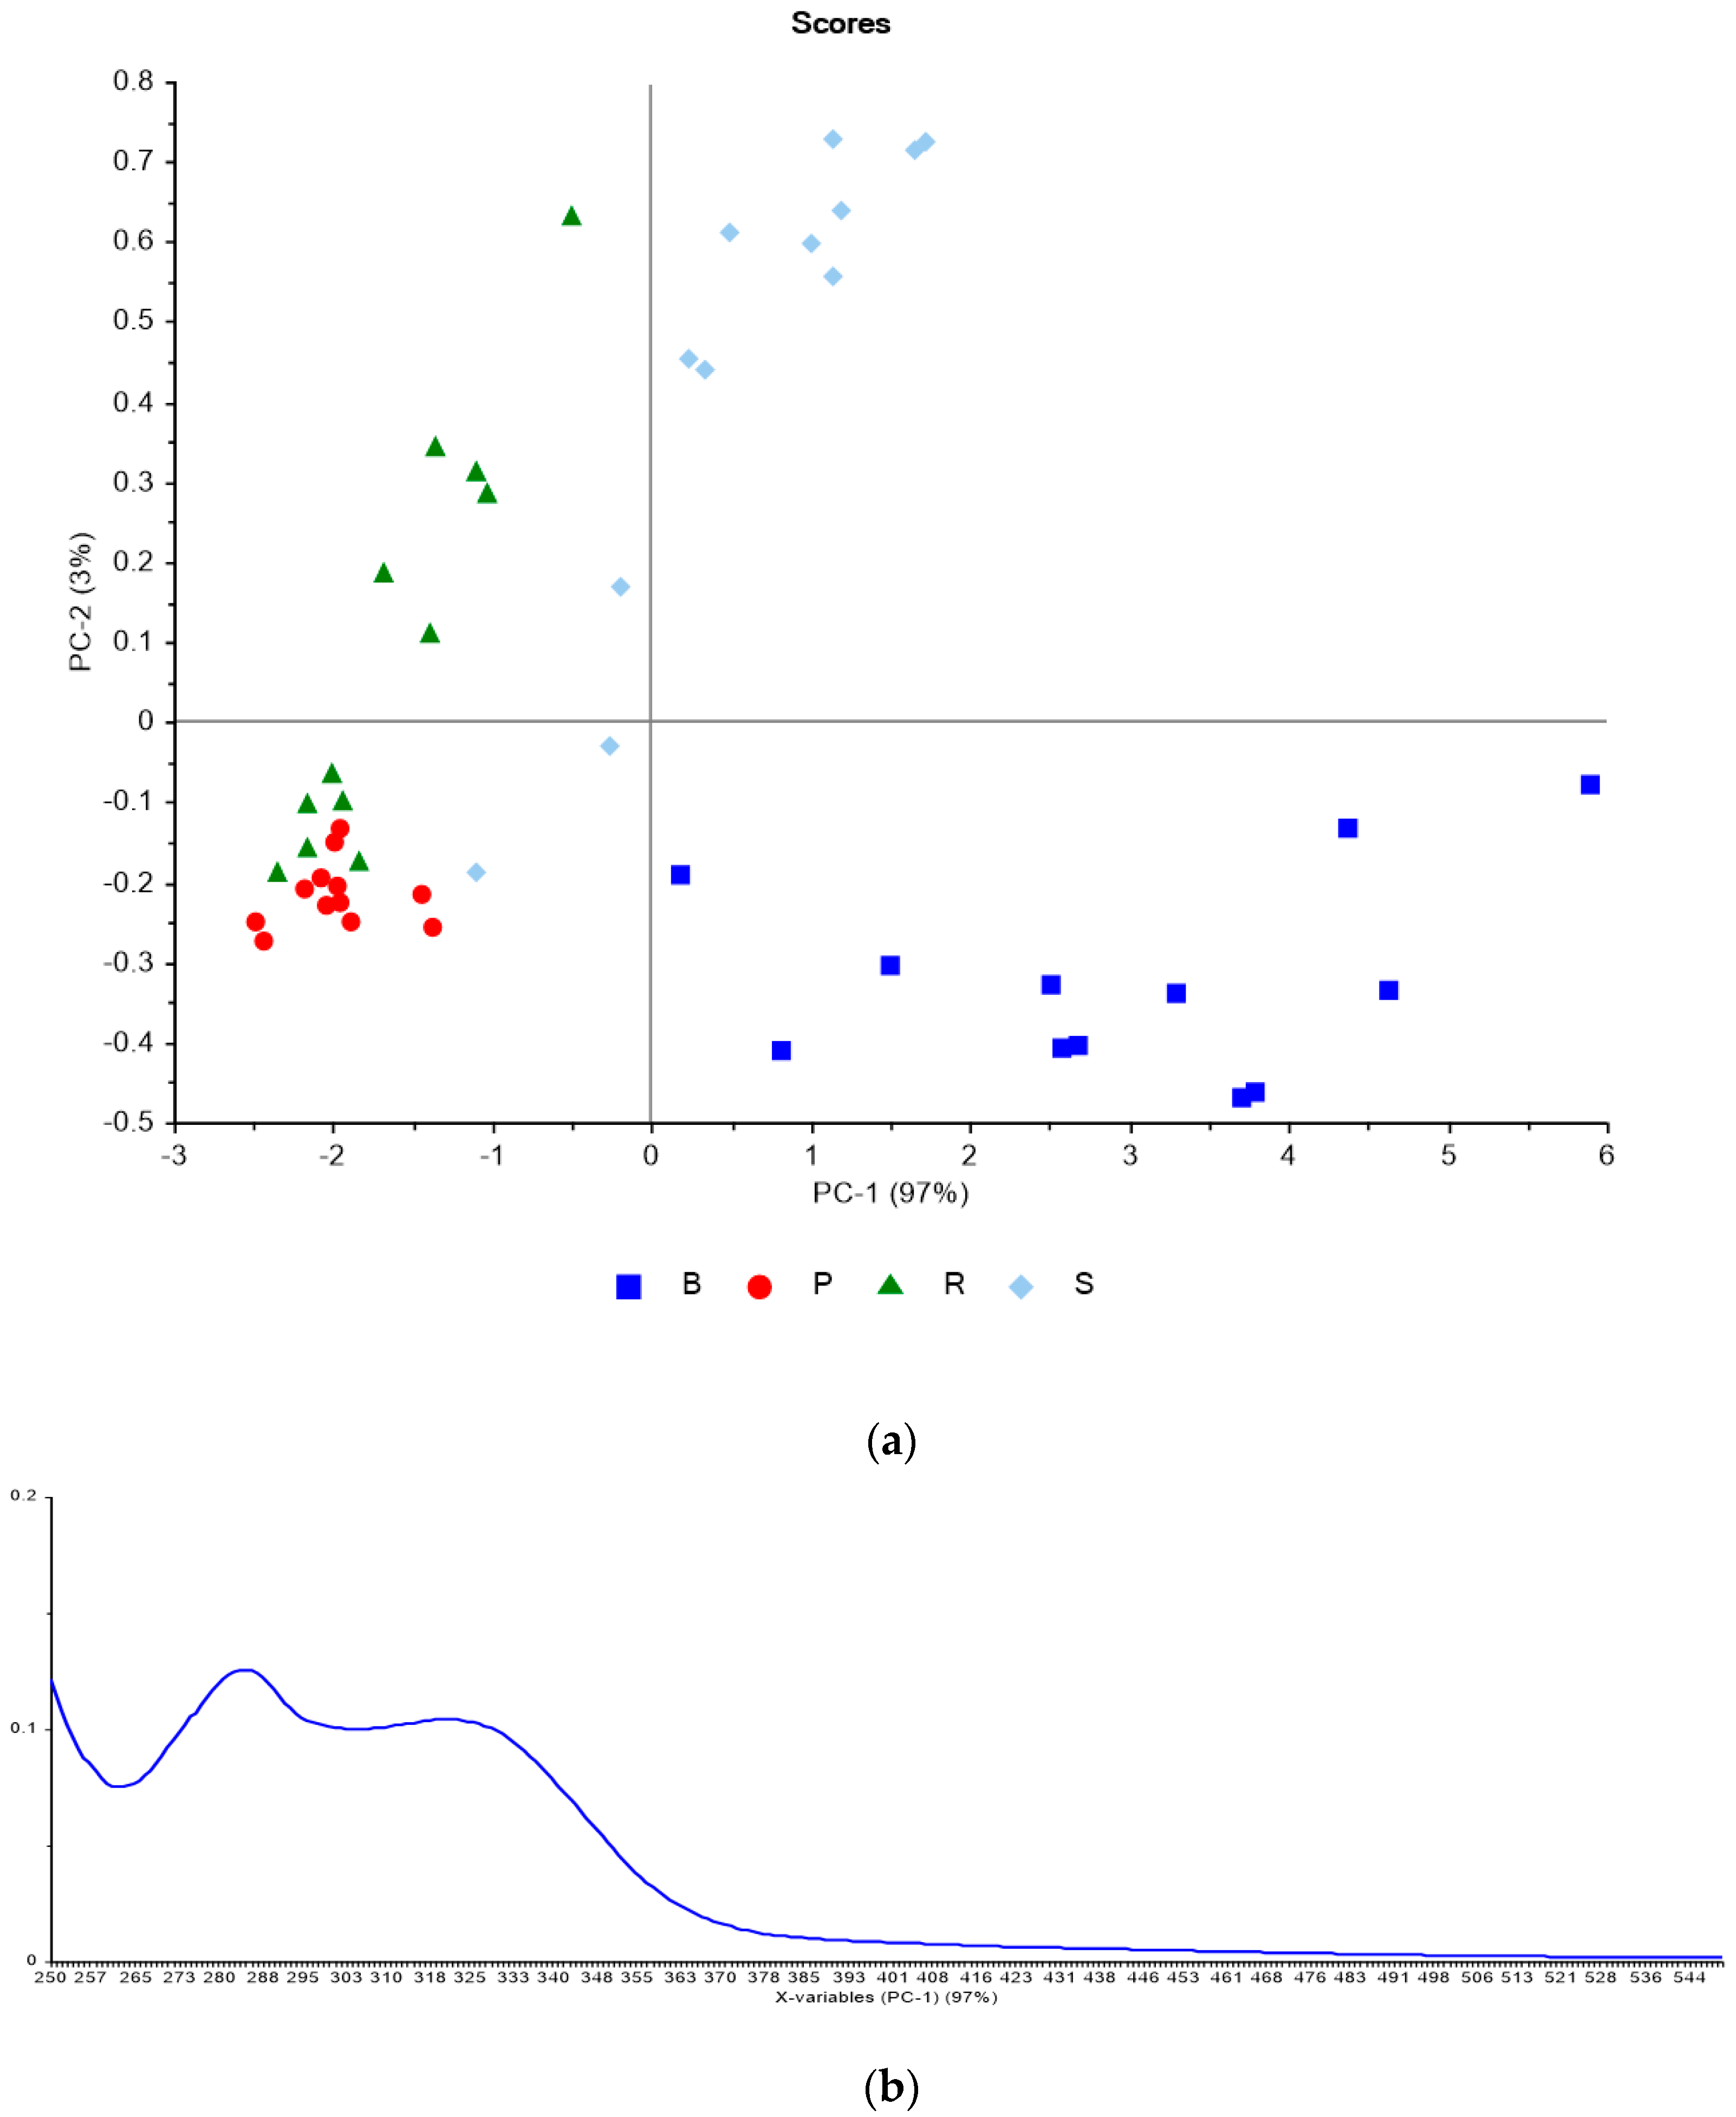
3.2. Phenolic Analysis Method Comparison

The Folin–Ciocalteu method to estimate phenolic content is the widely accepted method used by cider makers and is well represented in traditional cider and wine literature [18]. In contrast, the A280 method is more commonly used by wine makers and for modern wine research and literature [18] with limited application to cider phenolic analysis to date. In a recent study by Girschik et al. [2], the A280 method clearly distinguished phenolic profiles between apple varieties and levels of harvest maturity.
When comparing the Folin–Ciocalteu and A280 methods, there was a moderate but significant correlation between total phenolic values for ‘Red Delicious’ (R2 = 0.64) and ‘Sturmer’ (R2 = 0.5) and a weak but significant correlation for ‘Pink Lady’ (R2 = 0.34). A very low positive correlation was found between the data sets for ‘Bulmer’s Norman’ (R2 = 0.18). The relationships between treatment averages for each analytical method in general were inconsistent across varieties. The correlation between both data sets shows that either method is reliable when measuring apple juice that has a low phenolic content. It should be noted that although a correlation was found between the methods, this did not result in consistent interpretation of treatment effects on phenolic content.
The PCA shows clear separation of varieties was evident using the absorbance data. As shown in Figure 2a, principal component 1 separates the varieties for juice. The PCA scores plot shows that 97% of the variation was found along the x-axis. The y-axis is responsible for the resulting 3% of the difference between the varieties. In Figure 2b, principal component 1 had positive loadings for both 280 and 330 nm. Varietal clustering with PCA implies that high 280 and 330 nm absorbance is associated with the ‘Bulmer’s Norman’ variety indicating greater total phenolic and hydroxycinnamate content. The PCA scores plot shows varieties were clearly separated at the two peaks at 280 nm and 330 nm, particularly ‘Bulmer’s Norman’, suggesting that the juice spectra of the different varieties were distinctly different.
This study facilitated a critical assessment of both methods in terms of the efficiency of the approach, and the reliability and consistency of results. Although both methods require a spectrophotometer to determine absorbance, the A280 method is relatively simple, time and cost efficient when compared to the Folin–Ciocalteu method. Waterhouse [18] also showed that the Folin–Ciocalteu method results can be negatively influenced by sulphur dioxide and when sugar content of the apple juice is high. This comparison of methods provides further support for the effective use of the A280 method as the more modern and efficient method with suitability for cider analysis. However, further analysis with the use of high-performance liquid chromatography (HPLC) is required to validate this method for use with cider.

3.3. Standard Analysis of Apple Juice

There were no interactions between pre-fermentation treatments or significant differences for the standard apple juice quality measurements of pH, TSS (°Brix), and YAN (mg/L) for each treatment on the four varieties tested (Table 1). Mean TSS was 11.67 for ‘Pink Lady’, 11.7 for ‘Red Delicious’, 13.13 for ‘Bulmer’s Norman’ and 13.98 for ‘Sturmer’. Mean pH was 3.3 for ‘Sturmer’, 3.54 for ‘Pink Lady’, 4.06 for ‘Red Delicious’ and 4.19 for ‘Bulmer’s Norman’. Mean YAN (g/L) was 70.21 for ‘Red Delicious’, 31.00 for ‘Pink Lady’, 26.73 for ‘Bulmer’s Norman’ 26.73 and 29.25 for ‘Sturmer’. Whilst differences of scale were found between varieties, there was no influence of pre-fermentation treatments on this data.
When measuring TA, significant findings were found for both treatments but only for ‘Pink Lady’. Higher TA was found when the juice was not macerated compared to macerated juice (Table 1). Excluding ‘Bulmer’s Norman’, the TA values for other varieties were also higher when juice was not macerated however these were not statistically significant. While there is minimal literature exploring the connection between TA and maceration for apple juice, it has been investigated in wine, particularly red wine. However, these red wine studies had far longer maceration times, including maceration for up to 20 days. Results showed that in general, maceration reduces TA as found here, although findings were variety dependent [33,38]. For varieties such as chardonnay, Guttart et al. [39], reported that short maceration is common practice for extraction of varietal aroma and organoleptic compounds to improve the quality of the resulting wine.
TA was significantly higher when extracted under pressure compared to free run for ‘Pink Lady’ juice, however, this trend was not consistent with the other varieties. Jolicoeur [1] reported that orchard management is thought to have little impact on the juice TA relative to the influence of climate and growing conditions. However, the effect of cider making processes on TA were not mentioned. Jolicoeur [1] also classified the ranges of TA expressed in grams of malic acid equivalents per litre and relates them to suitability for cider. It is unclear why treatment effects were more pronounced for ‘Pink Lady’ than other varieties, however differences may be related to their acidity classification. Using Jolicoeur’s classification which categorises apples with a TA between 4.5 and 11 g/L as medium acidity and balanced and ideal for cider, juice from ‘Pink Lady’ may be more susceptible to pre-fermentation treatment and thus can be used in a blend to balance TA. Both ‘Red Delicious’ and ‘Bulmer’s Norman’ are classified as being sweet apples according to their low acidity (<4.5 g/L across all treatments). The juice from ‘Sturmer’ apples is in the high acidity class where most table apples belong, yet they also had the highest sugar content. Therefore, ‘Sturmer’ apples may also be a useful addition to cider blends because of their sugar/acid balance.

3.4. Implication of Apple Variety Choices on Cider Style

Cider is often made using a blend of different varieties, as few varieties have the ideal combination of organoleptic properties to be considered as “perfect cider” apples for single variety ciders. This issue is also usually compounded by lack of sufficient quantities of such varieties available for cider production. Desirable characteristics of apples for cider making include high sugar (for alcohol production), medium acidity (flavour balance) and medium phenolic content (mouthfeel) [1], however cider makers vary in their requirements depending on the style of cider they are producing. Apple varieties are selected for blending depending on their characteristics and availability at the time. Therefore, varietal information on simple juice characteristics as well as total phenolic concentrations would benefit cider makers in varietal selection and cider style choice.

4. Conclusions

The effects of maceration and pressure treatments on phenolic content of apple juice varied between apple varieties. These research findings have implications for cider makers in the methods and equipment they adopt for cider production and the variety choice for blending. When phenolic concentration was high, such as the ‘Bulmer’s Norman’ variety, greater pressure increased the extraction of phenolics. For low phenolic varieties, such as ‘Pink Lady’, ‘Red Delicious’ and ‘Sturmer’, maceration had a reduced effect on phenolic extraction. For cider makers who regularly use readily available apples that are usually low in phenolics, maceration may not result in an improvement in phenolic content.
This study was limited to analysing four varieties and found large variation among the apple varieties, highlighting the need to benchmark the characteristics of different varieties used for cider making to optimise cider production. Because of the simplicity, cost and time efficiency, A280 method would be the preferred method to measure the total phenolic content of cider. In addition to quantifying phenolic content using A280 for cider, there is a requirement for further research in this area, to allow for wide acceptance of this analytical method by cider producers and the research community. Further research should include studying the phenolic composition using high performance liquid chromatography (HPLC) variety benchmarking also to validate the use of A280 as a reliable method for phenolic content analysis in cider.

Author Contributions

Conceptualization and methodology of this research was done by M.L.W., J.E.J. and N.D.S.; formal analysis, investigation, data curations and writing—original draft preparation, by M.L.W.; writing—review and editing, was a joint effort between M.L.W., J.E.J., N.D.S. and R.G.D. The research was supervised J.E.J., N.D.S. and R.G.D.

Funding

This research was funded by the Tasmanian Institute of Agriculture at the University of Tasmania with in-kind support from Brady’s Lookout, Spreyton Cider, Willie Smith Cider, Hansen Orchards, Lucaston Park Orchards, Calvert Bros. M.L.W. was supported by a scholarship provided by Fruit Growers Tasmania.

Acknowledgments

The authors wish to acknowledge TIA’s Justin Direen, Caroline Claye and Phil Andrews for their technical support. The authors also wish to acknowledge Tim Jones from Willie Smith, Damien Viney from Spreyton Fresh, Caro Brown from Brady’s Lookout and Mark Robertson from Lost Pippin, whose input and support was greatly appreciated.

Conflicts of Interest

The authors declare no conflict of interest.

References

  1. Jolicoeur, C. The New Cider Maker’s Handbook; Chelsea Green Publishing: White River Junction, VT, USA, 2013; p. 337. [Google Scholar]
  2. Girschik, L.; Jones, J.E.; Kerslake, F.L.; Robertson, M.; Dambergs, R.G.; Swarts, N.D. Apple variety and maturity profiling of base ciders using UV spectroscopy. Food Chem. 2017, 228, 323–329. [Google Scholar] [CrossRef] [PubMed]
  3. Yahia, E.M. Apple flavor. Hortic. Rev. 1994, 16, 197–234. [Google Scholar]
  4. Nogueira, A.; Guyot, S.; Marnet, N.; Lequéré, J.M.; Drilleau, J.F.; Wosiacki, G. Effect of alcoholic fermentation in the content of phenolic compounds in cider processing. Braz. Arch. Biol. Technol. 2008, 51, 1025–1032. [Google Scholar] [CrossRef] [Green Version]
  5. Johansen, K. Cider Production in England and France and Denmark? Brygmesteren 2000, 6, 2–15. [Google Scholar]
  6. Guyot, S.; Marnet, N.; Laraba, D.; Sanoner, P.; Drilleau, J.F. Reversed-phase HPLC following thiolysis for quantitative estimation and characterization of the four main classes of phenolic compounds in different tissue zones of a French cider apple variety (Malus domestica var. Kermerrien). J. Agric. Food Chem. 1998, 46, 1698–1705. [Google Scholar] [CrossRef]
  7. Alonso-Salces, R.M.; Barranco, A.; Abad, B.; Berrueta, L.A.; Gallo, B.; Vicente, F. Polyphenolic profiles of Basque cider apple cultivars and their technological properties. J. Agric. Food Chem. 2004, 52, 2938–2952. [Google Scholar] [CrossRef] [PubMed]
  8. Sanoner, P.; Guyot, S.; Marnet, N.; Molle, D.; Drilleau, J.F. Polyphenol profiles of French cider apple varieties (Malus domestica sp.). J. Agric. Food Chem. 1999, 47, 4847–4853. [Google Scholar] [CrossRef] [PubMed]
  9. Eder, R. Wine Presses; University of Life Sciences: Vienna, Austria, 2010. [Google Scholar]
  10. Cliffe, S.; Fawer, M.S.; Maier, G.; Takata, K.; Ritter, G. Enzyme assays for the phenolic content of natural juices. J. Agric. Food Chem. 1994, 42, 1824–1828. [Google Scholar] [CrossRef]
  11. Lea, A. Tannin and colour in English cider apples. Flüss. Obst 1984, 8, 1–5. [Google Scholar]
  12. Singleton, V.L. Oxygen with phenols and related reactions in musts, wines, and model systems: Observations and practical implications. Am. J. Enol. Vitic. 1987, 38, 69–77. [Google Scholar]
  13. González-Neves, G.; Favre, G.; Gil, G.; Ferrer, M.; Charamelo, D. Effect of cold pre-fermentative maceration on the color and composition of young red wines cv. Tannat. J. Food Sci. Technol. 2015, 52, 3449–3457. [Google Scholar] [CrossRef] [PubMed]
  14. Sacchi, K.L.; Bisson, L.F.; Adams, D.O. A review of the effect of winemaking techniques on phenolic extraction in red wines. Am. J. Enol. Vitic. 2005, 56, 197–206. [Google Scholar]
  15. Romero-Cascales, I.; Fernández-Fernández, J.I.; López-Roca, J.M.; Gómez-Plaza, E. The maceration process during winemaking extraction of anthocyanins from grape skins into wine. Eur. Food Res. Technol. 2005, 221, 163–167. [Google Scholar] [CrossRef]
  16. Poorter, H.; de Jong-Van Berkel, Y. Chemical Determination of Phenolic Compounds. Available online: http://prometheuswiki.org/tiki-pagehistory.php?page=Chemical%20determination%20of%20phenolic%20compounds&preview=9 (accessed on 15 June 2016).
  17. Kerslake, F.; Longo, R.; Dambergs, R. Discrimination of juice press fractions for sparkling base wines by a UV-Vis spectral phenolic fingerprint and chemometrics. Beverages 2018, 4, 45. [Google Scholar] [CrossRef]
  18. Waterhouse, A.L. Determination of Total Phenolics. In Current Protocols in Food Analytical Chemistry; Wrolstad, R., Ed.; John Wiley & Sons, Inc.: New York, NY, USA, 2002. [Google Scholar]
  19. Carew, A.L.; Gill, W.; Close, D.C.; Dambergs, R.G. Microwave maceration with early press off improves phenolics and fermentation kinetics in Pinot Noir. Am. J. Enol. Vitic. 2014, 2014, 13089. [Google Scholar]
  20. Iland, P. Chemical Analyses of Grapes and Wine: Techniques and Concepts; Patrick Iland Wine Promotions Pty Ltd.: Athelstone, Australia, 2000. [Google Scholar]
  21. Everette, J.D.; Bryant, Q.M.; Green, A.M.; Abbey, Y.A.; Wangila, G.W.; Walker, R.B. Thorough study of reactivity of various compound classes toward the Folin—Ciocalteu reagent. J. Agric. Food Chem. 2010, 58, 8139–8144. [Google Scholar] [CrossRef] [PubMed]
  22. Noreen, H.; Semmar, N.; Farman, M.; McCullagh, J.S. Measurement of total phenolic content and antioxidant activity of aerial parts of medicinal plant Coronopus didymus. Asian Pac. J. Trop. Med. 2017, 10, 792–801. [Google Scholar] [CrossRef]
  23. Pérez-Ilzarbe, J.; Hernández, T.; Estrella, I. Phenolic compounds in apples: Varietal differences. Z. Lebensm. Unters. Forsch. 1991, 192, 551–554. [Google Scholar] [CrossRef]
  24. Suárez, B.; Picinelli, A.; Mangas, J. Solid-phase extraction and high-performance liquid chromatographic determination of polyphenols in apple musts and ciders. J. Chromatogr. A 1996, 727, 203–209. [Google Scholar] [CrossRef] [Green Version]
  25. Schieber, A.; Keller, P.; Carle, R. Determination of phenolic acids and flavonoids of apple and pear by high-performance liquid chromatography. J. Chromatogr. A 2001, 910, 265–273. [Google Scholar] [CrossRef]
  26. Blainski, A.; Lopes, G.; de Mello, J. Application and analysis of the folin ciocalteu method for the determination of the total phenolic content from Limonium Brasiliense L. Molecules 2013, 18, 6852–6865. [Google Scholar] [CrossRef] [PubMed]
  27. Singleton, V.L.; Orthofer, R.; Lamuela-Raventós, R.M. Analysis of total phenols and other oxidation substrates and antioxidants by means of folin-ciocalteu reagent. In Methods in Enzymology; Elsevier: Amsterdam, The Netherlands, 1999; Volume 299, pp. 152–178. [Google Scholar]
  28. Kerslake, F.; Jones, J.; Close, D.; Dambergs, R. Bunch exposure effects on the quality of pinot noir and chardonnay fruit and base wines for cool climate sparkiling wine production. In Proceedings of the 18th Symposium of the Group of International Experts of Vitivinicultural Systems for Cooperation (GiESCO 2013), Porto, Portugal, 7–11 July 2013; pp. 471–477. [Google Scholar]
  29. Somers, T.C.; Ziemelis, G. Spectral evaluation of total phenolic components in Vitis vinifera: Grapes and wines. J. Sci. Food Agric. 1985, 36, 1275–1284. [Google Scholar] [CrossRef]
  30. Mihalev, K.; Schieber, A.; Mollov, P.; Carle, R. Effect of mash maceration on the polyphenolic content and visual quality attributes of cloudy apple juice. J. Agric. Food Chem. 2004, 52, 7306–7310. [Google Scholar] [CrossRef]
  31. Van der Sluis, A.A.; Dekker, M.; Skrede, G.; Jongen, W.M. Activity and concentration of polyphenolic antioxidants in apple: Effect of cultivar, harvest year, and storage Conditions. J. Agric. Food Chem. 2002, 50, 7211–7219. [Google Scholar] [CrossRef] [PubMed]
  32. Gonzalez, M.E.; Barrett, D.M. Thermal, high pressure, and electric field processing effects on plant cell membrane integrity and relevance to fruit and vegetable quality. J. Food Sci. 2010, 75, R121–R130. [Google Scholar] [CrossRef] [PubMed]
  33. Volschenk, H.; Van Vuuren, H.; Viljoen-Bloom, M. Malic acid in wine: Origin, function and metabolism during vinification. S. Afr. J. Enol. Vitic. 2006, 27, 123–136. [Google Scholar] [CrossRef]
  34. Kahle, K.; Kraus, M.; Richling, E. Polyphenol profiles of apple juices. Mol. Nutr. Food Res. 2005, 49, 797–806. [Google Scholar] [CrossRef]
  35. Lea, A.G. Craft Cider Making, 3rd ed.; The Crowood Press LTD: Marlborough, UK, 2015. [Google Scholar]
  36. Spanos, G.A.; Wrolstad, R.E. Influence of variety, maturity, processing and storage on the phenolic composition of pear juice. J. Agric. Food Chem. 1990, 38, 817–824. [Google Scholar] [CrossRef]
  37. Alberti, A.; dos Santos, T.P.M.; Zielinski, A.A.F.; dos Santos, C.M.E.; Braga, C.M.; Demiate, I.M.; Nogueira, A. Impact on chemical profile in apple juice and cider made from unripe, ripe and senescent dessert varieties. LWT Food Sci. Technol. 2016, 65, 436–443. [Google Scholar] [CrossRef]
  38. Plavša, T.; Jurinjak, N.; Antunović, D.; Peršurić, Đ.; Ganić, K.K. The influence of skin maceration time on the phenolic composition and antioxidant activity of red wine teran (Vitis vinifera L.). Food Technol. Biotechnol. 2012, 50, 152–158. [Google Scholar]
  39. Guttart, A.; Hernandez-Orte, P.; Cacho, J. Effects of maceration on the amino acid content of Chardonnay musts and wines. Vitis Geilweilerhof 1997, 36, 43–48. [Google Scholar]
Figure 1. Total Phenolic content of juice extracted from four apple varieties as impacted by pre-fermentation treatment maceration, measured by the Folin–Ciocalteu method in p-coumaric acid equivalents mg/mL (a) and press fractions as measured by spectrophotometric absorbance at 280 nm (A280) in AU (b).
Beverages 05 00053 g001
Figure 2. Spectral analysis of ‘Red Delicious’ (R), ‘Bulmer’s Norman’ (B), ‘Sturmer’ (S) and ‘Pink Lady’ (P) must. (a) Scores plot for principal component analysis (PCA), 250–550 nm. (b) Loadings plot for principal component 1 from PCA, 250–550 nm.
Beverages 05 00053 g002
Table 1. Standard base cider quality measurements, total soluble sugars (TSS) (°Brix), yeast assimilable nitrogen (YAN) (mg/L), pH and titratable acidity (TA) (g/L of malic acid), of juice from ‘Red Delicious’, ‘Bulmer’s Norman’, ‘Sturmer’ and ‘Pink Lady’ varieties for all both pre-fermentation treatments. Letters indicate significant differences between mean values at the p ≤ 0.05 level.
TSSYANpHTA
Red DeliciousNo Maceration11.85 ± 0.2870.78 ± 2.674.06 ± 0.052.04 ± 0.10
Maceration11.55 ± 0.2269.65 ± 4.904.05 ± 0.051.94 ± 0.10
Free Run11.67 ± 0.3470.69 ± 4.384.07 ± 0.052.02 ± 0.10
Pressure11.73 ± 0.2269.74 ± 3.484.04 ± 0.041.96 ± 0.11
Bulmer’s NormanNo Maceration13.10 ± 0.4338.70 ± 14.704.18 ± 0.012.10 ± 0.13
Maceration13.17 ± 0.5924.82 ± 10.204.18 ± 0.062.08 ± 0.08
Free Run12.92 ± 0.5733.14 ± 20.074.18 ± 0.042.06 ± 0.11
Pressure13.35 ± 0.3831.76 ± 6.824.18 ± 0.052.12 ± 0.10
SturmerNo Maceration14.23 ± 0.1837.95 ± 7.833.34 ± 0.098.64 ± 0.43
Maceration13.72 ± 0.5540.55 ± 5.163.33 ± 0.028.30 ± 0.39
Free Run13.83 ± 0.6140.35 ± 6.903.32 ± 0.058.32 ± 0.51
Pressure14.12 ± 0.2238.15 ± 6.423.35 ± 0.078.61 ± 0.30
Pink LadyNo Maceration11.68 ± 0.1932.95 ± 3.693.52 ± 0.045.37 ± 0.10 a
Maceration11.65 ± 0.3529.05 ± 3.683.58 ± 0.035.24 ± 0.06 b
Free Run11.52 ± 0.3131.20 ± 4.183.56 ± 0.055.25 ± 0.07 a
Pressure11.82 ± 0.1730.81± 3.963.53 ± 0.035.36 ± 0.10 b

