1. Introduction
Language is the metric of excellence in Sensory Science, a field that has become a key player in the Food and Beverage industry. When it comes to wines, the term “sensory” is strongly, and occasionally exclusively, associated with “wine tasting”; however, Sensory Science covers a large domain of methodologies capturing sensory descriptors, from the use of classical Descriptive Analysis and novel methods as tools to evaluate conceptual and perceptual properties [
1,
2,
3,
4,
5] to the application of data mining and Natural Language Processing (NLP) strategies on text data [
6,
7]. The former can be defined as a structured data approach, whereas the latter represents an unstructured approach.
In structured approaches, the sensory lexicon (i.e., sensory attributes, affective, and hedonic terms) is concise and limited, and, on most occasions, it is tailored to each set of products; the length of the attribute list and the order of presentation have been shown to affect the sensory assessment [
8,
9]. On the other hand, unstructured language, represented by any source of text data, has the potential to bring together the lexicon development and sensory space characterisation through different data mining strategies which can convert raw text into structured metadata [
10].
Currently, the number of text and data mining and NLP studies is not extensive in Oenology; however, existing work demonstrates the extent of applications this type of data can be used for. Wine reviews have been used as a source of data to understand the sensory space of specific products [
11,
12,
13,
14,
15]. Valente et al. (2018) [
16] used Platters’ data (the South African Annual Wine Review,
www.wineonaplatter.com) to model the sensory space of South African wines and predict different wine styles. Results evidenced that aromatic complexity is an important driver to differentiate among Chenin Blanc wine styles. Similarly, a recent publication [
17] explored the use of Latent Semantic Analysis (LSA) as a tool to investigate sensory styles of Swedish Solaris wines compared to two other international white cultivars, showing that Swedish Solaris wines shared features with both Albariño and Chenin Blanc wines [
18]. In a young wine industry where new knowledge generated through experimentation may take several years, existing text data can provide faster “decision-making” feedback to the local industry.
The use of textual data can also be applied to align perceptual and conceptual properties. Wine minerality is a well-documented example [
19,
20]. Deneulin et al. (2016) [
20] investigated the existing associations French consumers have towards wine minerality through online surveys; the results showed the presence of different segments with consumers associating wine minerality to specific sensory parameters, mineral ions, and terroir characteristics, but also consumers who did not know what wine minerality was at all. More recently, Biss and Ellis (2024) [
19] explored the lexicon associated with wine minerality in Chablis Premier Cru wines using tasting notes from a consumer online database (CellarTracker,
www.cellartracker.com), showing a strong association with “stony” perceptions but also with “saline” and “seashell” aromas. Similarly, Hedger et al. (2024) [
21] used text data from wine critics to investigate whether the conceptual distinction between New World and Old World wines is reflected in sensory descriptions and whether these differences have changed over time.
Text mining has been further applied to market and consumer insights. Most of these studies have focused on consumers’ and wine experts’ reviews [
22,
23,
24]. The study by Lefever et al. (2018) [
24] explored the terminology, review length, and average word length used in wine reviews and their relationship to price and review score, demonstrating that wine experts share a common lexicon, sufficiently consistent to predict the type of wine (i.e., colour, grape variety, and origin) from its review. Wine expertise has been shown to have a stronger link to conceptual aspects and how the mental representation of a wine is built than to perceptual expertise and how the wine is perceived [
25,
26]. Experts’ opinions and awards [
27] remain an effective marketing strategy, driving consumers’ purchase decisions [
28]. However, to investigate the lexicon of a specific product, it is highly recommended to bring results into a domain-specific context with a cautious and conscious interpretation of outcomes.
Beyond market applications, text and data mining strategies applied to free comments have been shown to outperform structured approaches such as Check-All-That-Apply (CATA) in capturing consumers’ perceptions [
29]. Despite this growing amount of evidence, these approaches are not established well enough in Oenology to reach widespread acceptance. Contributing factors include the diversity of analytical methods applied across studies, often in isolation, the absence of direct comparisons on common datasets, the interpretation challenges posed by novel visualisation tools, and the programming knowledge required for implementation if combined with automated strategies for analysing large data sets. However, it is important to keep in mind that when text mining is applied to data from traditional sensory methodologies, sample size is a limiting factor.
To date, studies using text and data mining in Oenology have applied individual analytical approaches to a given dataset (e.g., Valente et al., 2018 text mining and machine learning [
16]; Biss & Ellis, 2024 frequency analysis [
19]; Hedger et al., 2024 corpus analysis [
21], Deneulin et al., 2016 survey text analysis [
20]), a pattern also shown in reviews of NLP applications in sensory science [
10,
30]. While comparisons between data collection approaches have been reported (e.g., free comments vs. CATA [
29]), and recent work has compared exploratory visualisation and analytical tools for characterising the sensory space of beer [
31], no study has directly compared such approaches within an Oenological context. The current study evaluated the complementarity of established (Multiple Correspondence Analysis/MCA, Agglomerative Hierarchical Clustering/AHC), recently reported (Latent Semantic Analysis/LSA [
17], network analysis, WordVenn diagrams [
31]), and new in this context (chord diagrams) approaches for extracting sensory insights from wine text data. Using aroma descriptions of 81 Champagne wines as a case study, structured and unstructured data strategies were compared to assess their relative strengths in characterising the sensory space and differentiating between vintage and non-vintage product categories.
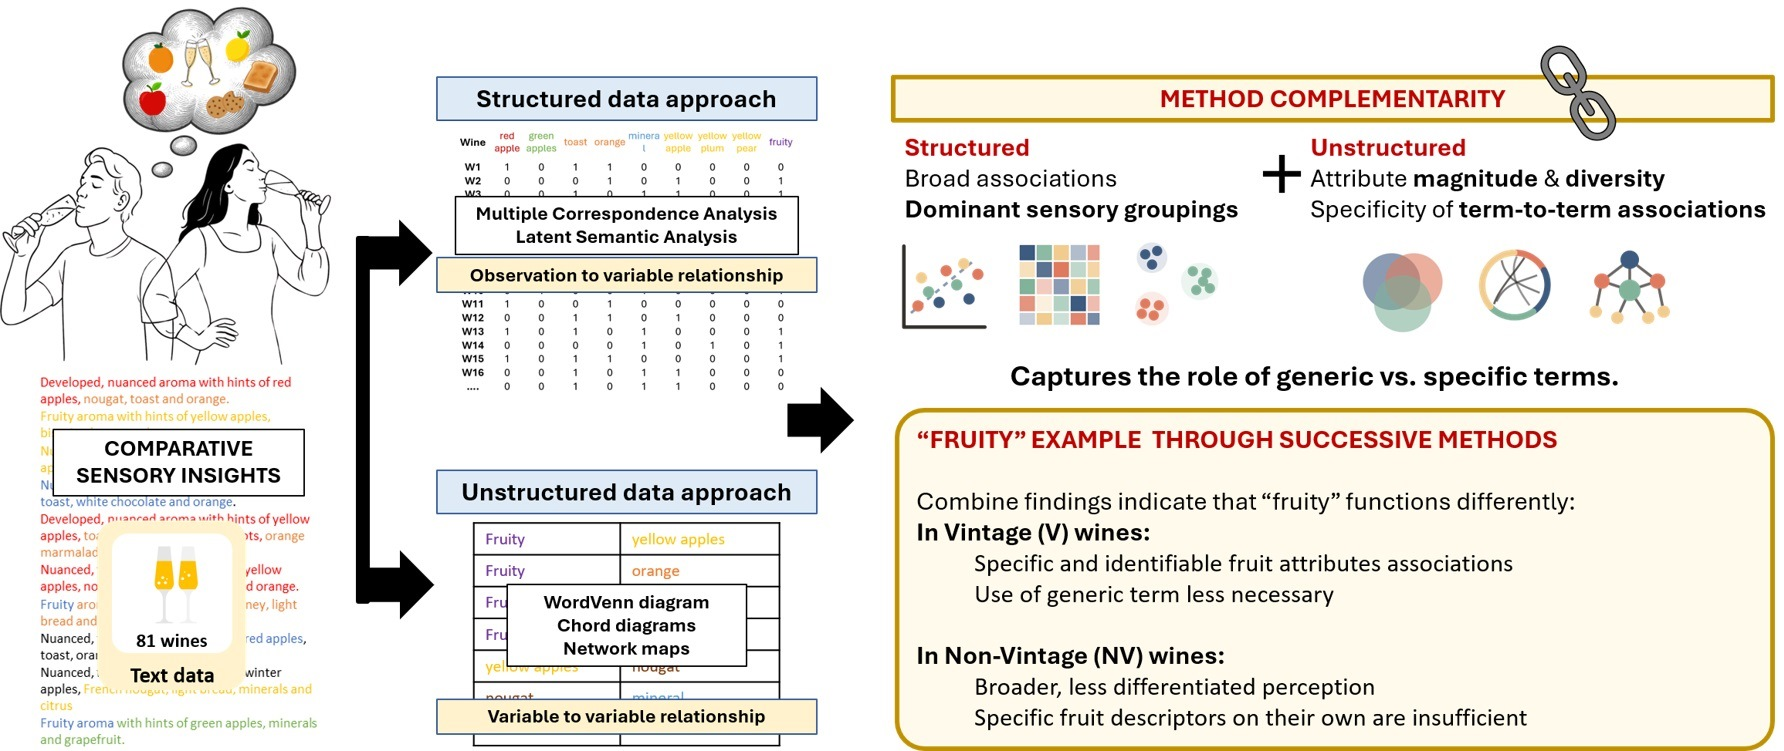
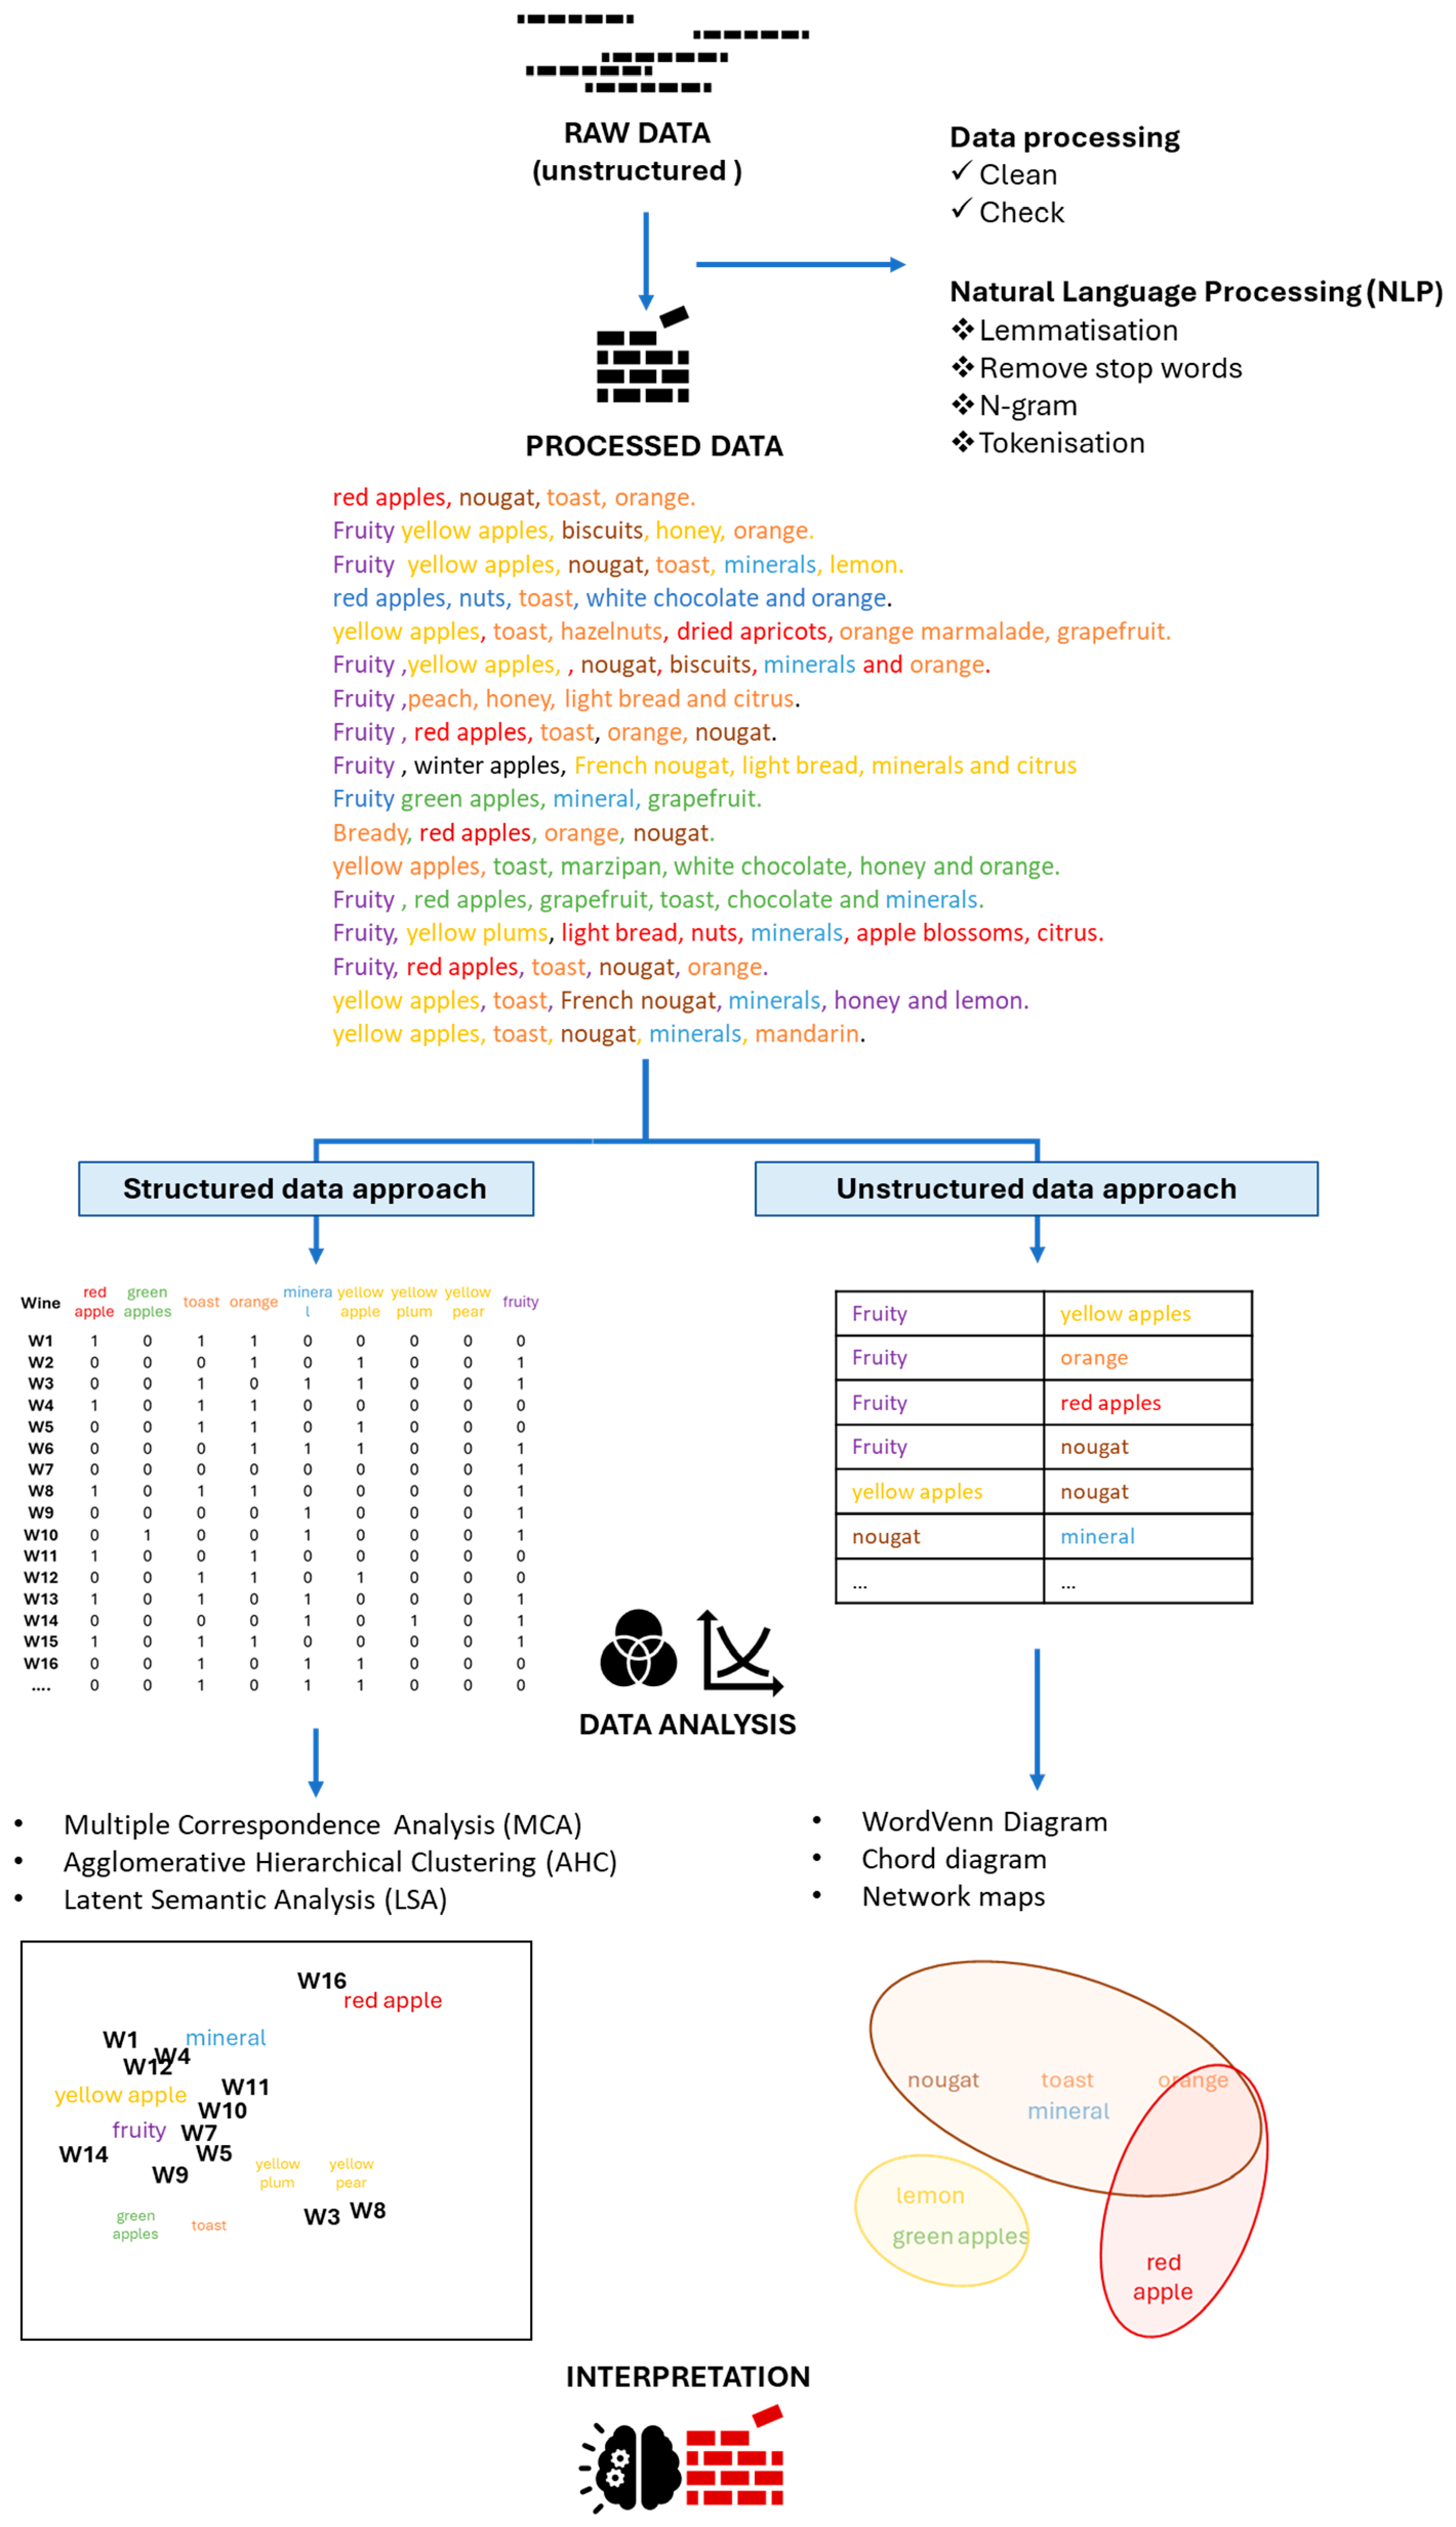
The general workflow for extracting sensory insights from text data involves converting raw unstructured sources such as expert reviews, consumer comments, or retailer descriptions through tokenisation and normalisation steps into structured datasets amenable to analysis (
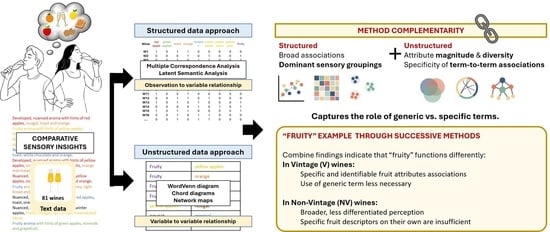
Figure 1). This workflow illustrates the two complementary approaches compared in this study: a structured strategy operating on presence/absence matrices derived from individual sensory attributes, and an unstructured strategy applied directly to text descriptions. Both strategies were evaluated for their capacity to characterise the aroma space of Champagne wines. The objective was twofold: to provide practical guidance on method selection and to demonstrate how combining complementary tools can reveal layers of sensory information that no single approach captures alone.
2. Materials and Methods
2.1. Dataset
The dataset consists of textual sensory descriptions of 81 Champagne wines extracted from Systembolaget’s website (
www.systembolaget.se [
32]), the Swedish government-owned alcohol retail monopoly. As a nonprofit provider, Systembolaget’s product descriptions originate from blind sensory evaluation by trained in-house experts, independently of producer marketing. This data source was selected because it provides standardised organoleptic descriptions generated under controlled assessment conditions, making it suitable for comparing analytical approaches on a consistent and systematically generated body of text. The 81 wines fell into one of two categories: vintage (V,
n = 21) or non-vintage (NV,
n = 60). This work focuses solely on aroma descriptions.
The workflow of a standard text and data mining process can be based on either structured or unstructured raw data, even for small datasets (
Figure 1). Unstructured data can be extracted from multiple sources, from wine labels to consumers’ and experts’ reviews, comment boxes, and open-ended questions in sensory tests or surveys.
2.2. Data Capture and Processing
Data was extracted in November 2021. The following filters were sequentially applied to search for all wines of interest to this study: wine → wine type (sparkling wine) → country (France) → region (Champagne). Aroma descriptions for each product were manually captured as an enumeration of sensory attributes and automatically translated into English with the use of Google Translate. The standardised nature of Systembolaget’s expert-generated descriptors, consisting of technical sensory terms following systematic terminology conventions rather than continuous prose, facilitated this translation, as such vocabulary tends to have more direct equivalents across languages compared to subjective consumer descriptions [
33]. The complete dataset comprised 53 unique sensory attributes across the 81 wines.
Data processing followed a Natural Language Processing (NLP) pipeline (
Figure 1). The first step is pre-cleaning and data-check [
10,
30]. Data cleaning and structuring followed an iterative process combining automated preprocessing with manual intervention. Automated preprocessing involved the sequential exclusion of symbols, hedonic terms, and intensity-related descriptors. Text descriptions were then tokenised into individual word units following the N-grams language model approach [
34], where unigrams represent single words (
n = 1), and bigrams and trigrams represent pairs and triplets of consecutive words, respectively (
n = 2 and
n = 3). Higher sequences can also be considered. Text normalisation, including spell-checking, stemming (depluralisation and suffix removal), and lemmatisation, was performed to convert text into countable semantic units [
30]. Manual intervention, guided by domain expertise, ensured that terms retained their intended sensory meaning and that semantically similar composite terms were treated consistently throughout the dataset. These processed units were then organised into two parallel formats to enable the comparison at the core of this study: (i) a presence/absence binary matrix for the structured analytical approach, and (ii) a term-frequency vector representation for the unstructured approach. The binary format was appropriate given that each attribute appeared at most once per wine description. Data wrangling was performed in the Google Collab platform using Python (version 3.9) and pandas library (version 2.2.2).
2.3. Structured Approach
For the structured approach, tokenised and countable word units (i.e., sensory descriptions) were tabulated into single sensory attributes, creating a table following the presence/absence criterion (1/0). This dataset was explored with the use of conventional and alternative data strategies suitable for working on sparse data as proposed by Garrido-Bañuelos et al. (2024) [
17].
Multiple Correspondence Analysis (MCA) was performed to explore the relationship between observations (Champagne wines) and qualitative variables (sensory attributes). Agglomerative Hierarchical Clustering (AHC), based on Euclidean distances and following Ward’s criterion, was subsequently performed on MCA coordinates. To ensure adequate representation of sample variance, AHC incorporated as many MCA dimensions as needed to achieve a cumulative explained variance (%EV) of 70% or more.
Latent Semantic Analysis (LSA) was used as an alternative that prioritises term-to-term (attribute-to-attribute) associations over document-to-term (wine-to-attribute) relationships [
17]. Associations followed a hard clustering approach, and the optimal number of topics was selected based on a cumulative %EV threshold of approximately 70%, combined with assessment of topic interpretability (i.e., semantic coherence of the grouped attributes). MCA, AHC, and LSA were performed using XLSTAT 2021.4.1 (Addinsoft, Paris, France 2025).
2.4. Unstructured Approach
For the unstructured approach, Natural Language Processing (NLP) methodology followed a Bag-of-Words model approach where text descriptions were converted into numerical vectors through tokenization, counting, and normalisation [
35], conducted using the scikit-learn library (version 1.5.0). The following terms were considered “stop words” and therefore excluded from the dataset: “aroma”, “aromatic”, “character”, “clear”, “complex”, “developed”, “element”, “fragrant”, “hint”, “note”, “noticeably”, “nuanced”, “of”, “scent”, “slightly”, “touch”, “youthful”, “very”. These terms were removed because they functioned as qualifiers, intensifiers, or generic descriptors rather than discrete sensory attributes, as determined through manual inspection.
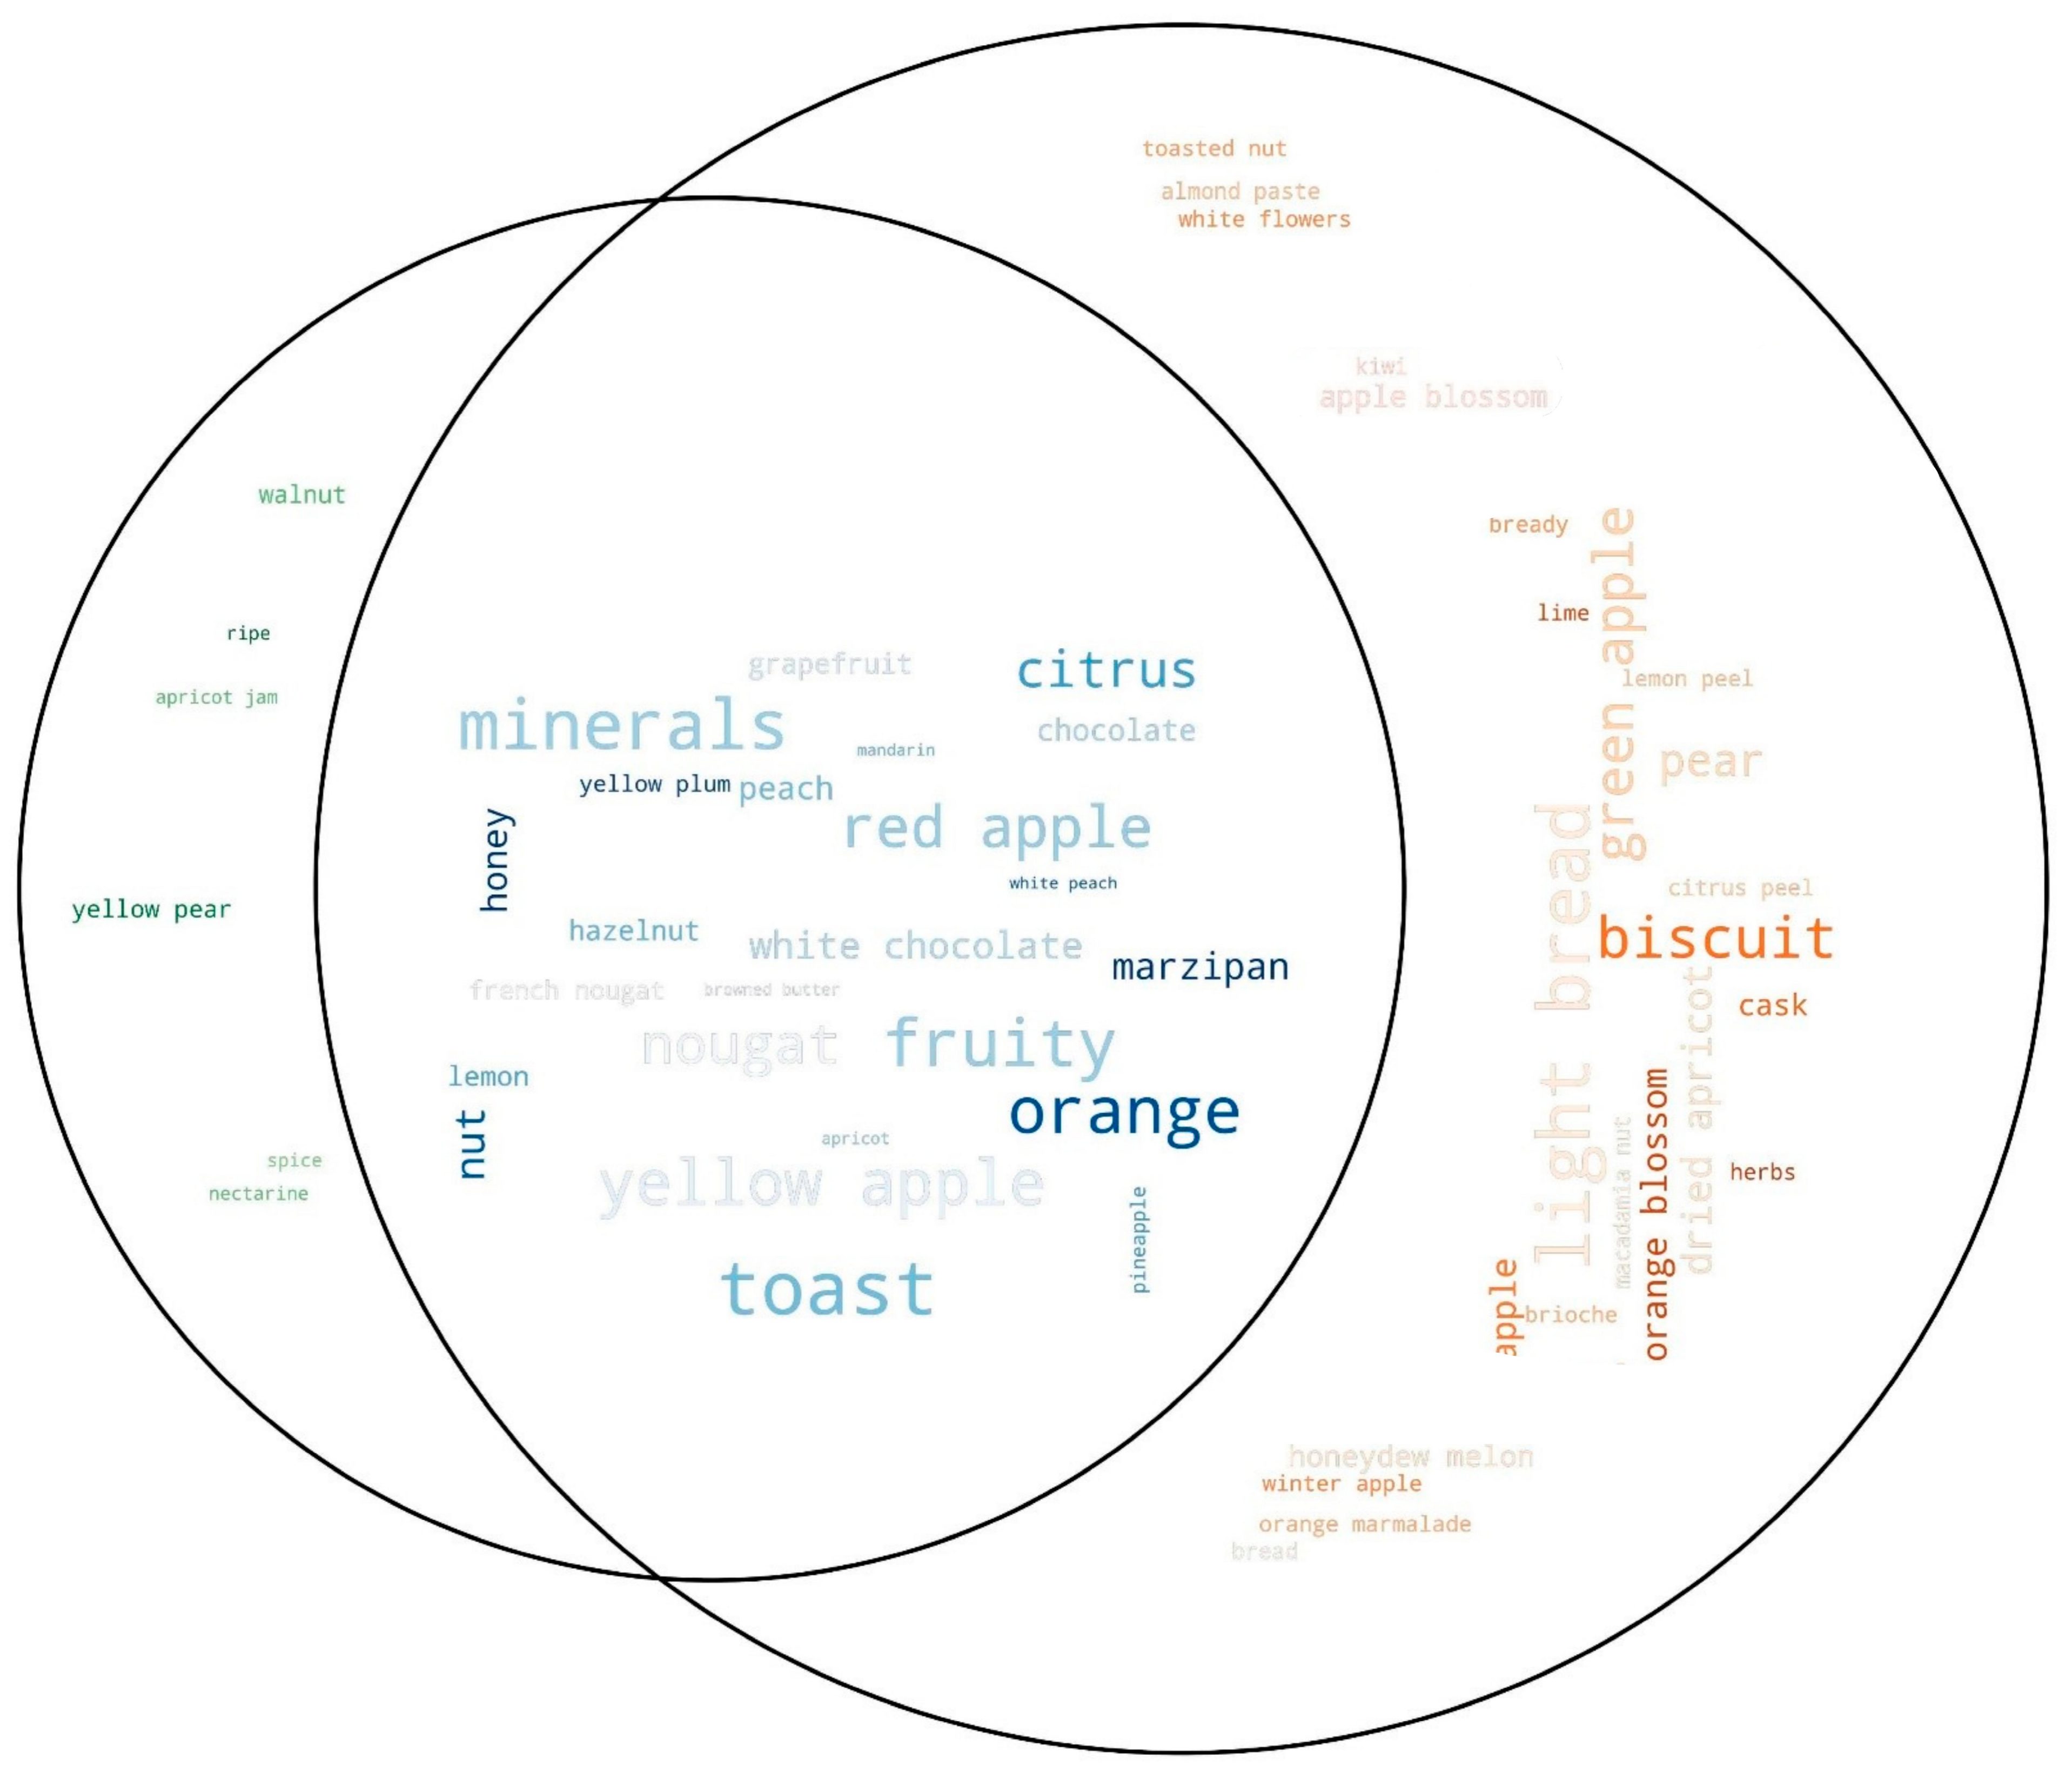
WordVenn diagrams were generated as a result of a two-step analysis, which integrated Venn diagrams (matplotlib-venn version 1.1.1) and a wordcloud (wordcloud version 1.9.3) functionality. Venn diagrams were first constructed on the “vintage” (V) and “non-vintage” (NV) subsets of data to explore and identify the overlapping and non-overlapping terms. Wordclouds were then integrated using the Frequency of Citation (FoC) of each attribute to represent the relative importance of terms in each subset.
From here, V and NV Champagne wines are analysed as independent subsets of data. Comparison is made through patterns identified in each of them, with no cross-subset inferential comparison. Therefore, normalisation is not applicable in this design.
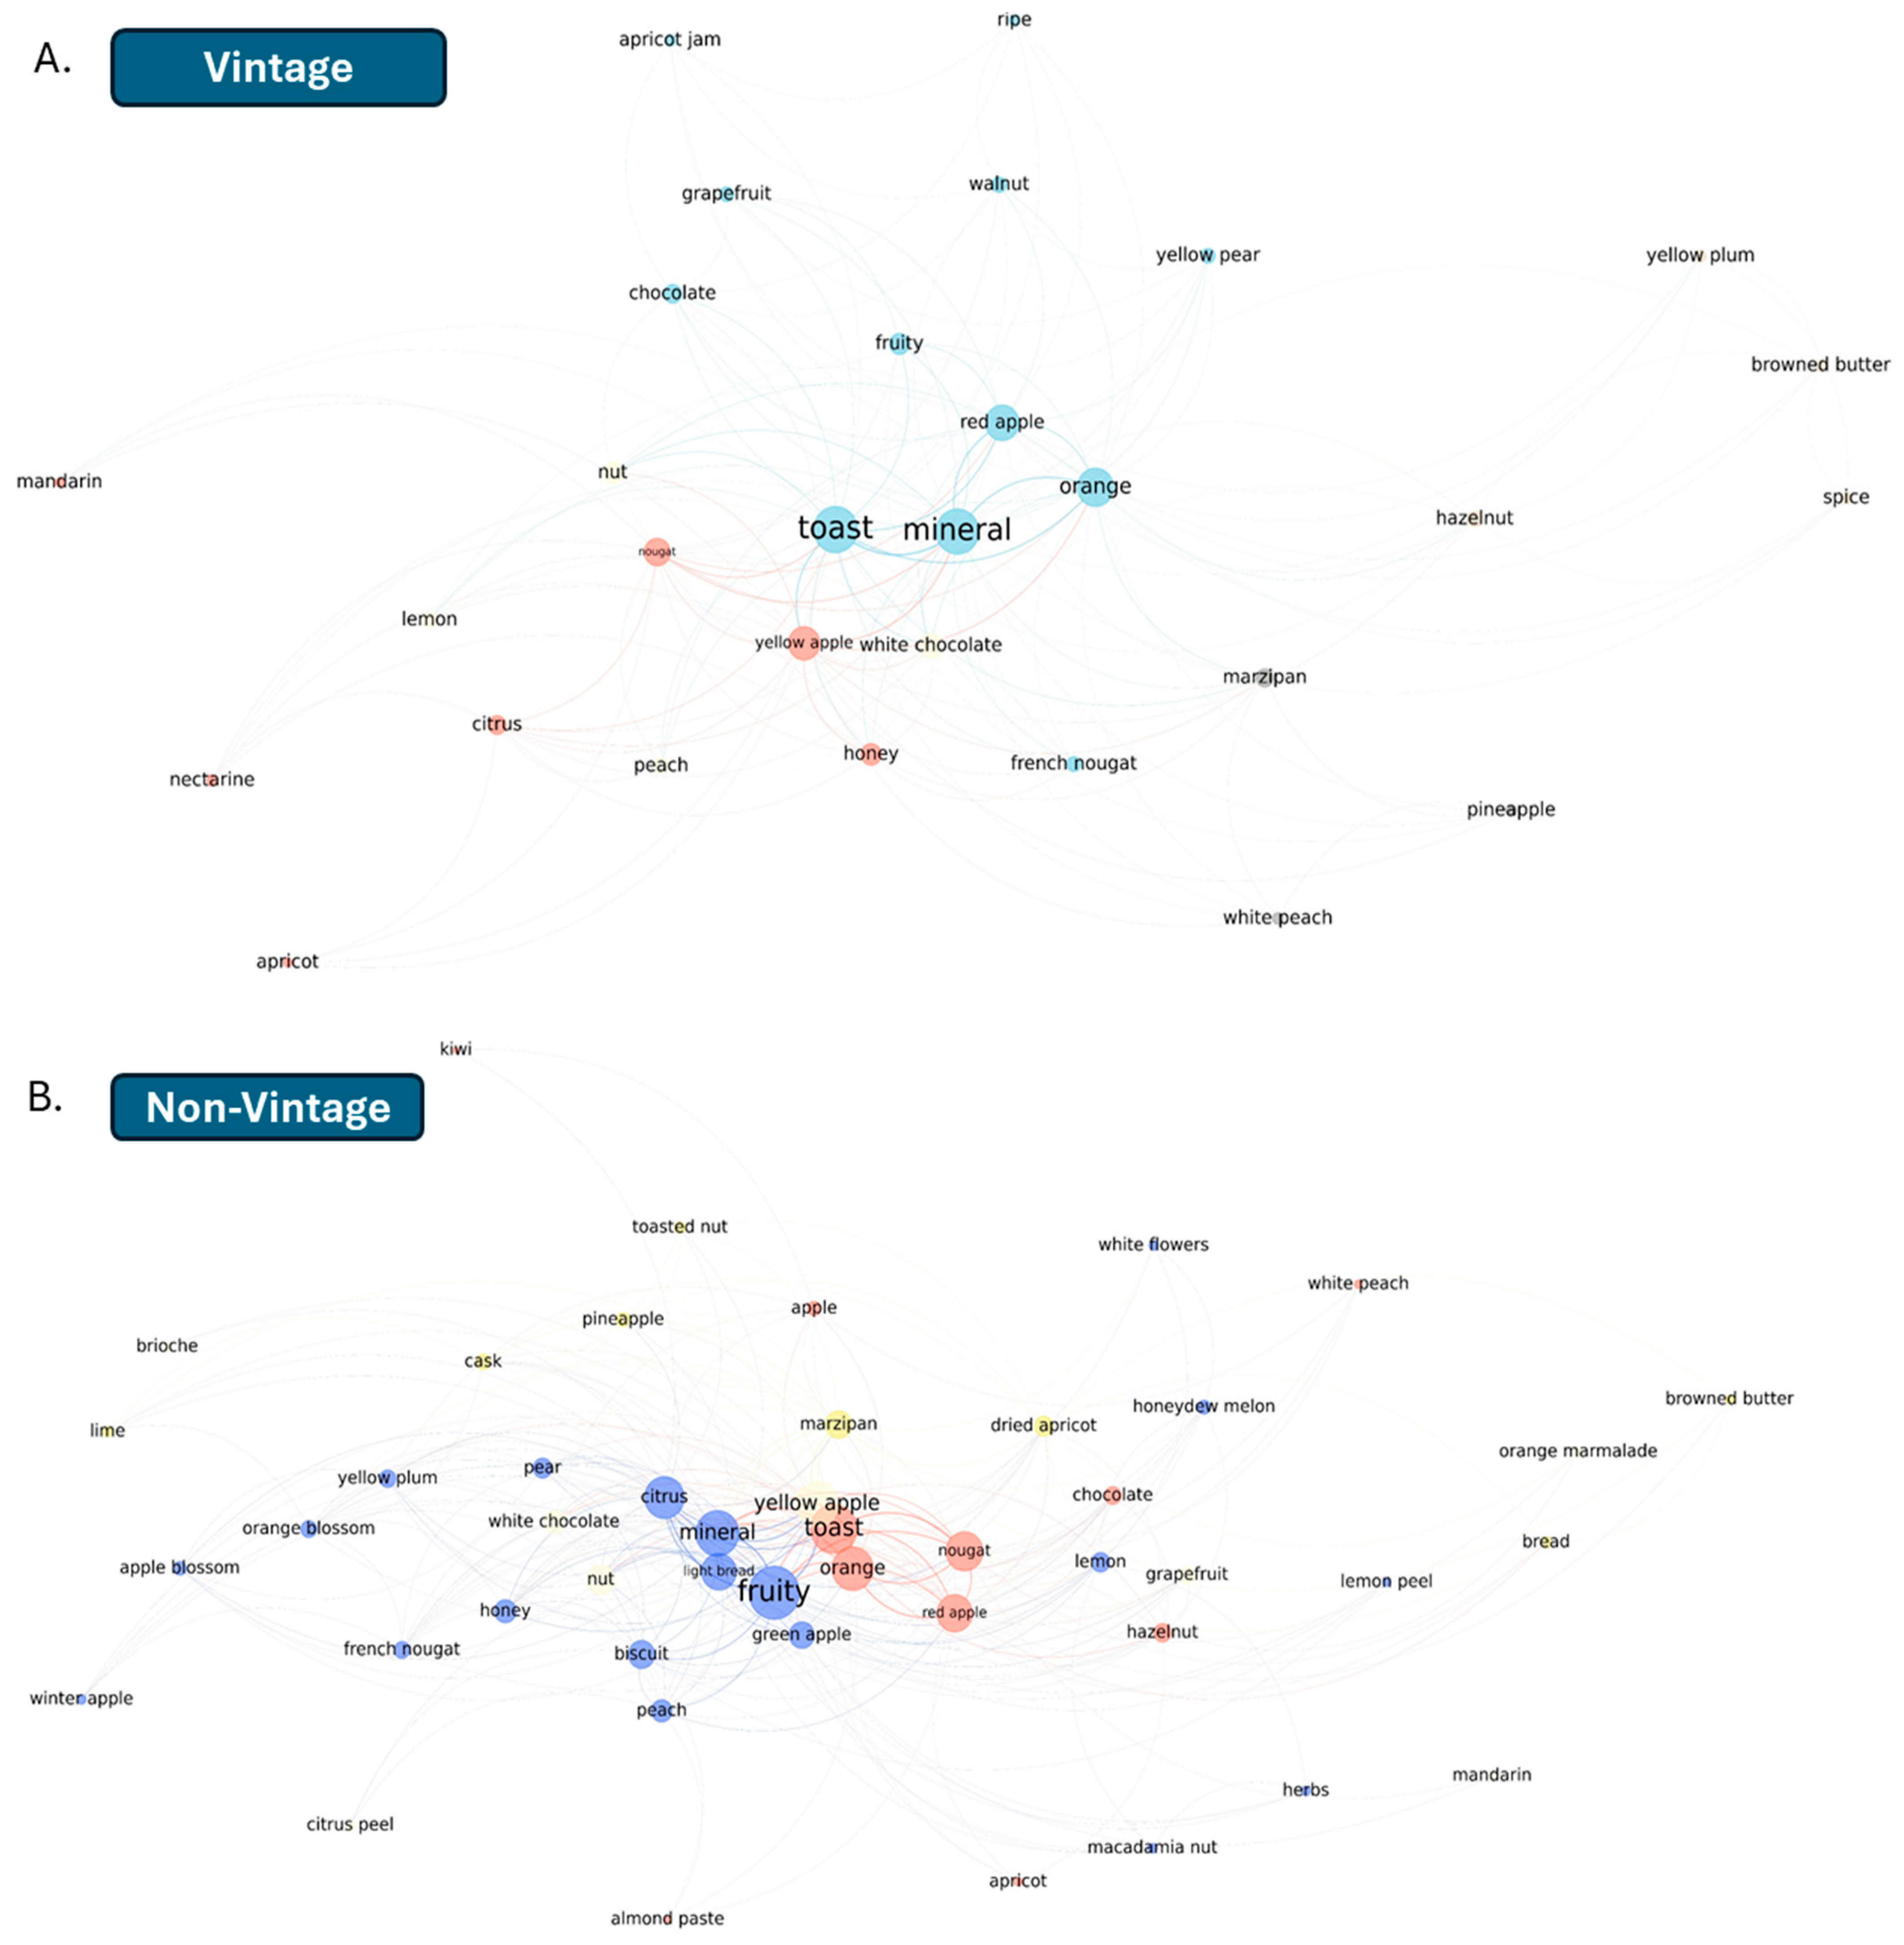
Network maps were then constructed from a co-occurrence matrix where each cell represented the number of wines in which a pair of attributes appeared together. In the resulting visualisation, nodes represent unique sensory attributes (with node size proportional to FoC) linked by one or more edges (with edge width proportional to co-occurrence frequency). The width of the edges indicates the number of samples in which a pair of terms appeared together. Node clusters were generated based on the Louvain method for community detection [
36]. The networks were visualised using the networkx library (version 3.3).
Chord diagrams were generated using the same structured dataframe (co-occurrence matrix) from the network analysis using Bokeh (version 3.7.0) and d3blocks (version 1.4.10) libraries. In the resulting visualisation, each attribute occupies a segment on the circle proportional to its FoC, and chords connecting two attributes have a thickness proportional to their co-occurrence frequency. While network maps emphasise spatial clustering and positional relationships between attributes across the full sensory space, chord diagrams highlight the relative strength of individual term-to-term associations within and between product categories. The tool supports interactive filtering (i.e., isolating individual attributes to explore their connections), but cannot be fully captured in static manuscript figures; representative filtered views are presented in the Results.
3. Results
3.1. Structured Data Approach
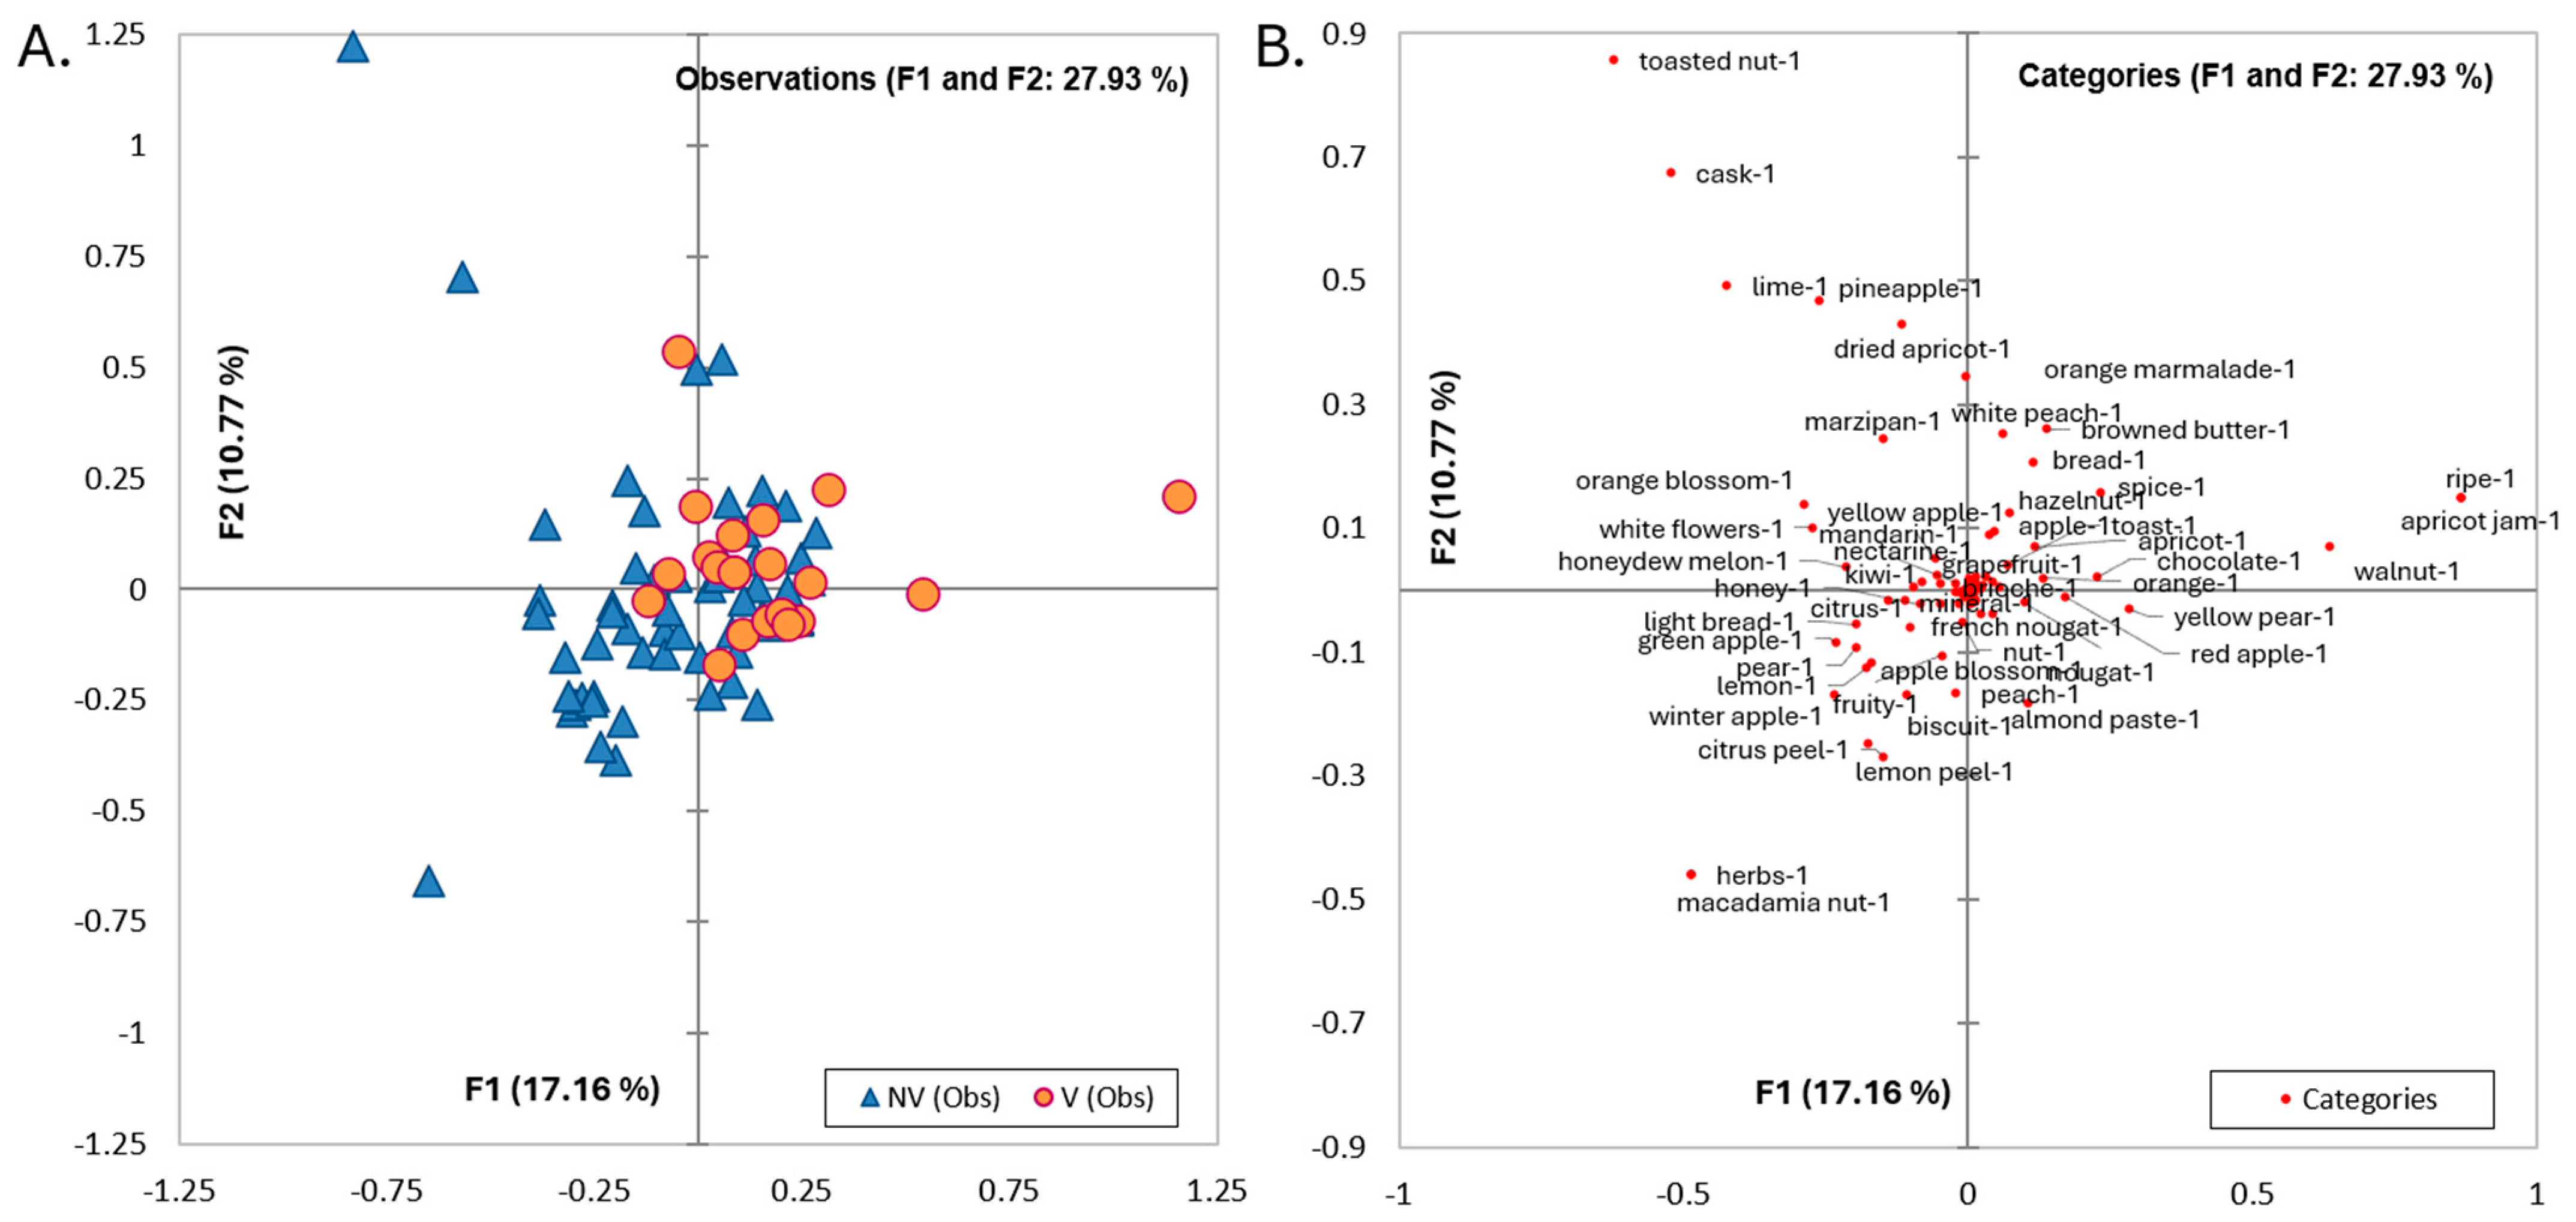
The first two components had a cumulative explained variance (EV%) of 27.9% (
Figure 2A), common in sparse binary datasets (53 attributes across 81 wines). Despite most V Champagne wines being on the positive side of F1, no clear trend between V and NV Champagne wines could be identified. To help visualisation, absent attributes (-0) were excluded from the loading plot (
Figure 2B). The overlap between the two categories was also indicated by the shared sensory features (
Figure 2B).
Within this overlap, NV Champagne wines displayed greater variability than the larger V wines. NV wines on the negative side of the F1 axis were associated with attributes less frequently found in V wines (e.g., “herbs”, “fruity”, “citrus peel”,
Figure 2B). Conversely, the terms with the highest contribution to F1 on the positive side (“ripe”, “walnut”, and “apricot jam”) were associated with V wines. On F2, “cask” and “toasted nuts” contributed most to sample separation. To reach a good understanding of the potential differences between samples, more MCA components should be assessed; however, beyond F5, each component contributed less than 5% explained variance, making this approach to interpreting the results inefficient.
LSA, which prioritises term-to-term (attribute-to-attribute) associations over document-to-term/topic (wine-to-attribute) associations, identified seven topics achieving a cumulative explained variance of 69.5% (
Table 1). Topic 1 (33.7% EV) grouped thirteen attributes, combining ageing-associated notes (“toast”, “honey”) with fruit aromas (“yellow apple”, “yellow pear”) and included “mineral” and citrus terms (“grapefruit”, “orange”). This topic described 59 of the 81 wines, and notably, all V wines were assigned to it, indicating that vintage Champagnes share a core aromatic profile. The presence of 38 NV wines within the same topic suggests substantial overlap between the two categories at this level of analysis. Topic 2 (9.9% EV) represented ten wines described by fresher attributes: “citrus”, “green apple”, “pear”, “honeydew melon”, and floral notes (“orange blossom”, “apple blossom”). The remaining topics (3–7) each contributed less than 10% individual variance and captured more specific or residual attribute combinations (
Table 1).
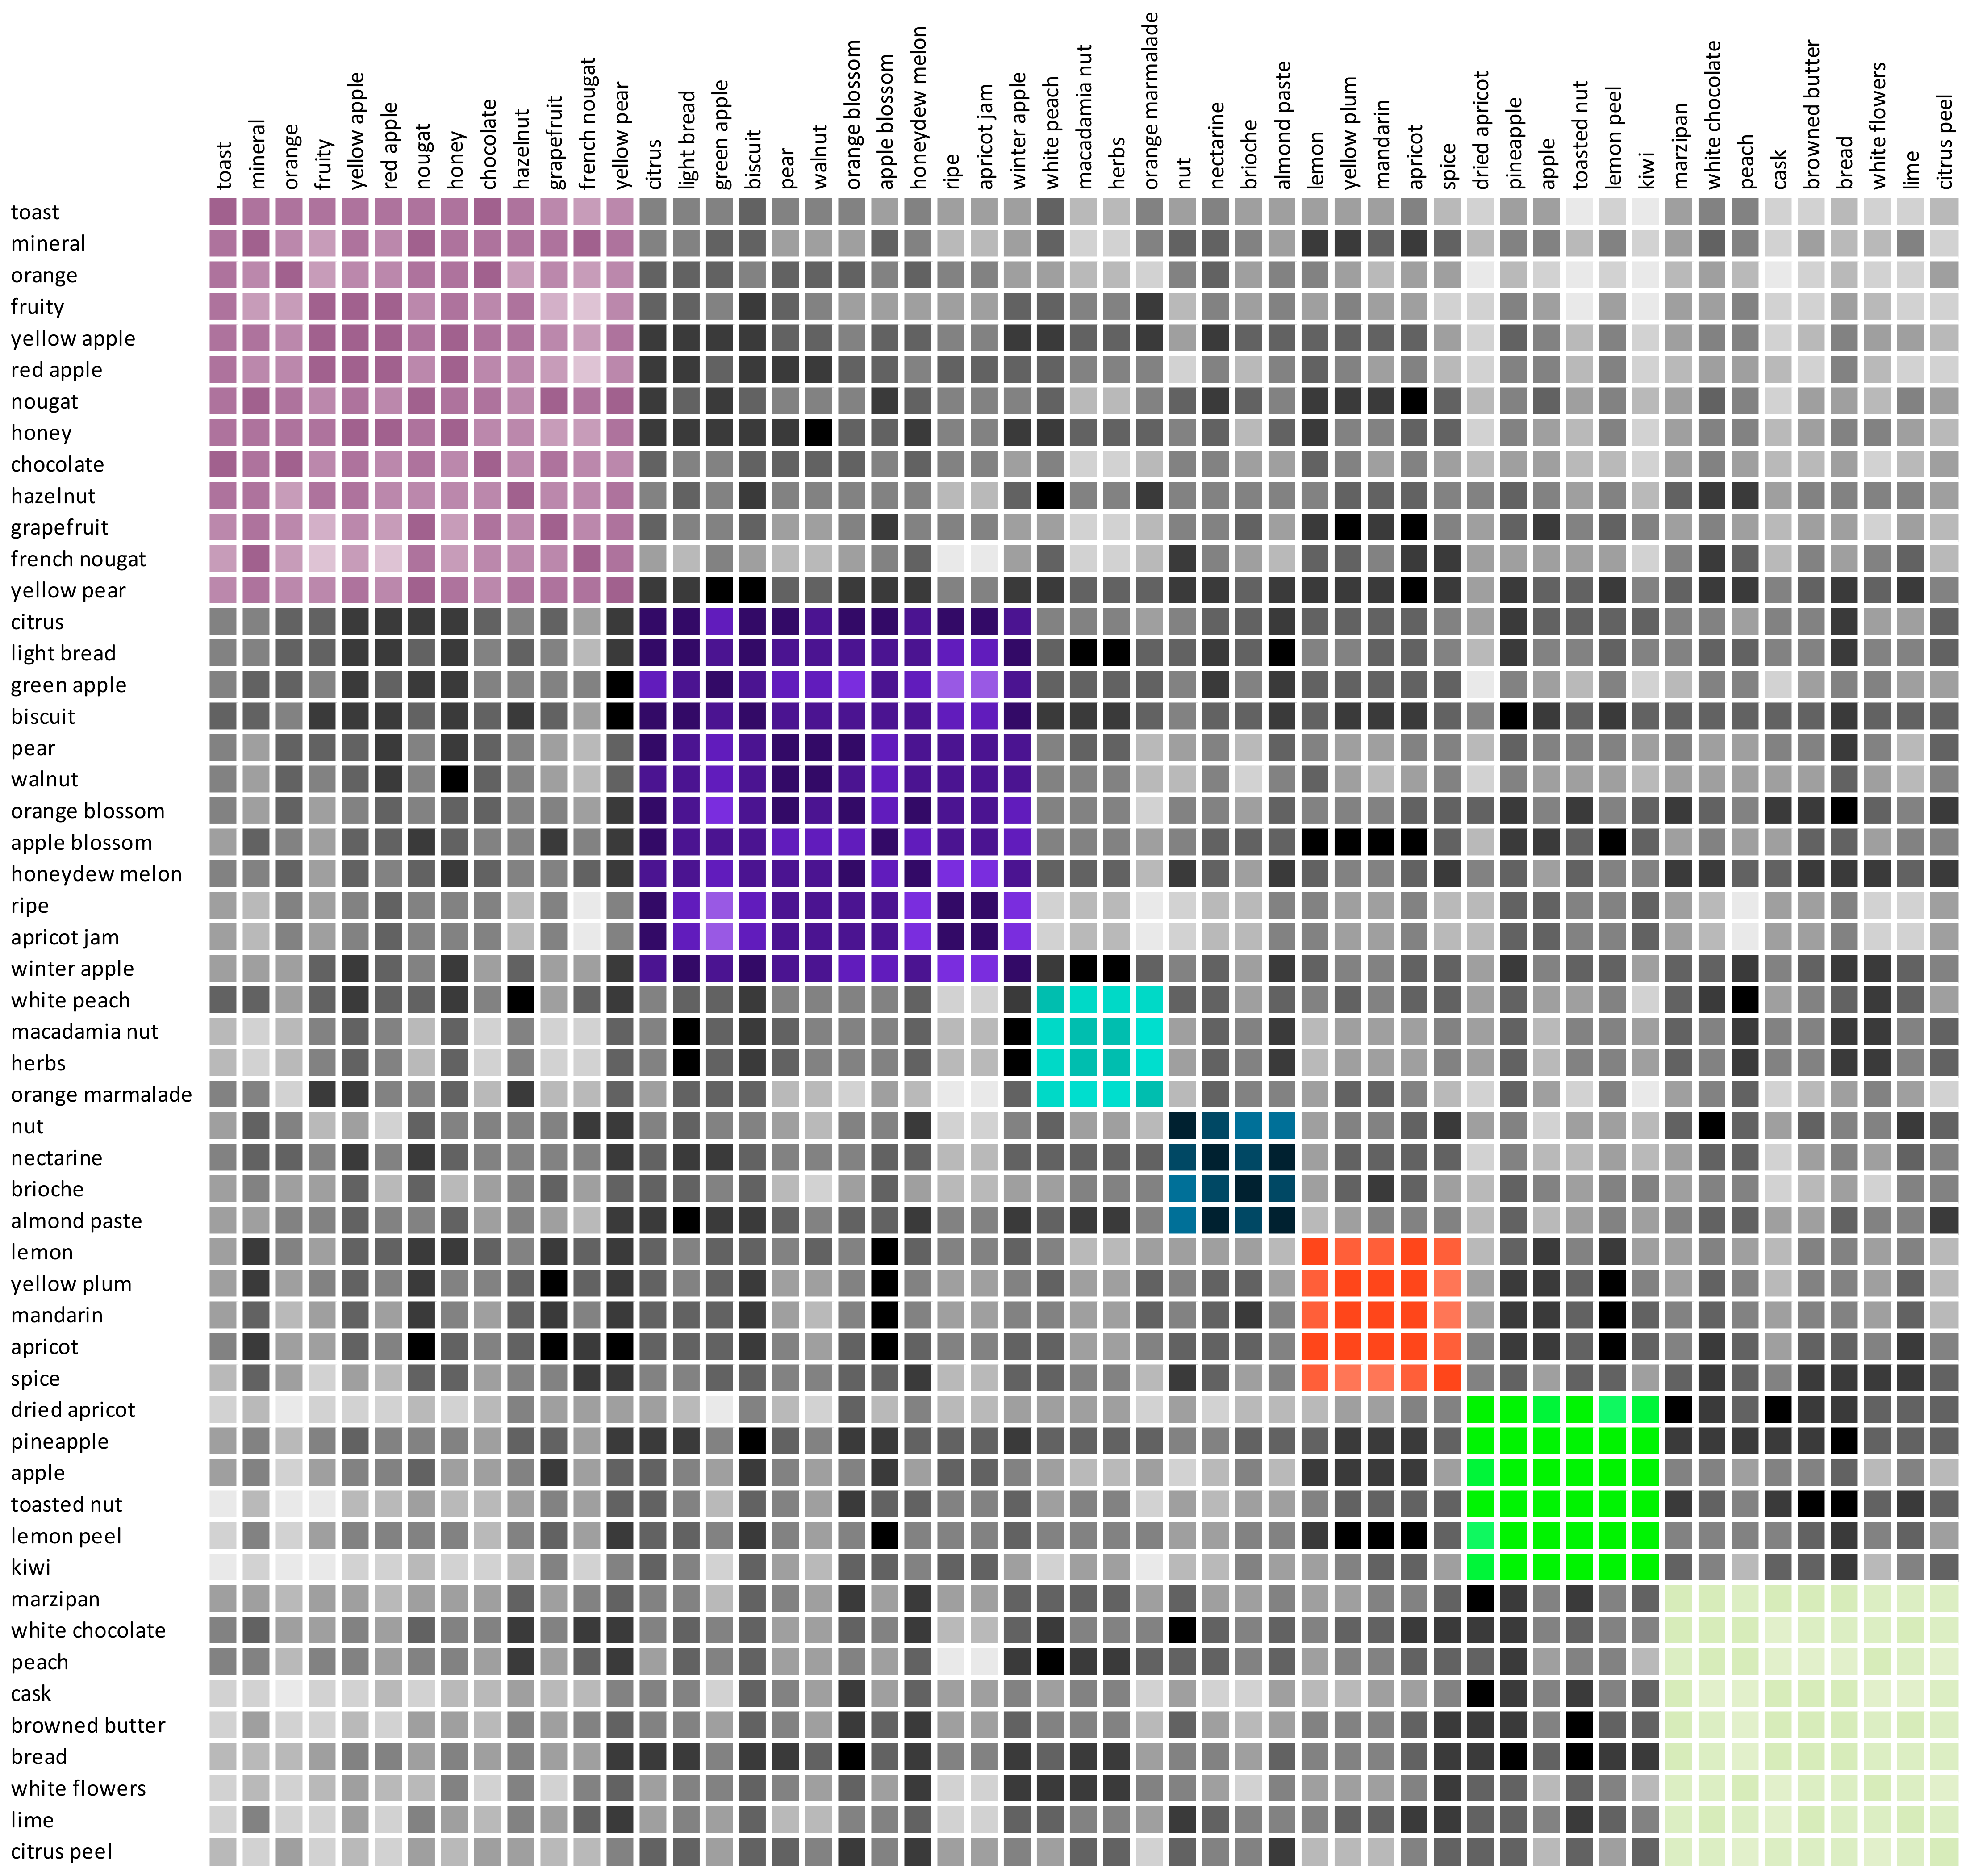
A comparison between the results of the two methodologies is shown in
Figure 3 and
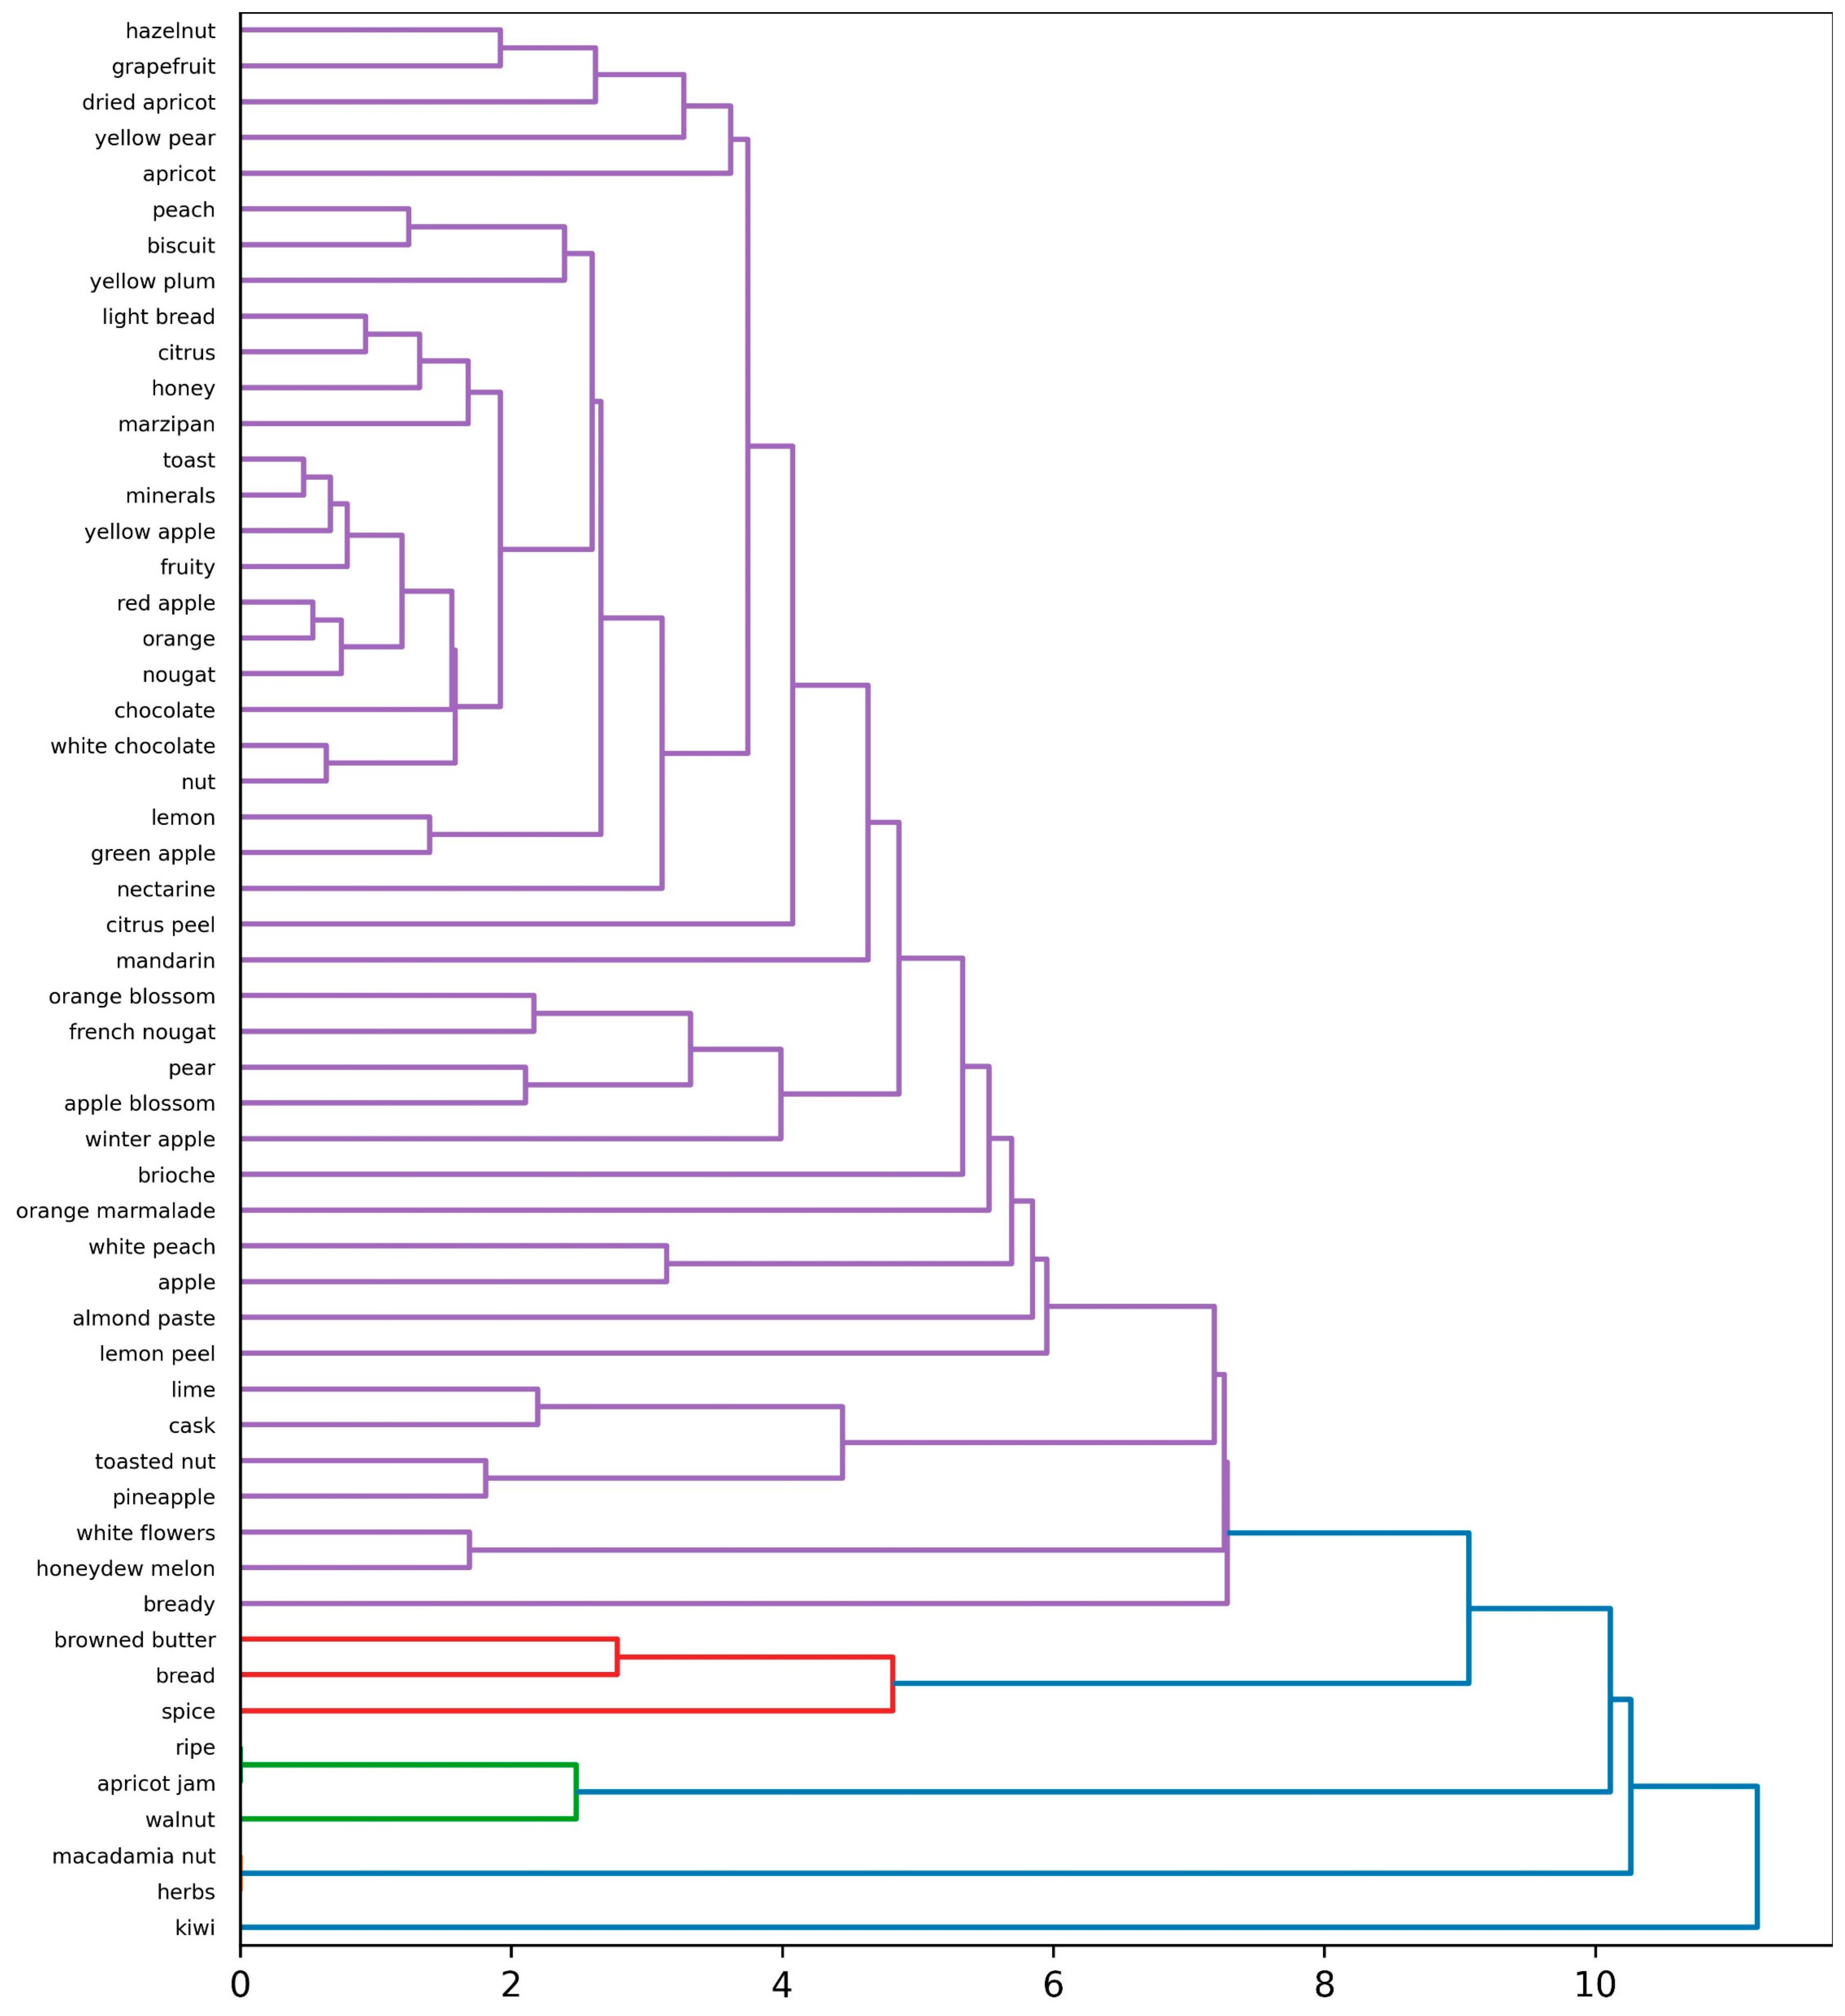
Figure 4. The AHC dendrogram performed on MCA loadings plot coordinates from
Figure 2 showed the presence of four clusters (
Figure 3). Cluster 1 contained the majority of attributes (
n = 45), which LSA distributed across all seven topics (
Figure 4). Cluster 3 (“ripe”, “apricot jam”, “walnut”) corresponded directly to LSA Topic 2 attributes, while clusters 2 and 4 were split across multiple LSA topics. These differences reflect the different logic of each method: AHC on MCA coordinates groups attributes based on their shared contribution to sample variance, whereas LSA groups attributes by their co-occurrence patterns across documents regardless of contribution to overall variance. For example, having no documents (i.e., wines) associated with a topic indicates that certain sensory attributes do not contribute enough to define a semantic sensory space. In practice, LSA resolved the sensory space into more interpretable groupings from a smaller number of dimensions, while MCA provided a spatial representation of the full dataset structure at the cost of requiring more components to capture equivalent variance.
However, neither MCA nor LSA quantified the degree of co-occurrence between specific pairs of attributes, nor did they resolve whether shared terms carry equal weight across V and NV categories. The unstructured approach addresses these aspects through approaches working directly on term frequency and co-occurrence data.
3.2. Unstructured Data Approach
Unstructured text descriptions were explored using tailored visualisation and analytical tools to boost any potential pattern identification that could lead to further sensory insights.
WordVenn diagrams. A lower number of unique (non-overlapping) attributes was associated with V (
n = 6) than with NV Champagne wines (
n = 24), while 24 terms were shared between the two categories (
Figure 5). The attributes exclusively associated with V wines (“walnut”, “nectarine”, “ripe”, “apricot jam”, “yellow pear”, and “spice”) showed a similar FoC among V wines. In contrast, the 24 attributes exclusive to NV wines had more varied FoC; “light bread”, “green apple”, and “biscuit” were cited more frequently than terms such as “lime” and “kiwi” (
Figure 5). Among the shared terms, “mineral”, “toast”, “orange”, and “fruity” had the highest FoC, suggesting they are core descriptors for Champagne wines regardless of category. However, WordVenn diagrams show term presence and frequency within each subset but cannot resolve whether shared terms carry equal weight in both categories. This limitation is addressed below through chord diagrams and network maps, which incorporate co-occurrence information.
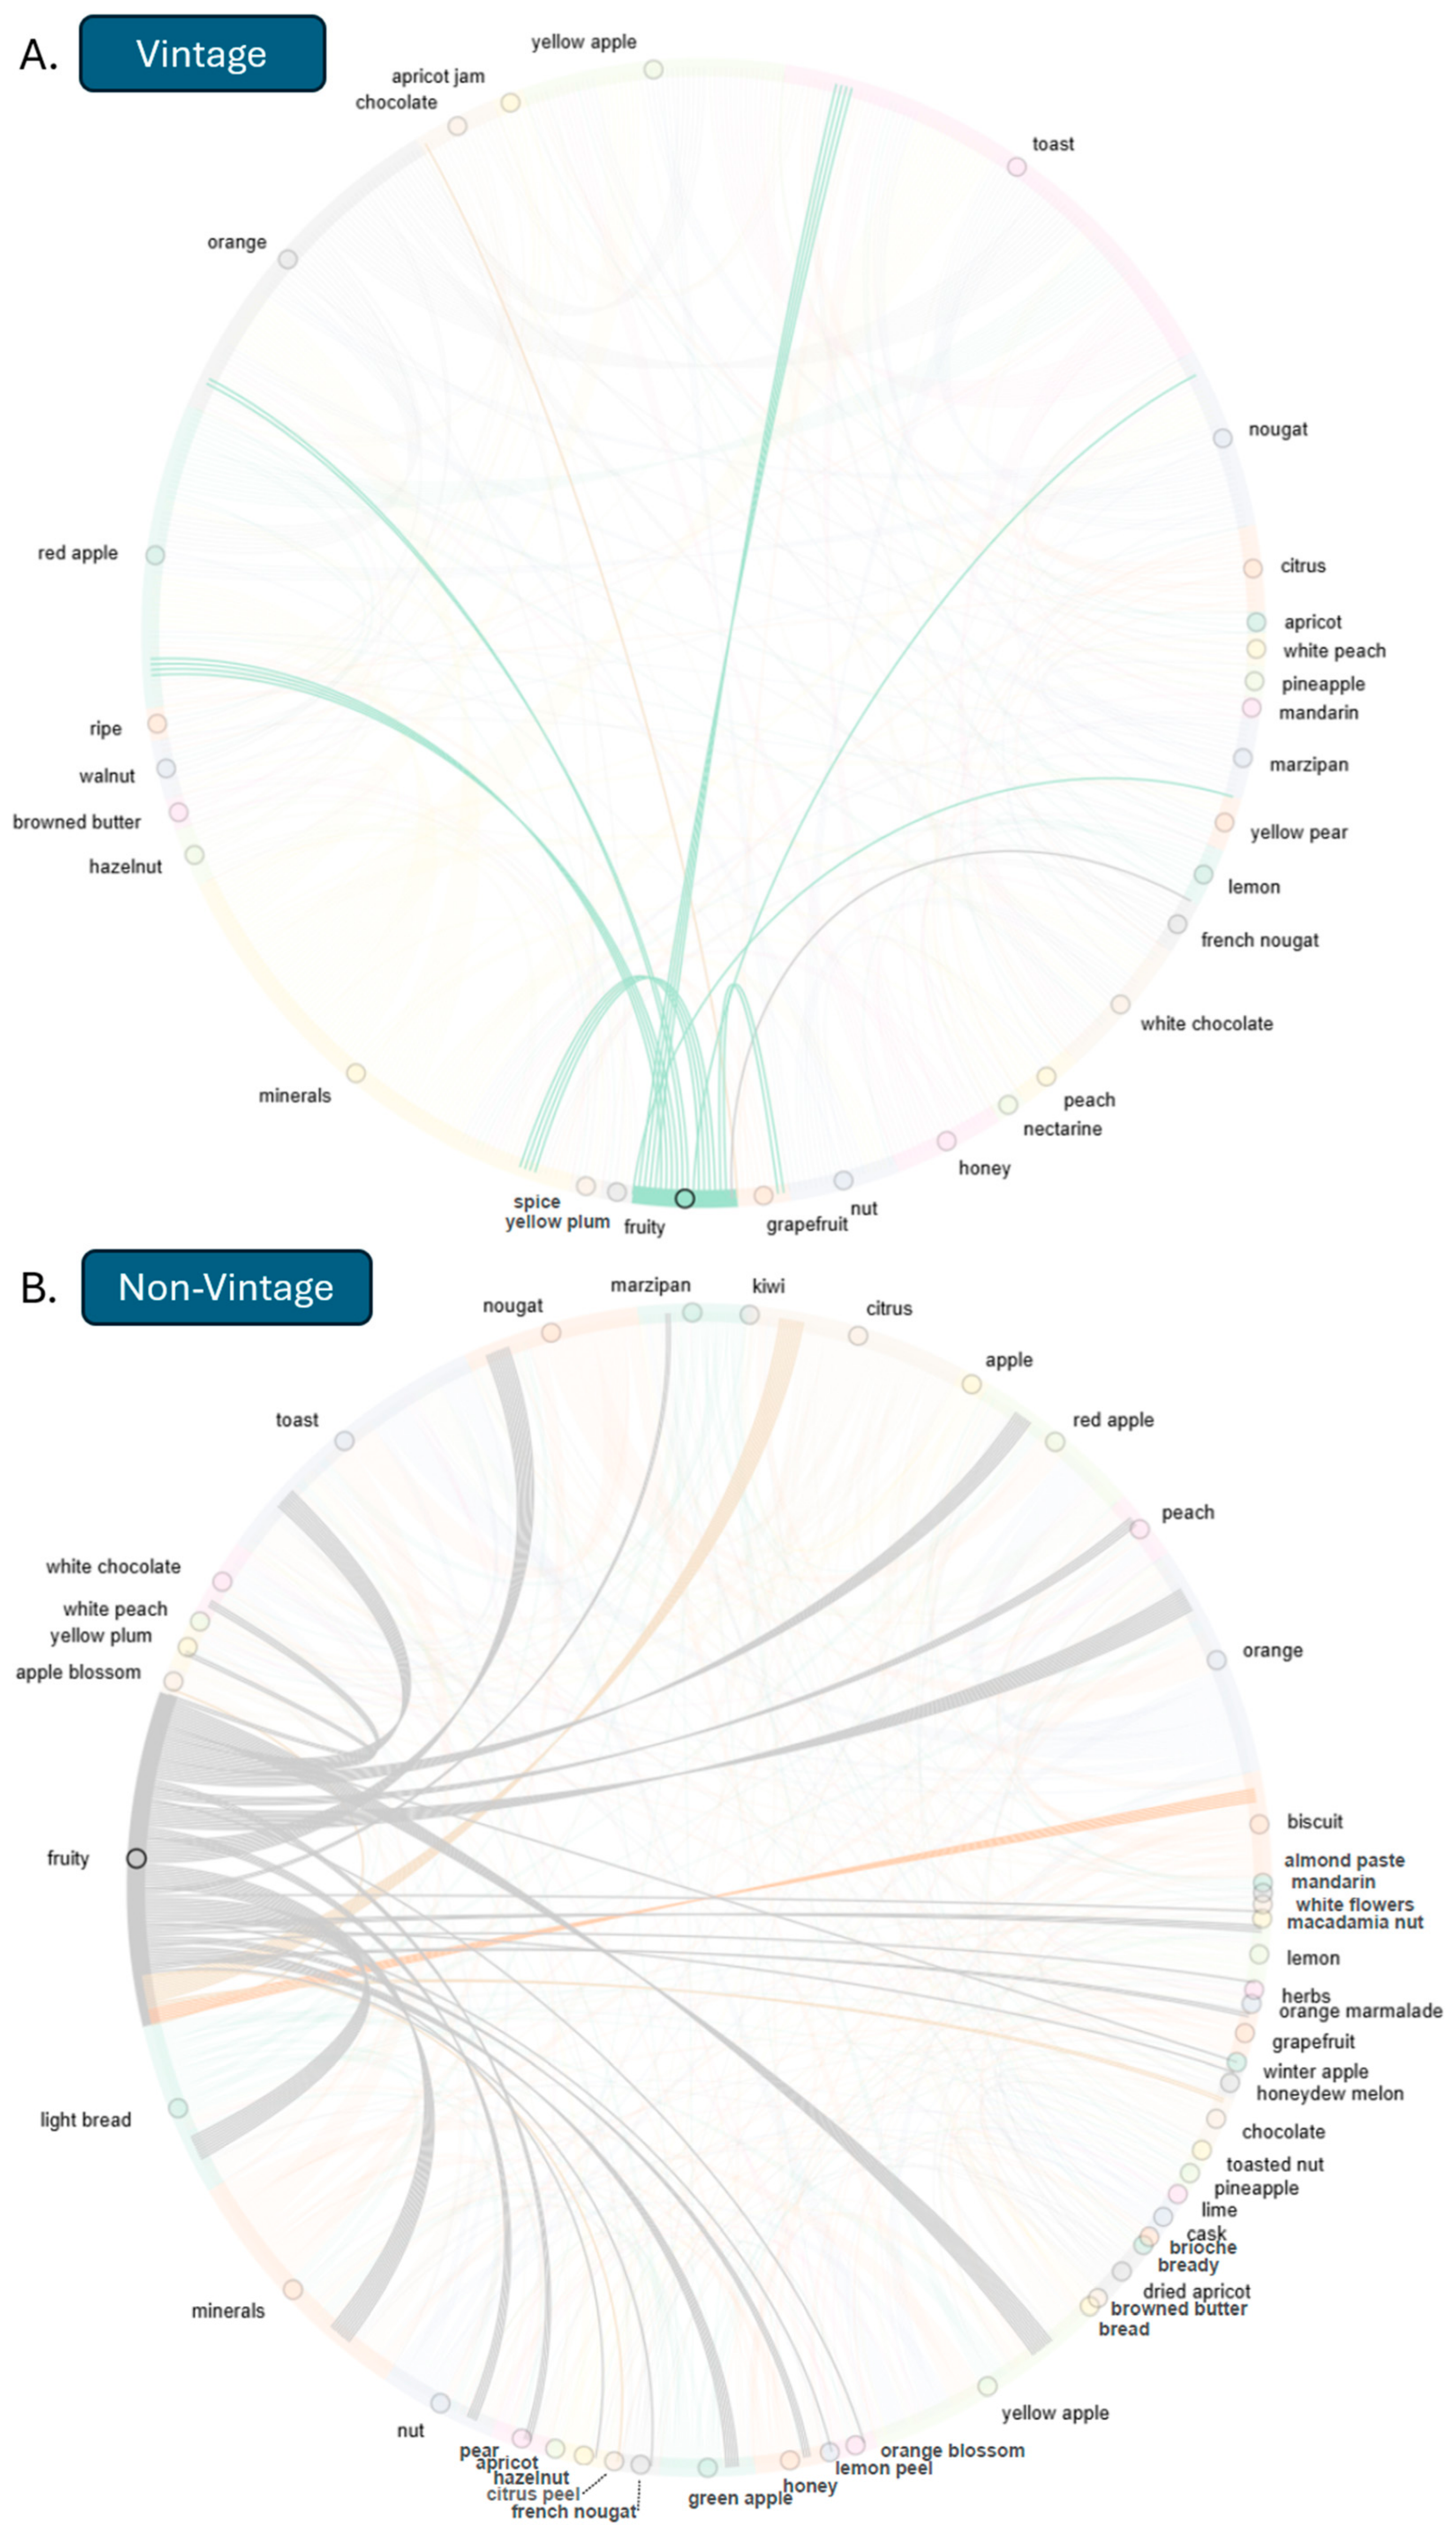
Chord diagrams. The chord diagrams for V (
Figure 6A) and NV (
Figure 6B) wines revealed differences in both the diversity of term-to-term co-occurrences and the relative prominence of individual attributes. Full chord diagrams can be found in
Supplementary Figure S1. In V Champagne wines, “mineral”, “toast”, “orange”, and “red apple” showed high FoC, diverse co-occurrences, and strong associations between themselves. The first three of these were also prominent in NV wines, where additionally “fruity” showed both a high FoC and a diverse range of connections.
The term “fruity” illustrates the differentiating capacity of chord diagrams across categories. In NV wines, “fruity” had a larger relative FoC and shared connections with 31 other attributes (
Figure 6B), predominantly specific fruit descriptors: “orange”, “yellow apple”, “red apple”, “citrus”, and “apple”. In V wines, the connections were limited (
n = 9), with the main associations restricted to “orange” and “red apple” (
Figure 6A). This suggests that in NV wines, fruitiness is described through a broader and more specific vocabulary, whereas in V wines it manifests as a more constrained set of associations.
Network maps. Network maps distribute term-to-term relationships spatially across the sensory space, with Louvain community detection identifying attribute clusters (
Figure 7). Four clusters were identified for V wines and three for NV wines.
In V wines, the four most prominent attributes (“mineral”, “toast”, “orange”, and “red apple”) were located centrally and within the same cluster, with strong co-occurrence links between them (
Figure 7A). These terms likely represent the core aromatic profile shared by most V Champagnes, with remaining attributes contributing to wine-to-wine singularity. For example, “mineral” and “toast” showed strong co-occurrence with “nougat” and “yellow apple” from an adjacent cluster, suggesting these combinations may differentiate within the V category. Conversely, attributes located toward the edges represent less frequent terms linked to fewer neighbours. The terms “ripe”, “apricot jam”, and “walnut”, positioned on the upper edge with links between themselves but with low FoC, may represent a coherent sensory dimension. In contrast, “mandarin”, “nectarine”, and “apricot”, also peripheral but without connections between themselves, are isolated attributes in this dataset.
In NV wines, the most prominent attributes (“fruity”, “mineral”, “toast”, “orange”, and “yellow apple”) appeared across more than one cluster (
Figure 7B). Their distribution across clusters, combined with their strong mutual co-occurrence, suggests these terms are shared across multiple NV wine styles. Cluster 1 grouped “fruity” and “mineral” with “light bread”, “citrus”, “green apple”, “lemon”, “biscuit”, and “honey”. Cluster 2 grouped “toast” and “orange” with “nougat”, “red apple”, “chocolate”, and “hazelnut”. Cluster 3 contained “yellow apple” alongside “marzipan”, “dried apricot”, “cask”, “pineapple”, “nut”, and “toasted nuts”. These clusters may represent distinct NV Champagne styles (a fresh/citrus-driven profile, an ageing/toasted profile, and a richer fruit/nut profile), though this interpretation requires further validation beyond the scope of this dataset.
4. Discussion
The comparison of the analytical approaches on a common dataset allows various types of insight. First, the relationship between the approaches themselves, namely how structured and unstructured strategies contribute differently to sensory space characterisation and what each reveals that the other cannot. The second concerns what the tools uncover about sensory language, how generic and specific terms function, and what different types of term-to-term associations mean for product identity. Finally, the practical application, how scientists can select methods to match their analytical question, and where these approaches may be extended beyond the present product space.
Method Complementarity. The comparison of structured and unstructured approaches on the same dataset reveals that these strategies are not competing but complementary. The structured approach (MCA and LSA applied to a presence/absence matrix) captured the overall structure of the sensory space: broad associations between attributes, assignment of wines to dominant sensory groupings, and identification of the main axes of variation. However, it treated all present attributes equally, regardless of how frequently or in what combinations they appeared across the dataset. The unstructured approach (WordVenn diagrams, chord diagrams, and network maps using frequency and co-occurrence data) contributed to this structure by adding magnitude (frequency of citation), diversity (overlapping and non-overlapping terms across categories), and specificity (co-occurrence associations between individual attribute pairs) of relationships within the sensory space. In combination, the two approaches moved from the more traditional “which attributes describe which wines” (structured) to “how do attributes relate to each other, and what does this reveal about the product” (unstructured).
“Fruity” as an Example. The term “fruity” illustrates how successive methods reveal different aspects of a single attribute. MCA positioned “fruity” without distinguishing its role across product categories. LSA assigned it to Topic 1, a broad grouping shared by most wines, providing little differentiation. The WordVenn diagram identified “fruity” as a shared term between V and NV categories but could not resolve whether it carried equivalent meaning in both. Chord diagrams revealed a quantitative difference: in NV wines, “fruity” co-occurred with 31 predominantly specific fruit attributes, while in V wines it was limited to nine connections, mainly “orange” and “red apple”. Network maps added a spatial dimension, showing that in NV wines “fruity” was centrally positioned with strong links across multiple clusters, whereas in V wines it was peripheral to the dominant cluster. Together, these findings indicate that “fruity” functions differently in the two categories: in V wines, fruitiness is expressed through specific, identifiable fruit attributes, rendering the generic term less necessary, while in NV wines, “fruity” may signal a broader, less differentiated perception where specific fruit descriptors are insufficient to capture the experience. Each wine’s sensory description was generated independently by Systembolaget’s experts at the time of product listing; products are not evaluated simultaneously. Therefore, the vocabulary diversity in NV wines reflects the intrinsic diversity across 60 different products, not an inflation effect from aggregating repeated assessments. While a larger V subset could theoretically yield a broader attribute range, this would not reflect market composition and could introduce selection bias. This interpretation aligns with the broader understanding that generic sensory terms can serve as placeholders when more precise vocabulary is not accessible or applicable.
Generic vs. Specific Terms. The differential behaviour of “fruity” points to a wider phenomenon relevant to sensory science: the role of generic versus specific terms in product descriptions. Wine experts have been shown to share a common lexicon [
24], yet the specificity with which that lexicon is used may depend on product complexity and style. The present findings suggest that the co-occurrence tools (chord diagrams and network maps) are particularly suited to making this distinction, not only identifying which terms are present, but also showing whether a term functions as a primary descriptor or as a more general one. This has practical implications for lexicon development: a term with high FoC but few specific co-occurrences may suggest further decomposition into sub-attributes, while a term with diverse, strong co-occurrences likely represents a genuine perceptual category anchoring multiple related descriptors.
Term-to-Term Association Types. The network maps and chord diagrams revealed three distinct types of term-to-term associations, each carrying different implications for sensory space characterisation. The first type involves associations between two high-FoC attributes such as “mineral” and “toast” in V wines, which represent the core sensory identity shared across most products in a category. The second type involves a high-FoC attribute linked to a lower-FoC attribute, such as “mineral” co-occurring with “nougat” or “yellow apple”, which may represent the features that differentiate individual wines or sub-styles within a category. The third type involves associations between low-FoC attributes such as “ripe”, “apricot jam”, and “walnut” clustering together at the periphery of the network, which may indicate coherent sensory dimensions that, while infrequent, are perceptually linked when they do occur. Recognising these three levels of association allows the interpretation of co-occurrence data beyond simple frequency counts: core identity, sub-style differentiation, and latent sensory dimensions.
Guidance for Method Selection. The findings from this study allow preliminary guidance on method selection based on the analytical question being asked. When the objective is to identify the main dimensions of variation across a product set and to position samples relative to each other, MCA remains appropriate, provided the dataset is not excessively sparse. When the goal is identifying coherent groupings of attributes that define sensory topics, particularly when explained variance is distributed across many dimensions, LSA offers a more interpretable partitioning of the sensory space. When the aim is to identify what is unique to or shared between product categories at the attribute level, WordVenn diagrams provide immediate visual clarity. When the question concerns the strength and specificity of relationships between individual attributes, chord diagrams allow exploration. When the goal is to map the full relational structure of the sensory space and identify clusters that may correspond to product styles, network maps with community detection offer the richest spatial representation. No single tool answered all questions in this study; their complementary use produced a more complete characterisation than any individual approach.
Broader Applications. The analytical framework shown here (comparing structured and unstructured approaches on a common dataset) is not restricted to Champagne wines or to oenology. Recent work applying network analysis and WordVenn diagrams to characterise hop-associated descriptors in beer [
31] suggests that the complementarity observed in the present study extends across product categories. Semantic networks have also been used to explore the lexicon associated with tannins in descriptions provided by wine experts [
37].
Beyond method comparison, programmatic processing of sensory text data offers practical benefits: reduced human error in data consolidation, efficient handling of larger datasets than manual tabulation permits, and reproducibility through open-source code. Several applications can be envisioned based on present findings. Characterising and defining sensory spaces from online data, as demonstrated here with retailer-generated descriptions, could be extended to consumer-generated content from platforms where vocabulary is less standardised. The co-occurrence tools are particularly suited to investigating conceptual–perceptual alignment (e.g., whether “minerality” is a perceptual category or a conceptual construct) by revealing whether such terms form coherent association patterns. Cross-country studies could exploit the same framework to examine whether co-occurrence structures differ across languages and cultures, reflecting different conceptual organisations of the sensory space. Finally, network maps applied to individual panellist data could serve as a diagnostic tool in panel training, visualising heterogeneity in how assessors associate attributes.
5. Limitations
The limitations of this study can be put under a few categories. The first concerns methodological scope: the choices made regarding data source and dataset size that define the boundaries of the findings. The second relates to linguistic and analytical decisions made during data processing (translation and stop-word selection), which directly influence the attribute set and, consequently, the co-occurrences observed. The third is a technical constraint inherent to static publication formats, which cannot fully convey the exploratory capacity of interactive visualisation tools.
The dataset originates from a single source (Systembolaget, Sweden), where trained experts describe products using standardised, specific vocabulary. This assessment context determines the attribute granularity (the level of specificity at which sensory perceptions are expressed). For example, wine critics may employ finer or more metaphorical distinctions [
23,
38], consumers on open platforms tend toward broader categories, and multilingual sources may use different levels of detail coming from the language itself. Because co-occurrence structures are directly shaped by the vocabulary of the source, the sensory patterns identified here reflect this specific panel’s way of working and should be interpreted accordingly. The generalisability of these findings to other contexts should not be assumed without a good understanding of the nature of the dataset being analysed.
The dataset size (81 wines, 53 attributes) was deliberately chosen to allow structured approaches to remain interpretable and to enable direct comparison across methods, the main aim of this work. However, the behaviour of these tools on substantially larger or more heterogeneous data sets, where attribute counts, vocabulary variability, and co-occurrence density would increase, remains to be evaluated. The relative performance of methods may change with scale; for instance, chord diagram complexity may become a practical constraint with very high attribute counts, while network maps and LSA may benefit from larger document sets.
Sensory descriptions were translated from Swedish to English using Google Translate. The standardised, technical nature of the source vocabulary (enumerated attributes rather than continuous prose) helped the translation reliability; however, no formal inter-rater agreement or back-translation verification was performed. Potential translation artefacts cannot be entirely excluded, particularly for terms where Swedish sensory vocabulary may not map one-to-one onto English equivalents. Nonetheless, the Swedish language has been shown to share the highest “genetic similarity” at a language level with the English language, as shown by Kunst and Bierwiaczonek [
39]. Additionally, the dataset size is small, and in this case, a manual check is possible.
The stop word list was determined through manual inspection of the corpus, identifying terms that functioned as qualifiers or intensifiers rather than discrete sensory descriptors. This decision is inherently subjective; alternative exclusion criteria could produce different attribute sets and, consequently, different co-occurrence patterns.
Finally, chord diagrams and network maps offer interactive exploration capabilities that cannot be fully conveyed in static manuscript figures. Even with a dataset of 81 wines, the resulting visualisations were sufficiently complex to require separate presentations for V and NV categories rather than a single combined view. With larger datasets (more products, more attributes, denser co-occurrence structures), this complexity would increase substantially, making static representation increasingly inadequate and interactive functions essential for meaningful interpretation. The representative views presented were selected to illustrate key findings, but the full exploratory potential of these tools requires engagement with the accompanying code. This implies that a degree of programming proficiency becomes necessary to fully exploit these approaches, representing a practical barrier to adoption that the field must address if visualisation-driven methods are to reach wider use.
6. Conclusions
This study compared established, recently reported, and new analytical approaches for extracting sensory insights from wine text data, using aroma descriptions of 81 Champagne wines as a case study. The comparison demonstrated that structured approaches (MCA, AHC, LSA) and unstructured approaches (WordVenn diagrams, chord diagrams, network maps) are not interchangeable but complementary alternatives: the former captures the structure of the sensory space, while the latter resolves the texture of attribute relationships within the space.
Some key outcomes emerge from this work. First, no single method answered all analytical questions; combining approaches produced a more complete characterisation of the Champagne aroma space than any individual tool, including the identification of core category descriptors, sub-style differentiation, and latent sensory dimensions. Second, co-occurrence-based tools (chord diagrams, network maps) proved particularly suited to revealing how shared attributes function differently across product categories, as demonstrated through the differential behaviour of the term “fruity” in vintage and non-vintage wines. Finally, the term-to-term association types identified here (distinguishing core identity associations, sub-style markers, and latent dimensions) offered a reusable framework applicable beyond this specific product space.
These findings provide preliminary practical guidance for sensory experts and wine scientists when selecting analytical approaches for text-based sensory data: the choice of method should be driven by the nature of the question being asked rather than by convention or tool availability. The open-source implementation of all unstructured approaches supports accessibility and reproducibility across research groups and product categories.