Article

FT-IR Physico-Chemical Parameters and GC-MS Polar Metabolite Fingerprints Discriminate Carignano and Cannonau DOC Wines


Department of Life and Environmental Sciences, University of Cagliari, Cittadella Universitaria di Monserrato, 09042 Cagliari, Italy
*
Author to whom correspondence should be addressed.
Beverages 2026, 12(5), 59; https://doi.org/10.3390/beverages12050059
Submission received: 16 March 2026 / Revised: 6 May 2026 / Accepted: 11 May 2026 / Published: 12 May 2026
(This article belongs to the Section Wine, Spirits and Oenological Products)

Highlights

  • A combined FT-IR and GC-MS analytical approach distinguishes Cannonau and Carignano DOC wines.
  • Polar metabolites from GC-MS show strong correlations with FT-IR physico-chemical parameters, defining wine uniqueness.
  • Local winery practices influence wine polar metabolite profiles.

Abstract
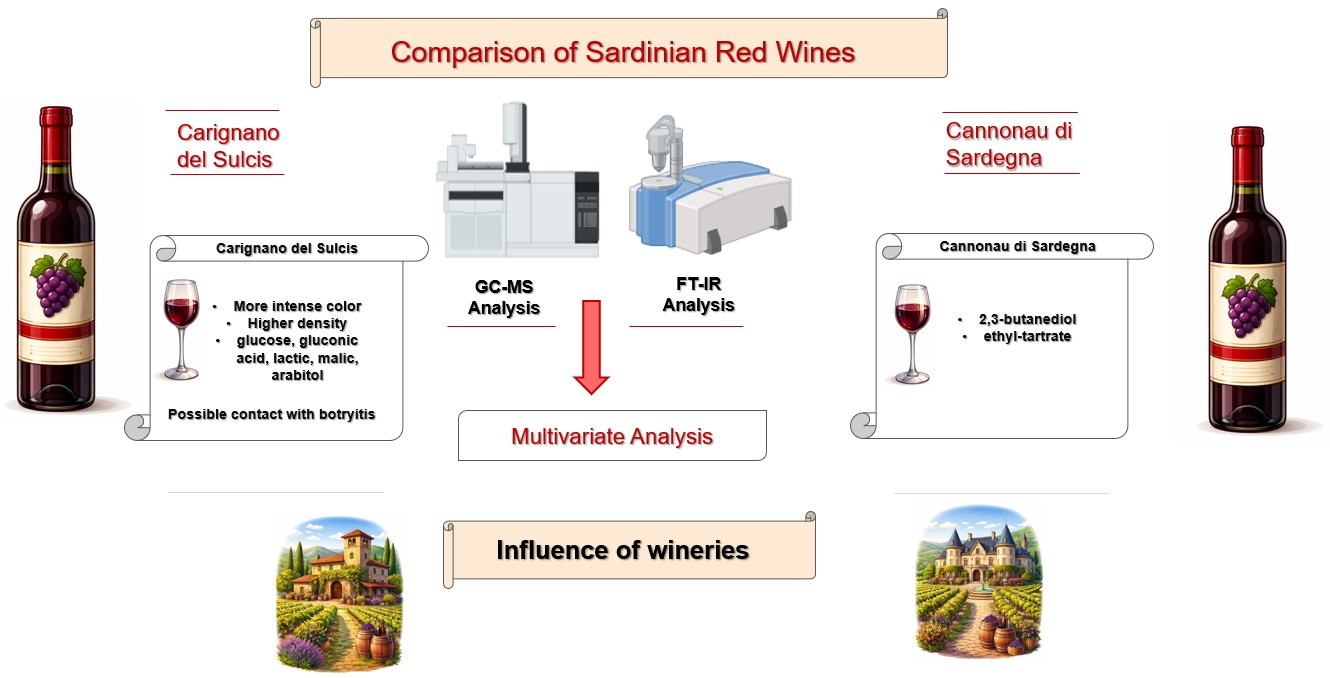
To protect wine authenticity and quality, two Sardinian red wines, Carignano del Sulcis and Cannonau di Sardegna, were characterized using an FT-IR and untargeted GC–MS integrated approach. FT-IR-derived oenological parameters, together with GC–MS profiles of polar low-molecular-weight metabolites, were subjected to multivariate statistical analysis. Compared with Cannonau, Carignano exhibited higher color intensity, greater density, and higher contents of glucose, lactic acid, and malic acid. Discriminant analysis of GC-MS data revealed that Carignano was characterized by uronic acids and arabitol, suggesting possible exposure to Botrytis. In contrast, Cannonau was characterized by 2,3 butanediol and ethyl-tartrate, indicating more pronounced yeast fermentative activity, consistent with the lower residual glucose content measured by FT-IR. Classification analysis demonstrated that the different wineries exert significant influence on the final characteristics of the wine. Overall, the findings demonstrated the effectiveness of this integrated analytical approach as a promising tool for wine authentication.

Graphical Abstract

1. Introduction

Cannonau and Carignano are red grape varieties traditionally cultivated on the island of Sardinia (Italy) (Figure S1). Cannonau is the most widespread and representative cultivar of the region and has long been used for winemaking; historical records trace its presence back to the sixteenth century [1]. In the VIVC (Vitis International Variety Catalog), the grape variety associated with Cannonau di Sardegna is registered under the primary name Garnacha Tinta cultivated in Spain (Accession Number: 4461). Since 1972, Cannonau wines have been protected under the Denomination of Controlled Origin (DOC) designation as “Cannonau di Sardegna” (Gazzetta Ufficiale no. 272, 1992) [2]. The Carignano cultivar is used to produce a ruby-red wine characterized by a vinous aroma and a dry, fruity, and harmonious taste. Carignano belongs to a broad group of Spanish and French grape varieties, including Cariñena, Mazuela, and Carignan [1]. In the VIVC, it is registered under the primary name Carignan Noir (Accession Number: 2098). In 1977, Carignano del Sulcis was recognized as an Italian DOC wine. Its production is restricted to approximately 1700 hectares within the Sulcis wine district (Southwestern Sardinia, Italy; see Figure S1). The clay and sandy soils of this area enabled vines to survive the phylloxera epidemic that devastated Mediterranean vineyards in the late nineteenth century. As a result, ungrafted vines aged between 80 and 100 years are still commonly found in this region [3]. Carignano wines have been reported to contain high levels of phenolic compounds and to exhibit strong in vitro antioxidant capacity, particularly as free radical scavengers [3].
The volatile chemical composition of Cannonau wines has been previously investigated using GC-FID/MS coupled with sensory descriptive analysis. These studies revealed a predominance of yeast-derived compounds in the headspace and highlighted a high variability in volatile organic compounds (VOCs) among wine samples. Such variability may be attributed to differences in agronomic practices and to the distinct physico-chemical characteristics of the vineyards involved [4]. For Carignano wines, the influence of aging technologies on the aroma profile has also been explored [5]. Although these grape cultivars are grown in relatively restricted areas of the island, both Cannonau and Carignano wines are produced by multiple wineries. In addition to the influence of grape terroir, winemaking practices conducted within DOC regulations can strongly influence the final composition of the wine. Key variables include harvest timing, fermentation temperature, skin maceration duration, and type of containers used for aging.
Given the economic and cultural importance of winemaking in Sardinia, the characterization and protection of Cannonau di Sardegna and Carignano del Sulcis DOC wines are of primary importance. Reliable analytical tools are therefore required for quality control, classification, and authentication of these certified wines. Research focused on the characterization of physico-chemical parameters and metabolite profiles plays a crucial role in achieving these objectives. Various analytical techniques can be applied to the study of physico-chemical parameters and chemical composition of wines, with each method targeting specific classes of compounds. The large amount of data generated by these analytical procedures is often elaborated by chemometric approaches [6]. While water, ethanol, and glycerol are the major constituents, wine also contains hundreds of low-molecular-weight compounds present at varying concentrations. In addition to the extensively studied volatile fraction, wine contains other important classes of compounds such as sugars, organic acids, amino acids and secondary metabolites which are the result of biological processes, such as alcoholic and malolactic fermentations. These compounds are also taste-active metabolites that, together with volatile compounds, contribute to the overall flavor profile of wine. The nature and concentration of these metabolites depend on many factors, including grape types and yeasts or bacteria responsible for fermentation. GC-MS is a powerful analytical technique widely applied for the study of the polar non-volatile low-molecular compounds in biological matrices such as wine [7]. Meanwhile, Fourier transform infrared (FT-IR) spectroscopy, when combined with calibration procedures, has proven to be a highly versatile technique to predict the physico-chemical parameters of wine in real-time [8,9]. The mid-infrared region (400 to 4000 cm−1) offers more accurate determination of compounds than near-infrared spectroscopy [9] and includes the fingerprint region, 983–1149 cm−1, which contains a significant amount of variation related to the absorbance by molecular chemical groups present in alcoholic beverages [10].
Within the framework of research aimed at protecting wine authenticity and quality, this study investigates the effectiveness of a FT-IR and GC-MS integrated analytical approach for the characterization and classification of Cannonau di Sardegna and Carignano del Sulcis wines. Oenological parameters obtained by FT-IR and polar metabolite profiles generated by GC-MS were combined using multivariate statistical analysis (MVA). Classification tools were also applied to evaluate the influence of wineries on the compositional profile of the finished wines.

2. Materials and Methods

2.1. Samples

A total of 32 commercial samples of wine were collected directly at eight different wineries located in Sardinia (Italy; see map in Figure S1). Sixteen samples were of Carignano del Sulcis DOC and 16 of Cannonau di Sardegna DOC single-cultivar wines, produced between 2010 and 2011. Table 1 shows the number of samples that have been analyzed in this study, the type of wine, the trade name of the samples, and the winery.

2.2. Reagents

All chemicals used in this study were of analytical grade. Dodecane, hexane, pthalic acid, D-gluconic acid, proprionic acid, benzoic acid, D-galacturonic acid, D-glucoronic acid, 3-hydroxy butyric acid, D-mannitol, maleic acid, isovaleric acid, L-malic acid, butyric acid, L-proline, ethylphosphoric acid, and N,O-Bis (trimethylsilyl) trifluoroacetamide (BSTFA) + Trimethylchlorosilane (TMCS) (99:1, v/v) were purchased from Sigma (St. Louis, MO, USA). Bidistilled water was obtained from a MilliQ purification system (Millipore, Milano, Italy).

2.3. Physico-Chemical Parameters

In total, 600 μL of wine, taken from freshly opened bottles, was analyzed by an OenoFoss™ (FOSS, Hilleroed, Denmark) spectrometer equipped with Foss Integrator software (version 1.4) in the mid-infrared spectral region (400 to 4000 cm−1). Glucose, fructose, pH, total acidity, malic acid, volatile acidity, lactic acid, and percent ethanol were determined. Ranges of calibrations were between 0 and 15 g/L for glucose–fructose, 2.6 and 4.5 for pH, 1.5 and 8.0 g/L for total acidity, 0 and 7 g/L for malic acid, 0 and 1.5 g/L for volatile acid (as acetic acid), and between 8% and 16% for ethanol. Colors were measured by calibrations of the Optical Density (OD) at 420 nm, 520 nm, and 620 nm. Color intensity was the sum of 420 nm, 520 nm, and 620 nm absorbances and represents the amount of color. Color hue (tonality) is the ratio of OD 420/520, used to monitor wine aging when the color goes towards orange. Total polyphenols were determined by calibration of the OD at 280 nm where the benzene ring of phenols absorbs.

2.4. GC-MS Analysis

An aliquot of 200 μL of wine from freshly opened bottles was placed into a vial and evaporated to dryness under a nitrogen stream overnight. Dried samples were derivatized by adding 50 μL of BSTFA + TMCS (99:1, v/v) as previously described [11]. After 1 h, samples were reconstituted in 100 μL of a hexane solution containing succinic acid-d4 (5 mg/L) as internal standard. A volume of 1 μL was injected in splitless mode into a 6850 gas chromatograph coupled to a 5973 Network mass spectrometer (Agilent Technologies, Santa Clara, CA, USA). Separation was achieved using a fused silica capillary column (30 m × 0.25 mm i.d.) coated with a 0.25 μm DB-5MS stationary phase (J&W Scientific, Folsom, CA, USA). The injector temperature was set at 200 °C, and helium was used as carrier gas at a constant flow rate of 1 mL/min. The oven temperature program started at 50 °C (held for 10 min), then increased to 300 °C at a rate of 10 °C/min, and maintained at 300 °C for an additional 10 min. The transfer line and ion source temperatures were set at 280 °C and 180 °C, respectively. Mass spectra were acquired in electron ionization (EI) mode at 70 eV, with a scan rate of 1.6 scans/s over a mass range of m/z 50–550. Peak identification was performed by comparing the acquired spectra with those in the NIST08 library following deconvolution using AMDIS software (version 2.1).

2.5. Univariate and Multivariate Statistical Data Analysis

Univariate descriptive data analysis was performed: means, standard deviations (SD), and coefficients of variation % (CV%, calculated as SD/mean × 100) were calculated. Statistically significant mean differences were tested by Welch’s test. Pearson’s correlation coefficient r between two variables was considered significant for values −0.70 > r > +0.70. As a suitable data matrix for multivariate analysis (MVA), the peak areas of each GC-MS chromatogram (then of each sample) have been normalized to 100. When the distribution of a variable presented high values of skewness, it was log transformed. We obtained 2 data matrices with 32 × 47 and 32 × 37 dimensionality, for FT-IR and GC-MS data, respectively. The data were mean centered and unit variance scaled. At first, the explorative unsupervised Principal Component Analysis (PCA) was carried out. The pairwise Partial Least Squares Discriminant Analysis (PLS-DA) was applied for sample classification. To identify discriminant metabolites between the two types of wine, we performed an Orthogonal Partial Least Squares Discriminant Analysis (OPLS-DA). Discriminant variables were selected based on the variable importance in projection (VIP) scores in the predictive component of OPLS-DA, with a threshold of VIP values > 1. GC-MS metabolite profiles were correlated to each measured physico-chemical characteristic by a single-Y orthogonal extension of Partial Least Squares (OPLS) regression; the VIP values in the predictive component were evaluated to identify the GC-MS metabolites most correlated to each parameter. The cumulative parameters R2X, R2Y, and Q2Y (R2Y in cross validation) were evaluated to assess model quality. The significance of OPLS models was estimated by the CV-ANOVA diagnostic tool. The models were considered significant only when the difference between R2Y and Q2Y was <0.50. MVA was performed by SIMCA-P+ program (Version 17.0. Sartorius Stedim Data Analytics AB, Umeå, Sweden).

3. Results and Discussion

3.1. FT-IR Physico-Chemical Parameters

A total of 13 oenological parameters were calculated for Cannonau and Carignano wines, and the results are reported in Table 2. More detailed results, grouped by brand, are provided in Tables S1 and S2.
Percent ethanol means were calculated as 13.1 ± 1.3 and 12.6 ± 0.6, for Cannonau and Carignano, respectively. Carignano samples showed lower variability in the ethanol content, whereas one Cannonau brand (Mamuthones, Table S2) had an ethanol content of 15.0%. These data were consistent with the alcohol concentrations reported on the wine labels. Glucose+fructose represents the residual sugar content, available for further fermentation. Mean concentrations were 1.4 ± 1.3 and 2.1 ± 1.6 g/L for Cannonau and Carignano, respectively, with high variability within sample groups. Furthermore, Carignano was found to be significantly denser and richer in glucose than Cannonau. Among wineries (Tables S1 and S2), pH values were relatively similar, with mean values of 3.7 ± 0.1 and 3.8 ± 0.1, for Cannonau and Carignano, respectively. These values fall within the typical pH range reported for red table wines which was set between 3.3 and 3.7 [12].
Cannonau and Carignano showed similar total and volatile acidity mean values, while they showed significantly different values (p < 0.01) of malic acid and lactic acid. In Cannonau, malic acid showed a mean value of 0.2 ± 0.2 g/L with a high CV, having Baione and Nepente values lower than 0.05. In Carignano, the mean was 0.3 ± 0.1 g/L with less variability. Cannonau and Carignano wines showed mean lactic acid concentrations of 1.0 ± 0.7 and 1.6 ± 0.8 g/L, respectively. Mean volatile acid values for Cannonau and Carignano were 0.62 ± 0.07 and 0.58 ± 0.14 g/L respectively, with the highest value of 0.80 ± 0.02 g/L for Giba (Carignano).
The OD values at 420, 520 and 620 nm were significantly higher in Carignano, as well as color intensity. Color tonality, calculated as the ratio of 420/520 OD values, was similar for the two wines. Nepente (Cannonau) showed the lowest color value (3.1 ± 0.9) and the highest tonality (1.17 ± 0.05). Overall, based on CV% values, FT-IR data indicated greater variability in Cannonau than in Carignano. This finding is consistent with the wider production area of Cannonau, whereas Carignano production is limited to a more restricted region (see Figure S1).
The acidity of wine influences the stability and quality of wine. The total acidity is the result of the contribution of non-volatile acids such as malic acid and tartaric acid, together with the acids separated by steam volatilization. Volatile acids are considered markers for spoilage, and the limit for volatile acidity in wines was set as 1.2 g/L of acetic acid [13]. Therefore, all wines here tested fall safely below this level. The non-volatile acids can vary depending on the amount present in the fruit, the yeast or bacteria used for fermentation, as well as soil, climate, and fruit-growing conditions. Grapes contain malic acid, tartaric acid and small amounts of citric acid. Lactic acid, acetic acid, and succinic acid are produced during alcoholic fermentation [14]. Organic acids contribute to overall wine quality, owing to their characteristic tastes. Moreover, organic acids and their salts help maintain a relatively low pH that protects the wine from bacterial attack and microbiological spoilage [15].
In Cannonau wine, malic acid and lactic acid were inversely correlated (r = −0.76) suggesting an efficient malolactic fermentation (MLF), supported by the low malic acid content, as reported in Table S1, of some Cannonau wines. On the other hand, lactic acid content was found directly correlated to pH, r = 0.78, suggesting an active deacidification role of MLF in Cannonau. In fact, LAB mainly convert malic acid into lactic acid; this is a biological deacidification route, resulting in an increase in pH and a reduction in perceived wine acidity [16], supported in our Cannonau samples by the positive correlation between lactic acid and pH values.
In Carignano, no correlation (r < 0.70) was observed between malic acid and lactic acid, whereas lactic acid was inversely correlated to phenols. This observation suggests that phenols may have inhibited MLF. In winemaking, MLF occurs after alcoholic fermentation and contributes to the microbial stability of the final product and its organoleptic quality. Phenolic compounds negatively affect lactic acid bacteria (LAB) fermentation [17]. In Carignano, total acidity and volatile acidity, and in turn, volatile acidity and malic acid were strongly positively correlated (r = 0.74 and r = 0.86, respectively). The correlation value between pH and total acid content was r < 0.70, indicating that the pH does not represent the total acid content of these wines. In Carignano, the phenol content correlated with OD 420 (r = 0.79), OD 520 (r = 0.71) and color intensity (r = 0.73), but not with tonality, suggesting that the polyphenolic compounds contribute to the darkness of wines.

3.2. GC-MS Multivariate Analysis

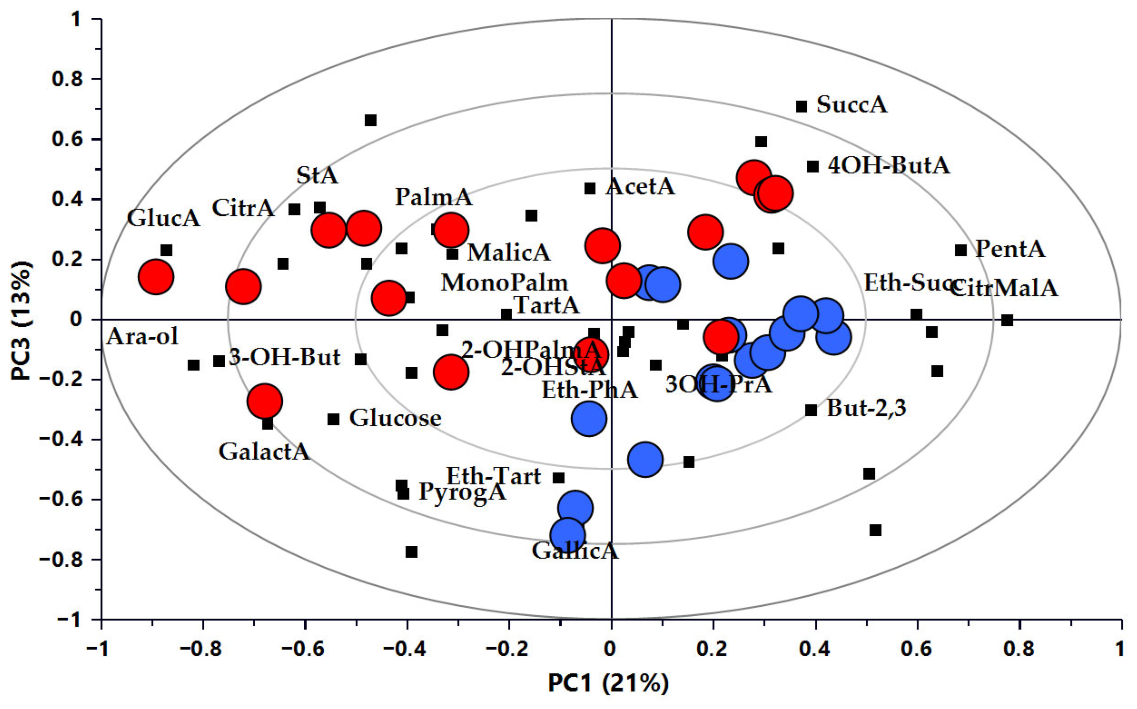
Figure S2 shows a representative GC-MS chromatogram of red wine. By the analysis of chromatograms, 46 peaks were detected, and 26 were unambiguously annotated (Table S3). Among the identified chemical compounds, there are the principal organic acids of wine (acetic acid, malic acid, tartaric acid, and succinic acid), together with a number of hydroxy acids. Uronic acids, including gluconic and galacturonic acids, ethyl-derivates, gallic acid, sugars, and others, were also annotated. GC-MS metabolite profiles of Carignano and Cannonau were submitted to MVA. The results of the PCA, depicted as a scores and loadings biplot, are shown in Figure 1.
Visual inspection of the PCA biplot showed that, although some overlap occurred in the central part, the two wines tend to cluster in different areas of the plot characterized by different metabolites. To evaluate how accurately GC-MS data could be used to discriminate between wines, the PLS-DA classification tool was used to split samples into a training set and an external test set. Samples were correctly classified with 100% accuracy when the external set included samples representative of each winery, corresponding to one-quarter of the total samples. Different results were obtained when all four samples from one winery were left out at a time, corresponding to one-eighth of the total samples. In this case, the predictive performance of GC-MS data, although satisfactory, was lower, with 88% accuracy for both wine types.
To identify those metabolites that discriminated between the two typologies of wine, a pairwise OPLS-DA was performed. The score plot is shown in Figure S3, and discriminant metabolites are reported in Table 3.
As reported in Table 3, gluconic acid, arabitol, and galacturonic acid, together with a tertiary alcohol and stearic acid, discriminated Carignano from Cannonau. Conversely, Cannonau showed higher GC-MS peak areas for 2,3-butanediol, ethyltartrate, gallic acid, and citramalic acid.
Butanediol is the major dialcohol found in wine and is a product of fermentation. The higher peak area of 2,3-butanediol in Cannonau indicated prevailing metabolism of Saccharomyces cerevisiae (or other yeasts) in this wine compared to Carignano. This interpretation is also supported by the lower content of glucose observed in Cannonau. Butanediol may influence wine sensory properties by imparting a slightly bitter taste and viscous body. Cannonau was also characterized by ethyl tartrate, an ethyl ester which can be produced in wine through enzymatic esterification of tartaric acid with ethanol [18]. Although mean phenol levels measured by FT-IR were not statistically different, gallic acid showed higher peak areas in Cannonau with respect to Carignano.
Gluconic acid, galacturonic acid, and arabitol discriminated Carignano from Cannonau. Gluconic acid is produced from the conversion of glucose to gluconic acid by the glucose oxidase–catalase enzyme present in different microorganisms that infect grape berries, including the fungus Botrytis cinerea. The concentration of gluconic acid in musts and wine is a crucial analytical parameter for oenologists, used to quantify the degree of grape spoilage and assess wine quality [19,20]. Galacturonic acid is the most abundant component of pectic polysaccharides of skin cell walls and can also be found in botrytized grapes. Indeed, Botrytis cinerea secretes multiple cell wall-degrading enzymes (including pectinases, cellulases and hemicelluloses) which can release this uronic acid [21,22]. Arabitol is a polyol that is not naturally present in grapes; it can be produced by yeast and has been proposed as a metabolic biomarker of Botrytis cinerea infection [23].

3.3. Correlations Between GC-MS Profile and FT-IR Physico-Chemical Parameters

To assess correlations between the GC-MS metabolite profiles and the measured physico-chemical parameters, a PLS regression analysis was applied. This latter is a powerful chemometric approach used to correlate complex, high-dimensional chemical profiles with specific sample properties. Quality model parameters of PLS for each FT-IR parameter are reported in Table S4, and the GC-MS metabolites mostly correlated to each calculated physico-chemical parameter are listed in Table 4. Overall, good correlations were observed between GC-MS metabolite profiles and physico-chemical parameters. However, PLS models were not satisfactory for total acidity, density, or color parameters (Table S4).
2,3 butanediol levels were found to be positively correlated with increasing ethanol values and negatively with glucose and lactic acid FT-IR parameters. Butanediol is produced by yeast (especially Saccharomyces cerevisiae) during alcoholic fermentation, whereas lactic acid is produced during MLF by LAB such as Oenococcus oeni. Their inverse correlation suggests competition between these two fermentation pathways, with the former prevailing in Cannonau and the latter in Carignano, as suggested by the above-mentioned results. Butanediol was also positively correlated with phenols. Succinic acid was positively correlated with increasing pH values. Succinic acid is a weak non-volatile acid that, together with lactic acid and acetic acid, is produced during the alcoholic fermentation process [14]. Succinic acid has little effect on wine’s pH. Succinic acid was also found to be negatively correlated with volatile acidity. Increasing ethyl tartrate levels were correlated to decreasing pH values [24].
3-Hydroxypropanoic acid belongs to the class of hydroxy acids previously detected in fermented beverages [25]. It was found to be negatively correlated with ethanol, malic acid, phenols, and with the residual sugar content available for further fermentation (glucose–fructose). Pyroglutamic acid levels were found to be positively correlated with increasing volatile acidity levels. The relationship between volatile acidity and this metabolite remains unclear. Pyroglutamic acid may have a variable impact on the aroma of the products in which it is present. In wine, pyroglutamic acid and its ethyl ester derivate are thought to negatively contribute to imparting a penetrating odor and a bitter taste [26]. The formation of sensory-relevant concentrations of pyroglutamic acid depends primarily on the content of its precursors: glutamic acid and glutamine.

4. Limitations

This study has some limitations that should be considered when interpreting the results. First, the analyzed wines belonged to only one vintage (2010–2011); therefore, vintage-specific climatic conditions may have affected grape metabolism and, consequently, the resulting metabolite profiles. Second, although samples were collected from eight wineries, the overall number of samples (n = 32) remains relatively small. Finally, the number of polar low-molecular-weight metabolites identified by GC–MS was limited and their identification was based only on mass spectral matching and retention time, and no external calibration methods were used.

5. Conclusions

In this study, an integrated GC-MS and FT-IR analytical approach was applied for the first time to achieve a comprehensive characterization of Carignano del Sulcis and Cannonau di Sardegna wine. The classification power of the GC-MS metabolite profiles has been tested by discriminant analysis using an external validation set of samples, demonstrating that the two wines could be reliably differentiated. Nevertheless, the influence of winery-specific practices should be carefully taken into account, as differences in oenological procedures may affect wine classification. Significant correlations were observed between GC-MS profiles and physico-chemical parameters, highlighting the important role of polar low-molecular-weight metabolites in defining the unique characteristics of these wines. Overall, this combined analytical strategy represents a promising tool for ensuring the authenticity and distinctiveness of Cannonau and Carignano wines. Considering the exploratory nature of this work, further investigations, also including volatile substances and tannic content, are warranted.

Supplementary Materials

The following supporting information can be downloaded at: https://www.mdpi.com/article/10.3390/beverages12050059/s1, Figure S1. Sardinia map, with wineries locations; Figure S2. GC-MS chromatogram of a red wine extract; Table S1. FT-IR physico-chemical parameters for each brand of Carignano wine; Table S2. FT-IR physico-chemical parameters for each brand of Cannonau wine; Table S3. GC-MS characteristics of wine metabolites; Figure S3. OPLS-DA score plot of GC-MS data for Carignano (blue circles) and Cannonau (green circles) wine. The ellipse depicted in dashed line encloses the 95% Hotelling T2 confidence region. (1 + 3 components R2Ycum = 0.98 and Q2Ycum = 0.92); Table S4. Results of PLS models for metabolite profiles (predictor variable X) and wine physico-chemical FT-IR parameters (response variable Y). Only the models showing a difference between R2Y and Q2Y < 0.50 were considered performing. Table S5. Raw data of FT-IR and normalized GC-MS peak areas.

Author Contributions

Conceptualization, P.C., P.S. and M.C.; Methodology, P.C., P.S., M.C., C.M.; Software, P.S. and M.C.; Validation, P.C., P.S. and M.C.; Formal Analysis, P.S. and M.C.; Investigation, P.S. and M.C.; Data Curation, C.M., P.S., M.C. and C.M.; Writing—Original Draft Preparation, C.M., P.S. and M.C.; Writing—Review and Editing, P.C., P.S. and M.C.; Visualization, P.C., P.S. and M.C.; Supervision, P.C., P.S. and M.C. All authors have read and agreed to the published version of the manuscript.

Funding

This research received no external funding.

Institutional Review Board Statement

Not applicable.

Informed Consent Statement

Not applicable.

Data Availability Statement

The data presented in this study are included in the article/Supplementary Material. Further inquiries can be directed to the corresponding author.

Acknowledgments

The authors wish to thank Barbara Liori for helpful discussions.

Conflicts of Interest

The authors declare no conflicts of interest.

References

  1. Nieddu, G. Vitigni Della Sardegna: Notizie Storiche, Distribuzione Geografica, Sinonimi. 2011. Available online: http://www.sardegnadigitallibrary.it/documenti/17_151_20130327091619.pdf (accessed on 14 April 2025).
  2. Carbonaro, C.M.; Corpino, R.; Chiriu, D.; Ricci, P.C.; Rivano, S.; Salis, M.; Tuberoso, C.I.G. Exploiting combined absorption and front face fluorescence spectroscopy to chase classification: A proof of concept in the case of Sardinian red wines. Spectrochim. Acta Part A Mol. Biomol. Spectrosc. 2019, 214, 378–383. [Google Scholar] [CrossRef] [Scilit]
  3. Tuberoso, C.I.G.; Serreli, G.; Congiu, F.; Montoro, P.; Fenu, M.A. Characterization, phenolic profile, nitrogen compounds and antioxidant activity of Carignano wines. J. Food Compos. Anal. 2017, 58, 60–68. [Google Scholar] [CrossRef] [Scilit]
  4. Petretto, G.L.; Mercenaro, L.; Urgeghe, P.P.; Fadda, C.; Valentoni, A.; Del Caro, A. Grape and wine composition in Vitis vinifera L. cv. Cannonau explored by GC-MS and sensory analysis. Foods 2021, 10, 101. [Google Scholar] [CrossRef] [Scilit]
  5. Sarais, G.; Casula, M.; Corrias, F.; Russo, M.; Pinna, B.; Argiolas, F.; Murru, M.; Angioni, A. Influence of Aging Technologies on the Volatile Profile Composition of Carignano cv Red Wines in Sardinia. Foods 2025, 14, 2290. [Google Scholar] [CrossRef] [Scilit]
  6. Fikselová, M.; Benešová, L.; Jakabová, S.; Mezey, J.; Čapla, J.; Golian, J. Chemometric Approach Application in Modern Wine Studies. Beverages 2024, 10, 84. [Google Scholar] [CrossRef] [Scilit]
  7. Khakimov, B.; Bakhytkyzy, I.; Fauhl-Hassek, C.; Engelsen, S.B. Non-volatile molecular composition and discrimination of single grape white wines of Chardonnay, Riesling, Sauvignon Blanc and Silvaner using untargeted GC-MS analysis. Food Chem. 2022, 369, 130878. [Google Scholar] [CrossRef] [Scilit]
  8. Basalekou, M.; Pappas, C.; Tarantilis, P.A.; Kallithraka, S. Wine Authenticity and Traceability with the Use of FT-IR. Beverages 2020, 6, 30. [Google Scholar] [CrossRef] [Scilit]
  9. Basalekou, M. Using IR spectroscopy as a holistic monitoring approach in winemaking: A review. OENO One 2025, 59, 7824. [Google Scholar] [CrossRef] [Scilit]
  10. Scano, P. Characterization of the medium infrared spectra of polyphenols of red and white wines by integrating FT IR and UV–Vis spectral data. LWT 2021, 147, 111604. [Google Scholar] [CrossRef] [Scilit]
  11. Dessì, A.; Murgia, A.; Agostino, R.; Pattumelli, M.G.; Schirru, A.; Scano, P.; Fanos, V.; Caboni, P. Exploring the role of different neonatal nutrition regimens during the first week of life by urinary GC-MS metabolomics. Int. J. Mol. Sci. 2016, 17, 265. [Google Scholar] [CrossRef] [Scilit]
  12. Alves, C.A.N.; Biasoto, A.C.T.C.T.; da Silva Nunes, G.; do Nascimento, H.O.; do Nascimento, R.F.; Oliveira, I.G.; de Souza Leão, P.C.; de Vasconcelos, L.B. Exploring the impact of elevated pH and short maceration on the deterioration of red wines: Physical and chemical perspectives. OENO One 2025, 59, 8111. [Google Scholar] [CrossRef] [Scilit]
  13. Vilela, A. Use of nonconventional yeasts for modulating wine acidity. Fermentation 2019, 5, 27. [Google Scholar] [CrossRef] [Scilit]
  14. Shapiro, F.; Silanikove, N. Rapid and accurate determination of malate, citrate, pyruvate and oxaloacetate by enzymatic reactions coupled to formation of a fluorochromophore: Application in colorful juices and fermentable food (yogurt, wine) analysis. Food Chem. 2011, 129, 608–613. [Google Scholar] [CrossRef] [Scilit]
  15. Heras-Roger, J.; Díaz-Romero, C.; Darias-Rosales, J.; Darias-Martín, J. Organic Acids in Varietal Red Wines: Influence of Grape Cultivar, Geographical Origin, and Aging. Beverages 2025, 11, 102. [Google Scholar] [CrossRef] [Scilit]
  16. Fu, J.; Wang, L.; Sun, J.; Ju, N.; Jin, G. Malolactic fermentation: New approaches to old problems. Microorganisms 2022, 10, 2363. [Google Scholar] [CrossRef] [Scilit] [PubMed]
  17. Collombel, I.; Campos, F.M.; Hogg, T. Changes in the composition of the lactic acid bacteria behavior and the diversity of Oenococcus oeni isolated from red wines supplemented with selected grape phenolic compounds. Fermentation 2018, 5, 1. [Google Scholar] [CrossRef] [Scilit]
  18. Prusova, B.; Humaj, J.; Sochor, J.; Baron, M. Formation, losses, preservation and recovery of aroma compounds in the winemaking process. Fermentation 2022, 8, 93. [Google Scholar] [CrossRef] [Scilit]
  19. Barbe, J.C.; De Revel, G.; Bertrand, A. Gluconic acid, its lactones, and SO2 binding phenomena in musts from botrytized grapes. J. Agric. Food Chem. 2002, 50, 6408–6412. [Google Scholar] [CrossRef] [Scilit]
  20. Peinado, R.A.; Moreno, J.J.; Ortega, J.M.; Mauricio, J.C. Effect of gluconic acid consumption during simulation of biological aging of sherry wines by a flor yeast strain on the final volatile compounds. J. Agric. Food Chem. 2003, 51, 6198–6203. [Google Scholar] [CrossRef] [Scilit]
  21. Lara-Espinoza, C.; Carvajal-Millán, E.; Balandrán-Quintana, R.; López-Franco, Y.; Rascón-Chu, A. Pectin and pectin-based composite materials: Beyond food texture. Molecules 2018, 23, 942. [Google Scholar] [CrossRef] [Scilit] [PubMed]
  22. André, M.; Lacampagne, S.; Barsacq, A.; Gontier, E.; Petrel, M.; Mercier, L.; Courot, D.; Gény-Denis, L. Physical, anatomical, and biochemical composition of skins cell walls from two grapevine cultivars (Vitis vinifera) of champagne region related to their susceptibility to Botrytis cinerea during ripening. Horticulturae 2021, 7, 413. [Google Scholar] [CrossRef] [Scilit]
  23. Agudelo-Romero, P.; Erban, A.; Rego, C.; Carbonell-Bejerano, P.; Nascimento, T.; Sousa, L.; Martínez-Zapater, J.M.; Kopka, J.; Fortes, A.M. Transcriptome and metabolome reprogramming in Vitis vinifera cv. Trincadeira berries upon infection with Botrytis cinerea. J. Exp. Bot. 2015, 66, 1769–1785. [Google Scholar] [CrossRef] [Scilit] [PubMed]
  24. Toulaki, A.; Kalompatsios, D.; Mantiniotou, M.; Athanasiadis, V.; Roufas, K.; Lalas, S.I. Multivariate Characterization of Maratheftiko Wines (2019–2024): Physicochemical, Phenolic, Antioxidant, Chromatic and Volatile Profiles. Beverages 2026, 12, 34. [Google Scholar] [CrossRef] [Scilit]
  25. Gracia-Moreno, E.; Lopez, R.; Ferreira, V. Quantitative determination of five hydroxy acids, precursors of relevant wine aroma compounds in wine and other alcoholic beverages. Anal. Bioanal. Chem. 2015, 407, 7925–7934. [Google Scholar] [CrossRef] [Scilit] [PubMed]
  26. Watson, F.T.; Nilsson, M.; Herderich, M.; Torres, A.; Price, W.S.; Morris, G.A. Identification and quantitative measurement of pyroglutamic acid in 1H NMR spectra of wine. Food Res. Int. 2025, 209, 116247. [Google Scholar] [CrossRef] [Scilit]
Figure 1. PCA scores and loadings biplot in the first and third components (explained variance in brackets) of GC-MS data for Carignano (red circles) and Cannonau (blue circles) wines (3 components, R2Xcum = 0.49, Q2cum = 0.14). Acetic acid (AcetA); arabinitol (Ara-ol); butanediol (But-2,3); butanetriol (3-OH-But); citramalic acid (CitMalA); citric acid (CitrA); ethyl tartaric acid (Eth-Tart); ethyl-phosphonic acid (Eth-PhA); ethyl-succinic acid (Eth-Succ); galacturonic acid (GalactA); gallic acid (GallicA); gluconic acid (GlucA); glucose (Glucose); glyceric acid (GlyA); hydroxy-butanoic acid (4OH-ButA); hydroxy-propanoic acid (3OH-PrA); malic acid (MalicA); monopalmitin (MonoPalm); monostearin (MonoSt); oxo-proline (PyrogA); palmitic acid (PalmA); pentanedioic acid (PentA); stearic acid (StA); succinic acid (SuccA); tartaric acid (TartA); trihydroxybutyric acid (3OH-ButA).
Beverages 12 00059 g001
Table 1. Details of wine samples.
nWineCommercial NameWinery
4CannonauBaioneCantine Trexenta
4CannonauLillove’Gabbas
4CannonauMamuthoneSedilesu
4CannonauNepenteGostolai
4CarignanoBuioMesa
4CarignanoGiba6Mura
4CarignanoGrotta RossaSantadi
4CarignanoIs solusSardus pater
Table 2. Descriptive statistics and mean comparison of the FT-IR physico-chemical parameters of Cannonau and Carignano wines.
NameAbbr.Cannonau (n = 16)Carignano (n = 16)p
MeanSDCV%MeanSDCV%
Ethanol (vol%)EtOH13.11.31012.60.64
Glucose+fructose (g/L)Gluc/Fruct1.41.3922.11.677
pH 3.70.133.80.13
Density (g/mL)Dens0.9930.00100.9940.0010***
Fructose (g/L)Fruct0.90.4471.30.970
Glucose (g/L)Gluc1.30.4302.50.625***
Total acidity (g/L)Tot-Ac4.40.6134.80.510
Volatile acidity (g/L)Vol-Ac0.620.07120.580.1424
Malic acid (g/L)MalA0.20.2970.30.136**
Lactic acid (g/L)LactA1.00.7691.60.848**
OD 420 (a.u.) 2.10.6272.70.518***
OD 520 (a.u.) 2.30.7323.00.518***
OD 620 (a.u.) 0.50.2440.70.222***
Color intensity (a.u.)C-int4.91.5306.41.118***
Color tonality (a.u.)Tone0.90.2170.90.15
Phenols (abs 280 nm, a.u.) 59.04.41056.910.919
p = Welch test; *** p < 0.001; ** p < 0.01.
Table 3. OPLS-DA a discriminant GC-MS metabolites between Carignano and Cannonau wines.
CarignanoCannonau
Compound VIP bpCompound VIPp
Gluconic acid1.920.012,3-butanediol1.590.01
Arabitol1.700.01Ethyltartate1.400.01
Stearic acid1.100.05Gallic acid1.190.05
1,2,3-butanetriol1.080.05Citramalic acid1.040.05
Galacturonic acid1.050.05
a Components = 1 + 3, R2Y = 0.98, Q2Y = 0.92, p < 0.0001; b VIP, variable importance in the projection; only identified metabolites having VIP values > 1 are reported.
Table 4. GC-MS metabolites showing the strongest positive and negative correlations with each FT-IR physico-chemical parameter, as determined by OPLS analysis (parameters of model quality in Table S4).
FT-IR ParametersGC-MS MetabolitesVIP
Positively CorrelatedVIP aNegatively Correlated
EthanolButanediol1.183-OH propanoic acid2.80
Ethylsuccininc acid1.08Tartaric acid1.46
Galacturonic acid1.13
Volatile acidityPyroglutamic acid2.15Succinic acid1.25
Glucose1.79
Galacturonic acid1.57
Malic acidMalic acid1.89Ethyl-tartaric acid1.73
Citric acid1.123-OH propanoic acid1.54
Glucose1.06Gallic acid1.52
Lactic acidEthyl-phosphoric acid1.69Butanediol1.92
3-OH propanoic acid1.61Ethyl-tartaric acid1.43
4OH-ButanoicA1.57
Galacturonic acid1.47
pHSuccinic acid1.18Ethyl-tartaric acid3.36
Glyceric acid1.08Gallic acid2.08
Gluconic acid1.13
FructoseMalic acid2.35Ethyl-succinic acid1.07
Glucose1.58
Citric acid1.57
GlucoseGluconic acid1.82Butanediol1.48
Arabitol1.65Gallic acid1.04
Citric acid1.47
Glucose–fructoseMalicA1.933-OH propanoic acid1.84
Glucose1.27Ethyl-tartaric acid1.18
Phenols (OD 280 nm)Butanediol1.664OH-butanoic acid1.91
Monopalmitin1.21Tartaric acid1.29
3-OH propanoic acid1.23
a VIP, variable importance in the projection; only identified metabolites having VIP values > 1 are reported.
Disclaimer/Publisher’s Note: The statements, opinions and data contained in all publications are solely those of the individual author(s) and contributor(s) and not of MDPI and/or the editor(s). MDPI and/or the editor(s) disclaim responsibility for any injury to people or property resulting from any ideas, methods, instructions or products referred to in the content.