Article

Chemical and Sensory Attributes of Different Ethanol Reduction Methods in Muscadine Wine Production

by
Alexandra A. Escalera
1,
Patricia C. Patricio Morillo
1,
Drew Budner
2,
Katherine A. Thompson-Witrick
1 and
Andrew J. MacIntosh
1,*
1
Department of Food Science and Human Nutrition, University of Florida, Gainesville, FL 32601, USA
2
Department of Chemistry, Coastal Carolina University, Conway, SC 29528, USA
*
Author to whom correspondence should be addressed.
Beverages 2025, 11(5), 146; https://doi.org/10.3390/beverages11050146
Submission received: 14 August 2025 / Revised: 15 September 2025 / Accepted: 30 September 2025 / Published: 9 October 2025

Abstract

There has been a recent shift in the global wine market towards reduced-alcohol wines. Muscadine grapes (Vitis rotundifolia) have become a popular choice in many emerging markets; however, their suitability in reduced-alcohol wine production has not been extensively tested. In this study, methods to reduce ethanol in muscadine wine were compared to determine differences in chemical and sensory attributes and consumer preference. The methods evaluated included full fermentation time with Saccharomyces cerevisiae (control), reduced fermentation time with Saccharomyces cerevisiae (stopped fermentation), fermentation with Saccharomycodes ludwigii yeast (instead of Saccharomyces cerevisiae), and vacuum distillation. The control and distilled wines were fermented for 121 h, Saccharomycodes ludwigii for 45 h, and the stopped fermentation wine for 3 h. Yeast and sugar levels were monitored throughout the fermentation processes using brix measurements and yeast counts. After the fermentation, the color, pH, volatiles, and titratable acidity (TA) were measured. The results showed that Saccharomycodes ludwigii fermented more slowly than Saccharomyces cerevisiae, and that both the stopped fermentation and Saccharomycodes ludwigii wines had lower titratable acidity with a more intense color. The total concentration of volatile compounds for the Saccharomycodes ludwigii wine and the stopped wine were lower than for the distilled and control wines. A consumer panel (n = 92) judged the wine samples on chemical qualities and overall preference. The distilled wine was perceived as more alcoholic compared to the other reduced-alcohol wines. The results showed that the stopped fermentation and Saccharomycodes ludwigii wines were preferred by consumers over the control and vacuum-distilled wines.

Graphical Abstract

1. Introduction

The global non-alcoholic wine market was valued at nearly USD 1.5 billion in 2022 [1] and is predicted to grow at ~20% CAGR between 2022 and 2028, according to one wine report [2]. There are several reasons why Florida wineries may wish to produce reduced-alcohol options, from appealing to new (often younger) consumers, to marketing the reported health benefits of wine in a novel product, to simply facilitating consuming more product. The Alcohol and Tobacco TTB (Tax and Trade Bureau) classifies low-alcohol wine as wine below 7% alcohol by volume and non-alcoholic wine as wine below 0.5% alcohol by volume [3]. There are numerous techniques to reduce ethanol in beverages, and each is known to influence both the physiochemical and organoleptic properties of wine. The traditional process to reduce alcohol content in wine is to remove the alcohol via distillation; however, this can dramatically reduce the quality of the product. Advances in vacuum distillation have created new avenues that may mitigate some of these changes [4]. Another method to create a low-alcohol product is to add yeast, but not allow the fermentation to progress, by stopping the fermentation through filtration or temperature reduction. As this method typically results in a product that is very similar to the original substrate, raw materials are often selected that have lower sugar levels and high volatile concentrations (such as muscadine grapes). In the brewing industry, the wort can be diluted to acceptable sugar levels before hops are used to add volatile compounds. Another NA method is using yeast that cannot ferment the sugars in the substrate; this can be wild or genetically modified yeast. In fermentation, 1 °Brix has the potential to convert to 0.56% alcohol in solution [5] (volume), but that could vary depending on the yeast strain used, fermentation parameters, acid production, and the sugars present. There have been numerous studies examining non-Saccharomyces yeast fermentations [6,7,8]. Some of these strains have become commonly used and commercially available, including Saccharomycodes ludwigii. This yeast has been previously studied to produce low- and non-alcoholic beer [8]. All mentioned fermentation methods are currently employed in the brewing industry in products such as Sam Adam’s “Just the Haze” and Heineken® “0.0”. Product successes such as these have helped drive the dramatic growth in the non-alcoholic beer and wine market.
Muscadine grapes and juice traditionally have a lower sugar content, at 14–20 °Brix [9], than Vitis vinifera grapes and juice, which traditionally have a sugar content of 22–28 °Brix Muscadine grapes have a high pigment and polyphenol content as well [9], which could impact the progression of wine fermentation when using this grape variety. Muscadine wine fermentation has a variety of organic acid interactions that change significantly from grape to grape. Most of the cultivars of muscadine grapes increase the titratable acidity throughout fermentation, but certain cultivars like Carlos and Scuppernog varieties have the tendency to do the opposite [10]). Alcohol reduction methods for wine fermentation using these grapes could produce unexpected acidity and pH results.
While there have been many papers examining different methods to create non-alcoholic (NA) wine [11,12], there have been fewer published studies directly comparing the results of these processes. This project holistically assessed common processes to reduce the ethanol content using Florida-grown muscadine grapes to produce muscadine wine. Muscadine juice typically contains less sugar than Vitis vinifera. The goal of this study was to quantify the differences in alcohol-reducing processes as options for commercial wine producers. The processes evaluated included stopped fermentation using Saccharomyces cerevisiae yeast, fermentation with non-Saccharomyces cerevisiae yeast (Saccharomycodes ludwigii), and vacuum distillation. These were compared against a control (fully alcoholic) wine that was fermented with Saccharomyces cerevisiae. The chemical and sensory properties of the wines were evaluated.

2. Materials and Methods

A blend of frozen UF-grown muscadine grapes (Citra, Florida) of both bronze and black cultivars were thawed and pressed with a 25 L bladder press (Enoagricola Rossi (Calzolaro (PG), Italy) to obtain 28.82 kg of 16 °Brix juice with a pH of 3.22 and a TA of 8.0 g/L as tartaric acid. The skins were separated after pressing. All fermentations were performed at the University of Florida—Food Science and Human Nutrition Pilot Plant. Each of the four fermentation methods were performed in triplicate. All samples were frozen and stored on site (stored in food grade buckets for a maximum of three weeks) until the consumer panel testing at the University of Florida Sensory Laboratory.

2.1. Wine Fermentation

2.1.1. Control Wine (Saccharomyces cerevisiae Yeast)

Dry Saccharomyces cerevisiae yeast (Lalvin EC-1118) was purchased from Lallemand (Lallemand Inc. Montreal, QC, Canada). In total, 25 g of dry yeast was rehydrated in 250 mL of water and agitated for 3 h. Yeast counts were carried out using a hemocytometer to determine the concentration of the yeast in the slurry via both a viability count with a methylene blue dilution and an overall count with an ethylenediaminetetraacetic acid (EDTA) dilution. A total of 6 L of muscadine juice was inoculated with yeast slurry until a concentration of 2.35 × 10⁷ cells/mL was reached, then split between 3 vessels equipped with a fermentation water lock and a sealed siphon tube. At hour 121, the wine was removed from the vessel and frozen. The wine was thawed before being filtered using a pad filter, after which the wine was frozen again for preservation until 2 days prior to the consumer panel, when it was thawed and bottled in autoclaved wine bottles and stored at 4 °C until being served in the consumer panel.

2.1.2. Sampling

Samples from all Saccharomyces cerevisiae fermenting wines were taken at 0, 22, 46, 70, 94, and 121 h (unless completed) and from the non-Saccharomyces wine at 0, 22, and 45 h. Each sample had a yeast count performed (using a hemocytometer (Neubauer Erzhausen, Germany)) before vacuum filtering with a Buchner funnel and Whatman filter paper (2.5-micron pore size) (Whatman, Maidstone, Kent, UK). The filtered samples then had Brix measurements performed, and the final samples of each wine (after 3 h for the stopped fermentation wine, 45 h for the non-Saccharomyces wine, and 121 h for the control and vacuum-distilled wines) were assessed for color, pH, titratable acidity (TA), and volatile compounds. These final wines were also evaluated by a consumer panel.

2.1.3. Distilled Wine

The distilled wine was fermented using the same method as the control wine from the same must and yeast slurry; however, after fermentation, the alcohol was removed using a rotary evaporator (Buchi Rotovapor® R-220 SE, Flawil, Switzerland), following the method of ASBC Beer-4 [13]. After this was carried out, distilled water was added to the concentrate to return the wine to the original mass. The collected distillate was distilled a second time in the same manner to fractionate the highly volatile flavor compounds. The alcohol content of this condensate was measured, and a small amount was reintroduced to the wine to bring the final wine alcohol concentration to 0.5% ABV while also reintroducing many of the removed highly volatile flavor compounds. The same analyses were performed on the distilled wine after fermentation as the control wine.

2.1.4. Stopped Fermentation

The stopped fermentation wine was prepared following the same procedure as the control from the same must and yeast slurry, but the fermentation was stopped (through freezing and filtration) at 3 h instead of 121 h due to ethanol production. This is based on preliminary studies where the alcohol content reached 0.5% ABV at approximately 3 h under the conditions described in the study. The same analyses were performed on the stopped fermentation wine as the control wine.

2.1.5. Non-Saccharomyces cerevisiae Yeast Wine

Non-Saccharomyces yeast fermentation was conducted in the same manner as the control, except that the yeast used was Saccharomycodes ludwigii from White Labs (San Diego, CA, USA). This yeast was pitched at a concentration of 1.55 × 10⁶ cells/mL, as recommended by the manufacturer. The wine was removed from the fermentation vessel at T45 due to apparent cessation of fermentation and ethanol production. The same analyses were performed on the non-Saccharomyces wine as the control wine.

2.2. Chemical Analysis

2.2.1. Brix Analysis

The approximate sugar content (apparent Brix) of the must and fermenting wines was measured using a DMA 35 Anton Paar Densitometer (Graz, Austria). The alcohol content was then calculated from the difference between the initial Brix and apparent Brix of the sample using the equation from [14], as shown below:
Alcohol(w/w) = 0.4267 × (Brix Initial − Brix Current)
where 0.4267 is a variable dependent upon initial Brix [14].

2.2.2. Titrable Acidity (TA)/pH Analysis

The pH of each sample measured was taken with a pH meter, and the TA was measured by mixing 5 mL of wine with 50 mL of DI water, which was then titrated to the end point of 8.2 with 0.1 M aqueous NaOH. Equation (2) was then used to determine the equivalent g as tartaric acid in each sample [15]:
TA (g tartaric acid/L) = ((N NaOH) × (mLs NaOH) × 75))/mL of sample

2.2.3. Color Analysis

A spectrophotometer was used to determine the absorbance values of each wine at the wavelengths of 420, 520, and 620 nm. The color hue and color intensity were then calculated using the following equations [16,17]:
Wine Hue = A420/A520
Wine Color Intensity = A420 + A520 + A620

2.3. Gas Chromatography Analysis

2.3.1. Extraction of Volatile and Semi-Volatile Compounds

Solid-phase microextraction (SPME) was used for the extraction of the volatile and semi-volatile compounds in the wines. The extraction was performed after thawing as to be identical to the wine served to the consumer panel. A 50/30 um Divinylbenzene/Carboxen/Polydimethylsiloxane (DVB/Carboxen/PDMS) fiber (Supelco, Inc., Bellefonte, PA, USA) was exposed to the headspace above 10 mL of the sample wine spiked with 50 µL (20 mg/L) of the internal standard (200 mg/L 2-heptanol and 100 mg/L guaiacol in ethanol). The volatile compounds were separated using a DB-5 column installed on a Shimadzu gas chromatograph (GC) 2010 Plus Series mass selective detector (MSD) QP2010 SE (Shimadzu, Columbia, MD, USA). A full description of the method used for the identification and separation of the method was previously described by Budner et al. (2021) [18].

2.3.2. Compound Response

The GC-MS peak area of each identified compound was normalized against the peak area of the internal standard 2-heptanol and 2-guaiacol in each chromatogram. This relative response was compiled for each compound and used in statistical analysis as described in greater detail by Thompson-Witrick et al. [19].

2.4. Fermentation Statistics

Statistical analyses were conducted using JMP Pro v. 18 (JMP Inc., Cary, NC, USA). Statistical calculations were completed using one-way analysis of variance (ANOVA) with α = 0.05. Samples were analyzed in triplicate (n = 3). GraphPad Prism 10.4.2 (GraphPad, San Diego, CA, USA) software was used to create the Brix, alcohol, and fermentation curve graphs following the ASBC Yeast-14 method [20]. This method is commonly used to model, predict, and monitor industrial fermentations [21,22,23]. Prism software was also used to complete one-way ANOVA tests with multiple comparisons with α = 0.05 to determine statistical significance for the pH, TA, color hue, and color intensity data.

2.5. Consumer Panel and Analysis

A total of 92 people participated in a consumer panel comparing the control wine, distilled wine, stopped wine, and non-Saccharomyces wine. This consumer panel was approved by the University of Florida’s Institutional Review Board (IRB—IRB202401343). The individuals that participated in this panel were from the University of Florida and the surrounding Gainesville Community. Panelists were screened for age (21 or older), sulfite allergies, and medical conditions that could be affected by alcohol, and those who passed the prescreening participated in the consumer panel.
The sensory qualities of the wines were analyzed by having the panelists answer questions that came up on a screen. A total of one 10–15 min session took place over the course of one day in April 2025. Samples were given to the panelists in a random order. The sensory evaluation was conducted in the Sensory Laboratory at the University of Florida (Gainesville, FL, USA). The Sensory Laboratory is equipped with 18 identical booths, each with their own computer and vertical-sliding door which allows for samples to be passed through to the panelists. Samples were assigned randomized three-digit codes generated by Compusense20, using different codes for replicate samples. The samples were presented in a randomized order as designed by the software panel questionnaire (randomized complete block with replication design).
Panelists were instructed to look at the first sample and rate the appearance and aroma of the sample. Panelists were asked to evaluate the sample based upon a 9-point hedonic scale (1 = dislike extremely, 9 = like extremely). They then were instructed to cleanse their palate with a bite of a saltine cracker and a sip of water. They were then instructed to taste the first sample and rank their overall liking and flavor liking on the same 9-point hedonic scale. They were then asked to rank the alcohol flavor intensity and sourness flavor intensity in the sample, both based upon a 100-point scale (0 = lowest intensity, 100 = highest intensity), each followed by a respective question about alcohol and sourness liking on a 9-point hedonic scale. These questions were asked for all the samples, followed by a question asking them to rank the samples (1 = least preferred, 4 = most preferred). Their ratings of these attributes were recorded and statically compared using the software Compusense20 (Guelph, ON, Canada). The study was conducted in accordance with the Declaration of Helsinki, and the protocol was approved by the University of Florida IRB (IRB—IRB202401343) on 4 December 2024.

2.6. Study Limitations

Some limitations of this study include a consumer panel comprising individuals from the University of Florida. The results could be affected due to panelists’ potential familiarity with muscadine wines. Furthermore, although all the wines were treated identically, they were subjected to a freeze/thaw cycle, unlike commercial wines. While this was deemed necessary to prevent potential contamination before the consumer panel, it may have impacted aspects of the product.

3. Results

3.1. Wine Properties

The chemical properties of all final wines are shown in Table 1. The pH levels were similar, as they all ranged from 3.17 to 3.24, but the titratable acidity varied greatly between the wines. The titratable acidity in the controlled and distilled wines was likely found to be higher than the others tested because Saccharomyces cerevisiae is known to produce malic acid during fermentation in wine [24]. The stopped fermentation wine had a similar titratable acidity to that of the juice due to the fermentation time being only 3 h, which was seemingly insufficient to allow any additional acids to be produced in the wine. The non-Saccharomyces wine did not statistically change in titratable acidity from the juice, potentially due to the yeast producing a larger amount of volatile acid (e.g., acetic acid), which could have been further metabolized into esters, or volatilized with the CO2 evolution during fermentation [18].
The color hue of the juice changed for all the wines. These changes were likely not due to changes in pH as this changed very little. The hue of the stopped fermentation was found to have changed the least during its short fermentation time, followed by the non-Saccharomyces wine, and then the control and vacuum-distilled wines. Color hue and intensity changes throughout wine fermentation are typically similar for Saccharomyces cerevisiae and Saccharomycodes ludwigii [18]. In this case, the Saccharomycodes ludwigii may have had a smaller change due to its shorter fermentation time. The color intensity was highest in the stopped fermentation and the non-Saccharomyces compared to the control and distilled fermentation wines. This may be due to reduced anthocyanin degradation, which begins immediately during fermentation but becomes more pronounced as fermentation progresses [25].
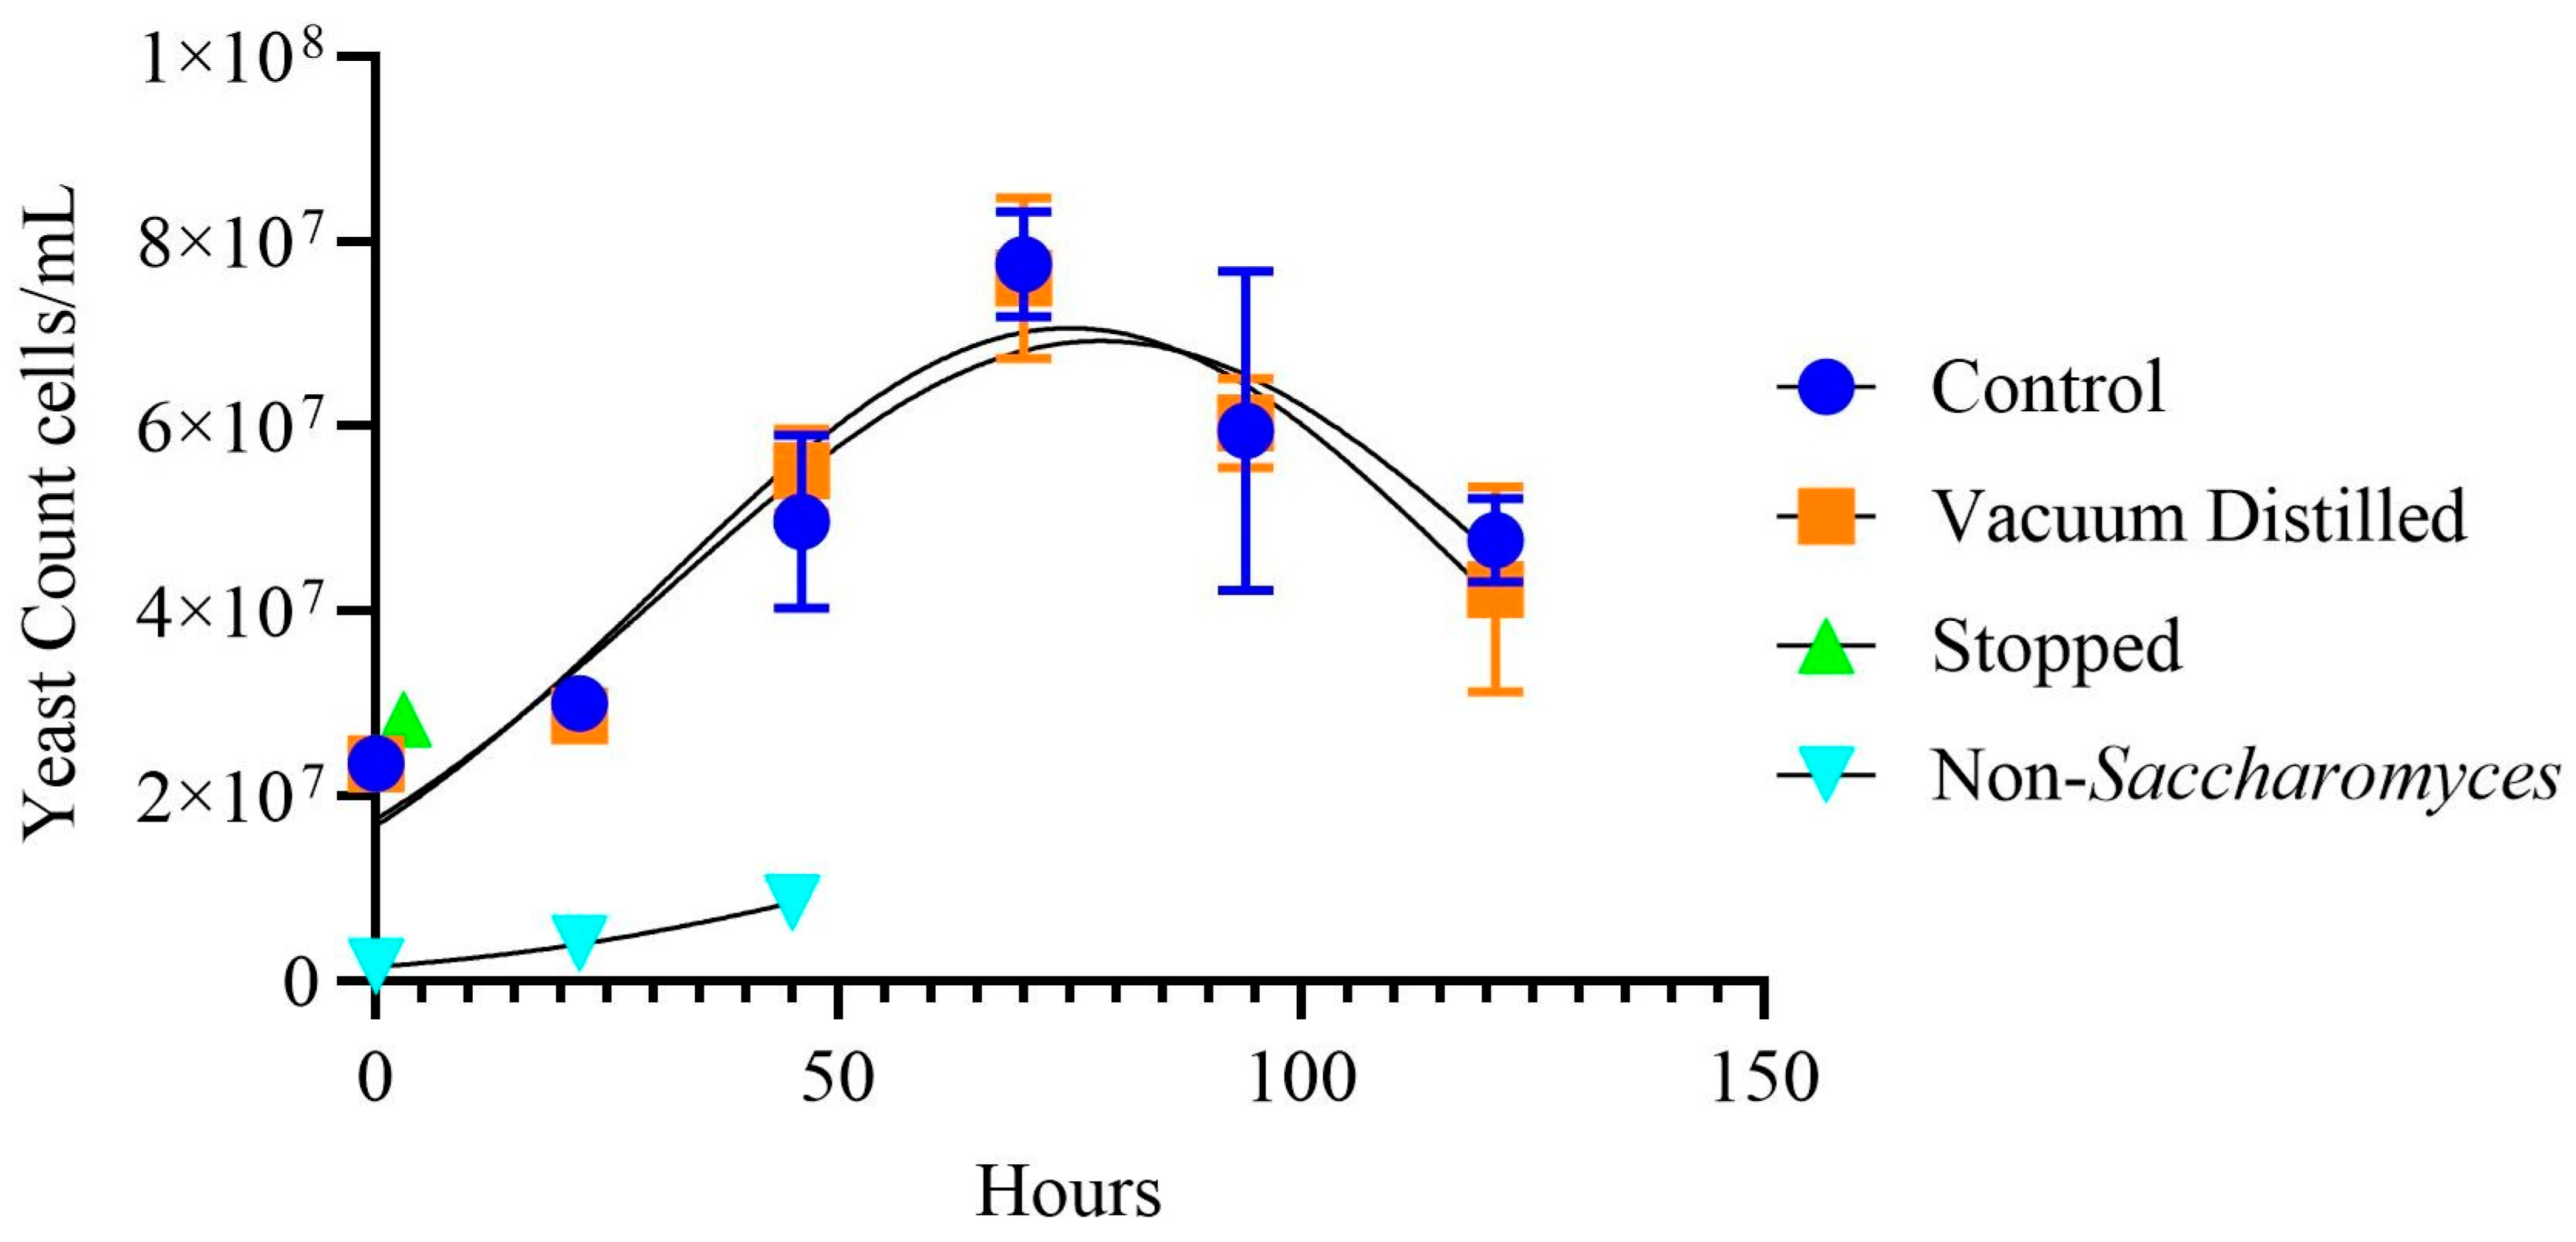
The change in Brix seen in Figure 1 shows the change in density as sugars were converted into alcohol for each wine fermentation. The flatter slope exhibited by the non-Saccharomyces strain, Saccharomycodes ludwigii, shows that it took longer for the non-Saccharomyces strain of yeast to ferment the sugars, resulting in a lower level of alcohol. This was consistent with the alcohol curve in Figure 2 and how Saccharomycodes ludwigii is reported to ferment [26]. The yeast growth curve in Figure 3 shows the lack of significant difference between the control wine and the distilled wine fermentations, and it mirrors the slower fermentation of the Saccharomycodes ludwigii yeast. It reflects the slower growth of Saccharomycodes ludwigii, which did not replicate as quickly as Saccharomyces cerevisiae.
There were significant differences in the volatile profiles of each of the four wines, as shown in Table 2, resulting in all four wines having a unique odor from each other. The volatile profile of each wine contained compounds similar to other fruit-based alcoholic beverages [27,28]. The differences show that the four methods of wine production will produce different results, and wine makers must take this into consideration when deciding which method to use. These findings build upon previous works [6,7] where researchers explored the effects of non-traditional yeast and found differences in the acid and volatile profiles. Conversely, the vacuum-distilled wine had a volatile profile closest to the control of the tested methods; this is likely why this method is the most commonly employed in the brewing industry. During sensory evaluation, these two methods were ranked very closely for nearly all attributes, except appearance (See Figure A1). The stopped fermentation notably contained more volatile compounds than the juice, despite only undergoing three hours of fermentation. These volatiles were likely carried into the wine fermentation from the pitch slurry in addition to being produced in the three hours of fermentation time. The non-Saccharomyces wine had very few of the volatiles associated with fermentation and was closest to the stopped fermentation. This difference was likely due to the low recommended pitch rate employed; a higher pitch rate may have increased the volatiles produced.

3.2. Consumer Panel Results

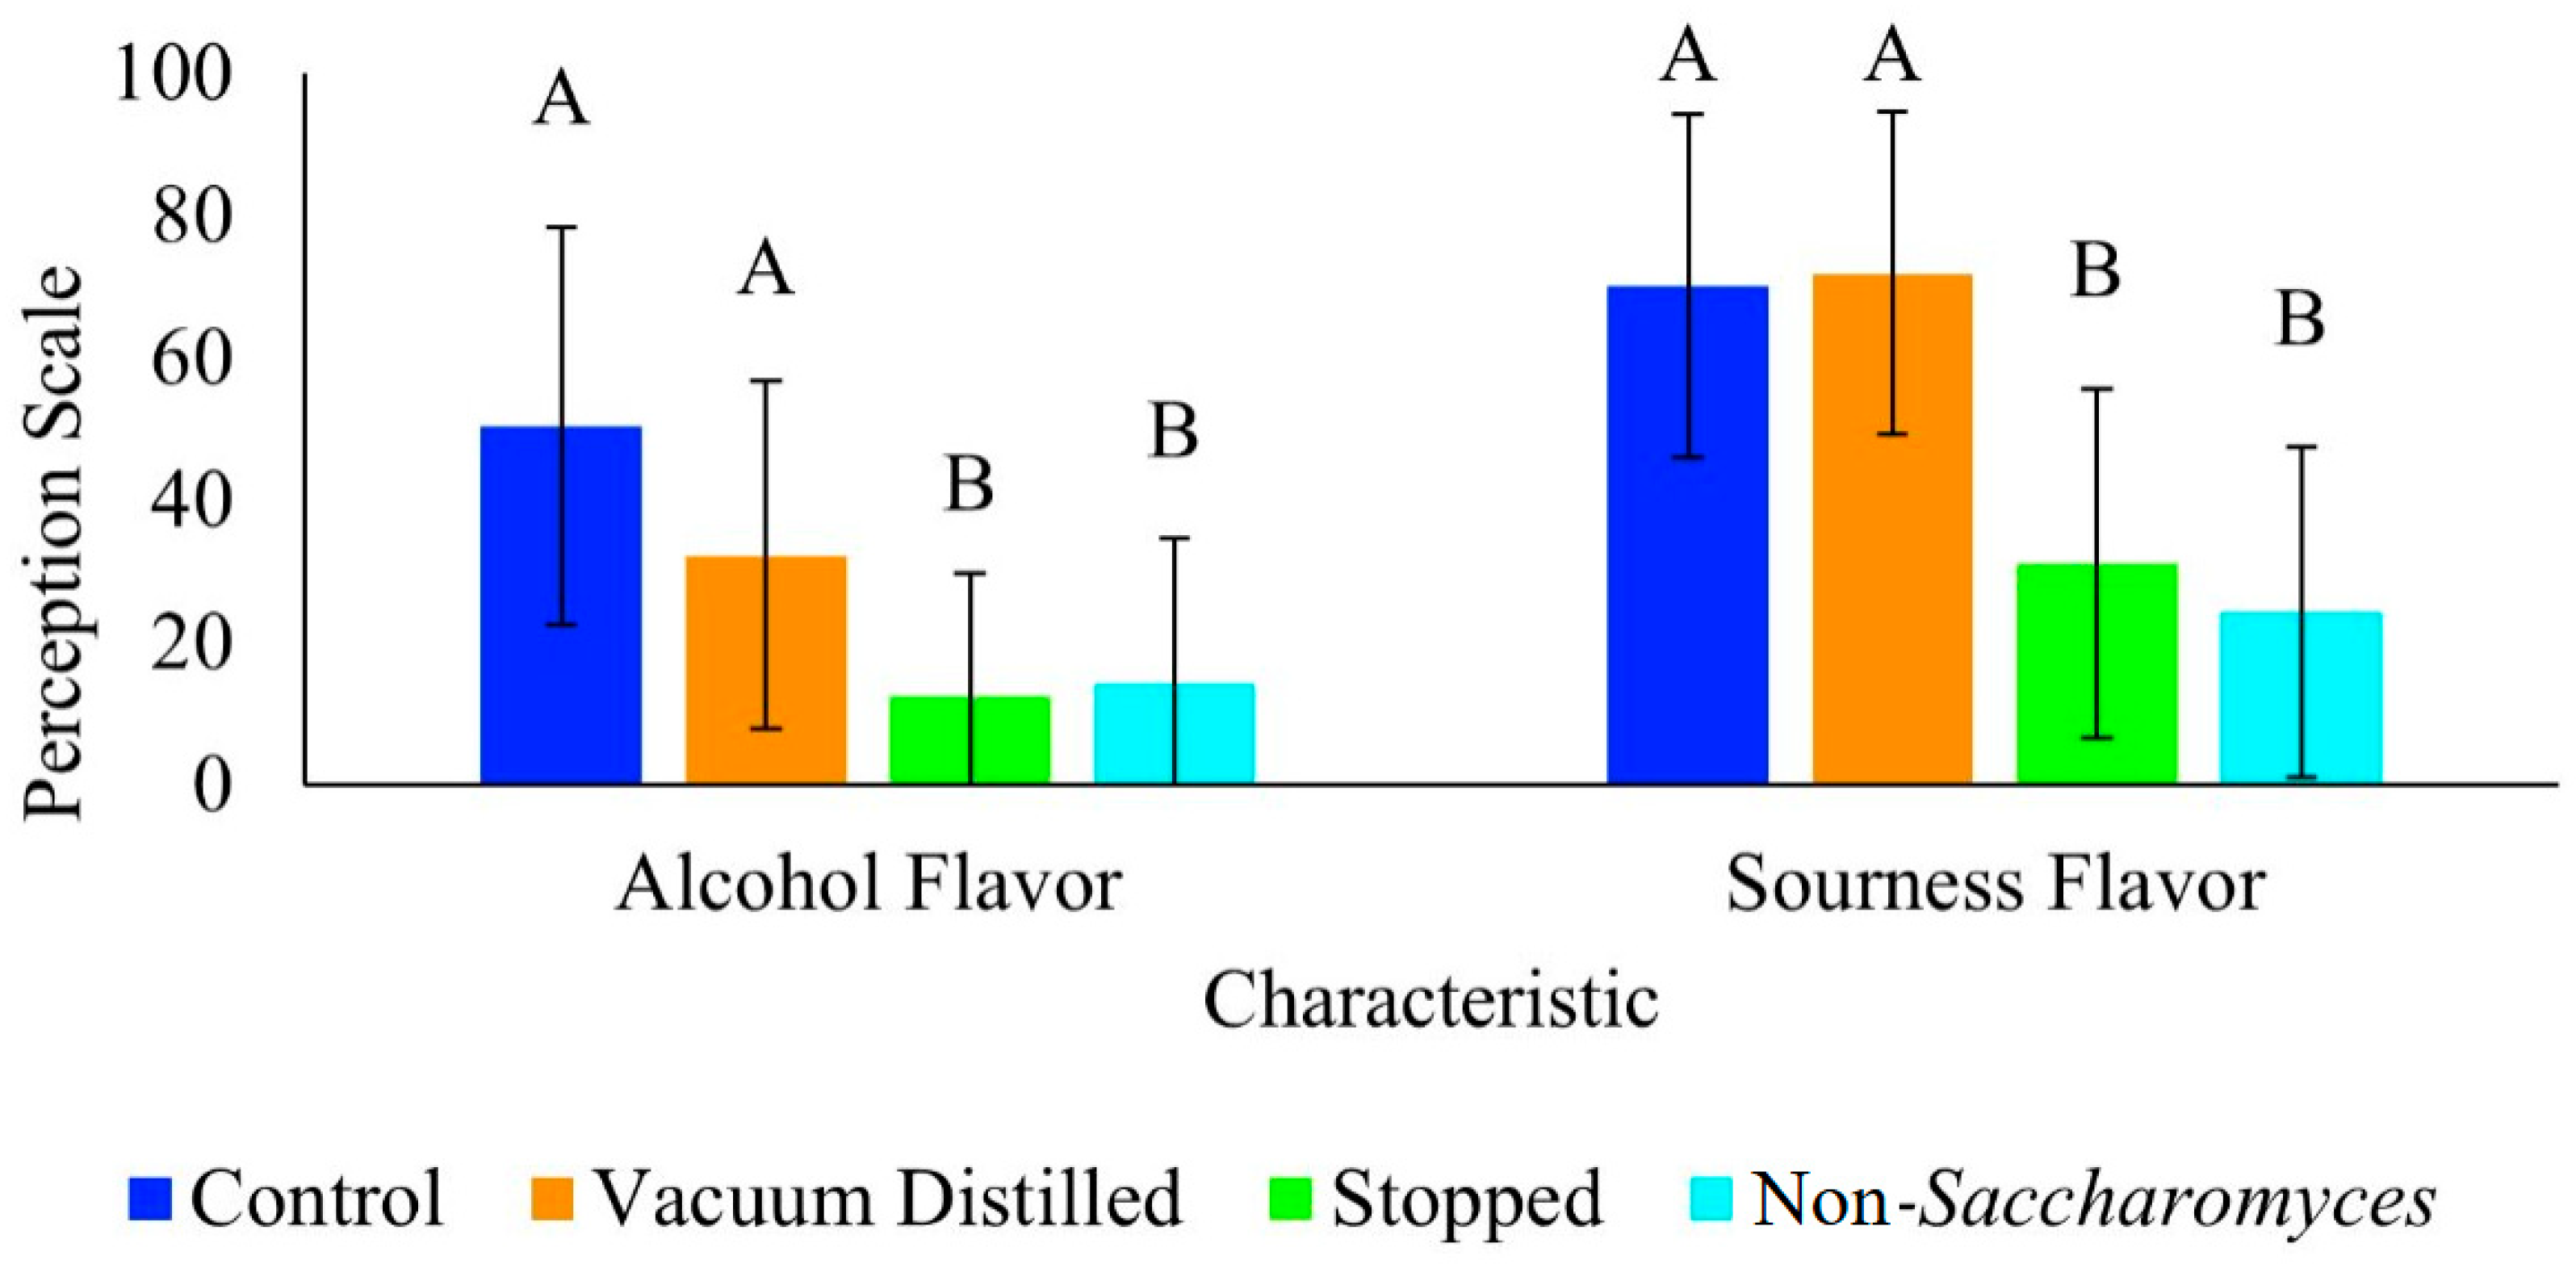
The control and vacuum-distilled wines were perceived similarly in all sensory questions despite the control having a high alcohol content and the vacuum-distilled wines having only 0.5% w/w (Figure 4 and Figure 5). The same can be seen between the wine produced via stopped fermentation and that from the non-Saccharomyces yeast for all categories except for aroma and appearance. Between these groups, however, there was a significant difference in both alcohol flavor perception and sourness perception, with a greater alcohol flavor in the control/distilled group compared to the stopped and non-Saccharomyces fermentation (Figure 4). This shows that panelists identified a significantly greater amount of both alcohol flavor and sourness in the control and vacuum-distilled wines. The greater perception of alcohol flavor in the control and vacuum-distilled wines could be due to the volatiles of the distilled wine being very similar to the volatiles of the control wine. The volatiles produced, shown in Table 2, were those produced through fermentation. By distilling out the volatiles and adding the same ones back in, the flavor composition was kept the same as the control wine.
With regards to the sourness flavor perception, the non-Saccharomyces yeast could have been perceived to have a lower sourness flavor due to having changed the acid composition in the juice. The controlled and distilled wines have a higher perceived sourness, possibly due to the lack of sugar in the final wine [32]. Table 1 does show that the controlled and distilled wines have the highest TA, although they all have similar pH levels, potentially due to differences in fermentation producing different types of acids [18].
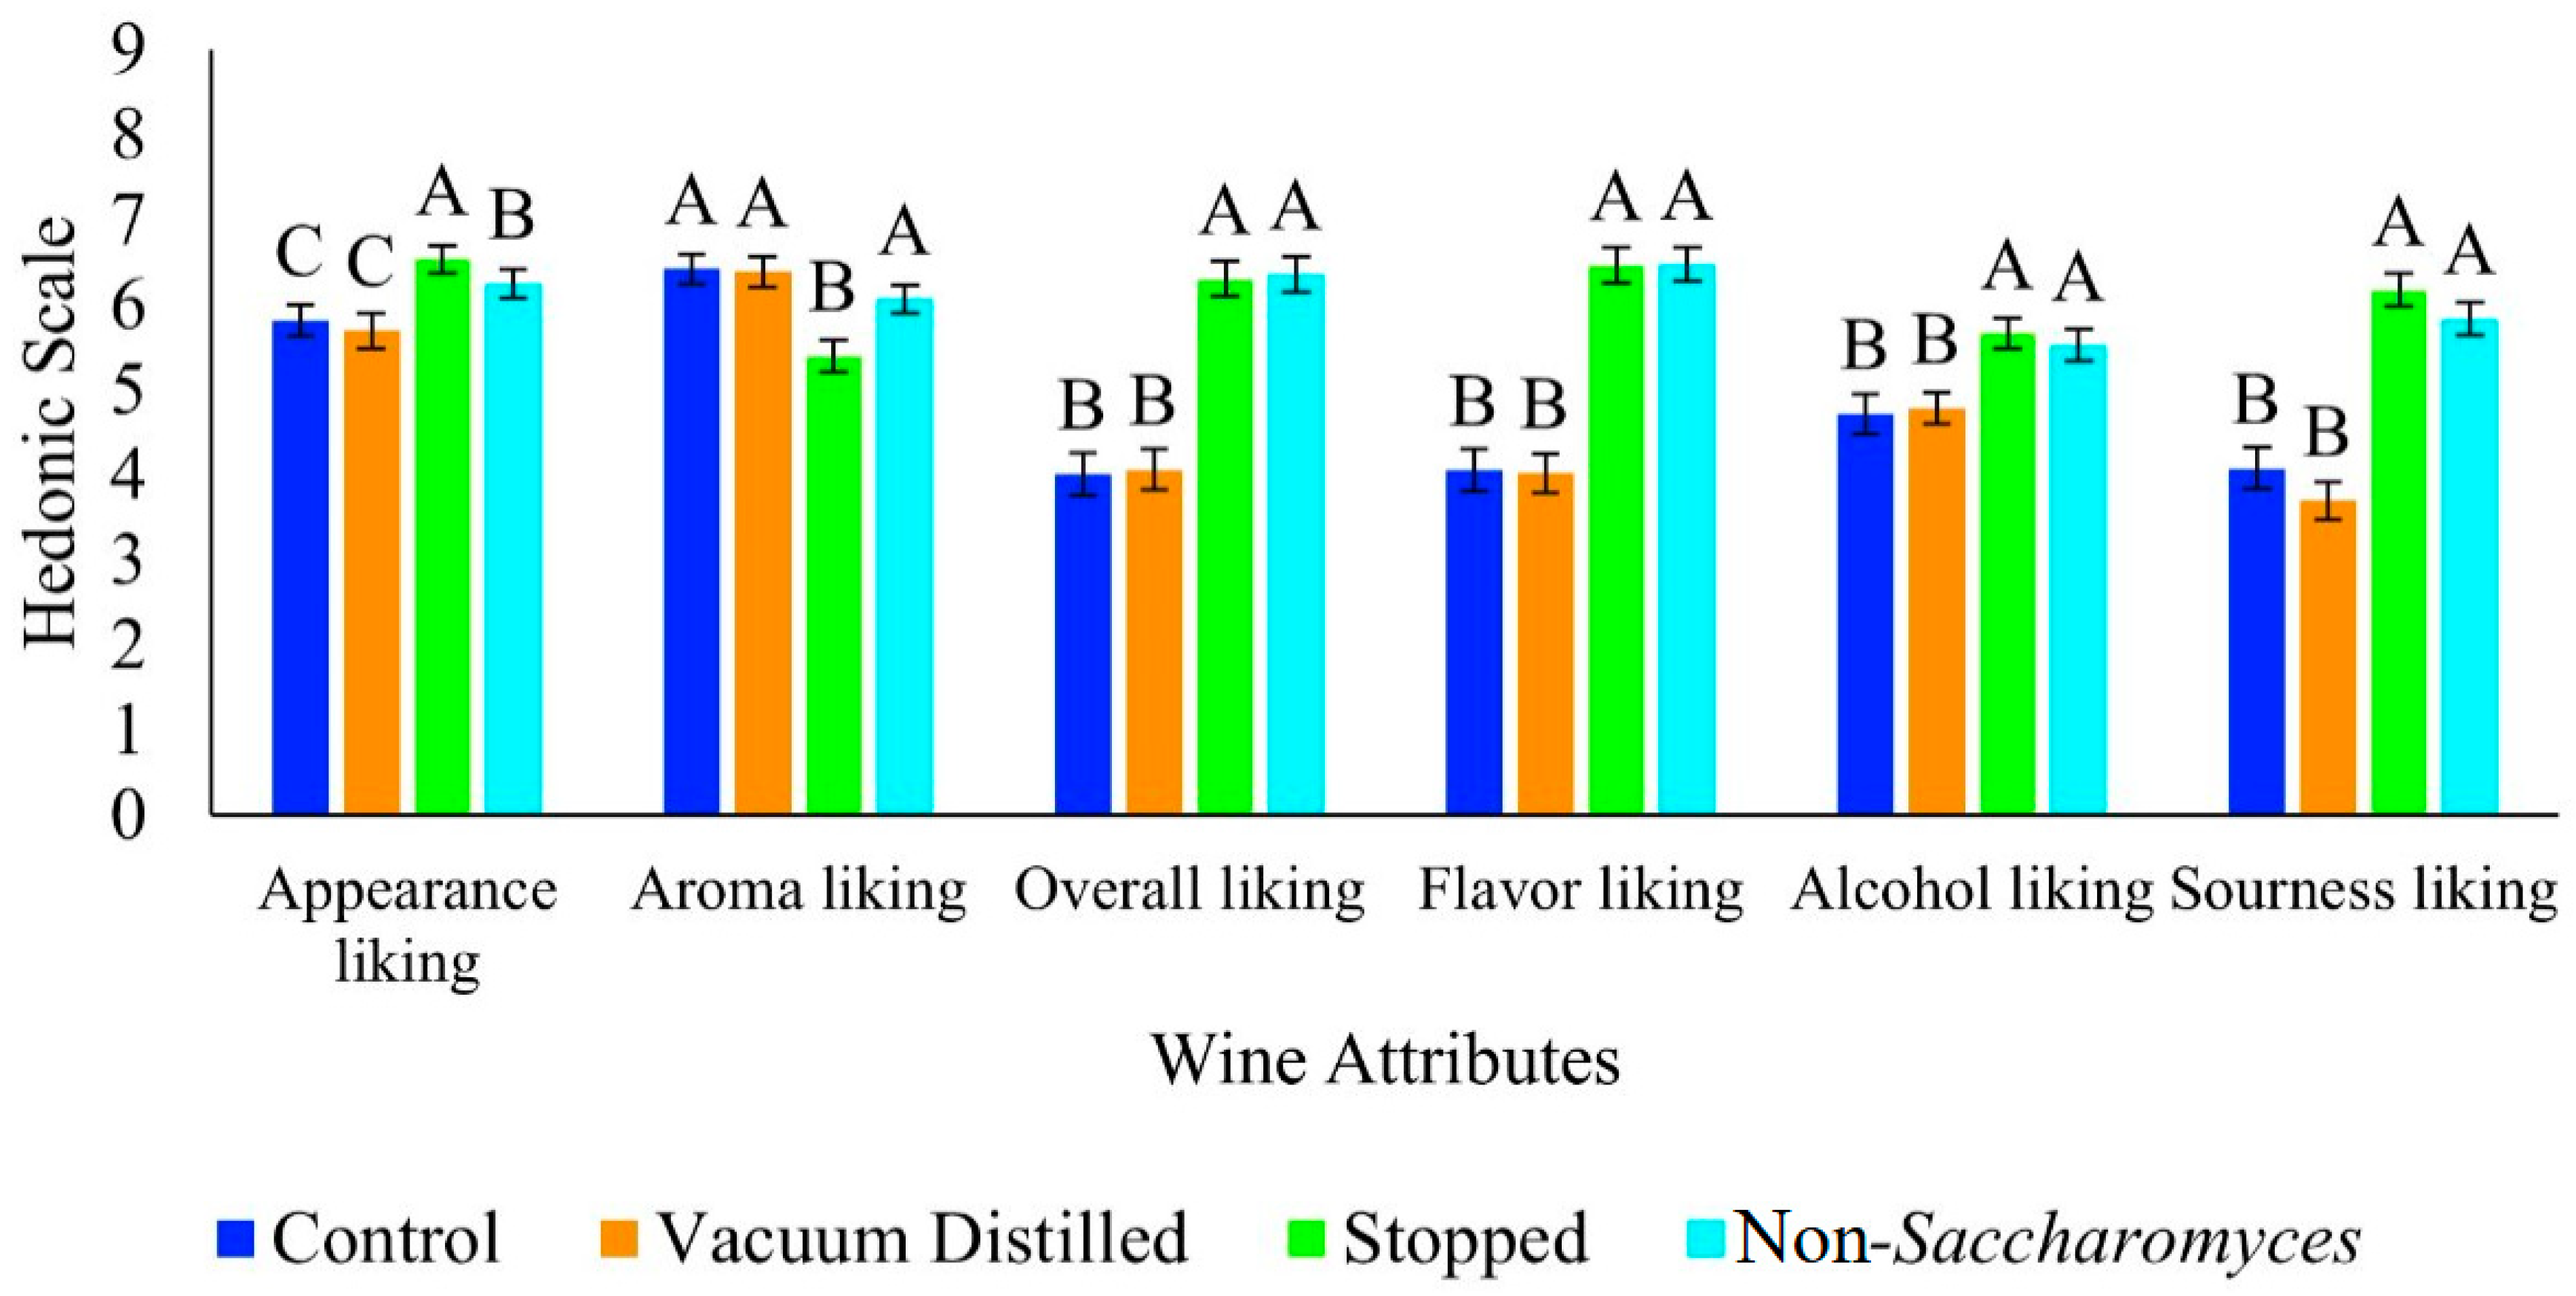
The attributes of each wine were assessed on the 9-point hedonic scale and are shown in Figure 5. The lack of significant difference between the control wine and the distilled wine shows that the two were liked the same across all selected attributes. This was expected due to the similarities seen in the volatile attributes in the wine. For the overall enjoyment, flavor, alcohol, and sourness liking, the stopped wine and the non-Saccharomyces wine also showed no significant differences in the amount they were enjoyed. There was, however, a significant difference in all four of these attributes between the controlled and distilled wines and the stopped and non-Saccharomyces wines. The attributes across all wines regarding alcohol and sourness liking were similar to the significant differences found in Figure 4, showing that it is possible that people preferred a muscadine wine with less alcohol flavor and less sourness. The differences in sourness liking from the consumer panel correlate to the titratable acidity measurements. The two wines with the lowest titratable acidity, the stopped fermentation wine and the non-Saccharomyces wine, were rated to be statistically liked more than both the control and the vacuum distilled wine. For the overall liking and overall flavor attributes, the large difference seen in the liking between the control and distilled wines and the stopped and non-Saccharomyces wines show that the stopped wine and the non-Saccharomyces wine were both liked the same amount, and were enjoyed significantly more than the other two in both flavor and overall liking.
Concerning appearance, the significant difference between the stopped wine and the other wines shows that people may have preferred the darker color of the stopped wine to the others. There was also a significant difference in the liking of the color of the non-Saccharomyces wine to the other wines. While people preferred the color of the stopped wine the most, they may have enjoyed the color of the non-Saccharomyces wine the second most due to the increased intensity seen in Table 1. The control and distilled wines may have been least preferred with regards to color because of the potential anthocyanin breakdown that happened during the longer fermentation [26]. The aroma of the three fermented wines was preferred over the aroma of the stopped fermentation. This could be due to the lack of volatiles formed in the fermentation process, shown in Table 2.
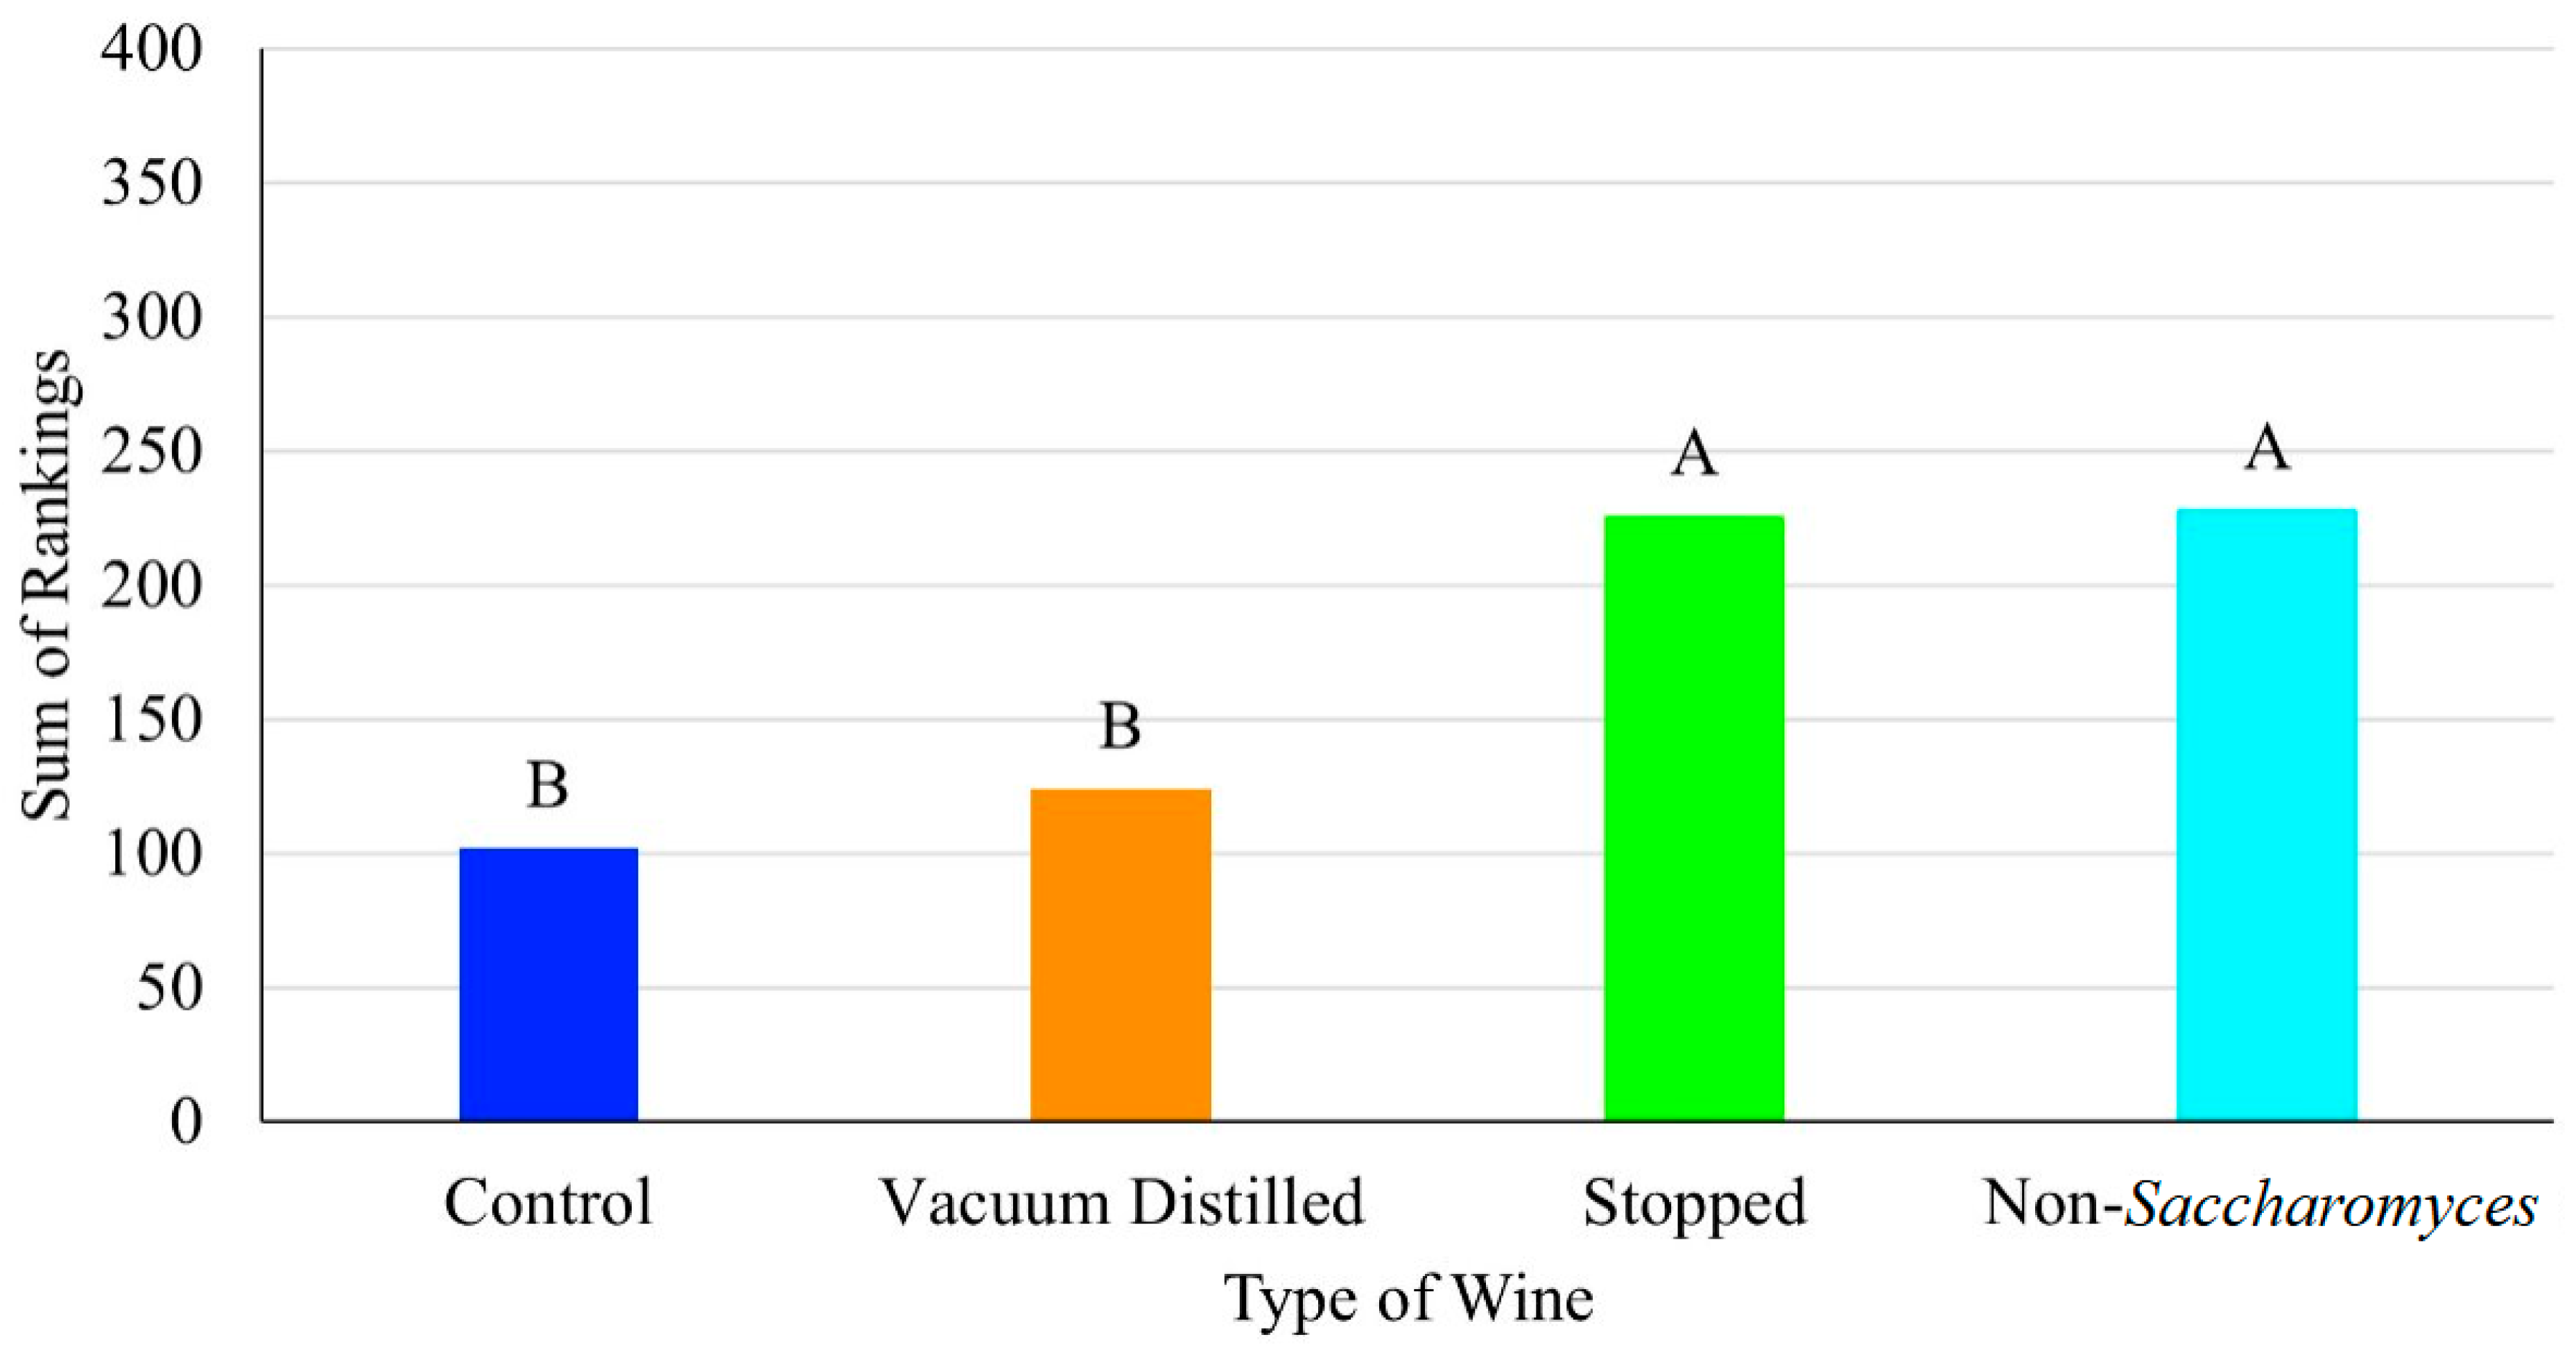
The wines were ranked by each panelist (1 worst, 4 best), and the sum is shown in Figure 6. The low ranking of the distilled and control wines could be due to the similar sugar levels and volatile composition of the two wines, while the lack of significant difference in the ranking between the stopped fermentation and the non-Saccharomyces wines could be due to the lower acidity perceived, as well as the sweeter flavor due to the incomplete fermentations. Higher amounts of residual sugars could have caused consumers to enjoy the stopped and non-Saccharomyces wines more than the control and vacuum-distilled wines. The effect on ranking from both sensory and chemical analysis were assessed via a PCA plot as shown in the Appendix A Figure A1. It was shown that there was a significant difference in ranking between the stopped and non-Saccharomyces fermented wines compared to the control and vacuum-distilled wines (Figure 5). The stopped and non-Saccharomyces wines were ranked statistically higher, which is consistent with the majority of the sensory preferences shown in Figure 4. This suggests that stopped and non-Saccharomyces fermentations could be good wine-making methods for muscadine wine makers, as they were preferred by consumers.

4. Conclusions

Four wines were created to directly compare fermentation methods of creating non-alcoholic muscadine wines compared to a control muscadine wine fermented with Saccharomyces cerevisiae yeast. The non-alcoholic wines created were a distilled wine, a stopped fermentation wine, and a non-Saccharomyces wine. The panelists did not differentiate between the control and the vacuum-distilled wine, indicating that vacuum distillation is a viable method to recreate non-alcoholic versions of successful muscadine wines. With respect to this particular muscadine grape blend, the stopped and non-Saccharomyces wines were ranked the highest, while the control and distilled wines were ranked the lowest, thus disproving the null hypothesis. This suggests that the stopped fermentation method and the non-Saccharomyces fermentation method, specifically using Saccharomycodes ludwigii yeast, are potential fermentation methods for muscadine wine makers wanting to create a non-alcoholic wine. There are some considerations for wine makers when deciding which method to use. The vacuum-distilling method produced the result closest to the control method, but is a costly method in terms of both capital and training. The stopped fermentation method produced wines which were among the most preferred, and it uses traditional yeast, but due to a short fermentation time there was a large amount of yeast in suspension. For this method to be viable, robust filtration would be required, as the resulting product is more susceptible to contamination. The non-Saccharomyces fermentation also produced wine that was preferred to the control by the consumer panel, but there is a learning curve associated with using non-Saccharomyces yeast. However, there is also the potential for undesirable compounds to be produced, depending on the organisms used.

Author Contributions

Conceptualization, P.C.P.M., K.A.T.-W. and A.J.M.; methodology, P.C.P.M., K.A.T.-W. and A.J.M.; validation, D.B.; formal analysis, A.A.E. and A.J.M.; investigation, A.A.E. and P.C.P.M.; resources, D.B.; K.A.T.-W. and A.J.M.; data curation, A.A.E.; writing—original draft preparation, A.A.E.; writing—review and editing, A.A.E., D.B., K.A.T.-W. and A.J.M.; visualization, A.A.E., K.A.T.-W. and A.J.M.; supervision, K.A.T.-W. and A.J.M.; project administration, K.A.T.-W. and A.J.M.; funding acquisition, P.C.P.M., K.A.T.-W. and A.J.M. All authors have read and agreed to the published version of the manuscript.

Funding

This research was supported by Florida Department of Agriculture and Consumer Services, under award ID 31358 through the 2024–2025 Viticulture Research Grant Program—Flavor, Marketing and Consumption.

Institutional Review Board Statement

The study was conducted in accordance with the Declaration of Helsinki, and approved by the Institutional Review Board of the University of Florida (IRB—IRB202401343, 4 December 2024).

Informed Consent Statement

Informed consent was obtained from all subjects involved in the study.

Data Availability Statement

The original contributions presented in this study are included in the article. Further inquiries can be directed to the corresponding author.

Acknowledgments

This study was supported by the University of Florida’s Food Science and Human Nutrition Department. We would like to thank the personnel of the Sim’s lab sensory panel for assistance in running the consumer panel as well as Nicolas Wendrick for his support in running the statistics on the fermentation data collected.

Conflicts of Interest

The authors declare no conflicts of interest.

Abbreviations

The following abbreviations are used in this manuscript:
NANon-alcoholic
TATitratable acidity
USDUnited States Dollar
CAGRCompound annual growth rate
pHPotential of Hydrogen
EDTAEthylenediaminetetraacetic acid
i.d.Inner diameter
ASBCAmerican Society of Brewing Chemists
ANOVAAnalysis of variance
DIDe-ionized
SPMESolid-phase microextraction
MSDMass spectrometer detector
GC-MSGas chromatography–mass spectrometry
RIRetention index
LRIsLinear retention indices
SDSignificant difference

Appendix A

Table A1. Results from ordinary one-way ANOVA analysis from Table 1 (n = 3).
Wine TypepHTA (g/L Tartaric Acid)Color HueColor Intensity
F value2.916.037267.770.81
Degrees of Freedom14141414
p-value0.07770.0098<0.0001<0.0001
Figure A1. PCA plot of volatile groups and sensory characteristics of each wine.
Beverages 11 00146 g0a1

References

  1. 360 Market Updates. Market Research Reports, Industry Analysis, Business Overview & Trends. 2023. Available online: https://www.360marketupdates.com/TOC/24117297#Tables (accessed on 7 March 2024).
  2. NielsenIQ. Non-Alcoholic Beverage Trends in the US. 2022. Available online: https://nielseniq.com/global/en/insights/education/2022/non-alcoholic-beverage-trends-in-the-us/ (accessed on 7 March 2024).
  3. Office of Communications. Wine Labeling: Overview of Labeling Requirements for Domestic Wines—Less than 7 Percent Alcohol by Volume|TTB: Alcohol and Tobacco Tax and Trade Bureau. Ttbgov. as Found on the Website. 2025. Available online: https://www.ttb.gov/regulated-commodities/beverage-alcohol/wine/7percentorless (accessed on 12 May 2025).
  4. Aguera, E.; Bes, M.; Roy, A.; Camarasa, C.; Sablayrolles, J.M. Partial Removal of Ethanol during Fermentation to Obtain Reduced-Alcohol Wines. Am. J. Enol. Vitic. 2010, 61, 53–60. [Google Scholar] [CrossRef]
  5. Australian Wine Research Institute. Predicting Alcohol Levels; Australian & New Zealand Grapegrower & Winemaker: Urrbrae, SA, Australia, 2016. [Google Scholar]
  6. Fleming, A.J.; Threlfall, R.T. Using non-Saccharomyces yeast to modify acidity during wine fermentations from VitisHybrid grapes grown in a warm region. Am. J. Enol. Vitic. 2024, 75, 0750004. [Google Scholar] [CrossRef]
  7. Wang, X.; Fan, G.; Peng, Y.; Xu, N.; Xie, Y.; Zhou, H.; Liang, H.; Zhan, J.; Huang, W.; You, Y. Mechanisms and effects of non-Saccharomyces yeast fermentation on the aromatic profile of wine. J. Food Compos. Anal. 2023, 124, 105660. [Google Scholar] [CrossRef]
  8. Esteves, M.; Barbosa, C.; Vasconcelos, I.; Tavares, M.J.; Mendes-Faia, A.; Mira, N.P.; Mendes-Ferreira, A. Characterizing the potential of the non-conventional yeast Saccharomycodes ludwigii UTAD17 in winemaking. Microorganisms 2019, 7, 478. [Google Scholar] [CrossRef]
  9. Andersen, P.C.; Sarkhosh, A.; Huff, D.; Breman, J.W. The Muscadine Grape (Vitis rotundifolia Michx). edisifasufledu. as Found on the Website. 2024. Available online: https://edis.ifas.ufl.edu/publication/HS100 (accessed on 9 May 2025).
  10. Zhang, Y.; Chang, S.K.C.; Stringer, S.J.; Zhang, Y. Characterization of titratable acids, phenolic compounds, and antioxidant activities of wines made from eight mississippi-grown muscadine varieties during fermentation. LWT 2017, 86, 302–311. [Google Scholar] [CrossRef]
  11. Schmidtke, L.M.; Blackman, J.W.; Agboola, S.O. Production Technologies for Reduced Alcoholic Wines. J. Food Sci. 2012, 77, R25–R41. [Google Scholar] [CrossRef]
  12. Silva, P. Low-Alcohol and Nonalcoholic Wines: From Production to Cardiovascular Health, along with Their Economic Effects. Beverages 2024, 10, 49. [Google Scholar] [CrossRef]
  13. American Society of Brewing Chemists. Beer Method 4. Beer and Distillate Measured Gravimetrically. Approved (1958), rev. (1975), rev. (2018); American Society of Brewing Chemists: St. Paul, MN, USA. [CrossRef]
  14. Cutaia, A.J.; Reid, A.J.; Speers, R.A. Examination of the relationships between original, real and apparent extracts, and alcohol in pilot plant and commercially produced beers. J. Inst. Brew. 2009, 115, 318–327. [Google Scholar] [CrossRef]
  15. Thermo Fisher Scientific. Titratable Acidity of Red Wine by Manual Titration (Potentiometric); Thermo Fisher Scientific: Waltham, MA, USA, 2014. [Google Scholar]
  16. Wendrick, N. The Influence of Packaging Material on the Properties of Carbonated Muscadine Wine Under Accelerated and Ambient Storage Conditions. Master’s Thesis, University of Florida, Gainesville, FL, USA, 2022. [Google Scholar]
  17. Ivit, N.N.; Loira, I.; Morata, A.; Benito, S.; Palomero, F.; Suárez-Lepe, J.A. Making natural sparkling wines with non-Saccharomyces yeasts. Eur. Food Res. Technol. 2018, 244, 925–935. [Google Scholar] [CrossRef]
  18. Budner, D.; Carr, J.; Serafini, B.; Tucker, S.; Dieckman-Meyer, E.; Bell, L.; Thompson-Witrick, K.A. Statistical Significant Differences between Aroma Profiles of Beer Brewed from Sorghum. Beverages 2021, 7, 56. [Google Scholar] [CrossRef]
  19. Thompson-Witrick, K.A.; Rouseff, R.L.; Cadwallader, K.R.; Duncan, S.E.; Eigel, W.N.; Tanko, J.M.; O’Keefe, S.F. Comparison of two extraction techniques, solid-phase microextraction versus continuous liquid-liquid extraction/solvent-assisted flavor evaporation, for the analysis of flavor compounds in Gueuze lambic beer. J. Food Sci. 2015, 80, C571–C576. [Google Scholar] [CrossRef]
  20. American Society of Brewing Chemists. ASBC Methods of Analysis Online Yeast Method 14 Miniature Fermentation Assay Approved; American Society of Brewing Chemists: St. Paul, MN, USA, 2011. [Google Scholar] [CrossRef]
  21. MacIntosh, A.J.; Adler, J.; Eck, E.; Speers, R.A. Suitability of the miniature fermentability method to monitor industrial fermentations. J. Am. Soc. Brew. Chem. 2012, 70, 205–211. [Google Scholar] [CrossRef]
  22. Reid, S.J.; Josey, M.; MacIntosh, A.J.; Maskell, D.L.; Speers, R.A. Predicting Fermentation Rates in Ale, Lager and Whisky. Fementation 2021, 7, 13. [Google Scholar] [CrossRef]
  23. Rudolph, A.; MacIntosh, A.J.; Speers, R.A.; St Mary, C. Modeling Yeast in Suspension during Laboratory and Commercial Fermentations to Detect Aberrant Fermentation Processes. J. Am. Soc. Brew. Chem. 2019, 78, 63–73. [Google Scholar] [CrossRef]
  24. Vion, C.; Yeramian, N.; Hranilovic, A.; Masneuf-Pomarède, I.; Marullo, P. Influence of yeasts on wine acidity: New insights into Saccharomyces cerevisiae. OENO One 2024, 58. [Google Scholar] [CrossRef]
  25. Berrueta, L.A.; Rasines-Perea, Z.; Prieto-Perea, N.; Asensio-Regalado, C.; Alonso-Salces, R.M.; Sánchez-Ilárduya, M.B.; Gallo, B. Formation and evolution profiles of anthocyanin derivatives and tannins during fermentations and aging of red wines. Eur. Food Res. Technol. 2019, 246, 149–165. [Google Scholar] [CrossRef]
  26. Chanprasartsuk, O.; Prakitchaiwattana, C. Growth kinetics and fermentation properties of autochthonous yeasts in pineapple juice fermentation for starter culture development. Int. J. Food Microbiol. 2022, 371, 109636. [Google Scholar] [CrossRef]
  27. Moreno, S.R.; Curtis, S.J.; Sarkhosh, A.; Sarnoski, P.J.; Sims, C.A.; Dreyer, E.; Rudolph, A.B.; Thompson-Witrick, K.A.; MacIntosh, A.J. Considerations When Brewing with Fruit Juices: A Review and Case Study Using Peaches. Fermentation 2022, 8, 567. [Google Scholar] [CrossRef]
  28. Serviss, M.T.; Wendrick, N.A.; MacIntosh, A.J.; Thompson-Witrick, K.A. A Holistic View of the Fate of Berry-Derived Adjuncts throughout Fermentation. Beverages 2024, 10, 38. [Google Scholar] [CrossRef]
  29. ASBC. ASBC Beer Flavor Database. 2012. Available online: https://www.asbcnet.org/Methods/SensoryAnalysis/Pages/default.aspx (accessed on 1 May 2024).
  30. PubChem. PubChem Nihgov. 2025. Available online: https://pubchem.ncbi.nlm.nih.gov/ (accessed on 12 May 2025).
  31. de Rosa, T.; Margheri, G.; Moret, I.; Scarponi, G.; Versini, G. Sorbic acid as a preservative in sparkling wine. Its efficacy and adverse flavor effect associated with ethyl sorbate formation. Am. J. Enol. Vitic. 1983, 34, 98–102. [Google Scholar] [CrossRef]
  32. Noordeloos, S.; Nagel, C.W. Effect of sugar on acid perception in wine. Am. J. Enol. Vitic. 1972, 23, 139–143. [Google Scholar] [CrossRef]
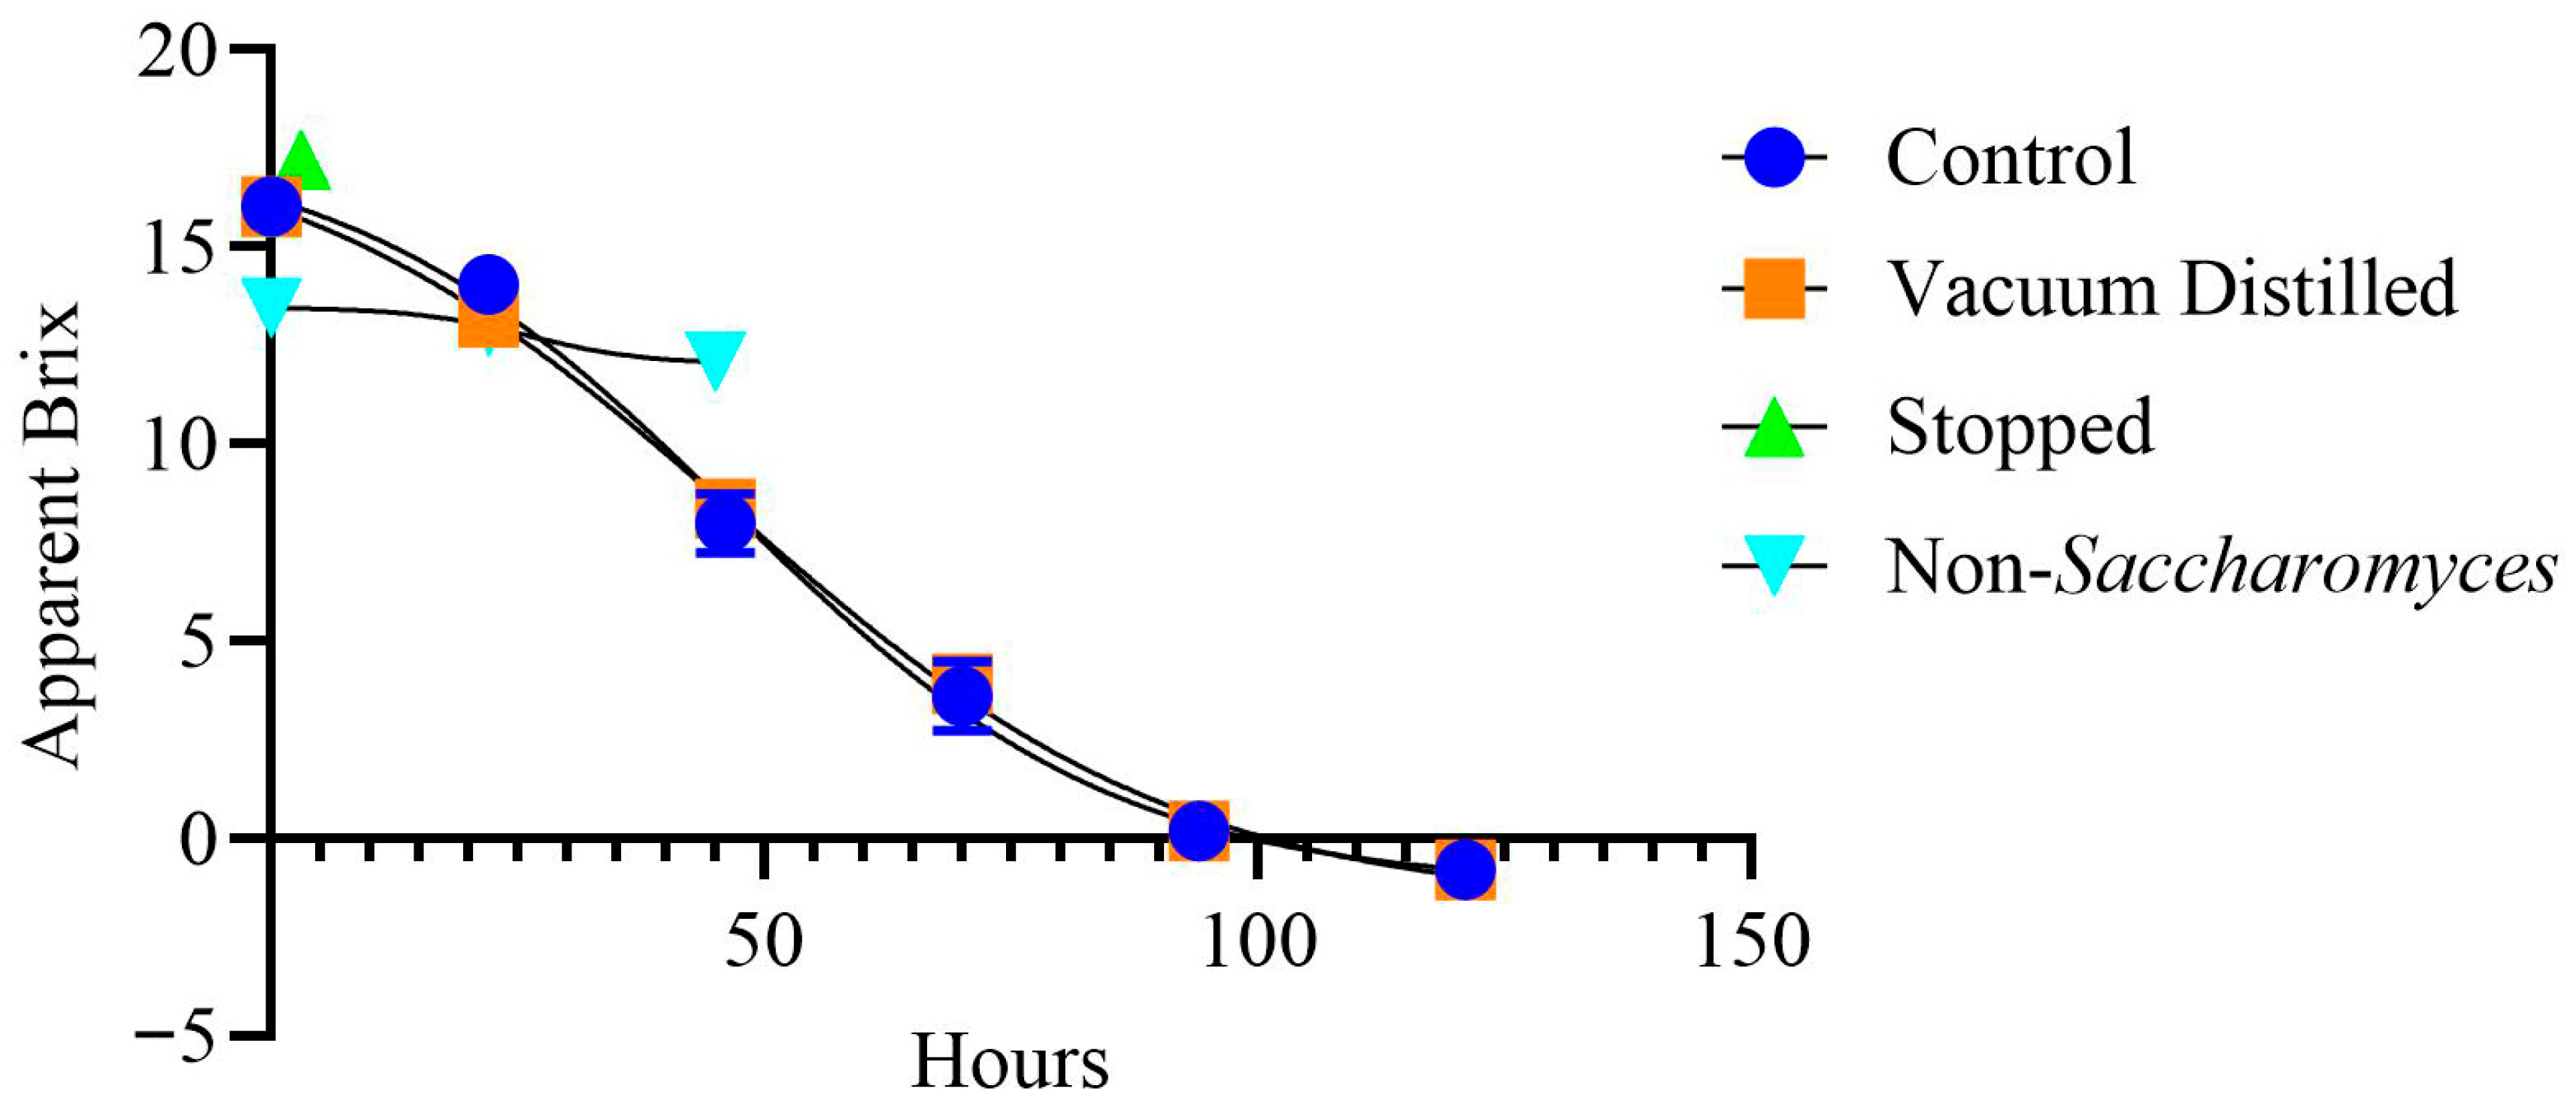
Figure 1. Apparent Brix over time of each fermentation.
Beverages 11 00146 g001
Figure 2. Yeast count over time of each fermentation.
Beverages 11 00146 g002
Figure 3. Calculated alcohol content over time of each fermentation.
Beverages 11 00146 g003
Figure 4. Perception of characteristics of the wine. Standard deviation shown. Letters show significant differences.
Beverages 11 00146 g004
Figure 5. Average scores of control, vacuum-distilled, stopped, and non-Saccharomyces wine on a 9-point hedonic scale with regards to appearance, aroma, overall, flavor, alcohol, and sourness. N = 92; graph shows SE. Letters show significant differences between different wines within the same attribute. Tukey’s HSD was used to determine significant differences.
Beverages 11 00146 g005
Figure 6. The summation of all rankings given to each of the four wines, with 1 being least liked and 4 being most liked (n = 98). Letters show significant differences.
Beverages 11 00146 g006
Table 1. Final fermentation time, titratable acidity (TA), pH, color hue, and color intensity of the wines produced.
Wine TypeTime (h)pHTA (g/L Tartaric Acid)Color HueColor Intensity
Juice ^03.22 ± 0.01 A8.1 ± 0.15 AB0.661 ± 0.01 D3.313 ± 0.03 A
Control1213.17 ± 0.05 A9.3 ± 0.26 A1.102 ± 0.03 A1.207 ± 0.04 C
Vacuum-Distilled1213.19 ± 0.04 A9.1 ± 0.23 A1.103 ± 0.01 A1.184 ± 0.06 C
Stopped33.22 ± 0.01 A8.6 ± 0.92 AB0.797 ± 0.03 C2.296 ± 0.46 B
Non-Saccharomyces453.24 ± 0.01 A7.7 ± 0.38 B0.943 ± 0.01 B3.398 ± 0.17 A
n = 3; mean ± SD. ^ Standard deviation shows measurement error as identical juice was used for all wines. Different letters indicate significant differences for measured parameters. Statistical results are shown in Table A1.
Table 2. Volatile compounds identified in Muscadine juice and wine produced.
CompoundLRIOdor DescriptorsApproximate Concentration (mg/L)
JuiceControlDistilledStoppedNon-Sacc.
Acids
Hexanoic acid982rancid--------------------0.02 ± 0.02
Octanoic acid1169sweat, cheese0.06 ± 0.030.57 ± 0.330.79 ± 0.910.17 ± 0.160.03 ± 0.01
Nonanoic acid1260green, fat0.05 ± 0.020.11 ± 0.020.11 ± 0.040.02 ± 0.030.01 ± 0.01
Decanoic acid1373rancid fat-----0.29 ± 0.050.32 ± 0.05-----0.07 ± 0.02
SUBTOTAL 0.07 ± 0.030.97 ± 0.39 e1.22 ± 1.00 e0.27 ± 0.20 e0.13 ± 0.02 e
Alcohols
Isoamyl alcohol757floral, fruity-----24.26 ± 5.0422.31 ± 2.136.73 ± 1.370.52 ± 0.02
3-Hexenol865grass0.08 ± 0.05----------0.03 ± 0.010.02 ± 0.01
2-Hexen-1-ol874leaf, green, wine, fruit0.06 ± 0.01--------------------
Hexanol876floral, fruity0.58 ± 0.220.15 ± 0.030.14 ± 0.01-----0.22 ± 0.01
1-Octanol1068floral, fruity, citrus0.03 ± 0.040.07 ± 0.010.07 ± 0.01----------
Phenethyl alcohol1108alcohol, honey, roses, sweet0.13 ± 0.191.61 ± 0.051.82 ± 0.671.02 ± 0.310.04 ± 0.01
Decanol1266fat----------0.06 ± 0.04----------
Dodecanol1469fatty acids, coconut, banana0.02 ± 0.020.04 ± 0.010.04 ± 0.01----------
SUBTOTAL 0.88 ± 0.2126.25 ± 5.10 A24.43 ± 2.77 A7.78 ± 1.66 B0.28 ± 0.02 B
Aldehydes
Hexanal813grass, tallow, fat0.21 ± 0.07--------------------
p-Tolualdehyde1079floral-----0.08 ± 0.070.10 ± 0.01----------
2,4-Dimethylbenzaldehyde1199mild, sweet, bitter almond-----0.03 ± 0.010.06 ± 0.03----------
SUBTOTAL 0.21 ± 0.070.08 ± 0.07 AB0.15 ± 0.03 A0 ± 0 B0 ± 0 B
Benzene
1,2,3,5-Tetramethylbenzene 1124camphor-----0.06 ± 0.010.07 ± 0.01----------
Naphthalene1154tar-----0.39 ± 0.340.59 ± 0.10----------
SUBTOTAL -----0.45 ± 0.34 AB0.66 ± 0.10 A0 ± 0 B0 ± 0 B
Esters
Ethyl butanaote826butter, sweet, perfumed, fruity---------------0.02 ± 0.01-----
Isoamyl acetate882banana-----16.54 ± 1.6017.41 ± 0.210.66 ± 0.08-----
Methyl N-hydroxybenzenecarboximidoate921 0.12 ± 0.080.42 ± 0.680.16 ± 0.240.02 ± 0.02-----
Ethyl hexanoate1002apple peel, fruit-----6.77 ± 0.917.98 ± 0.790.50 ± 0.160.09 ± 0.01
Hexyl acetate1002fruit, herb-----1.66 ± 0.752.33 ± 0.120.03 ± 0.010.01 ± 0.01
2-Ethylhexanol1037rose, green0.03 ± 0.030.02 ± 0.02---------------
Ethyl 2,4-hexadienoate1089pineapple, celery0.07 ± 0.04--------------------
Ethyl succinate1164wine, fruit0.07 ± 0.09--------------------
Ethyl octanoate1197fruit, fat0.40 ± 0.598.65 ± 0.319.37 ± 1.311.31 ± 0.230.08 ± 0.03
β-Phenethyl acetate1260rose, honey, tobacco-----0.51 ± 0.040.57 ± 0.120.28 ± 0.010.01 ± 0.01
Ethyl 9-decanoate1369caprylic, fruity, apple----------0.03 ± 0.010.07 ± 0.01-----
Ethyl decanoate1379grape0.12 ± 0.152.15 ± 0.122.69 ± 0.270.35 ± 0.070.02 ± 0.01
Isoamyl octanoate1594fruity, spicy, orange, pear, melon-----0.08 ± 0.010.10 ± 0.02----------
Ethyl dodecanoate1594caprylic, soapy, estery-----0.04 ± 0.010.05 ± 0.010.03 ± 0.010.01 ± 0.01
SUBTOTAL 0.77 ± 0.9437.03 ± 2.95 A40.68 ± 0.52 A3.25 ± 0.53 B0.21 ± 0.03 B
Ketones
2-Octanone981fruity, green, floral, herbaceous0.14 ± 0.060.13 ± 0.11---------------
β-Damascenone apple, rose, honey-----0.05 ± 0.05-----0.04 ± 0.010.04 ± 0.03
SUBTOTAL 0.14 ± 0.060.17 ± 0.15 e0 ± 0 e0.04 ± 0.01 e0.04 ± 0.03 e
Phenols
2,4-Di-tert-butylphenol1481citrus, violet, hops, floral, berry-----0.35 ± 0.040.45 ± 0.12----------
SUBTOTAL 0 ± 00.35 ± 0.04 A0.45 ± 0.12 A0 ± 0 B0 ± 0 B
Terpenes
Limonene lemon---------------0.05 ± 0.020.06 ± 0.01
Linalool oxide1084flower, wood0.05 ± 0.05---------------0.02 ± 0.01
Linalool1092flower, lavender0.26 ± 0.090.21 ± 0.180.34 ± 0.090.09 ± 0.010.04 ± 0.01
SUBTOTAL 0.30 ± 0.130.20 ± 0.18 e0.34 ± 0.09 e0.14 ± 0.03 e0.12 ± 0.0 e
Terpene alcohol
3,7-Dimethyl-1,5,7-octatrien-3-ol 1082hyacinth-----0.12 ± 0.03-----0.15 ± 0.020.07 ± 0.03
SUBTOTAL 0 ± 00.12 ± 0.03 A0 ± 0 B0.15 ± 0.02 A0.07 ± 0.03 A
n = 3; Mean ± SD; flavor descriptors from [29,30,31]. Numbers bearing different letters are statistically significant (p < 0.05). ----- not detected in the sample. Numbers bearing different letters (A,B) are statistically significant (p < 0.05) within chemical groups. e No statistical differences were observed. Results from ANOVA analysis are in the Appendix A in Table A1.
Disclaimer/Publisher’s Note: The statements, opinions and data contained in all publications are solely those of the individual author(s) and contributor(s) and not of MDPI and/or the editor(s). MDPI and/or the editor(s) disclaim responsibility for any injury to people or property resulting from any ideas, methods, instructions or products referred to in the content.