Article

Comparative Analysis of Chemical Composition and Antioxidant Activity in Conventional, Civet, and Elephant Coffees: Is There a Definitive Authentication Marker of Elephant Coffee?

1
Department of Food Science, Faculty of Agrobiology, Food and Natural Resources, Czech University of Life Sciences Prague, 165 00 Prague, Czech Republic
2
Department of Food Hygiene, Technology and Safety, University of Veterinary Medicine and Pharmacy, 041 81 Košice, Slovakia
*
Author to whom correspondence should be addressed.
Beverages 2025, 11(3), 79; https://doi.org/10.3390/beverages11030079
Submission received: 9 April 2025 / Revised: 19 May 2025 / Accepted: 22 May 2025 / Published: 1 June 2025
(This article belongs to the Section Tea, Coffee, Water, and Other Non-Alcoholic Beverages)

Abstract

:
Novel methods of coffee processing, including animal-assisted fermentation, are gaining popularity—among them, elephant dung coffee stands out for its rarity and high price, making it a likely target for adulteration. This study aims to discover candidate biomarkers for elephant coffee by comparing the chemical composition, antioxidant activity, and volatile profiles of Arabica coffee processed by three methods: conventional, civet-derived, and elephant-derived (all originated from Southeast Asia, medium roast). Analytical methods included HPLC-UV and GC-SPME-MS, along with in vitro antioxidant assays (DPPH, ORAC, ABTS, total phenolics, and total flavonoids). Principal Component Analysis (PCA) was used to evaluate differences between the samples. While elephant coffee showed lower caffeine (0.93%) and antioxidant capacity across all assays, it was richer in selected volatile compounds, such as pyrazines (e.g., 3-ethyl-2,5-dimethylpyrazine; 3.73% RPA), 2- and 3-methybutanal (1.18 and 0.19% RPA), and furfuryl acetate (18.00% RPA; p < 0.05). These changes are likely to be due to fermentation in the gastrointestinal tract. Despite differences, no definitive biomarker of elephant coffee was found, suggesting that discrimination from other coffee samples may not be as simple as previous studies indicated. More studies with a higher number of samples that employ an extensive analytical approach (e.g., omics or NMR) to thoroughly analyze the phytochemical profile of coffee beans before and after digestion by the elephant are needed.

Graphical Abstract

1. Introduction

Coffee is made from the dried, ripe seeds of various Coffea species, primarily Coffea arabica (commonly known as Arabica), C. canephora (Robusta), C. liberica, and others from the Rubiaceae family. It is the third most consumed beverage in the world, following water and tea, with an estimated 11.8 million tons consumed globally each year [1]. Coffee contains a wide range of biologically active and aromatic compounds. These include caffeine (1–2%), a central nervous system stimulant; chlorogenic acid derivatives (5–7%), which are believed to have antioxidant properties; vitamin B3 (0.25–1%); as well as volatile oils and tannins that contribute to coffee’s distinctive aroma and flavor [2].
There are several traditional methods for processing coffee, most notably the dry (or natural) method, the wet method, and hybrid approaches often referred to as semi-dry, semi-wet, or, more recently, the honey process. In addition, newer techniques such as anaerobic fermentation and carbonic maceration are beginning to see commercial use. Another relatively recent and popular method involves animals—especially civets—ingesting the coffee cherries. The beans pass through the animal’s digestive system, are collected from the excreta, and then processed into what is commonly known as “dung coffee” [3].
It is widely recognized that specific coffee processing methods significantly affect the quality, chemical composition, and biological activity of the final beverage. This is particularly evident in processes that involve animal digestion. For instance, civet coffee typically contains lower levels of caffeine but may be richer in certain aromatic compounds, such as guaiacol, pyrazines, and furans [4], as well as organic acids like citric and malic acid. These changes are attributed to the action of microorganisms [5] and digestive enzymes in the civet’s gastrointestinal tract. These agents help break down complex molecules into simpler ones, such as amino acids and sugars, which can undergo further transformation during roasting through the Maillard reaction—resulting in elevated levels of compounds like pyrazines [4,6].
More recently, coffee produced using other animals, such as elephants, jacu birds, and monkeys, has entered the global specialty coffee market. Among these, elephant coffee has attracted particular interest due to its distinctive production process and exceptionally high price, which can reach up to USD 4000 per kilogram. However, to date, there has been little to no research describing how this method of processing affects the coffee’s final chemical composition or biological activity. As with civet coffee, it is reasonable to assume that exposure to the elephant’s gut microflora and digestive enzymes may induce specific chemical changes in the beans. Identifying these unique compounds could serve as a reliable means of authenticating elephant coffee—an important step given its high market value and vulnerability to adulteration.
Both targeted and untargeted analytical techniques are employed to detect coffee fraud. Specific biomarkers, such as diterpenes, phenolic compounds, and fatty acids, are commonly used to differentiate between coffee species and to identify common adulterants like maize, chicory, or barley. Untargeted metabolomic analyses, particularly of volatile compounds and other metabolites, can also help determine the geographical origin of coffee [7]. However, there remains a lack of sufficient data on key metabolites, along with an absence of standardized methods for verifying the authenticity of coffee processing techniques. This gap is largely due to the limited availability of comprehensive datasets and the complexity and variability of factors that influence coffee cultivation and roasting [8,9].
Therefore, the aim of this study was to compare the chemical composition and antioxidant activity of elephant dung coffee with civet and conventional arabica coffee, and to explore the potential of selected phenolic and volatile compounds as discriminating features for authenticity assessment.

2. Materials and Methods

2.1. Coffee Samples

Samples of conventional arabica coffee (Pang Khon, Thailand; n = 1), arabica Kopi Luwak civet coffee (Bali, Indonesia; n = 1), and elephant-derived Black Ivory coffee (Thailand; n = 1) were purchased from commercial distributors (Čajový dýchánek, Dobrovice, Česká republika; Johny’s coffee, Omice, Česká republika; and Black Ivory Coffee Company, respectively). Samples were selected based on the greatest possible similarity to each other, with respect to roast level (medium roast), genetic background (arabica coffee), and geographic origin (Southeast Asia, i.e., Thailand and Indonesia). Moisture content was determined by an infrared moisture analyzer (DBS 60-3, Kern, Balingen, Germany). The results were as follows: elephant coffee, 95.24%; civet coffee, 95.27%; and conventional arabica coffee, 94.27%. All samples were stored in sealed bags at room temperature, i.e., under common consumer conditions (e.g., in a cool and dry space). As far as we know, the Black Ivory Coffee Company in Thailand is the only worldwide distributor of elephant coffee.

2.2. Sample Preparation

Unless otherwise stated, all assays utilized extracts prepared by the procedure described in this section. An amount of 100 mg of finely ground coffee was mixed with 10 mL hot water (100 °C), allowed to stand for 5 min, vortexed for 1 min, and centrifuged. Grinding was performed directly before sample preparation. Samples were stored in −20 °C.

2.3. Chemicals, Reagents, and Standards

The chemicals 2,2′-Azobis(2-amidinopropane) dihydrochloride (AAPH), ABTS radical, 2,2-diphenyl-1-picrylhydrazyl (DPPH), 6-hydroxy-2,5,7,8-tetramethylchromane-2-carboxylic acid (Trolox), fluorescein sodium salt (FL), Folin–Ciocalteu (F–C) reagent, ammonium persulfate (APS) and analytical grade standards of caffeine, chlorogenic acid, gallic acid, cinnamic acid, and epicatechin were obtained at Sigma–Aldrich (Prague, Czech Republic). Analytical grade quality solvents and acids, including methanol (MeOH), acetonitrile (ACN), and acetic acid (AA), were purchased from VWR (Prague, Czech Republic). Folin–Ciocalteu reagent was acquired from Penta (Prague, Czech Republic).

2.4. In Vitro Antioxidant Activity

2.4.1. Inhibition of DPPH Radical

The ability of coffee samples to inhibit DPPH radical was established according to Sharma and Bhat (2009) [10]. Initially, two-fold serial dilutions of each sample were prepared in MeOH (100 μL) in 96-well microtiter plates. Subsequently, 100 μL of freshly prepared 0.25 mM DPPH in MeOH solution was mixed with the sample in each well, creating a range of concentrations from 4.9 to 5000 μg/mL (final volume of 200 μL) to start the radical–antioxidant reaction. Trolox was used as a reference compound at concentrations of 0.5, 1, 2, 4, 8, 16, 32, 64, 128, 256, and 512 μg/mL. The mixture was kept in the dark at laboratory temperature, and absorbance was measured after 30 min at 517 nm using a Synergy H1 reader (BioTek, Winooski, VT, USA). Results were expressed as half maximal inhibitory concentration (μg/mL IC50) and then recalculated to Trolox equivalents (μg TE/mg dry weight [DW] of coffee). In the initial calculation of the IC50, the acquired data (absorbances for each concentrations; Abs) were transformed to % of inhibition according to the following formula: [(Absblank − Abssample)/Absblank) × 100]. IC50 was then calculated by interpolating 50% inhibition from the dose–response curve using non-linear 4-parameter regression. Trolox equivalents were calculated by dividing the IC50 for Trolox by the IC50 of the sample.

2.4.2. Trolox Equivalent Antioxidant Capacity (TEAC) Assay

The TEAC antioxidant assay was determined by the ABTS radical cation decolorization method described by Re et al. (1999) [11]. The ABTS radical was generated by mixing 5 μL ABTS (7 mM) with 500 μL APS (245 mM) and incubating the solution overnight in the dark at room temperature. Before the experiment, the ABTS radical was diluted (to approx. 1% v/v) in PBS buffer until it reached an absorbance reading of ≈0.700 at 734 nm. Samples (10 μL) were transferred to the 96-well microtiter plates. Afterwards, 190 μL of the ABTS radical was added to each well. Plates were incubated in the dark at room temperature for 5 min. Absorbance was read at 734 nm. Coffee samples were tested at a concentration of 50 μg/mL. A calibration curve of Trolox was acquired using seven concentration levels (0.156, 0.313, 0.625, 1.25, 2.5, 5, and 10 μg/mL; final concentration). Results were expressed as Trolox equivalents (μg TE/mg DW coffee) by fitting the absorbances of the samples to the Trolox calibration curve.

2.4.3. Oxygen Radical Absorbance Capacity (ORAC) Assay

The ability of coffee samples to retard the AAPH-induced decomposition of FL was determined by the ORAC method developed by Ou et al. (2001) [12]. Initially, outer wells of black absorbance 96-well microtiter plates were filled with 200 μL of distilled water, to provide better thermal mass stability [13]. Before the study, stock solutions of AAPH (153 mM) radical and FL (540 μM) were prepared in 75 mM phosphate buffer (pH 7.0). Subsequently, 25 μL of each sample was diluted in 150 μL FL (54 nM) and incubated at 37 °C for 10 min. To initiate the oxidative reaction, 25 μL of AAPH was added to each well. The fluorescence decay was measured after 1-minute intervals for 2 h with the absorbance and emission wavelengths set at 490 and 519 nm, respectively (Synergy H1 reader; BioTek, Winooski, VT, USA). Standard calibration curves of positive control Trolox were acquired at five concentration levels (0.5, 1, 2, 4, and 8 μg/mL). The 75 mM phosphate buffer was used as a blank. Results were expressed as Trolox equivalents (μg TE/mg DW coffee) by fitting the area under the curve (AUC) values of the samples to the AUC Trolox calibration curve. The AUC was calculated as follows: AUC = 1 + f1/f0 + f2/f0 + f3/f0 + f4/f0 + … + f120/f0 + f121/f0, where f0 is the initial fluorescence reading at 0 min and fi is the fluorescence reading at time i.

2.4.4. Total Phenolic Content

The total phenolic content in coffee samples was determined by the method described by Singleton et al. (1998) [14]. An amount of 100 μL of each sample (final concentration 200 μg/mL) was added to a 96-well microtiter plate. Afterwards, 25 μL of F–C reagent was added into each well and immediately submitted to orbital shaking at 500 rpm for 10 min. Subsequently, the 75 μL of 12% Na2CO3 was added into each well and left for 1 h at 37 °C in the dark. The results were determined spectroscopically at 700 nm (Synergy H1 reader; BioTek, Winooski, VT, USA). Gallic acid was used as a positive control. The specific standard curve used for estimation of the gallic acid equivalents (μg GAE/ mg DW coffee) was prepared in each microplate (in concentrations of 0.25, 0.5, 1, 2, 4, 8, 16, 32, 64, and 128 μg/mL). Gallic acid equivalents for each sample were calculated by fitting their absorbances to the gallic acid calibration curve.

2.4.5. Total Flavonoid Content

Total flavonoid (TF) content in coffee samples was established by a method initially proposed by Christ and Müller (1960) [15]. An amount of 100 μL of the coffee sample was mixed with 100 μL of 10% aluminum chloride in a 96-well microtiter plate. Afterwards, the solution was incubated in the dark at room temperature for 60 min. Quercetin was used as a positive control at concentrations of 2, 4, 8, 16, 32, 64, and 128 μg/mL. The absorbance was measured at a wavelength of 420 nm using a Synergy H1 microplate reader. The results are expressed as quercetin equivalents (μg QE/mg coffee) by fitting the absorbances of the samples to the quercetin calibration curve.

2.5. Chemical Composition

2.5.1. HPLC-UV Analysis of Caffeine and Polyphenols

The chlorogenic acid (5-O-caffeoylquinic acid, 5-O-CQA), caffeine (CAF), gallic acid (GLA), cinnamic acid (CNA), and caffeic acid (CAFA) in coffee samples were analyzed with the use of a previously described HPLC technique [16]. The apparatus consisted of an Ultimate 3000 system coupled to a UV–Vis detector (ThermoFisher Scientific, Waltham, MA, USA). The analytes were separated on an ACE 100A Excel 2 μm C18-Amide column (150 × 4.6 mm, Advanced Chromatography Technologies Ltd., Aberdeen, UK). A gradient elution was performed using mobile phases A (water with 0.5% acetic acid) and B (acetonitrile with 0.5% acetic acid) as follows (A:B): 96:4 at 0 min, 85:15 at 10 min, 79:21 at 14 min, 78:22 at 25 min, 59:41 at 34 min, 0:100 at 38 min, 0:100 at 48 min, 96:4 at 51 min, and 96:4 at 61 min. The injection volume was 10 μL, the flow rate was 1 mL/min, and the thermostat temperature was 33 °C. Detection of analytes was performed at wavelength windows of 194 and 500 nm. Quantification was performed at 260 and 300 nm. The data were evaluated using Chromeleon 7.2 software (ThermoFisher Scientific, Waltham, MA, USA). The standard calibration curve of each analyte was obtained in a concentration range of 100–2 μg/mL using six concentration points (100, 50, 20, 10, 5, and 2 μg/mL). The amounts of 5-O-CQA, CAF, GLA, CAN, and EPI were expressed in % of content in DW. All analyses were performed in triplicate. Validation parameters of the HPLC-UV method are available in Supplementary Table S1.

2.5.2. GC-SMPE-MS Analysis of Coffee Volatiles

The chemical profile of aromatic substances in coffee samples was determined by previously developed GC-SPME-MS analytical methods [17,18]. The GC-MS instrument consisted of an Agilent 7890A oven, 5975C single quad mass spectrometer (Agilent Technologies, Palo Alto, CA, USA), and CombiPal autosampler (CTC Analytics AG, Zwingen, Switzerland). The measured volatile compounds were absorbed onto an SPME fibre coated with a combined DVB/CAR/PDMS phase (Supelco, Bellefonte, PA, USA). The coffee samples (500 mg of freshly ground coffee in a 10 mL headspace vial) were conditioned at 40 °C for 10 min and were sorbed at the same temperature for 15 min. Volatile compounds were desorbed in the GC inlet at 230 °C for 10 min in a splitless mode. The individual components were separated on an HP-5MS column (30 m, 0.25 mm internal diameter, 0.25 μm, Agilent Technologies). Helium was used as the carrier gas at a flow rate of 1 mL/min. Initially, the temperature program of the oven began at 40 °C and was increased to 180 °C at a rate of 5 °C/min, maintained at this temperature for 1 min, and then increased to 280 °C at a rate of 30 °C/min. The temperature of the transfer line was set at 280 °C, and temperatures of the quadrupole and ion source were maintained at 150 and 230 °C, respectively. Compounds were measured in scan mode in the range of 45–550 m/z and a time window of 0–25 min. The volatiles were identified by comparing their MS spectra and retention indices [19] with the data available on the NIST (the National Institute of Standards and Technology) standard reference database [20]. Their identification by other researchers in roasted coffees was also taken into account. All substances with a retention time greater than 25 min were excluded from identification because their peak areas were too small for reliable identification. The constituents were quantified relatively by comparing the ratio of individual peak areas to the total area of all peaks present in the chromatogram (average percentage of relative peak area; % RPA).

2.6. Statistical Analysis

All data of each coffee type were obtained in triplicate (HPLC/UV and GC-MS analyses, n = 3) and/or in triplicate in three independent tests (in vitro antioxidant activity, n = 9) and were expressed as means ± SD (standard deviation). The obtained data were analyzed with the use of ANOVA analysis with Tukey’s post hoc HSD test (Statistica 14.0.1; TIBCO Software, Palo Alto, CA, USA) to determine significant differences between the coffee samples. The outliers were excluded based on Grubbs’s test, and the normality of the data was tested visually by the normal probability plot (qq-plot) and Kolmogorov–Smirnov test. Principal Component Analysis (PCA) was performed using MetaboAnalyst 6.0 [21] to evaluate multivariate chemical differences among samples based on the concentrations of all measured compounds (phenolics and volatiles, 28 variables). Each coffee type was represented by three independent replicates (n = 9). Data were normalized to the dry weight of the samples, and subsequently, Pareto scaling was applied. To estimate the optimal number of principal components, K-fold cross-validation (k = 5) was conducted based on the lowest mean reconstruction error, using a custom R script executed in the RStudio environment (RStudio version 2024.12.1, Posit Software, PBC, Boston, MA, USA).

3. Results

Elephant coffee samples showed significantly lower antioxidant activity compared to the other samples. They also contained 2-methylbutanal, 2-methylfuran, and 3-methylbutanal—compounds not found in conventional coffee. In contrast, 2-ethyl-5-methylpyrazine and 3-ethyl-2-hydroxy-2-cyclopenten-1-one, which were present in the other two types, were absent in the elephant coffee. Overall, elephant coffee had higher levels of various pyrazines and pyridines. It matched civet coffee in caffeine content but contained lower amounts of chlorogenic acids than the other samples. Conventional coffee had the highest caffeine levels. The concentrations of gallic, cinnamic, and caffeic acids were similar across all three coffee types.

3.1. Antioxidant Activity

Elephant coffee recorded the lowest results across all antioxidant activity assays: 19.67 μg TE/mg (DPPH), 250.85 μg TE/mg (ORAC), 81.84 μg TE/mg (ABTS), 26.35 μg GAE/mg (TPC), and 1.38 μg QE/mg (TFC). These values were significantly different (p ≤ 0.01) from those of both conventional and civet coffee in the DPPH, ABTS, TPC, and TFC tests. Except for the ORAC assay, conventional coffee exhibited the highest antioxidant activity across all methods. Civet coffee showed intermediate values in most tests but achieved the highest result in the ORAC assay, at 314.19 μg TE/mg (Table 1 and Supplementary Figure S1).

3.2. Content of Caffeine and Phenolic Compounds (HPLC-UV Analysis)

All three coffee types contained similar levels of gallic, cinnamic, and caffeic acids (Table 2). Significant differences (p ≤ 0.01), however, were observed in their caffeine and chlorogenic acid content. Elephant coffee had the lowest levels of both compounds, with 0.93% caffeine and 0.33% chlorogenic acid. Conventional coffee contained the highest amount of caffeine (1.33%), while civet coffee had the highest concentration of chlorogenic acid (0.44%).

3.3. Profile of Volatile Compounds (GC-SPME-MS)

A total of 23 compounds were identified across the coffee samples. The three most abundant in all samples were furfuryl alcohol, 5-methylfurfural, and furfuryl acetate, ranging from 14.43% to 32.73% relative peak area (RPA). Notably, 2-ethyl-5-methylpyrazine and 3-ethyl-2-hydroxy-2-cyclopenten-1-one were absent in elephant coffee, while 2-methylbutanal, 2-methylfuran, and 3-methylbutanal were not detected in conventional coffee. Civet coffee contained all 24 of the compounds measured. Compared to the other two types, elephant coffee had the highest levels of 2-methylbutanal, pyrazine, and 3-ethyl-2,5-dimethylpyrazine (1.18%, 0.43%, and 3.73% RPA, respectively; the first two significant at p ≤ 0.01, the last not significant), but had relatively low amounts of 2-methylbutanoic acid and 1-acetoxy-propan-2-one (0.20% and 3.57% RPA; not significant). Both elephant and civet coffees had significantly higher pyridine levels (5.65–6.28% RPA; p ≤ 0.01) and slightly higher furfuryl acetate content (18.00–20.96% RPA; not significant) than conventional coffee. Civet coffee was notably lower in furfuryl alcohol (23.72% RPA; not significant) and furfural (4.65% RPA; p ≤ 0.01), but significantly higher in 2-ethyl-5-methylpyrazine (7.01% RPA; p ≤ 0.01) than the other two. Conventional coffee, on the other hand, had the highest amounts of 5-methylfurfural (21.21% RPA; not significant) and (+)-limonene (4.53% RPA; p ≤ 0.01). Further details are presented in Table 3.

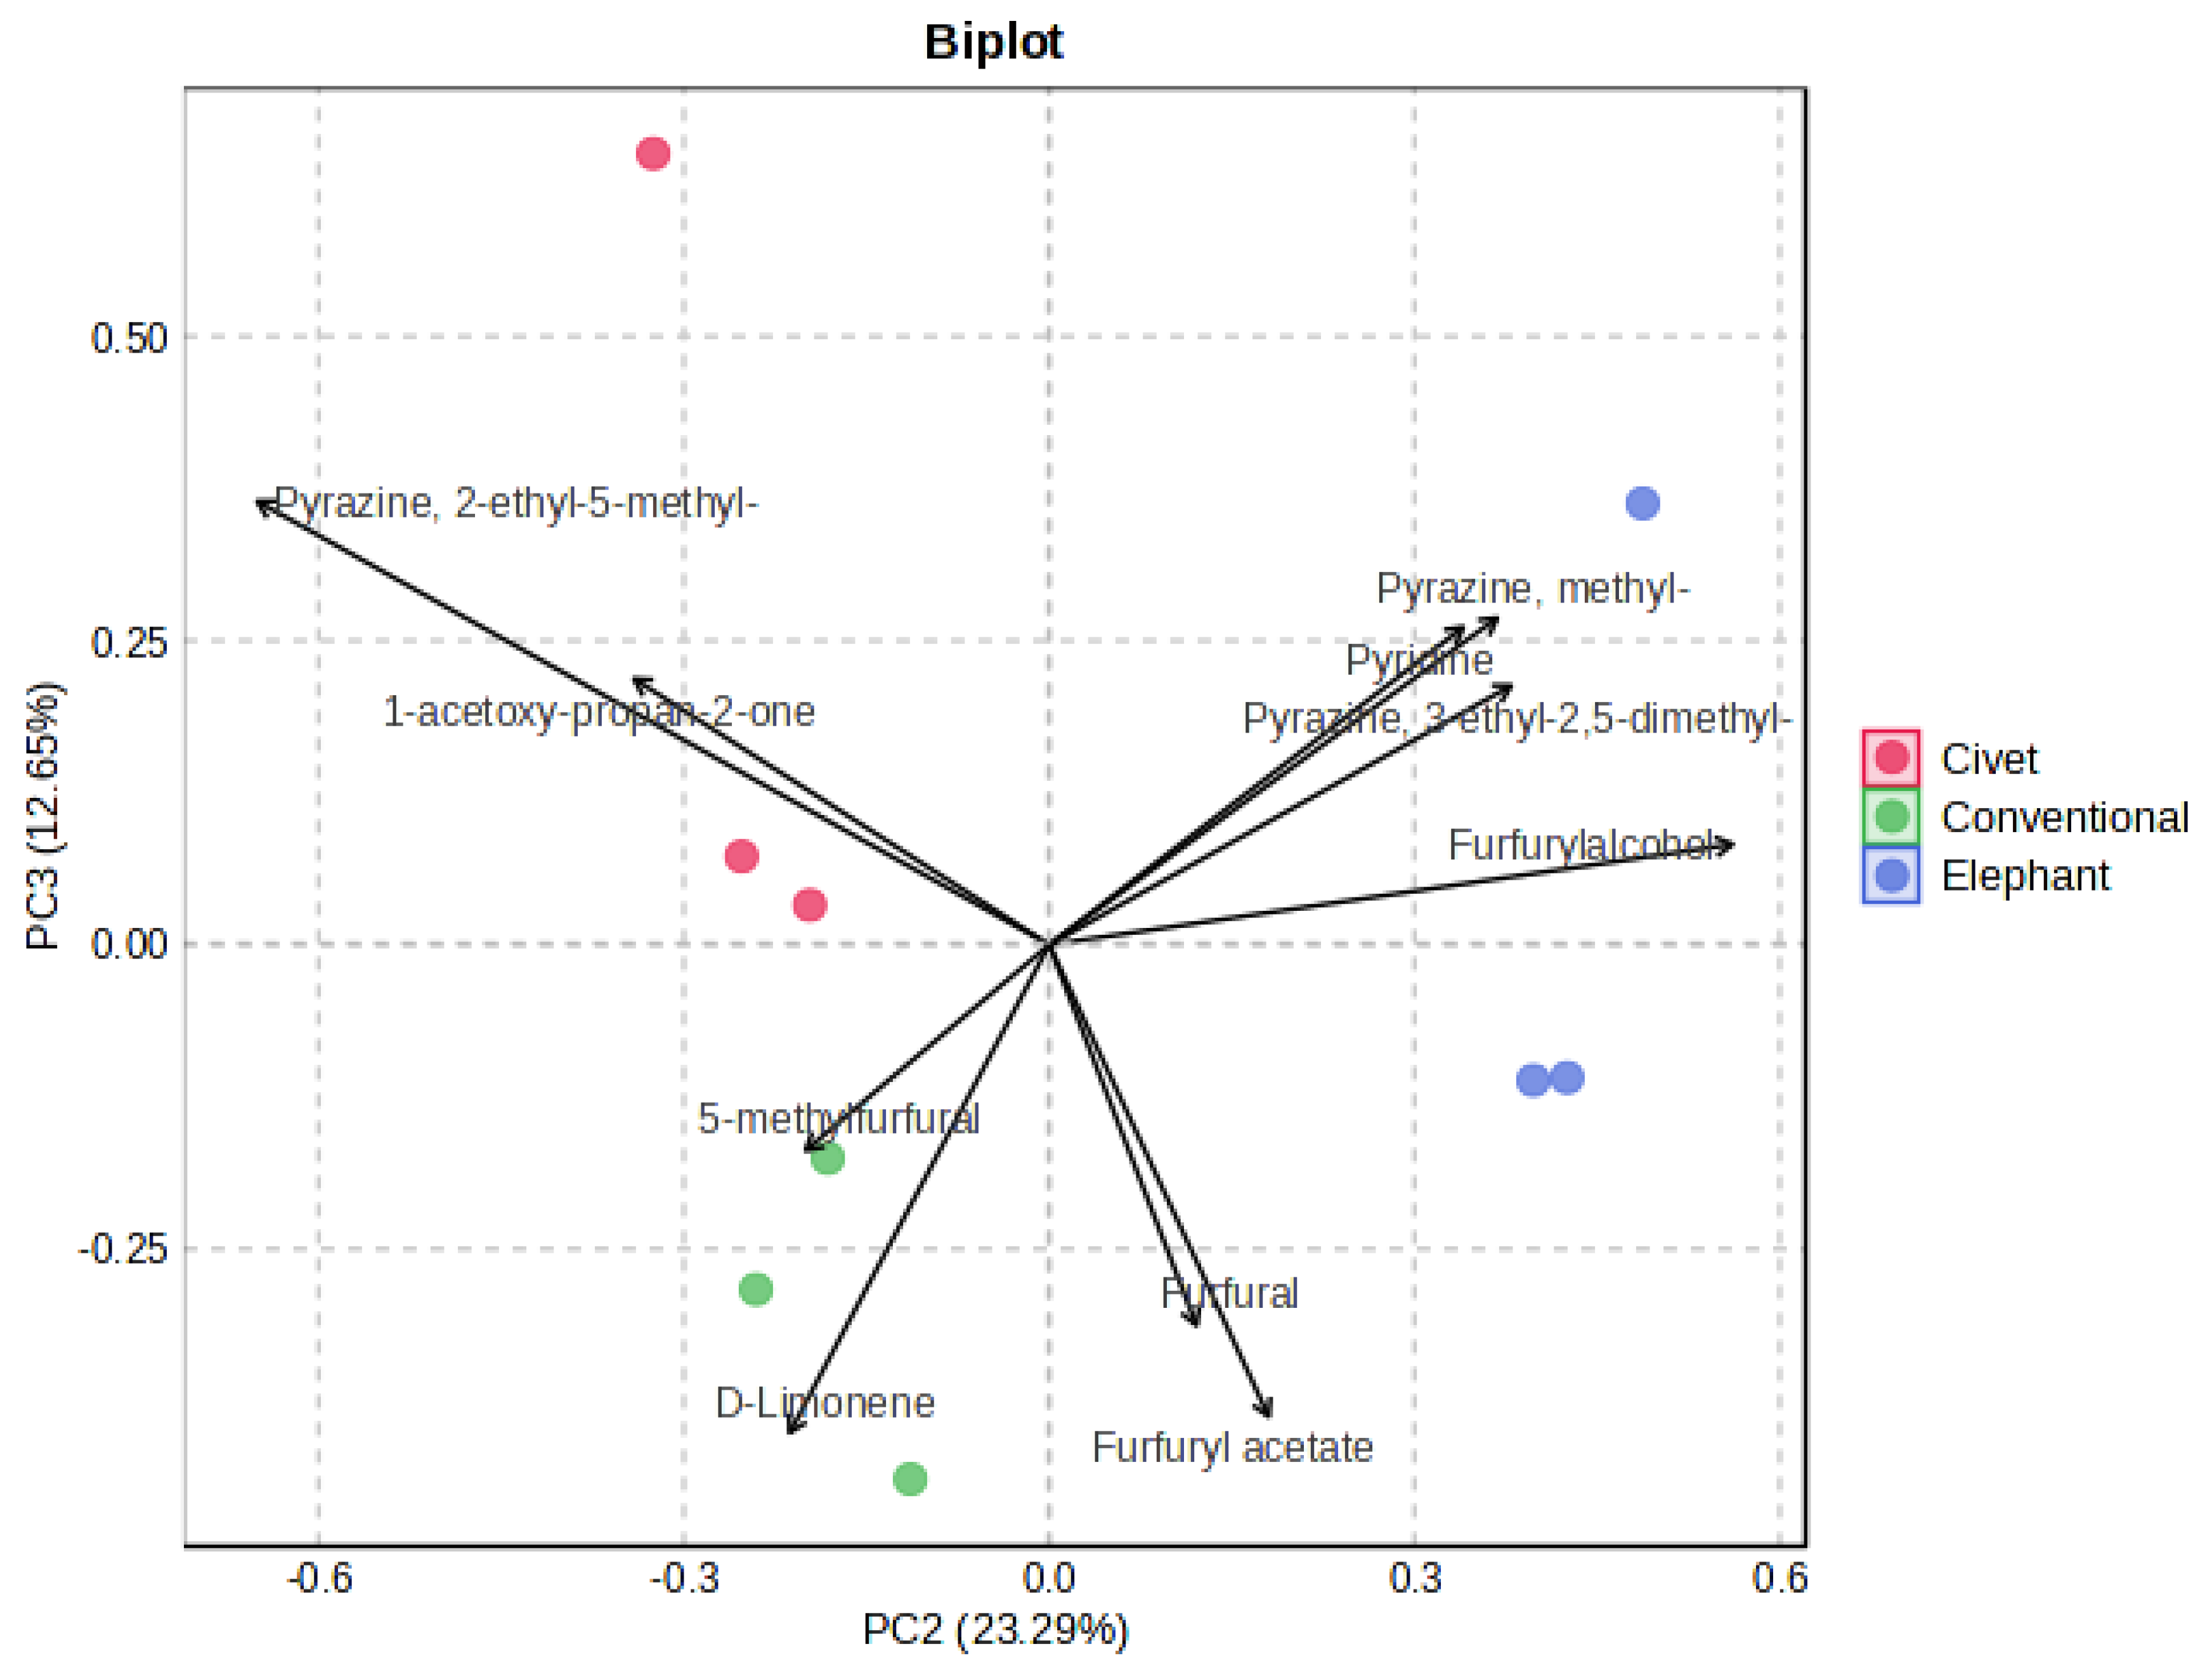
3.4. Statistical Analysis

The results of the statistical analysis are presented in Figure 1. The samples were clearly grouped into three distinct clusters based on their measured values. Principal Component Analysis (PCA) showed that PC2 and PC3 accounted for 23.29% and 12.65% of the total variance, respectively. The primary factors driving this separation were differences in the volatile compound profiles—specifically, the absence of 2-methylfuran, 3-methylbutanal, and 2-methylbutanal in conventional coffee, and the absence of 2-ethyl-5-methylpyrazine and 3-ethyl-2-hydroxy-2-cyclopenten-1-one in elephant coffee. Additional key distinguishing markers included significantly higher levels of pyridine in both elephant and civet coffee, elevated 2-ethyl-5-methylpyrazine in civet coffee, and higher concentrations of 1-acetoxy-propan-2-one in both civet and conventional coffee. Conventional coffee also contained significantly greater amounts of (+)-limonene, furfural, and 5-methylfurfural. Other compounds, such as pyrazine, 3-ethyl-2,5-dimethylpyrazine, furfuryl acetate, furfuryl alcohol, and methylpyrazine, also contributed to sample differentiation—elephant coffee appeared to be particularly rich in these. Additionally, phenolic acid content played a role: civet coffee was richer in chlorogenic acid, while conventional coffee had higher levels of caffeic and cinnamic acids. For more detailed data, see Supplementary Figures S2–S5.

4. Discussion

This study aimed to examine changes in the chemical composition of elephant dung coffee compared to more common civet coffee and conventionally processed coffee. Research on the chemical profile of elephant coffee is still very limited, with only two published studies addressing the topic [22,23]. The first study analyzed commercially available elephant coffee (Black Ivory coffee—the same brand used in our study), while the second used elephant coffee obtained through experimental means. However, to the best of our knowledge, neither study included control samples such as conventionally processed coffee or coffee derived from other animals (e.g., civets). Additionally, this is the first report to use HPLC-UV analysis for profiling caffeine and phenolic compounds in elephant coffee, alongside in vitro assessments of antioxidant potential using specific assays such as ORAC and ABTS. It is well known that coffee processing—particularly roasting—can significantly affect its chemical composition [2,24]. Ideally, green beans from all sample types should be obtained and roasted under identical conditions. Unfortunately, we were unable to acquire green beans from all commercial sources. It is also widely recognized that a coffee’s country of origin can significantly influence its chemical profile [25,26]. To minimize variability, we selected samples that were as similar as possible in key aspects: all were Arabica varieties, roasted to a medium level, and sourced from Southeast Asia.
Elephant coffee, along with civet coffee, contained lower caffeine levels and generally exhibited reduced antioxidant activity compared to conventionally processed coffee. This aligns with the idea that some caffeine and other compounds, such as antioxidants, are absorbed or broken down during digestion in the animal’s gastrointestinal tract [4,22,27]. Given that an elephant’s digestive system is much larger than a civet’s, this effect is thought to be more pronounced in elephant coffee. Interestingly, the levels of chlorogenic, gallic, cinnamic, and caffeic acids were very similar across all samples, with minimal differences. A comparable pattern was observed in other studies where civet coffee showed chlorogenic acid levels equal to or even higher than conventional coffee [28]. Although some research on green, unroasted coffee reported opposite findings [29], the differences we observed were so small that they are likely negligible from a consumer’s perspective.
The most significant differences between the samples were observed in their volatile compound profiles. Compounds such as 2-methylfuran, 3-methylbutanal, and 2-methylbutanal were absent in conventional coffee but present in both civet and elephant coffees. These compounds are typically found in higher concentrations in Robusta coffee than in Arabica [30], which may explain their absence in our conventional Arabica samples. Additionally, some studies suggest that these compounds, along with various pyrazines, may result from bacterial fermentation either before the coffee is consumed by the animal or within its gastrointestinal tract [31,32]. As such, they could serve as potential markers for animal-derived coffee—especially 2-methylbutanal, which was notably abundant in our elephant coffee sample. Conversely, the elephant coffee sample lacked 2-ethyl-5-methylpyrazine and 3-ethyl-2-hydroxy-2-cyclopenten-1-one but was relatively rich in 3-ethyl-2,5-dimethylpyrazine. Derivatives of these compounds are commonly found in coffee and contribute to its characteristic aroma [33]. Recent research has shown that levels of 2-ethyl-5-methylpyrazine and 2,5(6)-dimethylpyrazine tend to be slightly higher in fermented coffees [34,35], which may explain the elevated presence of 2-ethyl-5-methylpyrazine and 3-ethyl-2,5-dimethylpyrazine in civet coffee, given its more extensive fermentation process. Interestingly, only 3-ethyl-2,5-dimethylpyrazine was detected in elephant coffee, which might be due to 2-ethyl-5-methylpyrazine being more susceptible to degradation during digestion, considering the significantly longer gastrointestinal tract of elephants. This hypothesis is supported by evidence that a structural analogue, 2,3-diethyl-5-methylpyrazine, can be degraded by mycobacteria [36]. While this bacterium is linked to pathogenic intestinal conditions such as inflammatory bowel disease, it is likely not the only microorganism capable of breaking down this compound. Furthermore, recent studies have noted an increase in 3-ethyl-2-hydroxy-2-cyclopenten-1-one in fermented coffees [37,38]. In our study, this compound was elevated in civet coffee but absent in elephant coffee, suggesting it may undergo a similar degradation pathway as 2-ethyl-5-methylpyrazine. Additionally, unfermented coffees tend to have higher levels of furans but generally lower amounts of furfuryl acetate [34], which aligns with our findings where both civet and elephant coffees contained significantly less 5-methylfurfural but higher levels of furfuryl acetate.
It thus appears that animal-derived coffees have higher levels of certain pyrazines, aliphatic compounds, and furans, alongside lower caffeine and antioxidant contents. This trend is evident in civet coffee but seems even more pronounced in elephant coffee, likely due to the elephant’s larger gastrointestinal tract and the increased fermentation of coffee beans in their gut. This is further supported by the fact that elephants are hindgut fermenters, relying heavily on gastrointestinal microflora for digestion because of their limited production of digestive enzymes [39]. Previous studies [22,23] identified compounds such as 3-methyl-1-butanol, 2-methyl-1-butanol, 2-furfurylfuran, 3-penten-2-one, 2-hydroxymethylpyrrole, 3-methylfuran, 2-methylfuran, and 2-ethyl-3-methylpyrazine as unique to elephant coffee. While our findings partially align with this, these compounds were also detected, to some extent, in other coffee samples, suggesting they cannot be considered definitive markers. Unlike earlier research, we did not identify any conclusive markers for authenticating elephant coffee. This may be due to factors such as the limited sample size. However, it is important to note that previous studies also worked with small sample sets and similar analytical methods, like GC-MS. Therefore, we propose that authenticating elephant coffee is likely more complex than previously thought and will require more advanced, comprehensive approaches, such as metabolomics or NMR-based profiling applied to larger sample groups [40]. This remains a challenge, especially since there is currently only one commercial supplier of elephant coffee worldwide.
It thus seems that animal-derived coffee has increased content of selected pyrazines and aliphatic compounds, furans, and lower amounts of caffeine and antioxidants. This trend was also found in the case of civet coffee but appears to be more profound in elephant coffee, presumably mainly due to the larger gastrointestinal tract and increased fermentation rate of the coffee bean in the gut. This assumption is further supported by the fact that elephants (in comparison to civets) are hindgut fermenters and rely heavily on gastrointestinal microflora for digestion (fermentation), due to their limited production of digestive enzymes [39]. Previous studies [22,23] have shown that some compounds, e.g., 3-methyl-1-butanol, 2-methyl-1-butanol, 2-furfurylfuran, 3-penten-2-one, 2-hydroxymethylpyrrole, 3-methylfuran, 2-methylfuran, 2-ethyl-3-methylpyrazine, 2-hexanol are exclusively specific to elephant coffee. This is partially in correspondence with our results. However, they were also found to some extent in other samples in our study and, in our opinion, cannot be considered strictly discriminatory factors. Unlike previous studies, our research did not identify any definitive markers for authenticating elephant coffee. This outcome may stem from several factors, including a limited number of samples. However, it is worth noting that earlier studies also relied on small sample sets and employed comparable analytical techniques, such as GC-MS. Therefore, we propose that the authentication of elephant coffee may be more complex than previously suggested, requiring more advanced and comprehensive approaches, such as metabolomics or NMR-based profiling applied to larger sample cohorts [40]. Yet, this remains challenging given that only one commercial supplier of elephant coffee currently exists worldwide.

5. Conclusions

This study provides a comparative analysis of the chemical composition and antioxidant activity of conventional, civet, and elephant coffees, with particular attention to the potential for authenticating elephant-derived coffee. While distinct differences in volatile compound profiles—especially pyrazines (e.g., 3-ethyl-2,5-dimethylpyrazine, pyrazine), certain aliphatic compounds (e.g., 2- and 3-methybutanal), and furans (e.g., furfuryl acetate)—were observed across the three sample types, no individual compound or consistent group of compounds was identified that could reliably serve as a definitive marker for elephant coffee authenticity. These findings suggest that current analytical approaches, including untargeted GC-MS (including SPME variant) and targeted HPLC-UV, may be insufficient for conclusive authentication, and that it may be more difficult than previously suggested. These results may also be attributed to the limited number of samples used in this study. Future investigations should adopt a more integrative strategy, incorporating advanced metabolomics (e.g., NMR- or LC-MS-based untargeted profiling), larger and geographically diverse sample sets, and potentially sensory and microbial community analyses. Such approaches may better elucidate subtle but consistent biochemical differences that could underpin reliable authentication protocols for high-value animal-processed coffees. However, this may be challenging, as to date, there is only one commercial supplier of elephant coffee worldwide.

Supplementary Materials

The following supporting information can be downloaded at: https://www.mdpi.com/article/10.3390/beverages11030079/s1.

Author Contributions

Conceptualization, J.T.; methodology, J.T., P.M. and A.F.; formal analysis, J.H., G.H. and M.V.; data curation, J.T.; writing—original draft preparation, J.H. and J.T.; writing—review and editing, P.M. and A.F.; supervision, J.T. All authors have read and agreed to the published version of the manuscript.

Funding

This work was funded by the METROFOOD-CZ research infrastructure project (MEYS Grant No.: LM2023064 and LM2018100).

Data Availability Statement

All of the data are contained within the article and Supplementary Materials.

Conflicts of Interest

The authors declare no conflicts of interest.

References

  1. Ridder, M. Coffee Consumption Worldwide from 2012/13 to 2021/22 with a Forecast to 2022/23. Available online: https://www.statista.com/statistics/292595/global-coffee-consumption/ (accessed on 30 October 2023).
  2. Dewick, P.M. Medicinal Natural Products: A Biosynthetic Approach, 3rd ed.; Wiley & Sons: Chichester, UK, 2009. [Google Scholar]
  3. Febrianto, N.A.; Zhu, F. Coffee Bean Processing: Emerging Methods and Their Effects on Chemical, Biological and Sensory Properties. Food Chem. 2023, 412, 135489. [Google Scholar] [CrossRef]
  4. Farag, M.A.; Mohamed, T.A.; El-Hawary, E.A.; Abdelwareth, A. Metabolite Profiling of Premium Civet Luwak Bio-Transformed Coffee Compared with Conventional Coffee Types, as Analyzed Using Chemometric Tools. Metabolites 2023, 13, 173. [Google Scholar] [CrossRef]
  5. Adadi, P.; Mensah, E.O.; Blay, B.; Ahmmed, M.K.; Sumaiya, K.; Agyei, D.; Kebede, B. Advancements in Civet Coffee Production and Analytical Techniques: From Aroma Profiling to Market Dynamics and Ethical Considerations. Trends Food Sci. Technol. 2024, 154, 104772. [Google Scholar] [CrossRef]
  6. Jumhawan, U.; Putri, S.P.; Bamba, T.; Fukusaki, E. Quantification of Coffee Blends for Authentication of Asian Palm Civet Coffee (Kopi Luwak) via Metabolomics: A Proof of Concept. J. Biosci. Bioeng. 2016, 122, 79–84. [Google Scholar] [CrossRef]
  7. Wang, X.; Lim, L.-T.; Fu, Y. Review of Analytical Methods to Detect Adulteration in Coffee. J. AOAC Int. 2020, 103, 295–305. [Google Scholar] [CrossRef]
  8. Toci, A.T.; Farah, A.; Pezza, H.R.; Pezza, L. Coffee Adulteration: More than Two Decades of Research. Crit. Rev. Anal. Chem. 2016, 46, 83–92. [Google Scholar] [CrossRef]
  9. Downey, G. Advances in Food Authenticity Testing, 1st ed.; Woodhead Publishing: Cambridge, UK, 2016. [Google Scholar]
  10. Sharma, O.P.; Bhat, T.K. DPPH Antioxidant Assay Revisited. Food Chem. 2009, 113, 1202–1205. [Google Scholar] [CrossRef]
  11. Re, R.; Pellegrini, N.; Proteggente, A.; Pannala, A.; Yang, M.; Rice-Evans, C. Antioxidant Activity Applying an Improved ABTS Radical Cation Decolorization Assay. Free Radic. Biol. Med. 1999, 26, 1231–1237. [Google Scholar] [CrossRef]
  12. Ou, B.; Hampsch-Woodill, M.; Prior, R.L. Development and Validation of an Improved Oxygen Radical Absorbance Capacity Assay Using Fluorescein as the Fluorescent Probe. J. Agric. Food Chem. 2001, 49, 4619–4626. [Google Scholar] [CrossRef]
  13. Held, P. Performing Oxygen Radical Absorbance Capacity Assays with synergyTMHT: ORAC Antioxidant Tests. Application Note; Biotek Instruments: Winooski, VT, USA, 2005. [Google Scholar]
  14. Singleton, V.L.; Orthofer, R.; Lamuela-Raventos, R.M. Analysis of Total Phenols and Other Oxidation Substrates and Antioxidants by Means of Folin-Ciocalteu Reagent. Methods Enzymol. 1998, 299, 152–178. [Google Scholar]
  15. Christ, B.; Müller, K.H. On the Serial Determination of the Content of Flavonol Derivatives in Drugs. Arch. Pharm. 1960, 293, 1033–1042. [Google Scholar] [CrossRef]
  16. Tauchen, J.; Marsik, P.; Kvasnicova, M.; Maghradze, D.; Kokoska, L.; Vanek, T.; Landa, P. In Vitro Antioxidant Activity and Phenolic Composition of Georgian, Central and West European Wines. J. Food Compos. Anal. 2015, 41, 113–121. [Google Scholar] [CrossRef]
  17. Frankova, A.; Manourova, A.; Kotikova, Z.; Vejvodova, K.; Drabek, O.; Riljakova, B.; Famera, O.; Ngula, M.; Ndiyoi, M.; Polesny, Z.; et al. The Chemical Composition of Oils and Cakes of Ochna Serrulata (Ochnaceae) and Other Underutilized Traditional Oil Trees from Western Zambia. Molecules 2021, 26, 5210. [Google Scholar] [CrossRef]
  18. Várady, M.; Tauchen, J.; Fraňková, A.; Klouček, P.; Popelka, P. Effect of Method of Processing Specialty Coffee Beans (Natural, Washed, Honey, Fermentation, Maceration) on Bioactive and Volatile Compounds. LWT 2022, 172, 114245. [Google Scholar] [CrossRef]
  19. Kováts, E. Gas-Chromatographische Charakterisierung Organischer Verbindungen. Teil 1: Retentionsindices Aliphatischer Halogenide, Alkohole, Aldehyde Und Ketone. Helv. Chim. Acta 1958, 41, 1915–1932. [Google Scholar] [CrossRef]
  20. Linstrom, P.J.; Mallard, W.G. (Eds.) NIST Chemistry WebBook, NIST Standard Reference Database Number 69; National Institute of Standards and Technology: Gaithersburg, MD, USA, 2024. [Google Scholar]
  21. Pang, Z.; Lu, Y.; Zhou, G.; Hui, F.; Xu, L.; Viau, C.; Spigelman, A.F.; MacDonald, P.E.; Wishart, D.S.; Li, S.; et al. MetaboAnalyst 6.0: Towards a Unified Platform for Metabolomics Data Processing, Analysis and Interpretation. Nucleic Acids Res. 2024, 52, W398–W406. [Google Scholar] [CrossRef]
  22. Thammarat, P.; Kulsing, C.; Wongravee, K.; Leepipatpiboon, N.; Nhujak, T. Identification of Volatile Compounds and Selection of Discriminant Markers for Elephant Dung Coffee Using Static Headspace Gas Chromatography—Mass Spectrometry and Chemometrics. Molecules 2018, 23, 1910. [Google Scholar] [CrossRef]
  23. Haile, M.; Bae, H.M.; Kang, W.H. Comparison of the Antioxidant Activities and Volatile Compounds of Coffee Beans Obtained Using Digestive Bio-Processing (Elephant Dung Coffee) and Commonly Known Processing Methods. Antioxidants 2020, 9, 408. [Google Scholar] [CrossRef]
  24. Wei, F.; Tanokura, M. Chemical Changes in the Components of Coffee Beans during Roasting. In Coffee in Health and Disease Prevention; Preedy, V.R., Ed.; Academic Press: Cambridge, MA, USA, 2015; pp. 83–91. [Google Scholar]
  25. Costa Freitas, A.M.; Mosca, A.I. Coffee Geographic Origin-An Aid to Coffee Differentiation. Food Res. Int. 1999, 32, 565–573. [Google Scholar] [CrossRef]
  26. Risticevic, S.; Carasek, E.; Pawliszyn, J. Headspace Solid-Phase Microextraction-Gas Chromatographic-Time-of-Flight Mass Spectrometric Methodology for Geographical Origin Verification of Coffee. Anal. Chim. Acta 2008, 617, 72–84. [Google Scholar] [CrossRef]
  27. Iswanto, T.; Shovitri, M.; Altway, A.; Widjaja, T.; Lisdiyanti, P.; Putra, A.P. Assessment of Caffeine-Degrading Ability on Bacterial Strains Klebsiella Sp. Isolated from Feces of Asian Palm Civet (Luwak). Int. J. Technol. 2023, 14, 100–108. [Google Scholar] [CrossRef]
  28. Nishiguchi, Y.; Goromaru-shinkai, M.; Kuroda, J.; Kiuchi, S.; Ihara, H. Estimation of Protein, Total Polyphenol, Chlorogenic Acid, Caffeine, and Caffeic Acid Contents in Indonesian Palm Civet Coffee. Int. J. Anal. Bio-Sci. 2017, 5, 53–56. [Google Scholar]
  29. Febrina, L.; Happyana, N.; Syah, Y.M. Metabolite Profiles and Antidiabetic Activity of the Green Beans of Luwak (Civet) Coffees. Food Chem. 2021, 355, 129496. [Google Scholar] [CrossRef]
  30. Leino, M.; Kaitaranta, J.; Kallio, H. Comparison of Changes in Headspace Volatiles of Some Coffee Blends during Storage. Food Chem. 1992, 43, 35–40. [Google Scholar] [CrossRef]
  31. Sakpetch, P.; Benchama, O.; Masniyom, P.; Salaipeth, L.; Kanjan, P. Physicochemical Characteristics and Flavor Profiles of Fermented Fish Sauce (Budu) during Fermentation in Commercial Manufacturing Plant. J. Food Sci. Technol. 2022, 59, 693–702. [Google Scholar] [CrossRef] [PubMed]
  32. Pennington, T.; Eshima, J.; Smith, B.S. Identification of Volatile Metabolites Produced from Levodopa Metabolism by Different Bacteria Strains of the Gut Microbiome. BMC Microbiol. 2024, 24, 260. [Google Scholar] [CrossRef]
  33. Wang, Y.; Wang, W.; Zhou, Q.; Cheng, C.; Xing, Z.; Zhou, Y.; Liu, X.; Hua, S.; Wei, W.; Tan, J.; et al. Characterization of Key Aroma Compounds in Cold Brew Coffee Prepared by Negative-Pressure Extraction Technology and Its Changes during Storage. LWT 2024, 197, 115919. [Google Scholar] [CrossRef]
  34. Wu, H.; Viejo, C.G.; Fuentes, S.; Dunshea, F.R.; Suleria, H.A.R. The Impact of Wet Fermentation on Coffee Quality Traits and Volatile Compounds Using Digital Technologies. Fermentation 2023, 9, 68. [Google Scholar] [CrossRef]
  35. Elhalis, H.; Cox, J.; Frank, D.; Zhao, J. Microbiological and Chemical Characteristics of Wet Coffee Fermentation Inoculated With Hansinaspora Uvarum and Pichia Kudriavzevii and Their Impact on Coffee Sensory Quality. Front. Microbiol. 2021, 12, 713969. [Google Scholar] [CrossRef]
  36. Rappert, S.; Botsch, K.C.; Nagorny, S.; Francke, W.; Müller, R. Degradation of 2,3-Diethyl-5-Methylpyrazine by a Newly Discovered Bacterium, Mycobacterium Sp. Strain DM-11. Appl. Environ. Microbiol. 2006, 72, 1437–1444. [Google Scholar] [CrossRef]
  37. Shen, X.; Wang, Q.; Wang, H.; Fang, G.; Li, Y.; Zhang, J.; Liu, K. Microbial Characteristics and Functions in Coffee Fermentation: A Review. Fermentation 2025, 11, 5. [Google Scholar] [CrossRef]
  38. Scognamiglio, J.; Jones, L.; Letizia, C.S.; Api, A.M. Fragrance Material Review on 3-Ethyl-2-Hydroxy-2-Cyclopenten-1-One. Food Chem. Toxicol. 2012, 50, S646–S649. [Google Scholar] [CrossRef]
  39. Feng, X.; Hua, R.; Zhang, W.; Liu, Y.; Luo, C.; Li, T.; Chen, X.; Zhu, H.; Wang, Y.; Lu, Y. Comparison of the Gut Microbiome and Resistome in Captive African and Asian Elephants on the Same Diet. Front. Vet. Sci. 2023, 10, 986382. [Google Scholar] [CrossRef]
  40. Nagana Gowda, G.A.; Raftery, D. NMR-Based Metabolomics. Adv. Exp. Med. Biol. 2021, 1280, 19–37. [Google Scholar] [CrossRef]
Figure 1. Score plot of three sample groups—civet coffee (red), conventional coffee (green), and elephant coffee (blue)—based on a total of nine samples. Ten variables with the greatest contribution to the separation in the coordinate system of PC2 and PC3 are expressed as concentrations [mg/g DW] and were Pareto-scaled.
Beverages 11 00079 g001
Table 1. Antioxidant activity and total phenolic and flavonoid contents (mean ± SD) of the tested coffee samples.
SampleDPPHORACABTSTPCTFC
μg TE/mgμg GAE/mgμg QE/mg
Conventional coffee44.14 ± 13.28 a289.99 ± 75.93 a 125.97 ± 14.22 a 34.91 ± 4.88 a2.15 ± 0.46 a
Civet coffee32.26 ± 7.97 ab314.19 ± 79.60 a104.78 ± 15.76 b32.69 ± 10.64 b1.73 ± 0.40 ab
Elephant coffee19.67 ± 2.86 b250.85 ± 60.35 a 81.84 ± 7.78 c26.35 ± 3.08 b1.38 ± 0.28 b
Different letters indicate the significant differences within the columns according to Tukey’s HSD test at the p ≤ 0.01 significance level.
Table 2. Chemical composition (mean ± SD) of the tested coffee samples.
SampleCaffeineChlorogenic AcidGallic AcidCinnamic AcidCaffeic Acid
% of dry weight
Conventional coffee1.33 ± 0.13 a0.36 ± 0.04 ab0.017 ± 0.0006 a0.011 ± 0.0015 a0.020 ± 0.002 a
RSD (%)10.1011.063.8913.2511.03
Civet coffee0.93 ± 0.07 b0.44 ± 0.03 a0.016 ± 0.0001 a0.010 ± 0.0004 a0.019 ± 0.001 a
RSD (%)7.406.810.933.576.07
Elephant coffee0.93 ± 0.03 b0.33 ± 0.01 b0.018 ± 0.0003 a0.009 ± 0.0001 a0.017 ± 0.001 a
RSD (%)2.874.021.671.044.97
Different letters indicate the significant differences within the columns according to Tukey’s HSD test at the p ≤ 0.01 significance level. Results are obtained as an average of three technical replicates (i.e., from three separately prepared extracts).
Table 3. Chemical profile of volatile compounds found in tested coffee samples.
CompoundRI (Measured) 1RI (Literature) 2Content (% RPA)
Conventional CoffeeCivet CoffeeElephant Coffee
2-methylfuran611603n.d.0.64 ± 0.06 a0.94 ± 0.03 a
acetic acid6186021.33 ± 0.18 a1.14 ± 0.19 a1.55 ± 0.23 a
3-methylbutanal647649n.d.0.11 ± 0.01 a0.185 ± 0.004 a
2-methylbutanal654656n.d.0.64 ± 0.28 a1.18 ± 0.32 a
pentan-2,3-dione6846960.13 ± 0.02 a0.28 ± 0.12 a0.30 ± 0.11 a
propanoic acid7017020.34 ± 0.15 a0.21 ± 0.06 a0.36 ± 0.09 a
pyrazine7246720.20 ± 0.05 a0.28 ± 0.03 ab0.43 ± 0.03 b
pyridine7377402.68 ± 0.44 a5.65 ± 0.78 b6.28 ± 0.06 b
methylpyrazine8248246.97 ± 0.21 a7.26 ± 0.56 a8.84 ± 1.01 a
furfural8398298.63 ± 0.28 a4.65 ± 0.36 b7.00 ± 0.62 a
furfuryl alcohol86286630.79 ± 1.9523.72 ± 4.1432.73 ± 3.14
1-acetoxy-propan-2-one8728764.86 ± 0.355.12 ± 1.163.57 ± 0.38
2-methylbutanoic acid878886.20.32 ± 0.050.36 ± 0.120.20 ± 0.03
furfuryl formate,9099021.63 ± 0.391.52 ± 0.451.09 ± 0.17
5-methylfurfural96896921.21 ± 2.3714.43 ± 2.2315.77 ± 2.25
furfuryl acetate99699814.46 ± 0.0020.96 ± 0.5618.00 ± 0.03
2-ethyl-5-methylpyrazine100310042.69 ± 0.39 a7.01 ± 1.06 bn.d.
N-acetyl-4H-pyridine102410381.28 ± 0.130.86 ± 0.131.13 ± 0.25
(+)-limonene103310354.53 ± 0.63 a0.41 ± 0.06 b0.82 ± 0.21 b
2,3-dimethyl-2-cyclopenten-1-one104410520.95 ± 0.160.81 ± 0.140.67 ± 0.21
1-(1H-pyrrol-2-yl)-ethanone106710630.37 ± 0.020.44 ± 0.080.46 ± 0.06
3-ethyl-2,5-dimethylpyrazine108110831.94 ± 0.212.16 ± 0.383.73 ± 0.63
3-ethyl-2-hydroxy-2-cyclopenten-1-one109810820.48 ± 0.03 a0.73 ± 0.02 bn.d.
1 Retention indices obtained from the NIST (National Institute of Standards and Technology) standard reference database [20]; 2 retention indices calculated from retention times of C6-C30 n-alkanes mixture [19]; different letters indicate the significant differences within the columns according to Tukey’s HSD test at the p ≤ 0.01 significance level. Retention times and CAS numbers of the identified compounds are listed in Supplementary Table S2.
Disclaimer/Publisher’s Note: The statements, opinions and data contained in all publications are solely those of the individual author(s) and contributor(s) and not of MDPI and/or the editor(s). MDPI and/or the editor(s) disclaim responsibility for any injury to people or property resulting from any ideas, methods, instructions or products referred to in the content.

