1. Introduction
Wine is as ancient as the world itself. It is not only an integral part of people’s daily lives but is also present in mythology, religion, and the arts, as well as being a subject of political and societal discussions, fashion trends, and more [
1]. Throughout the history of civilization, a well-defined geographical zone of wine production can be identified. The global wine market is conventionally divided into two groups of producing countries. The first group consists of countries with centuries-old traditions and well-established practices, commonly referred to as the “Old World” (Europe). The second group embraces a more modern approach to wine production and distribution, encompassing countries from the “New World” (South America, Australia, Asia—including China—the United States, and others) [
2].
Wine is a universal metaphor in European culture and civilization. No other beverage has exerted such a profound influence on the values of European societies [
1] (p. 11). It is no coincidence that countries from the European Union (EU) currently hold leading positions as the world’s foremost wine producers and exporters [
3,
4]. The EU represents a market that accounts for 43% to 47% of the world’s consumption for the period 2019–2023 [
5].
With a vineyard area of approximately 62,000 hectares and an average annual production of 800,000 hectoliters of wine, Bulgaria can be classified as a small-scale wine producer within the EU [
5,
6]. Once a leading global wine producer and exporter in the 1980s, Bulgaria has since experienced a decline and currently ranks 10th in wine production and 14th in wine export among EU member states [
2,
7]. Bulgaria is home to approximately 362 active wine producers. “Active” refers to producers listed in the official register of the Ministry of Agriculture and Food of Bulgaria. Wine producers can be broadly classified into seven groups based on their vat capacity: up to 100 hl, 100–500 hl, 1000–5000 hl, 5000–10,000 hl, 10,000–100,000 hl, and over 100,000 hl [
8]. With the adoption of the National Strategy for the Development of Viticulture and Winemaking (2005–2025) and the National Strategy for Sustainable Agricultural Development of the Republic of Bulgaria (2014–2020), the country emphasized the wine industry’s importance as a key sub-sector of food and beverages [
9,
10].
Numerous studies have demonstrated that online customer reviews are a crucial source of information for both companies and product buyers [
11,
12,
13]. From a corporate perspective, such information can stimulate the development and enhancement of innovations, ensure better value-for-money offerings, improve delivery conditions, and more—all in alignment with customer needs and preferences. From the consumers’ perspective, these online reviews serve as essential references for making informed decisions [
14]. A substantial body of scholarly research on online reviews has already been established [
15]. This research primarily focuses on product or service quality [
16,
17,
18], the analysis of review usefulness [
19,
20], the development of effective review filtering systems [
13], text sentiment analysis [
12,
15], the construction of fake review indices [
21], and other related topics. In the context of wine reviews, the objective is to retrieve useful information in a systematic and traceable manner, thereby assisting customers to make well-informed purchase decisions [
22]. Research on online wine reviews available on specialized wine websites remains relatively limited. A plausible explanation for this scarcity is that wine is a complex and difficult product, which makes it challenging for people with little knowledge to choose the desired wine [
23]. Nevertheless, it is important to highlight the pioneering work of Chen et al., who analyzed the consistency of wine judges using a large-scale dataset of over 100,000 wine reviews in the Computational Wine Wheel [
24]. Similarly, Kotonya et al. examined how wine characteristics, the language used in wine reviews, and the distribution of wine ratings can be combined to develop prediction and recommendation models [
25]. Martinez et al. proposed a method for a wine recommendation system that utilizes multidimensional clustering and unsupervised learning methods [
26]. Although the application of emerging technologies such as Machine Learning (ML) has gained traction in recent years, prior studies indicate a persistent gap in researchers’ understanding of appropriate development techniques, model usage, and algorithm interpretation [
27]. Nonetheless, a growing number of recent works have addressed this gap by analyzing large-scale textual and quantitative data from specialized wine platforms. These studies have employed ML models for wine ranking and selection [
14], performed lexical analysis of expert and amateur wine reviews [
23], explored the thematic overlap between consumer reviews and wine label content [
28], and identified key sensory descriptors of wine [
29]. Furthermore, earlier research highlights that the language of wine reviews exhibits consistent and informative structures, which can be effectively leveraged to classify wines by attributes such as color, grape variety, origin, and quality [
30,
31]. Techniques such as Text Mining (TM) and ML, including models like BERT and Doc2Vec, have demonstrated high predictive accuracy in this domain [
22,
32]. Moreover, bilingual analysis offers a unique perspective on cultural and linguistic variation in the description of sensory attributes [
33]. There is also a growing interest in combining linguistic and price-related data to enhance recommendation systems and inform marketing strategies [
25,
34]. While prior studies typically rely on a single machine learning model and focus on narrowly defined tasks such as classification or regression [
22,
32], our study adopts a multi-model framework integrating classification, regression, and clustering techniques. Four distinct models were developed for both classification and prediction tasks, and their performance was comparatively evaluated. Furthermore, in contrast to earlier work, the present study incorporates segmental and structural analysis of wine descriptions based on type, price, rating, and stylistic attributes, thereby enabling a more nuanced profiling of Bulgarian wines. In addition, the dataset includes expert-authored reviews of Bulgarian wines published on the DiVino online platform—a corpus that, to the best of our knowledge, has not previously been the subject of academic analysis. As no comparable methodological framework has been applied to Bulgarian wines thus far, this study addresses a notable gap in the literature and contributes novel empirical insights to the field.
The aim of this study is to apply contemporary methods from the fields of TM, Sentiment Analysis (SA), and ML to analyze bilingual wine descriptions (in Bulgarian and English) and to predict wine ratings and perceived value based on linguistic features.
The findings may serve wine enthusiasts, sommeliers, wholesalers, and retailers. Specifically, winemakers could benefit from these results in developing marketing communication campaigns, pricing strategies, market segmentation, and other related activities.
We address the following research questions:
RQ1: Is it possible to use natural language wine descriptions to predict expert ratings using machine learning models?
RQ2: Is it possible to effectively classify wines into stylistic categories using semantic text descriptions obtained from transformer-based models?
RQ3: How can classification and regression models compare in predicting wine quality based on textual structural features?
RQ4: What recommendations can be made to wine producers in Bulgaria from conducting unsupervised clustering of wine descriptions in terms of thematic structure and stylistic differentiation?
RQ5: Can different types of wines (red, white, rosé, etc.) be grouped into specific product segments based on description length, mood, and price?
RQ6: Do manually defined style labels agree with the clusters obtained based on different lexical features in wine narratives?
2. Materials and Methods
2.1. Data Description
This study collected and analyzed a dataset of Bulgarian wines. The data were extracted via web scraping [
35] from Bulgaria’s largest wine rating website DIVINO. The scraping was performed using the Octoparse software (version 8.7.4) [
36]. DiVino is a platform to wine journalism and wine culture [
37]. The wine descriptions and ratings featured on the site are provided by specialists in the field. DiVino divides Bulgaria into nine key wine regions: Danubian Plain, Eastern Thrace, Northern Black Sea, Northwestern Bulgaria, Rose Valley, Sakar and Eastern Rhodopes, Southern Black Sea, Struma Valley and Western Thrace. Legally, however, Bulgaria officially recognizes only two regions for wine production: the Danubian Plain and the Thracian Plain [
38]. Wineries are required by law to indicate on their labels that the wine originates from one of these two broad regions. Nevertheless, Bulgaria boasts impressive diversity in topography, climate, soils, and winemaking traditions. This diversity has led DiVino to delineate nine distinct wine regions, providing a more detailed and nuanced reflection of the country’s wine landscape.
DiVino’s tasting team consists only of wine experts. Each wine is rated out of 100 points. DiVino tastings are blind—the team only knows the varietal (or blend or its main ingredients) and the vintage of the wine. The DiVino rating scale is as follows: DiVino Rating 5 (100–96 Points): An almost perfect wine. The price is irrelevant; DiVino Rating 4 (95–91 Points): An exceptional wine, a classic in its style; DiVino Rating 3 (90–87 Points): An excellent wine with a distinct character; DiVino Rating 2 (86–83 Points): A very good wine with clear merits; DiVino Rating 1 (82–78 Points): A good wine, especially if it is affordable; DiVino Rating 0 (Under 78 Points): No rating assigned [
37].
A comprehensive overview of the primary dataset’s characteristics, including their categories, distribution, and completeness, is provided in
Table 1.
In order to achieve the set goal, modern software tools for text data processing and machine learning are used. All analyses were conducted in the Google Colab environment, a cloud platform that provides free access to computational resources, including GPUs, and is particularly suitable for interactive development and sharing of Python-based projects.
The underlying programming language is Python 3.11, which offers a rich ecosystem of libraries for text processing, analysis, and modeling. The following libraries were used in the research (see
Table 2).
These data and tools provide the basis for further preprocessing, feature extraction, and machine learning tasks, which are detailed in the following sections.
2.2. Text Preprocessing Techniques
Prior to the application of semantic models and machine learning algorithms, a sequence of standard text preprocessing techniques was employed to prepare the raw textual data for analysis. These preprocessing steps are crucial for ensuring consistency, reducing noise, and enhancing the semantic interpretability of the wine descriptions.
The initial step involved tokenization, whereby each description was segmented into individual words or tokens. This was followed by the removal of stop-words, which include high-frequency function words (such as articles, prepositions, and conjunctions) that do not convey domain-specific meaning. Additionally, a custom list of parasitic or redundant words was compiled and eliminated to further refine the dataset.
Subsequently, lemmatization was applied using the NLTK library, enabling the reduction in words to their base or dictionary form (lemmas). This process facilitates a more accurate aggregation of terms with similar meanings. It is important to note that stemming was deliberately omitted, as it can result in overly aggressive truncation of words, potentially obscuring semantic nuance and context.
These preprocessing operations were carried out separately for the wine descriptions in both Bulgarian and English, ensuring bilingual compatibility. The processed texts formed the basis for all subsequent lexical, sentiment, and clustering analyses presented in the Results section.
Following these preprocessing steps, the resulting clean texts were either vectorized using TF-IDF for lexical analyses or transformed into contextual embeddings using pre-trained BERT models for downstream machine learning tasks.
2.3. Text Feature Engineering and Vectorization
Following the preprocessing stage, two main approaches were applied to transform the cleaned wine descriptions into numerical feature representations suitable for downstream analysis.
For classical lexical and clustering tasks, Term Frequency-Inverse Document Frequency (TF-IDF) vectorization was used. This method emphasizes terms that are frequent within individual documents but infrequent across the entire corpus, enhancing the representation of stylistically or semantically specific words. The TF-IDF matrices were used for co-occurrence analysis, unsupervised clustering (K-Means), and lexical similarity computations.
To represent the semantic content of the wine descriptions, this study employs BERT (Bidirectional Encoder Representations from Transformers), a state-of-the-art language representation model based on transformer architecture. The pre-trained model used is bert-base-uncased, implemented via the HuggingFace transformers library. BERT captures deep contextual dependencies by analyzing the entire sentence bidirectionally, i.e., considering both preceding and following words during the encoding of a given token. This enables the generation of dense, context-aware vector embeddings of each wine description.
The wine descriptions, preprocessed in both English and Bulgarian, are passed through the BERT tokenizer and encoder, resulting in fixed-length embeddings of 768 dimensions. These embeddings are extracted from the [CLS] token output, which is commonly used as a sentence-level representation. The resulting vectorized texts serve as inputs to downstream supervised learning models for classification and regression tasks.
In the context of this study, BERT embeddings are particularly useful for wine style classification and quality score prediction, as they encode not only lexical content but also syntactic and stylistic nuances—essential in expert wine descriptions. The classification task involves mapping descriptions to predefined stylistic categories (e.g., Bold and Tannic, Fresh and Crisp), while the regression task estimates the expert-assigned quality score based on the semantic vector representation.
Compared to traditional text vectorization approaches (e.g., Bag-of-Words, TF-IDF), transformer-based embeddings offer significantly improved performance by capturing semantic similarity, discourse structure, and connotation, making them suitable for tasks that involve nuanced expert language such as wine tasting notes.
The embeddings allowed the application of various machine learning models (e.g., Logistic Regression, Random Forest, XGBoost, MLP) on text data alone or in combination with structured features (e.g., price, vintage, region). Dimensionality reduction techniques such as PCA (Principal Component Analysis) were further applied to visualize the semantic space of the encoded descriptions.
2.4. Classification Tasks Based on Text and Structured Features
Several classification tasks were designed to assess the ability of machine learning algorithms to categorize wines based on textual descriptions and selected structured attributes. Each task is described below, including target definition, input features, and modeling approach.
2.4.1. Premium Wine Classification
This binary classification task aimed to identify wines of high quality based on the expert rating score. A binary label was assigned where wines with a score of 87 points or higher were categorized as premium, and the rest as non-premium. The input features consisted of:
Contextual embeddings of the wine descriptions (generated using BERT);
Numerical features such as price and alcohol content;
Categorical variables such as grape variety and origin (vectorized via one-hot encoding).
The classification models applied included Logistic Regression, Support Vector Machine (SVM), Random Forest, and XGBoost. Class balancing techniques were applied to address the moderate imbalance in label distribution. The performance of the models was evaluated using standard classification metrics including accuracy, precision, recall, and F1-score.
2.4.2. Supervised Wine Style Classification
A supervised classification model was developed to categorize wine descriptions into stylistic groups using a combination of pre-trained BERT embeddings and Logistic Regression. The target labels were defined based on domain knowledge and the most frequent lexical patterns identified in the heatmap analysis. Descriptions were manually annotated according to predefined style categories, guided by characteristic keywords and expressions found in the corpus.
The four stylistic classes were:
Bold and Tannic (e.g., dark, chocolate, black, tannins)
Fresh and Crisp (e.g., citrus, acidity, light, fresh)
Fruity and Smooth (e.g., soft, juicy, ripe)
Aromatic and Floral (e.g., floral, perfume, rose, elderflower)
Only the textual descriptions were used as input. Each description was encoded using the [CLS] token from the final hidden layer of bert-base-uncased and used to train a Logistic Regression classifier. Performance was evaluated using multi-class accuracy and confusion matrices. The model serves as a bridge between the unsupervised discovery of the latent structure and targeted, interpretable stylistic labeling. This multimodal approach aligns with current research in data-driven wine quality assessment. For instance, Hategan et al. [
39] explored logistic regression and k-nearest neighbors for classifying wines based on 1H-NMR spectral data—an alternative to text-based descriptors.
2.5. Regression Modeling: Predicting Wine Scores
In addition to classification, a regression task was developed to predict the expert rating score of a wine as a continuous variable. The target was the Points attribute, ranging from 75 to 100, based on expert evaluations published on the DiVino platform.
The regression models were trained using various combinations of structured and unstructured features:
Numerical features such as price, alcohol percentage, vintage (when available), and numerical encodings of categorical variables (e.g., country, grape variety).
Textual features, including BERT embeddings of the wine descriptions (768 dimensions), used either alone or in combination with structured features.
Several regression algorithms were tested, including:
Linear Regression;
Support Vector Regression (SVR);
Random Forest Regressor;
Extreme Gradient Boosting (XGBoost Regressor);
Multi-Layer Perceptron Regressor (MLP).
The models were implemented using scikit-learn and xgboost libraries in Python 3.11. Evaluation was based on standard metrics such as Mean Absolute Error (MAE), Mean Squared Error (MSE), and Coefficient of Determination (R2). Hyperparameter tuning was performed via grid search with cross-validation where applicable. Feature importance analyses and scatter plots were later used to visualize predictive behavior and residual variance.
2.6. Clustering and Semantic Profiling
To explore latent semantic groupings within the wine descriptions, an unsupervised clustering approach was employed using K-Means. The aim was to identify stylistically coherent subgroups of wines based on the lexical and semantic content of their descriptions, without relying on predefined class labels.
The clustering was performed on BERT embeddings of wine descriptions in English, where each text was represented as a 768-dimensional vector. Prior to clustering, all embeddings were normalized, and dimensionality was optionally reduced using Principal Component Analysis (PCA) to enhance computational efficiency and facilitate visualization.
The optimal number of clusters was determined using the Silhouette Score and the Elbow Method. After the selection of the optimal cluster count, K-Means clustering was applied and each description was assigned to one semantic group. These clusters were then analyzed in terms of lexical content, dominant descriptors, and potential marketing relevance.
To interpret and visualize the clustering results, 2D projections of the high-dimensional embedding space were created using PCA. Lexical heatmaps and word clouds were also generated for each cluster to support thematic profiling and stylistic differentiation.
3. Results and Discussion
3.1. Summary of the Dataset
The dataset contains information about 5807 Bulgarian wines from the website DIVINO for the period from 2003 to 2024. Wine information includes name, winery, vintage, grape variety, region, price, and expert ratings.
As can be seen from
Table 3, red wines account for the largest share (45.3%), which is not surprising since their production and consumption is dominant in Bulgaria. The share of sparkling wines (1.5%) and especially dessert wines (0.8%) is extremely low. The largest number of wines is in Eastern Thrace (31%) and the smallest in the Rose Valley (2.1%).
The wines in the sample include 69 grape varieties. The greatest variety and diversity are observed in Eastern Thrace (39) and Struma Valley (33), where most of the wineries are located. The grape varieties include both international and unique local varieties. The varieties found in each region are Cabernet Sauvignon, Chardonnay, Merlot, Pinot Noir, Sauvignon Blanc, and various varietal blends. The distribution of grape varieties by region is shown in
Table 4.
During the period under review (2003–2024), only one wine received a DiVino rating of 5. It is a 2005 blend of Mavrud and Cabernet Sauvignon. Six wines in the sample did not receive the minimum score of 78 points to be assigned a DiVino rating. The majority of wines received a DiVino rating of 3 (90–87 Points), accounting for 2951 entries, followed by those rated 2 (86–83 Points), 4 (95–91 Points), and 1 (82–78 Points). Only one wine received a rating of 5 (96–100 points) during the entire period. These results indicate that DiVino applies a rigorous and sophisticated rating methodology, with high scores rarely awarded. This reflects the platform’s consistently high standards in wine tasting and evaluation.
The distribution of wines by region of the wines that were assigned a DiVino rating is shown in
Table 5. The wines that received a DiVino rating of 4 were the most numerous in Eastern Thrace (35.3%) and Sakar and Eastern Rhodopes (23.2%), while those that received a DiVino rating of 3 were most numerous in Eastern Thrace (29.8%) and Struma Valley (17.3%).
The prices of the wines in the sample range from BGN 5 to BGN 228. The only wine with a DiVino rating of 5 is priced at BGN 117. Wines with a DiVino rating of 4 are priced between BGN 12 and BGN 228, those with a rating of 3 between BGN 5 and BGN 150, and those with a rating of 2 between BGN 5 and BGN 65. Meanwhile, those with a rating of 1 are priced between BGN 5 and BGN 35. The six wines without a DiVino rating are priced between BGN 5 and BGN 15. The above information shows that the highest-rated wines are not necessarily the most expensive, as some wines rated 4 can cost up to BGN 228.
3.2. Text Mining
Following the preprocessing steps (
Section 2.2), the cleaned corpus was analyzed using text mining techniques—frequency analysis, lexical co-occurrence, and semantic vectorization—to extract stylistic markers and thematic structures for classification and clustering.
Word clouds (
Figure 1), generated via an open-access tool [
40], visualize dominant terms in English (“fruits”, “tannins”, “slightly”, “fresh”) and Bulgarian (“плодове”, “танини”, “рубин”), indicating a shared stylistic emphasis on flavor, aroma, and texture.
This recurrence reveals a common semantic core centered on elegance, complexity, and fruit-forward expression—relevant not only for text classification but also for unified marketing across languages.
As a consequence of POS (Part-of-Speech) filtering, the 20 most frequent adjectives contained in wine descriptions in English were identified (
Figure 2). As can be seen, the most used word is “average”, which is itself an interesting case—it could reflect moderation or balance in wine characteristics but could also be interpreted as slightly neutral or even insufficiently positive in a product context. Typical flavor and aroma descriptors such as “fruits”, “slightly”, “beautiful”, “fresh” and “tannins” follow, highlighting both sensory characteristics (taste, aroma) and intensity or emotional attitude. The presence of terms such as “juicy”, “spices”, “mature”, “sparkling” and “sweet” indicates a diversity in the stylistic profiles of the wines and a richness in the linguistic toolkit used by the tasters. The bar plot also shows a distinct lexical hierarchy, ranging from a few very frequently used words to those of lower frequency but still recurring with sufficient salience to form the thematic cores of wine descriptions.
Figure 3 presents a heatmap that illustrates the frequency of co-occurrence of leading descriptive words in wine descriptions in English. The pairs of words most frequently used together within a description are depicted with different color intensities—darker squares reflect a higher frequency of co-occurrence. The most pronounced co-locations include combinations such as “dark chocolate”, “black fruits”, “medium body”, and “soft tannins”. These word combinations are not arbitrary—they reflect persistent stylistic patterns and terminological pairs typical of wine expert discourse. The analysis of such co-locations makes it possible to identify key thematic nuclei that unify individual descriptions and build a coherent lexical profile of different wine styles. Heatmap analysis not only reveals linguistic dependencies but also provides a basis for deeper semantic clustering and training models for the automatic classification of wines by style. For example, the joint use of “dark”, “chocolate”, “black” and “tannins” forms a profile characteristic of full-bodied red wines, while “fresh”, “light”, “citrus” and “acidity” are associated with crisp white styles.
The last two visualizations are a key starting point for more comprehensive analyses, such as clustering and building machine learning predictive models, which are presented in the next section. Beyond their computational significance, these lexical patterns also reflect the stylistic and expressive tendencies of expert reviewers, which merit further linguistic interpretation. Our analysis of descriptor use, which was visualized using word clouds and a co-occurrence heatmap (
Figure 3), confirms the predominant use of metaphorical and sensory language in wine reviews. These results confirm earlier findings regarding the figurative nature and lexical consistency of expert wine language [
30,
31,
33].
3.3. Clustering and Style Profiling
Cluster analysis was performed using the K-Means method, which is a popular unsupervised machine learning algorithm used for partitioning a dataset into a pre-defined number of clusters. In other words, the model autonomously identifies thematic groupings (clusters). The optimal number of clusters in this method is most often determined by the Elbow method and the Silhouette Score. In most of the real datasets, there is no clear elbow inflection point to determine the correct “K” using the elbow method. This increases the risk of selecting an incorrect value for “K”. Therefore, for this study, the optimal number of clusters “K” is determined by the Silhouette metric, and the values for different numbers of clusters are shown in
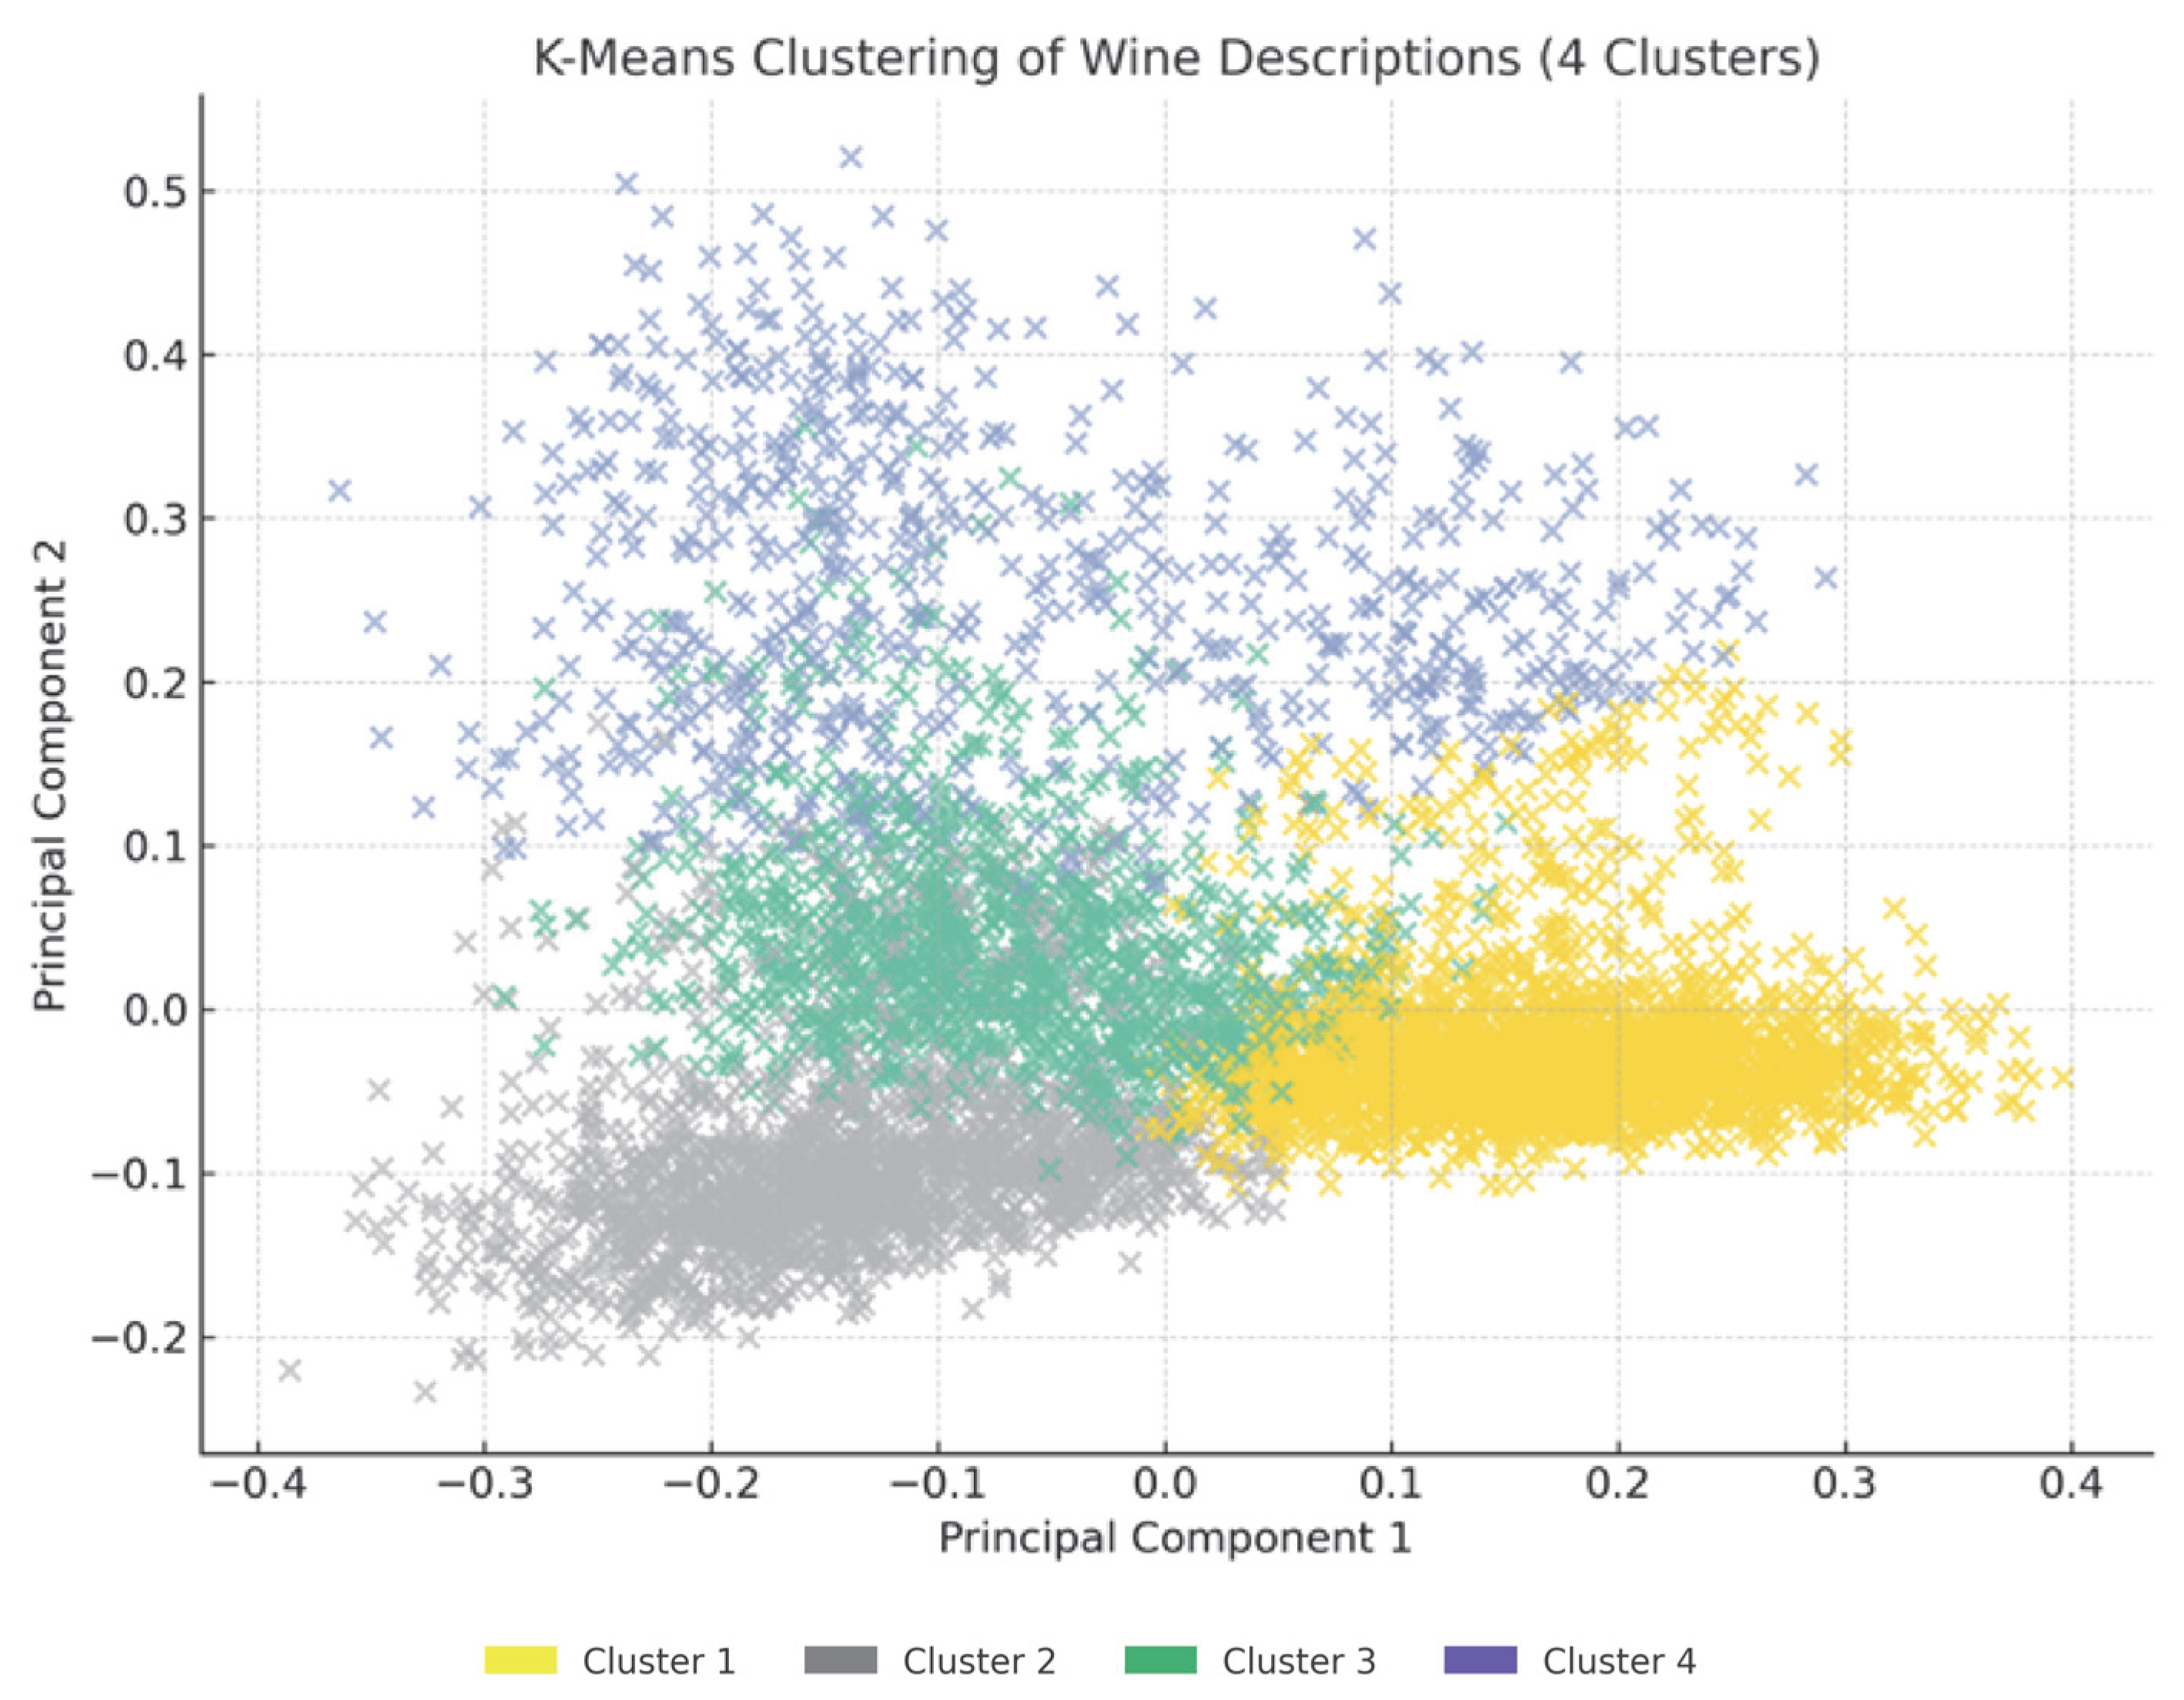
Table 6. Based on the highest value of Silhouette Score (0.016), the optimal number of clusters is selected as 4.
Figure 4 presents a visualization of the cluster analysis results applied to the vectorized wine descriptions. Each cluster combines descriptions that have a similar lexical structure and stylistic profile. For example, one cluster contains descriptions of wines with intense notes of dark fruit, chocolate and oak, while another cluster is characterized by fresh and light descriptions with citrus and floral elements. This kind of automatic thematic segmentation makes it possible to develop customized marketing approaches to different wine styles. In addition, the results show that despite linguistic diversity, description texts cluster according to common meaning kernels, which is a valuable indicator of the persistence of wine terminology and perception.
Similar results appear in [
26], where the authors apply multidimensional clustering to segment wine descriptions and generate personalized recommendations by balancing price and style, illustrating the marketing potential of cluster-based models.
Lefever et al. [
31] confirm that expert vocabulary follows consistent, culture- and style-driven patterns. Using thematic analysis and hierarchical clustering, the authors reveal semantic cores that structure tasting communication.
Through text analysis of Chenin Blanc and Sauvignon Blanc, Valente et al. [
41] identify key descriptors distinguishing stylistic sub-groups. Using conceptual grids, the study shows that even similar varieties can be differentiated via specific semantic markers.
Our findings reinforce these insights through thematic clustering, as illustrated in
Figure 4:
Cluster 1: Intense and bold red wines (black fruit, ripeness, chocolate, velvety tannins). Suitable for lovers of full-bodied red wines, wine clubs, and reserve wine tastings.
Cluster 2: Fresh white wines and citrus notes (citrus, grassy notes). Ideal for summer campaigns, gift sets, and novice wine drinkers, especially when paired with seafood.
Cluster 3: Elegant rosés and light red wines (floral, juicy, and visually attractive). An excellent choice for social networks, young consumers, “instagrammable” wines, and seasonal campaigns in spring and autumn.
Cluster 4: Classic medium-bodied red wines (dried fruit, spice, cherry). Suitable for a core portfolio, targeting loyal customers and culinary pairings at dinner parties.
The cluster visualization (
Figure 4) shows that the yellow, gray, and green clusters are compact and semantically cohesive, while the blue cluster is more dispersed, indicating lexical and stylistic heterogeneity. This may reflect descriptions that are less specific, cross stylistic boundaries, or result from under-clustering—when semantically distinct items are grouped due to method limitations. This issue will be addressed in future work via subclustering or alternative topic aggregation.
In addition to cluster analysis and using the most frequent word pairs from the heatmap analysis, a model for automatic wine style classification based on text descriptions is developed. The model uses a combination of a pre-trained BERT (bert-base-uncased) language model and Logistic Regression to classify the descriptions into four stylistic groups defined by manually selected keywords:
Bold and Tannic (e.g., dark, chocolate, black, tannins);
Fresh and Crisp (fresh, citrus, acidity, light);
Fruity and Smooth (soft, fruit, cherry, juicy);
Aromatic and Floral (floral, elegant, nose, bouquet).
Style labels are automatically assigned to descriptions by checking for the presence of relevant keywords. Only descriptions containing at least one of the keywords are included in the training set. In this way, a classification framework was built on top of the BERT embeddings with the goal of recognizing the wine style directly from the description.
Lefever et al. [
31] confirm that experts use consistent vocabulary, enabling machine learning to predict varietal, region, and color from text alone. Our findings align, revealing semantic cores and clusters that suggest linguistically grounded wine style “prototypes”. Similarly, Yang et al. [
32] show that Doc2Vec and LDA models outperform traditional predictors (e.g., price, vintage) in rating prediction. In our data, semantic descriptors also emerge as strong indicators of style and quality.
Based on these insights, a style classification model was trained on 1160 descriptions, achieving an overall precision of 0.58 (see
Table 7 for category metrics).
The results showed that the model exhibited high performance in the Bold and Tannic and Fresh and Crisp styles, which likely have clearly distinguishable lexical markers in the texts that match the keywords used in labeling. The Aromatic and Floral and Fruity and Smooth styles showed lower performance in terms of recall and F1-score. This may be due to the linguistic overlap between the styles (e.g., the word juicy can be found in both Fruity & Smooth and Fresh & Crisp) or to the smaller number of examples for these categories in the training set (data imbalance).
The confusion matrix (
Figure 5) shows that most errors arise from misclassification between similar styles, especially between Fresh and Crisp and Fruity and Smooth, which is expected given their semantic similarity.
In order to assess how well the manually defined styles (created by keyword selection) match the natural clustering of the texts (by K-Means clustering), an analysis of the so-called external cluster validity was performed. The metrics used were Adjusted Rand Index (ARI), which measures the similarity between two classifications (in this case, style labels and clusters), and Normalized Mutual Information (NMI), which evaluates the shared information between two distributions. If ARI is one then, there is a perfect match, if ARI ≈ 0, then there is a match as in a random classification, and if ARI < 0, then the match is worse than random. In terms of Normalized Mutual Information, if NMI = 1 then there is a perfect match, and if it is 0 then there is no match. In this particular study, the ARI and NMI values are 0.047 and 0.041, respectively, which means that the clusters extracted from K-Means do not significantly match the keyword-defined styles. This may be due to the different nature of the approaches (clustering uses purely lexical/semantic models, whereas style labels are predefined and more semantically loaded), to overlap between styles (some descriptions contain elements from more than one style, making it difficult to clearly distinguish between them), or to the lack of completely discrete boundaries between lexical styles.
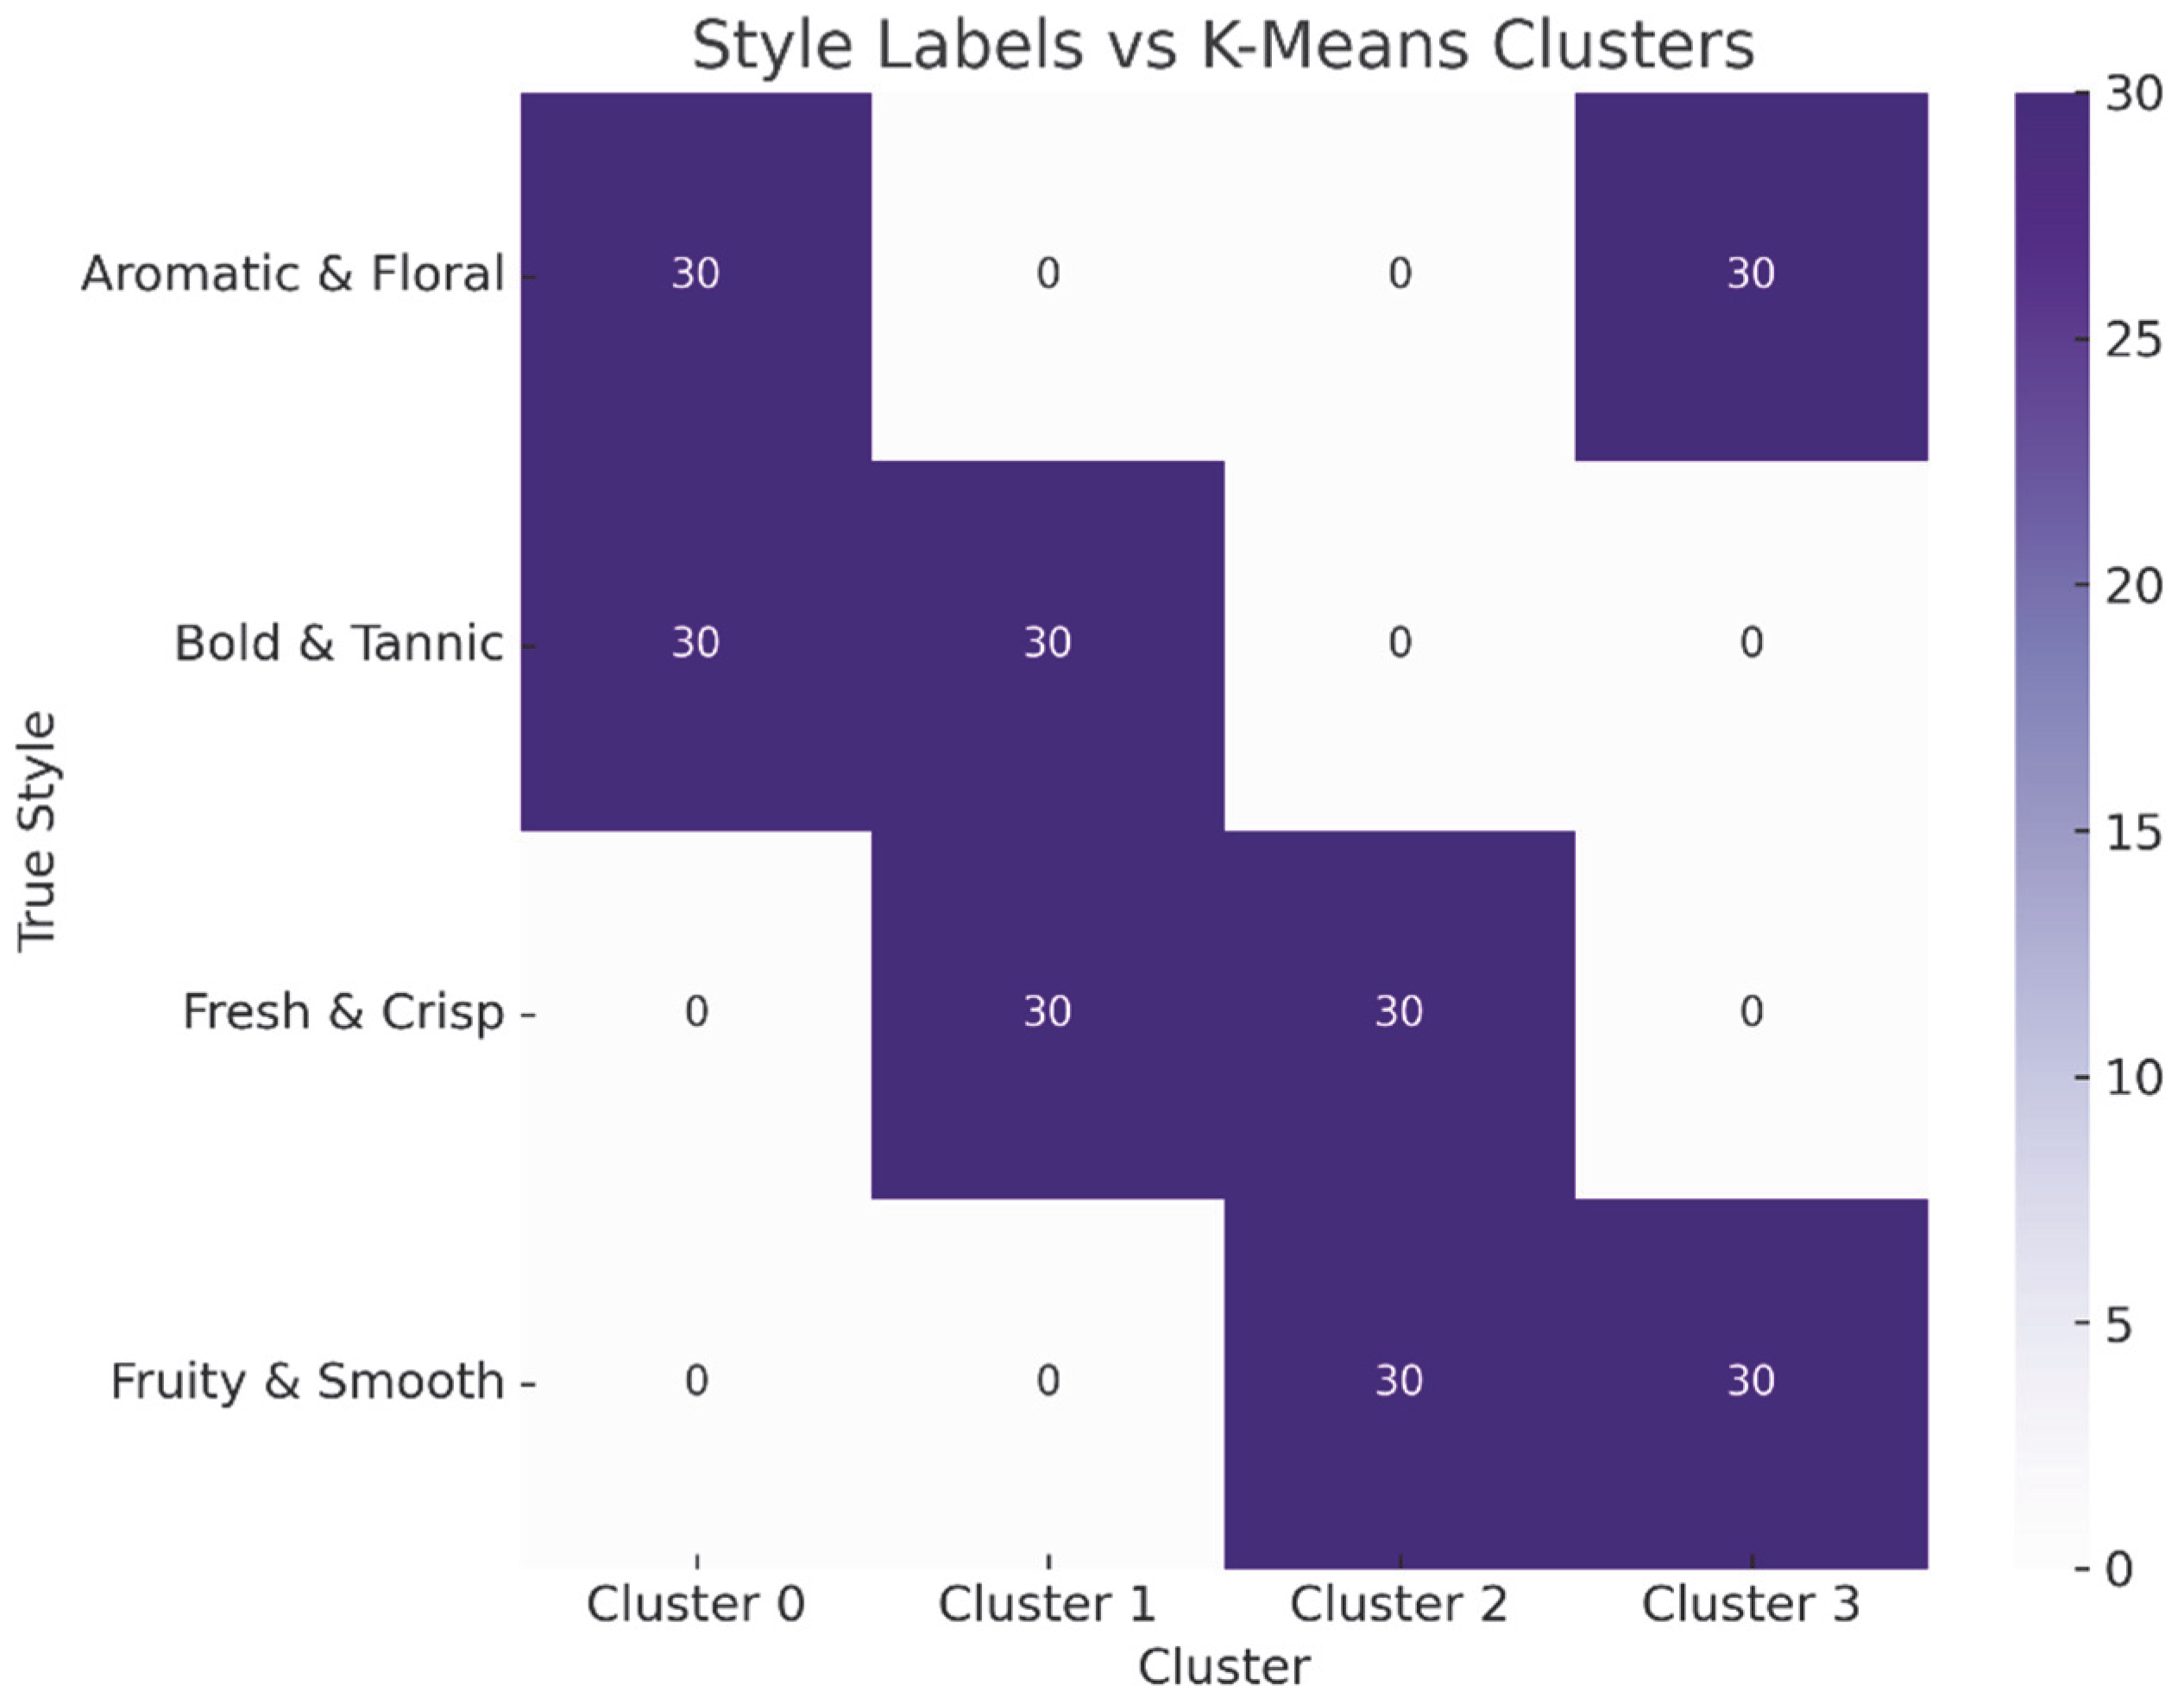
The visualization in
Figure 6 illustrates the agreement between the manually defined style labels and the automatically detected clusters by the K-Means algorithm using a discrete value heatmap. The four style categories are plotted on the vertical axis and the corresponding clusters are plotted on the horizontal axis. From the graph, we can see that some styles are clearly concentrated in one cluster (e.g., “Bold and Tannic” and “Fresh and Crisp”), which means that they have a characteristic lexical density and are easily recognized by the clustering algorithm. At the same time, there is also a partial distribution of styles between several clusters, especially for “Fruity and Smooth” and “Aromatic and Floral”. This suggests a lexical and thematic overlap between these styles—they use softer and more poetic terms that may appear in more than one cluster.
Cluster 0, for example, contains descriptions from both “Bold and Tannic” and “Aromatic and Floral”, indicating that some of the words are semantically related in more than one style context.
This heatmap figure serves as a visual indicator of the limited, but existing, correspondence between styles and clusters that supports the ARI and NMI values. It confirms that manual styles have semantic value, but also that style boundaries in the tasting language are fluid and partially overlapping.
Although the clusters do not fully align with predefined styles, this does not invalidate the classification model. On the contrary, the results suggest that manual style categories contain additional semantic signals often missed by unsupervised methods. Thus, the combination of clustering and classification yields a more nuanced representation of wine descriptions.
This layered approach aligns with the findings of Martinez et al. [
26], where multivariate clustering of wine texts effectively predicted consumer preferences and informed recommendation strategies.
3.4. Sentiment and Structural Analysis
In order to build on the linguistic and stylistic analysis carried out through clustering and thematic profiling techniques, this section applies Sentiment Analysis and Structural Analysis on English textual descriptions of guilt. These approaches aim to uncover additional dimensions of tasting language by capturing the emotional charge and linguistic complexity of the descriptions used.
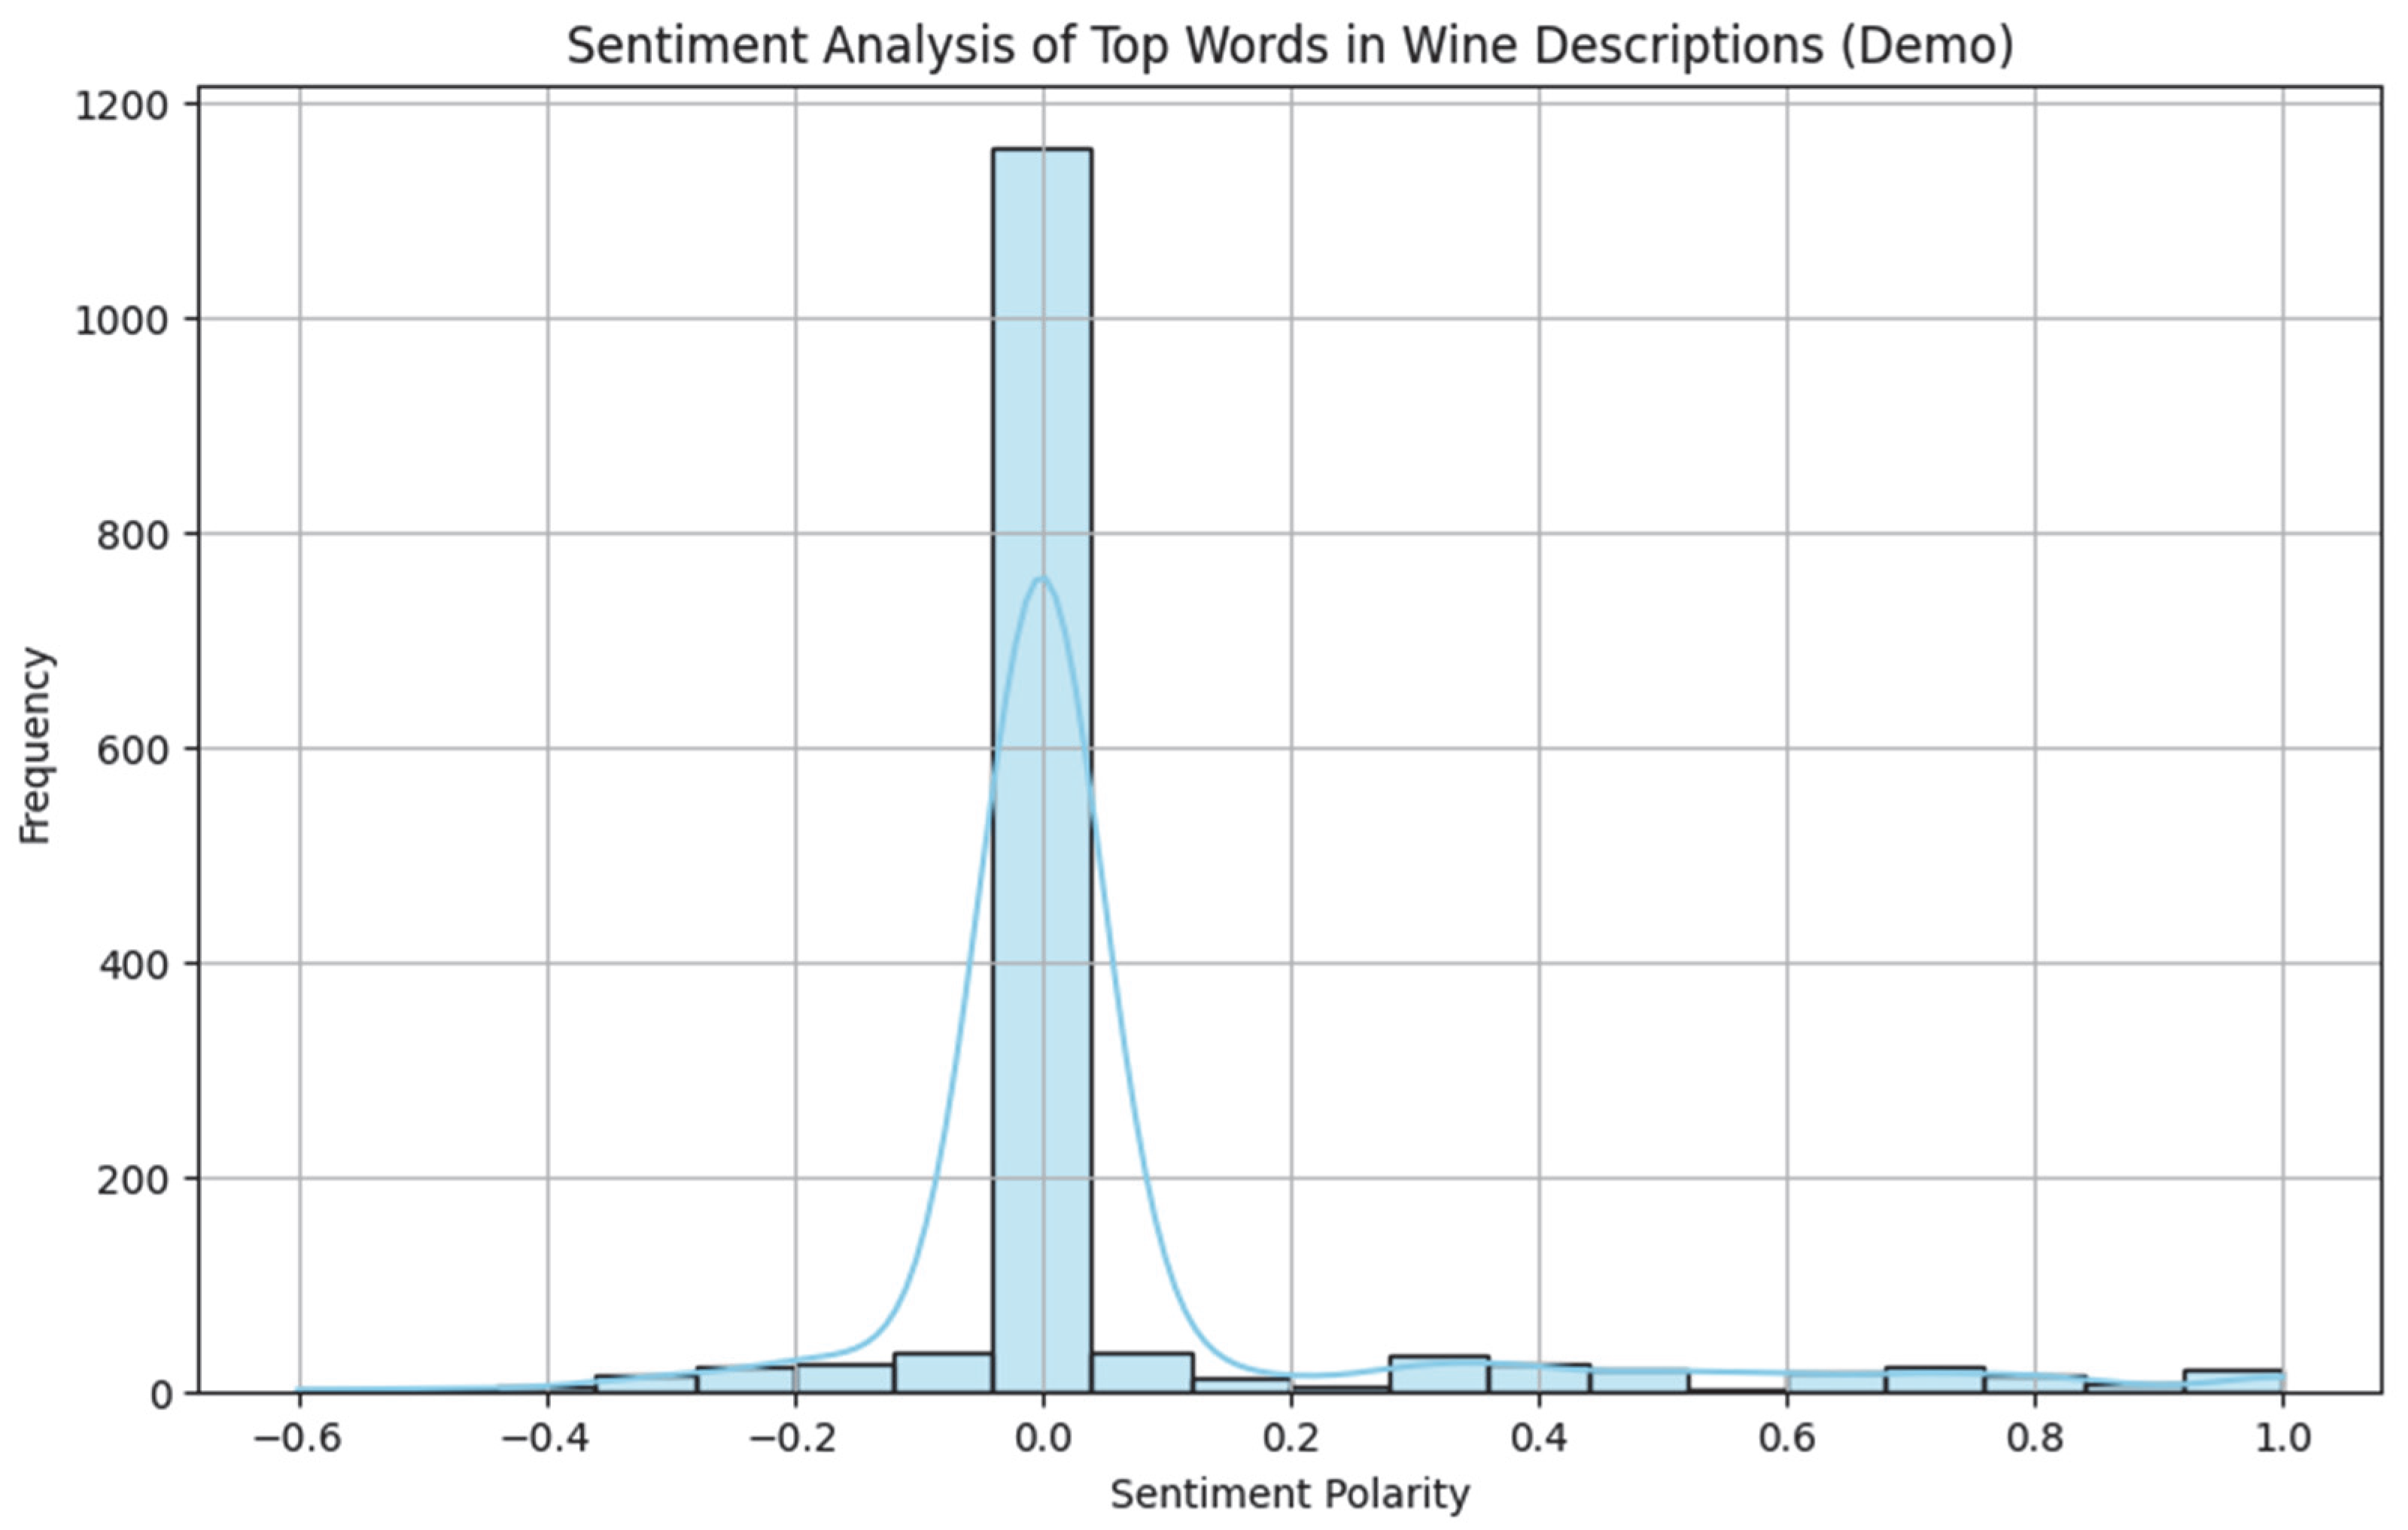
Figure 7 visualizes the distribution of sentiment polarity values computed for the most frequent descriptive words (adjectives) in wine descriptions in English. The histogram and the accompanying smooth curve (KDE) show the frequency of different values ranging from −1 to +1. As can be seen, the graph is clearly asymmetrical with a pronounced clustering around zero, indicating that most descriptions are emotionally neutral but with a slight slope towards positive emotional evaluation. The high density around values between 0 and 0.2 reflects the frequent use of vocabulary that is not highly evaluative but still conveys a positive connotation—e.g., “elegant”, “smooth”, and “juicy”. At the same time, extremely negative values are almost absent, which is in line with the professional and measured style of the tasting descriptions. It is also confirmed that the basic language in wine descriptions is more neutral and objective, which is typical of descriptions that aim to convey details and characteristics of the product without strong emotional accents. Maintaining neutrality in language is important as it provides customers with accurate and informative representations of wines without burdening them with subjective or exaggerated expressions.
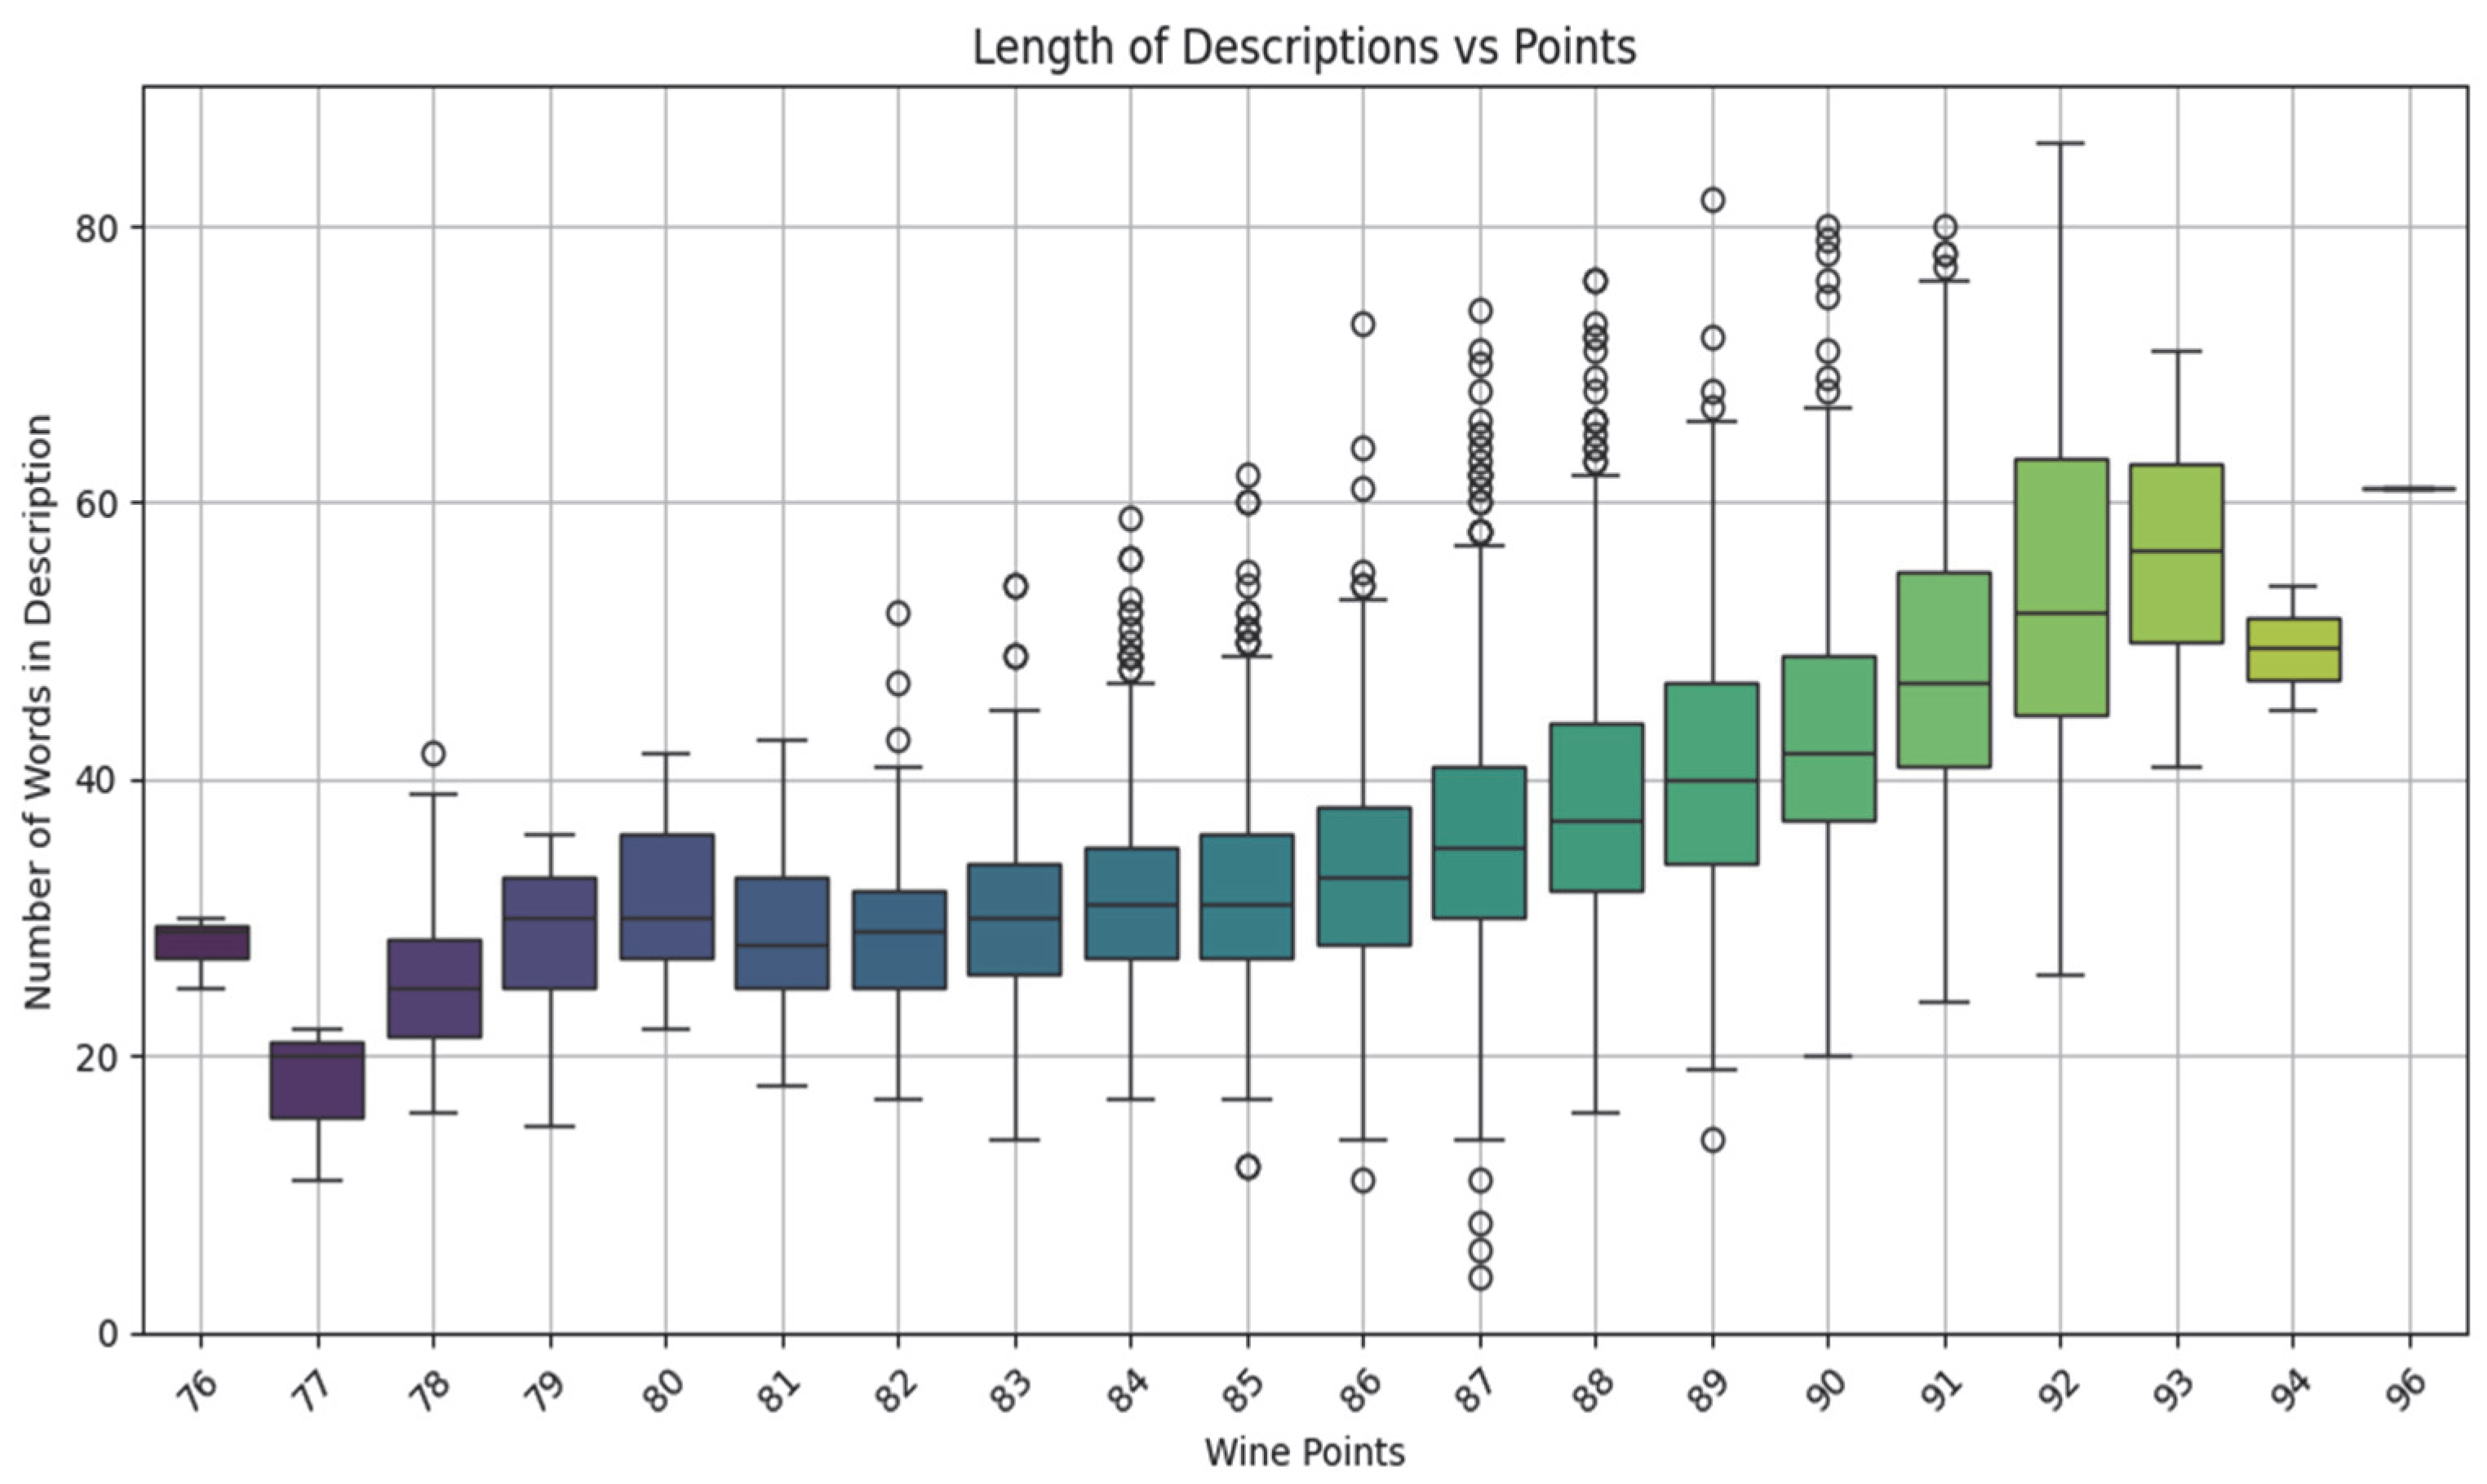
The analysis of professional descriptions (
Figure 8) reveals a clear correlation between text length and expert scores based on the standard 100-point scale. Wines rated above 90 points tend to have significantly longer, more detailed descriptions, indicating greater taster engagement with high-quality wines.
The boxplots illustrate word count distributions by score level, using IQR-based whiskers to limit outlier influence and support robust interpretation of the relationship.
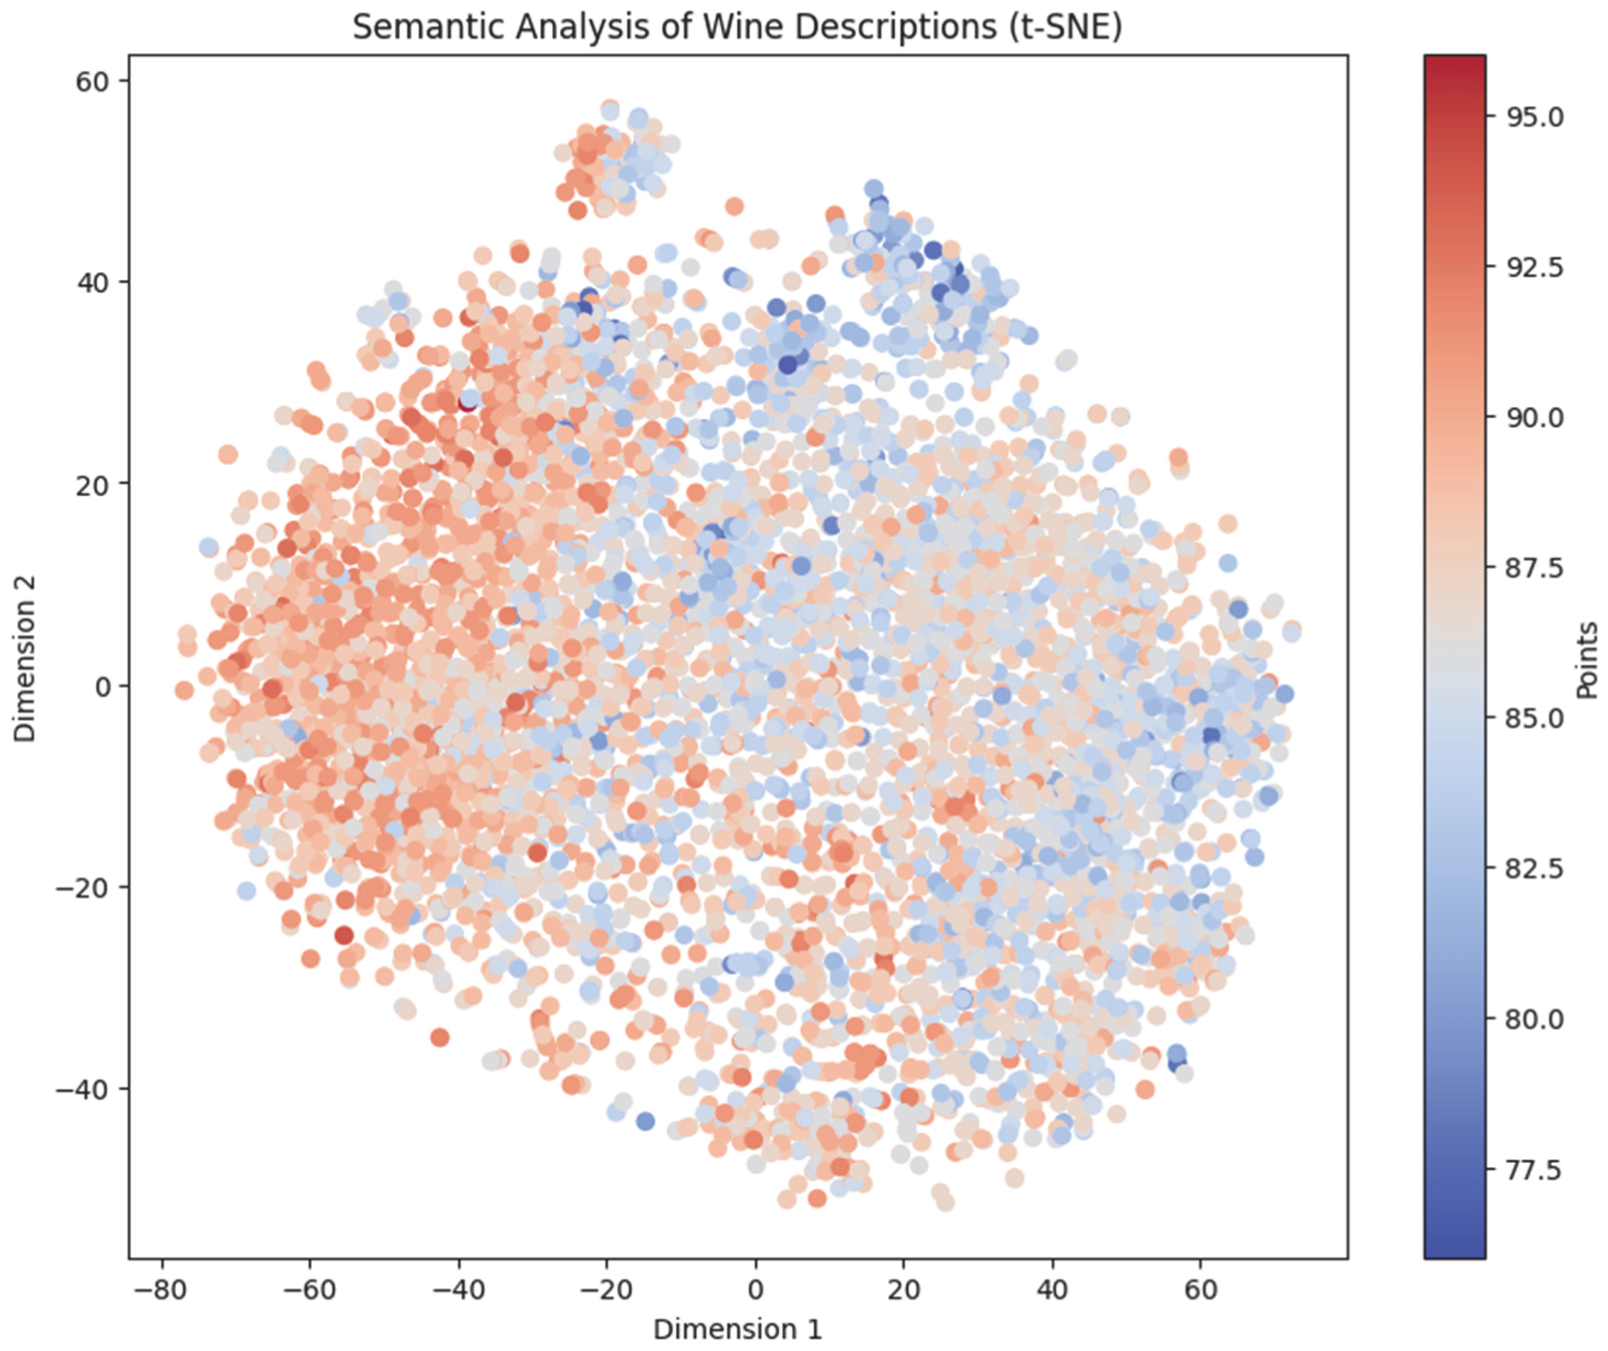
The semantic analysis (
Figure 9) maps professional wine descriptions based on lexical similarity, revealing that descriptions with related vocabulary cluster closely. High-rated wines are often associated with terms like complexity, harmony, and intensity, suggesting that certain linguistic markers may influence expert scoring. These findings position wine descriptions as communicative tools with marketing potential for targeting consumers by flavor and aroma profiles.
To aid interpretation, the semantic space was divided into four quadrants along principal axes. Each quadrant reflects distinct stylistic tendencies: Q1 and Q4 emphasize rich, ripe red wines; Q2 captures floral, fresh, and citrus expressions typical of white and rosé wines; Q3 corresponds to light, delicate, youthful profiles.
The X-axis spans from cool-toned and neutral (left) to warm and expressive (right), while the Y-axis differentiates between assertive and subtle language. The spatial distribution confirms that semantic positioning reflects meaningful lexical variation aligned with perceived quality and typicity.
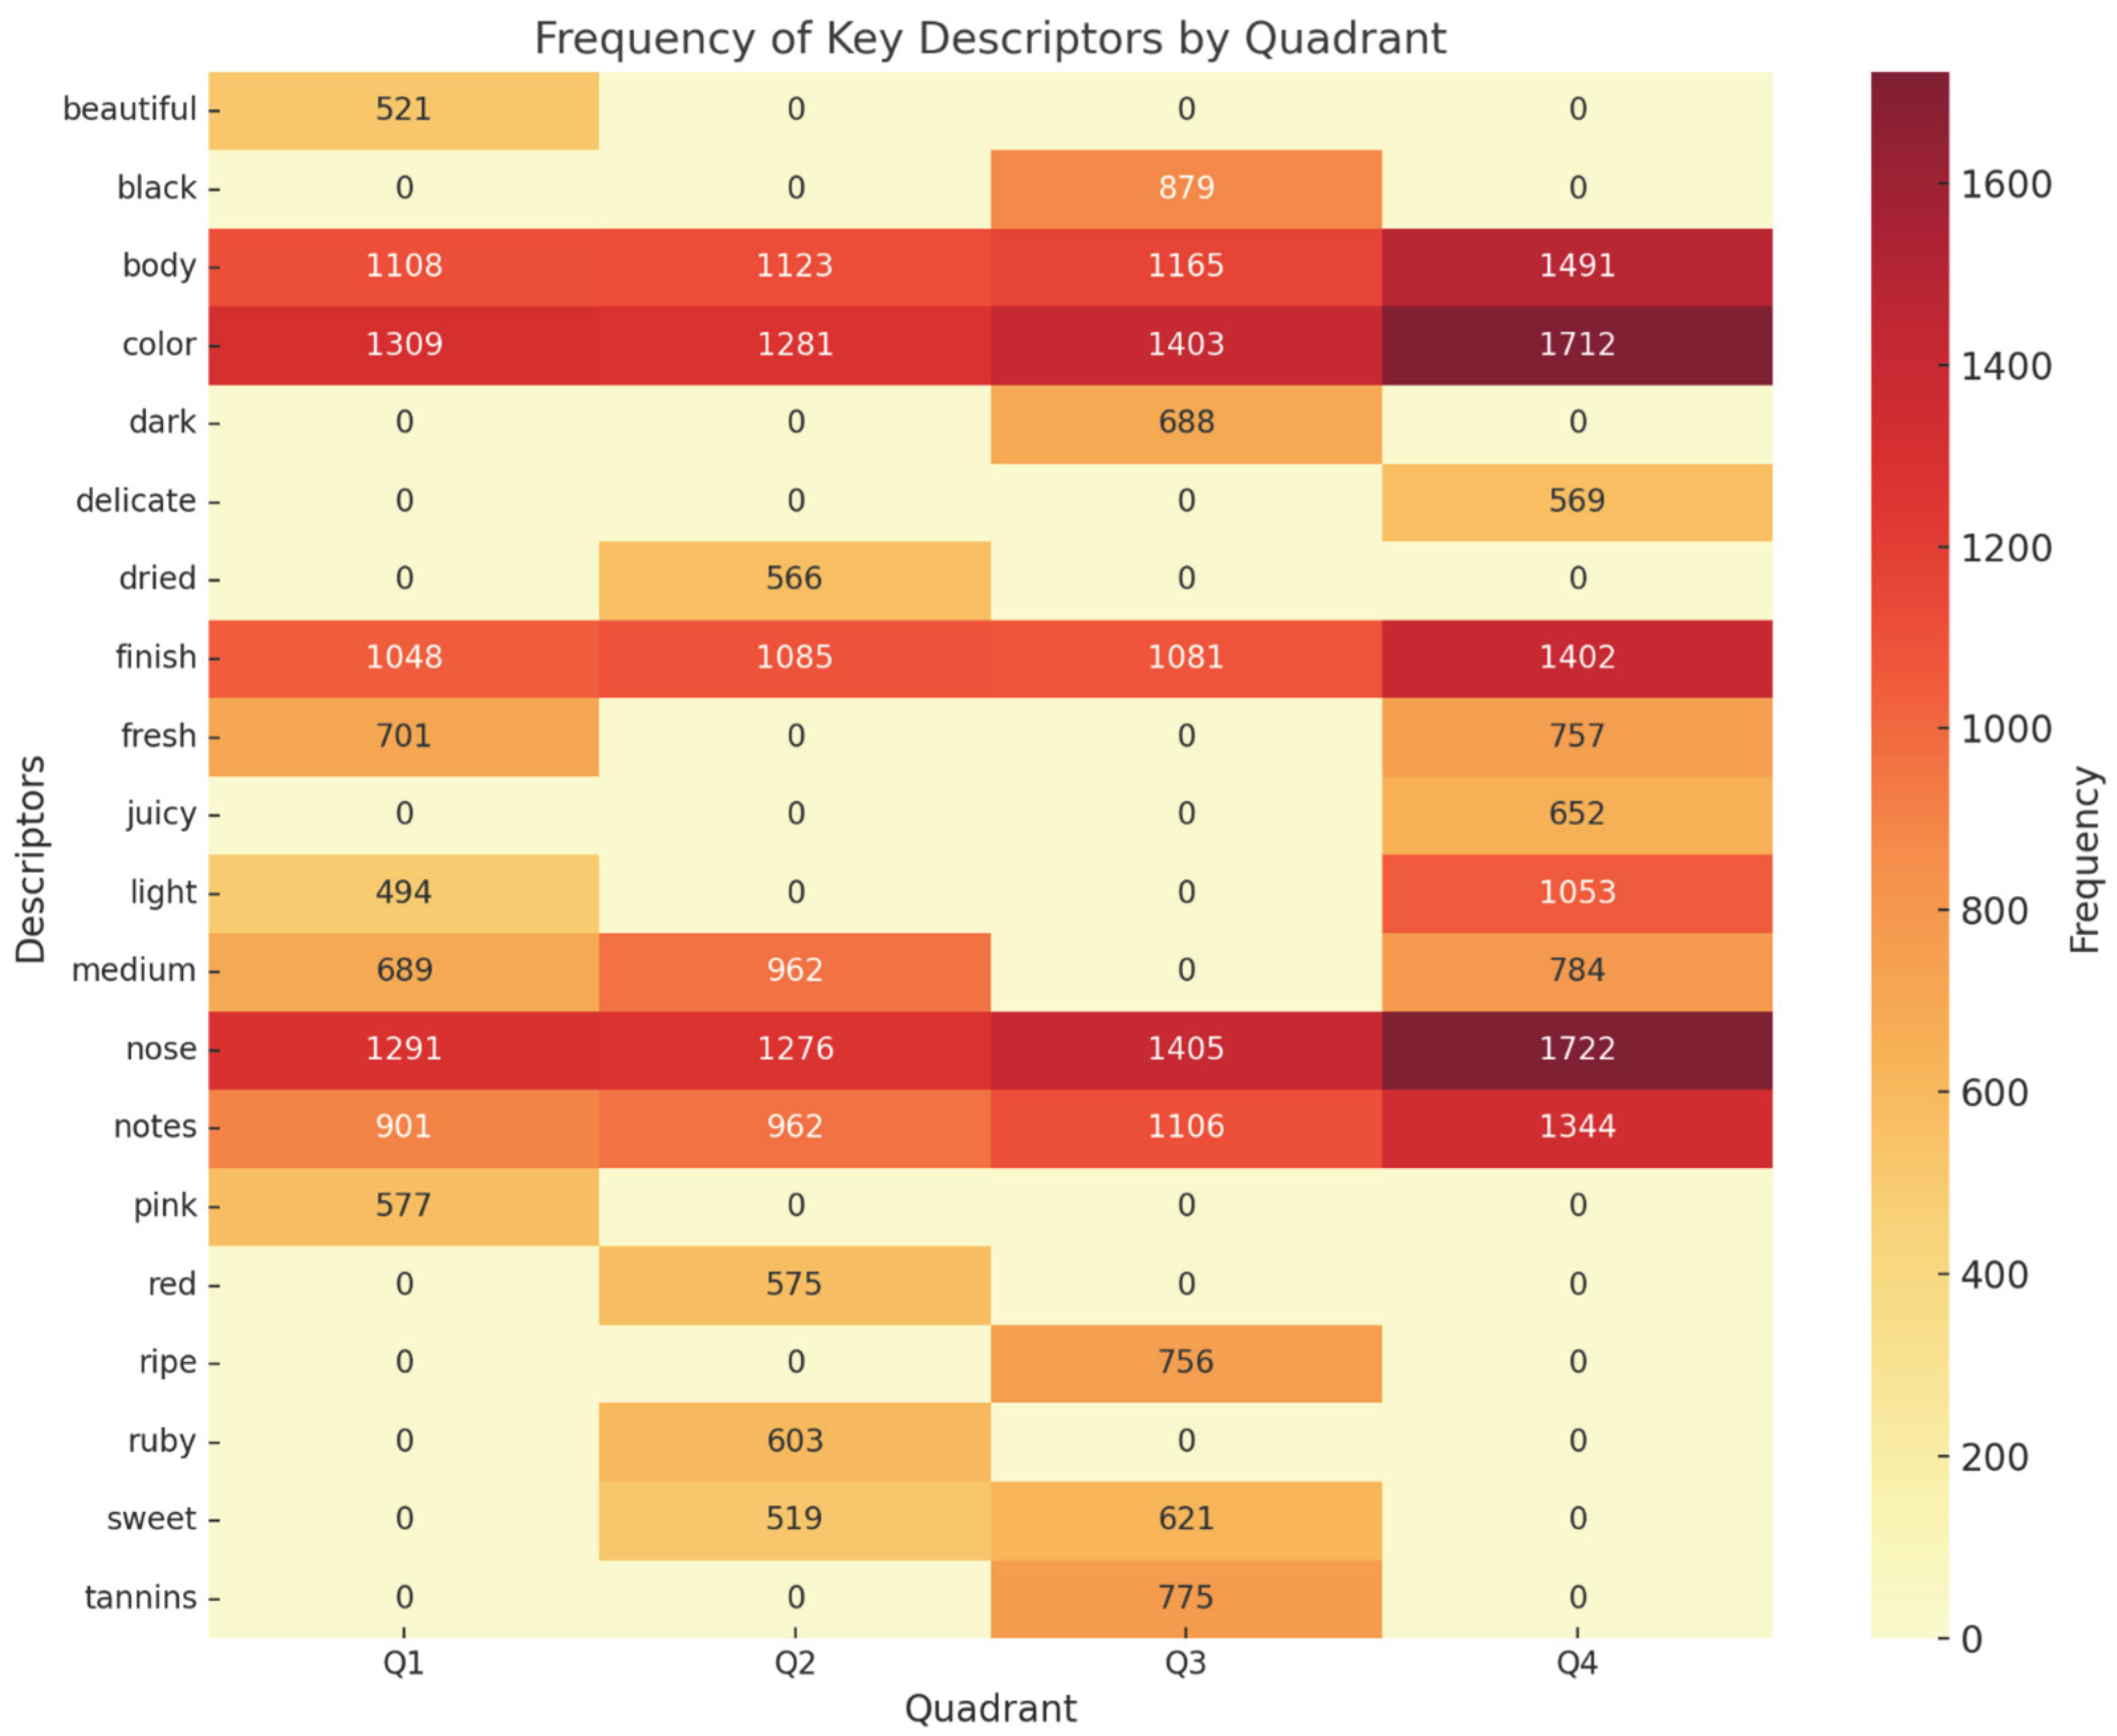
This interpretation is further supported by a heatmap analysis of the most frequent lexical descriptors in each quadrant, as presented in
Figure 10.
The heatmap shows the distribution of the ten most frequent non-stopword descriptors within each quadrant of the semantic map. The lexical dominance of terms such as black, ripe, dark, and tannins in Q4 supports the interpretation of this quadrant as representing full-bodied red wines, while Q2 and Q3 are characterized by lighter and fresher descriptors such as pink, fresh, and juicy.
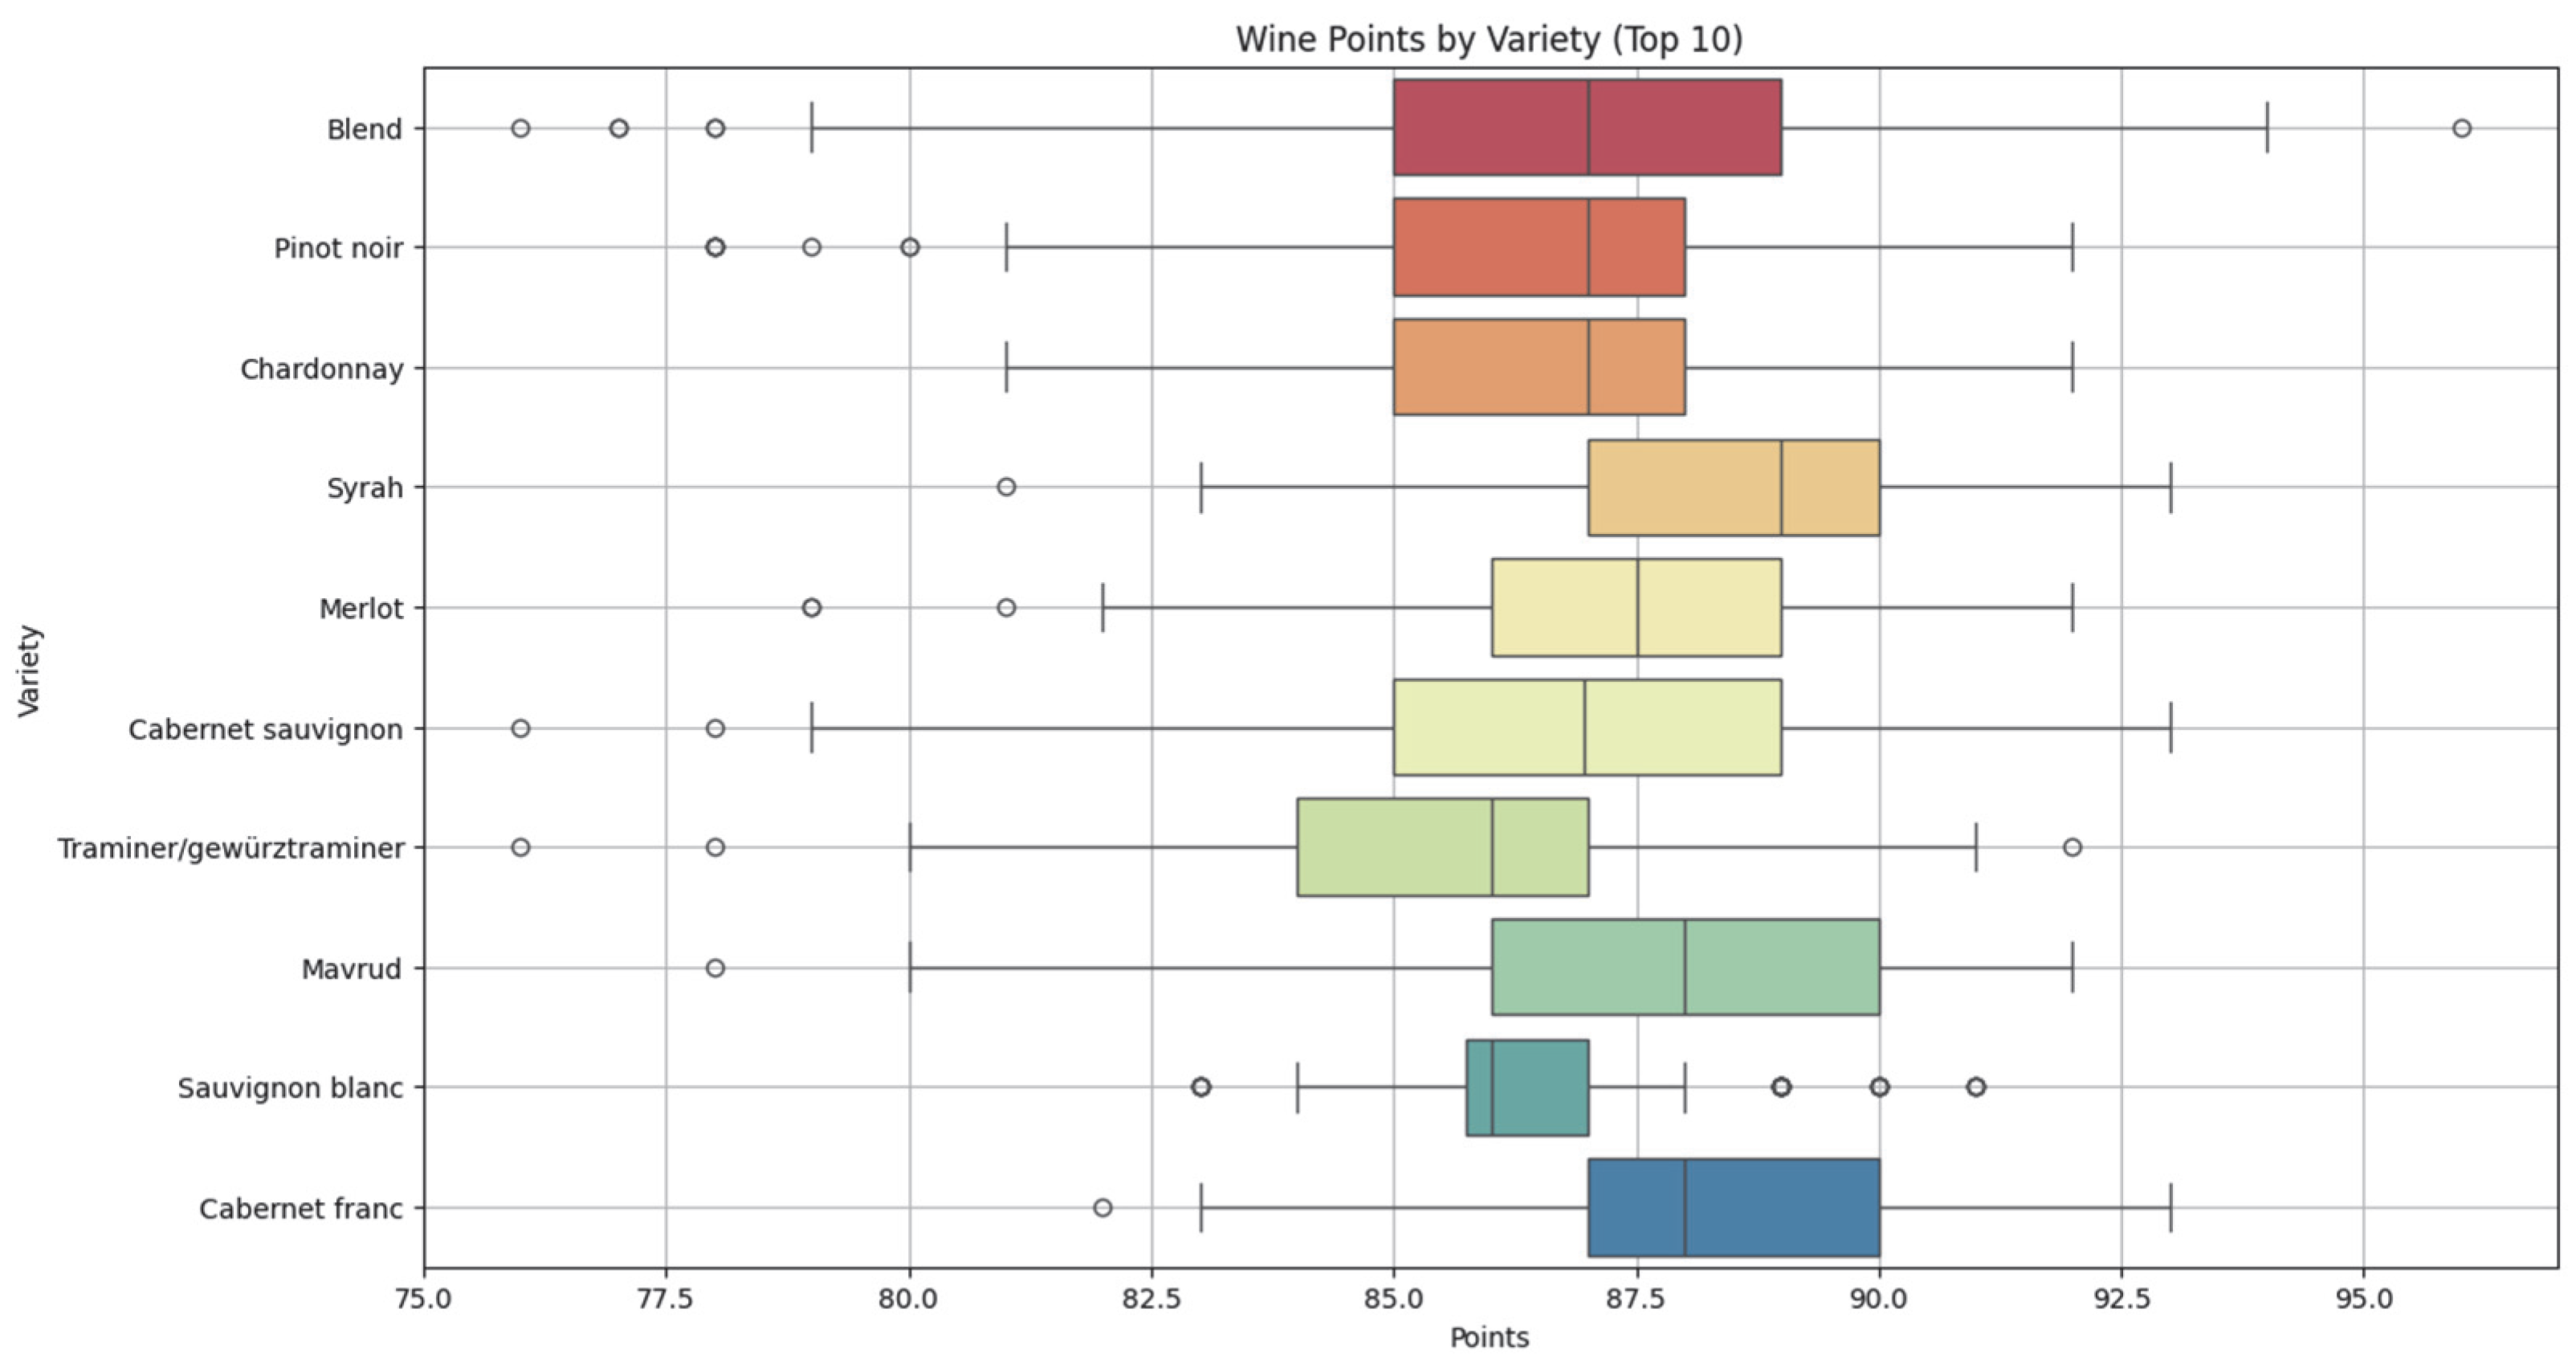
We also analyzed the influence of varieties (
Figure 11) and regional characteristics (
Figure 12) on the occupational scores. A non-parametric Kruskal–Wallis test was used for this purpose, which does not require that the data follow a normal distribution. It is also more flexible than ANOVA, especially in cases where the data are skewed or contain outliers.
Figure 11 presents expert scores (100-point scale) for the ten most common grape varieties. Varieties like Cabernet Franc, Sauvignon Blanc, and Mavrud show higher average ratings and lower variability, suggesting the consistent perception of quality and strong potential for premium positioning.
In contrast, Blend and Pinot Noir exhibit greater score variability, indicating sensitivity to specific combinations or production methods. The Kruskal–Wallis test (statistic = 196.422, p < 0.0001) confirms significant differences across varieties, reflecting clear taster preferences relevant to brand strategy.
Notably, the Blend category includes some of the top-rated wines, despite variability—likely due to the ability to combine complementary grape traits. This flexibility allows winemakers to craft complex, balanced profiles that are highly valued by professionals.
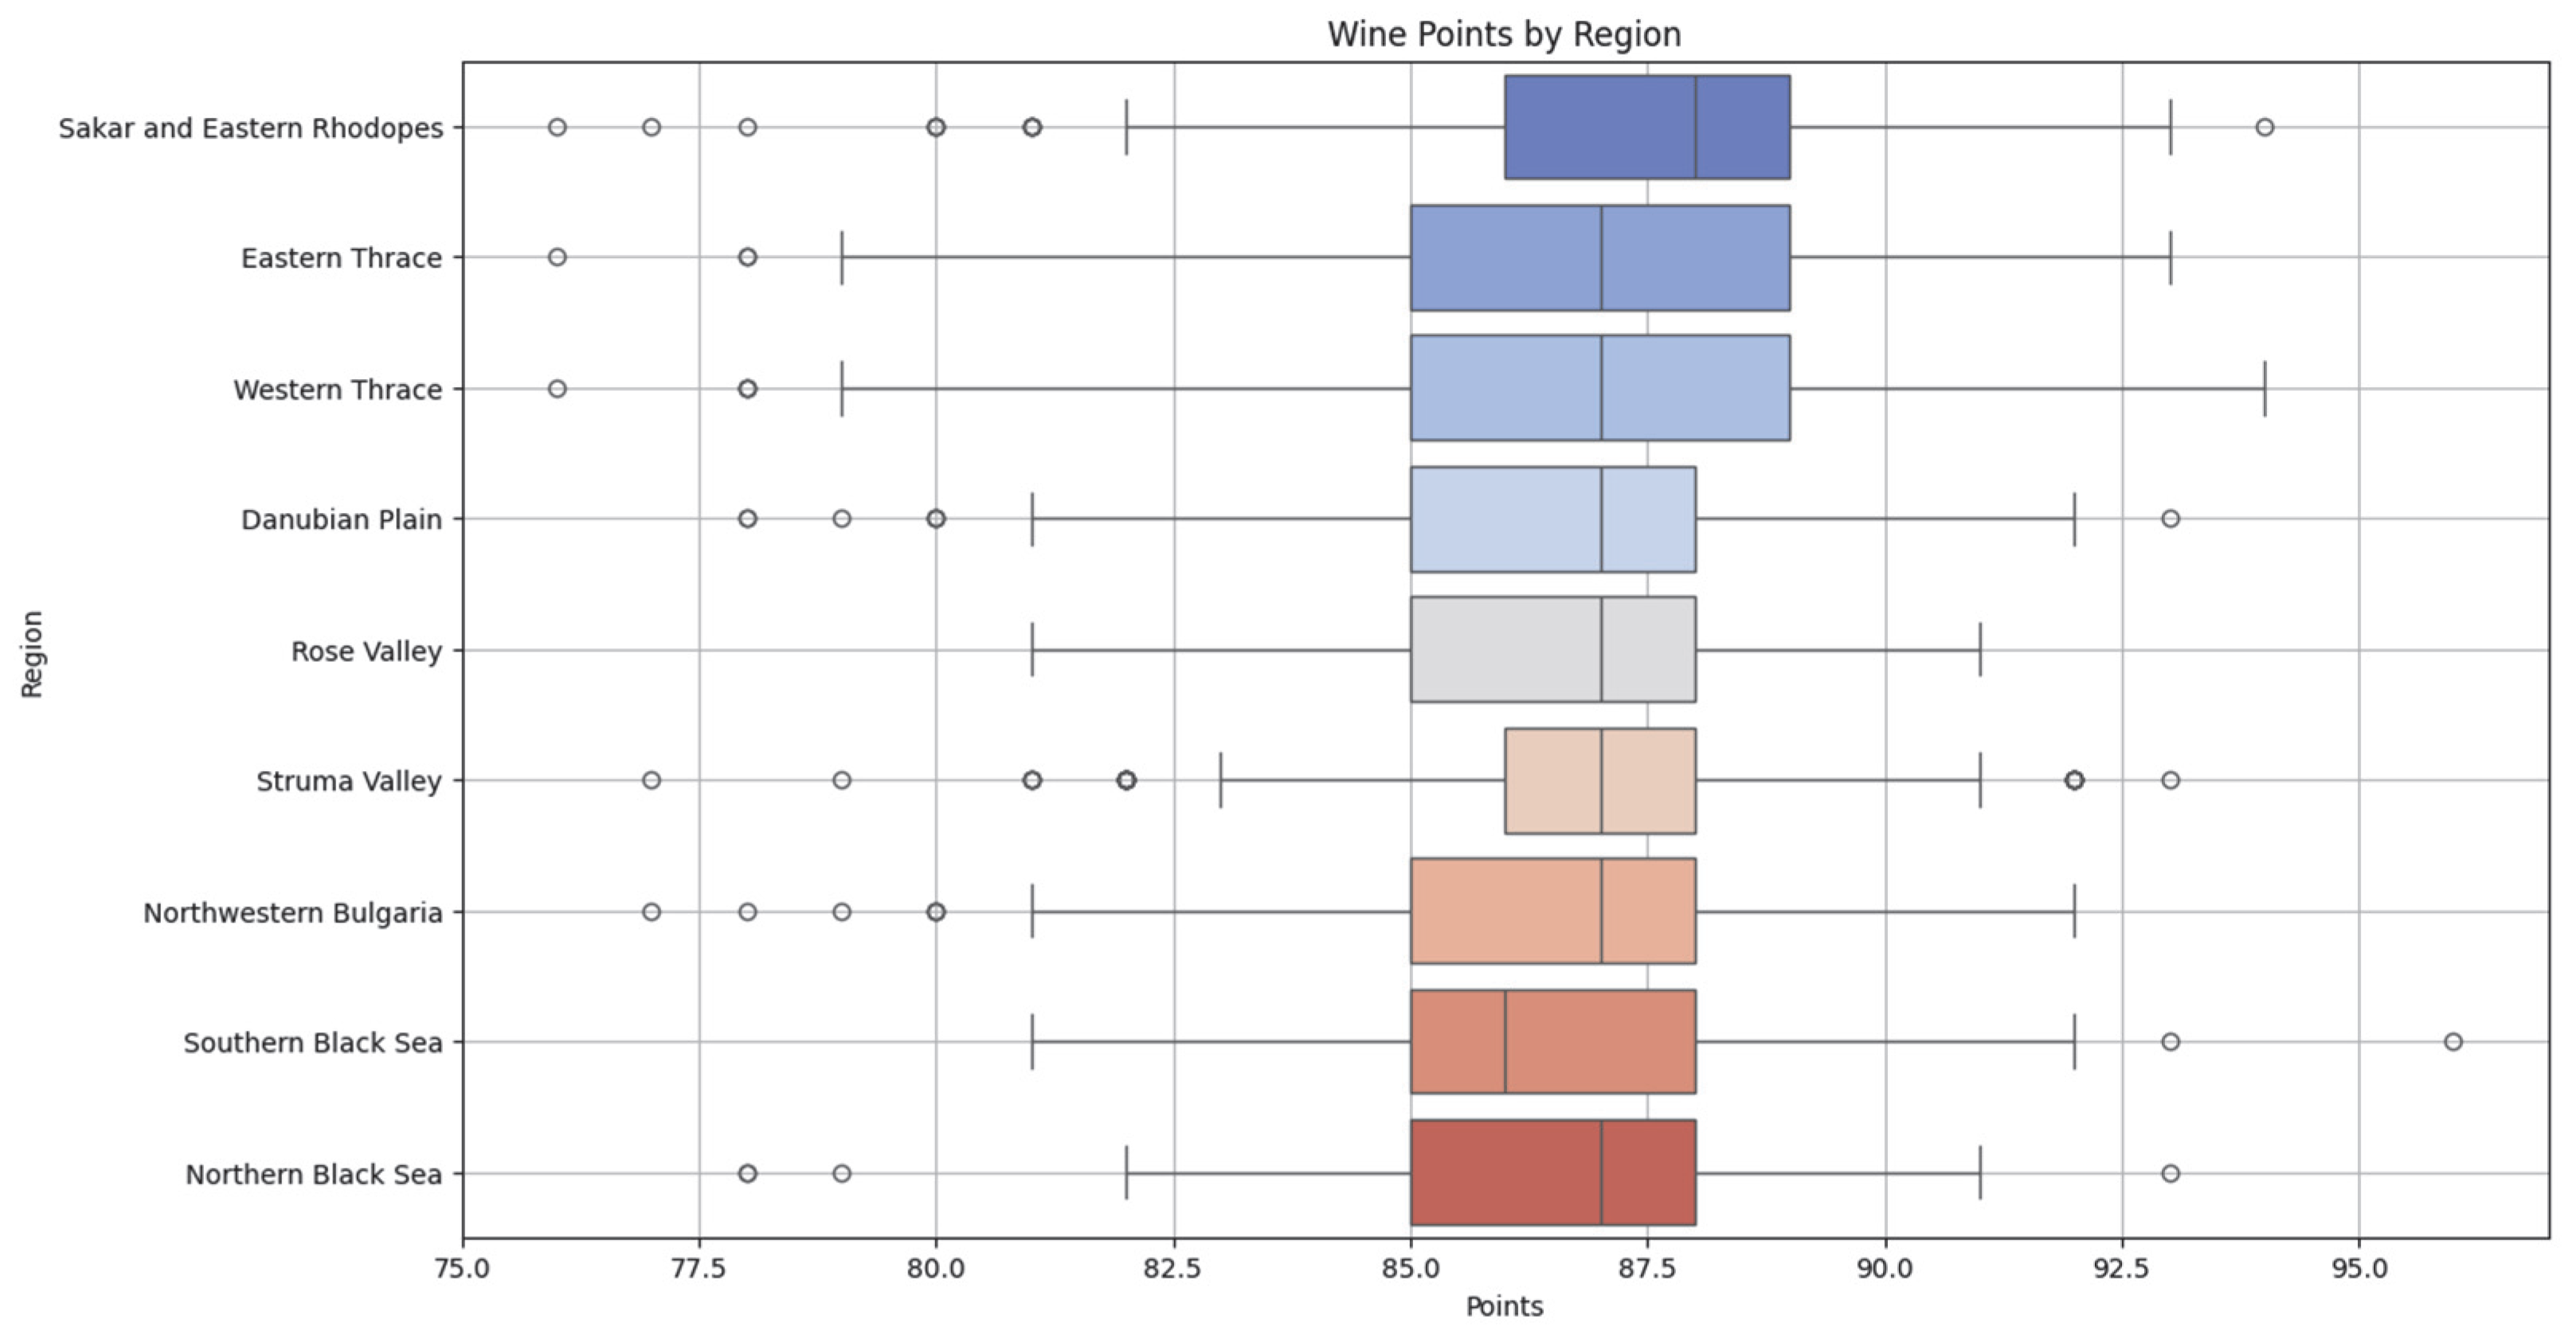
The box plot presented in
Figure 12 shows that regions such as Sakar and Eastern Rhodopes, and Eastern Thrace have higher average ratings and a relatively smaller range of variation. These results suggest that wines from these regions are consistently rated as high quality by professional tasters, making them attractive for marketing emphasis. As Petrov has noted, these regions play a strategic role [
42]. The majority of red grape varieties are concentrated in them. The climatic conditions of the region, which are sheltered from the sharp northerly winds, are conducive to the production of rich, full-bodied, and memorable red wines from Cabernet Sauvignon, Mavrud, Pamid, Syrah, Ruby, and other varieties [
43].
In contrast, wines from regions such as Northwestern Bulgaria and the Northern Black Sea demonstrate significantly lower average ratings and greater variance, meaning that the quality of wines from these regions is less predictable or perceived as lower. This result may be attributable to a combination of climatic factors, an unfavorable age structure of the vineyards, the lack of modern technology, and so on [
42].
The results of the Kruskal–Wallis test for the regions (statistic = 86.548, p < 0.0001) confirm that the differences in professional ratings across regions are statistically significant and, accordingly, regional affiliation may be an important market factor.
Further examination of the boxplot reveals additional noteworthy observations. The wines from Western Thrace demonstrate a wide dispersion of scores, including both the lowest and highest values recorded in the dataset. This is evident through the elongated mustaches and the presence of multiple outliers. In contrast, the Strum Valley exhibits the most compact distribution, with the shortest whiskers, suggesting consistent and uniform scoring. This relative stability could be explained by the tradition of producing wines with a unique chemical profile and a distinct terroir character for the region [
44,
45].
3.5. Segment Analysis
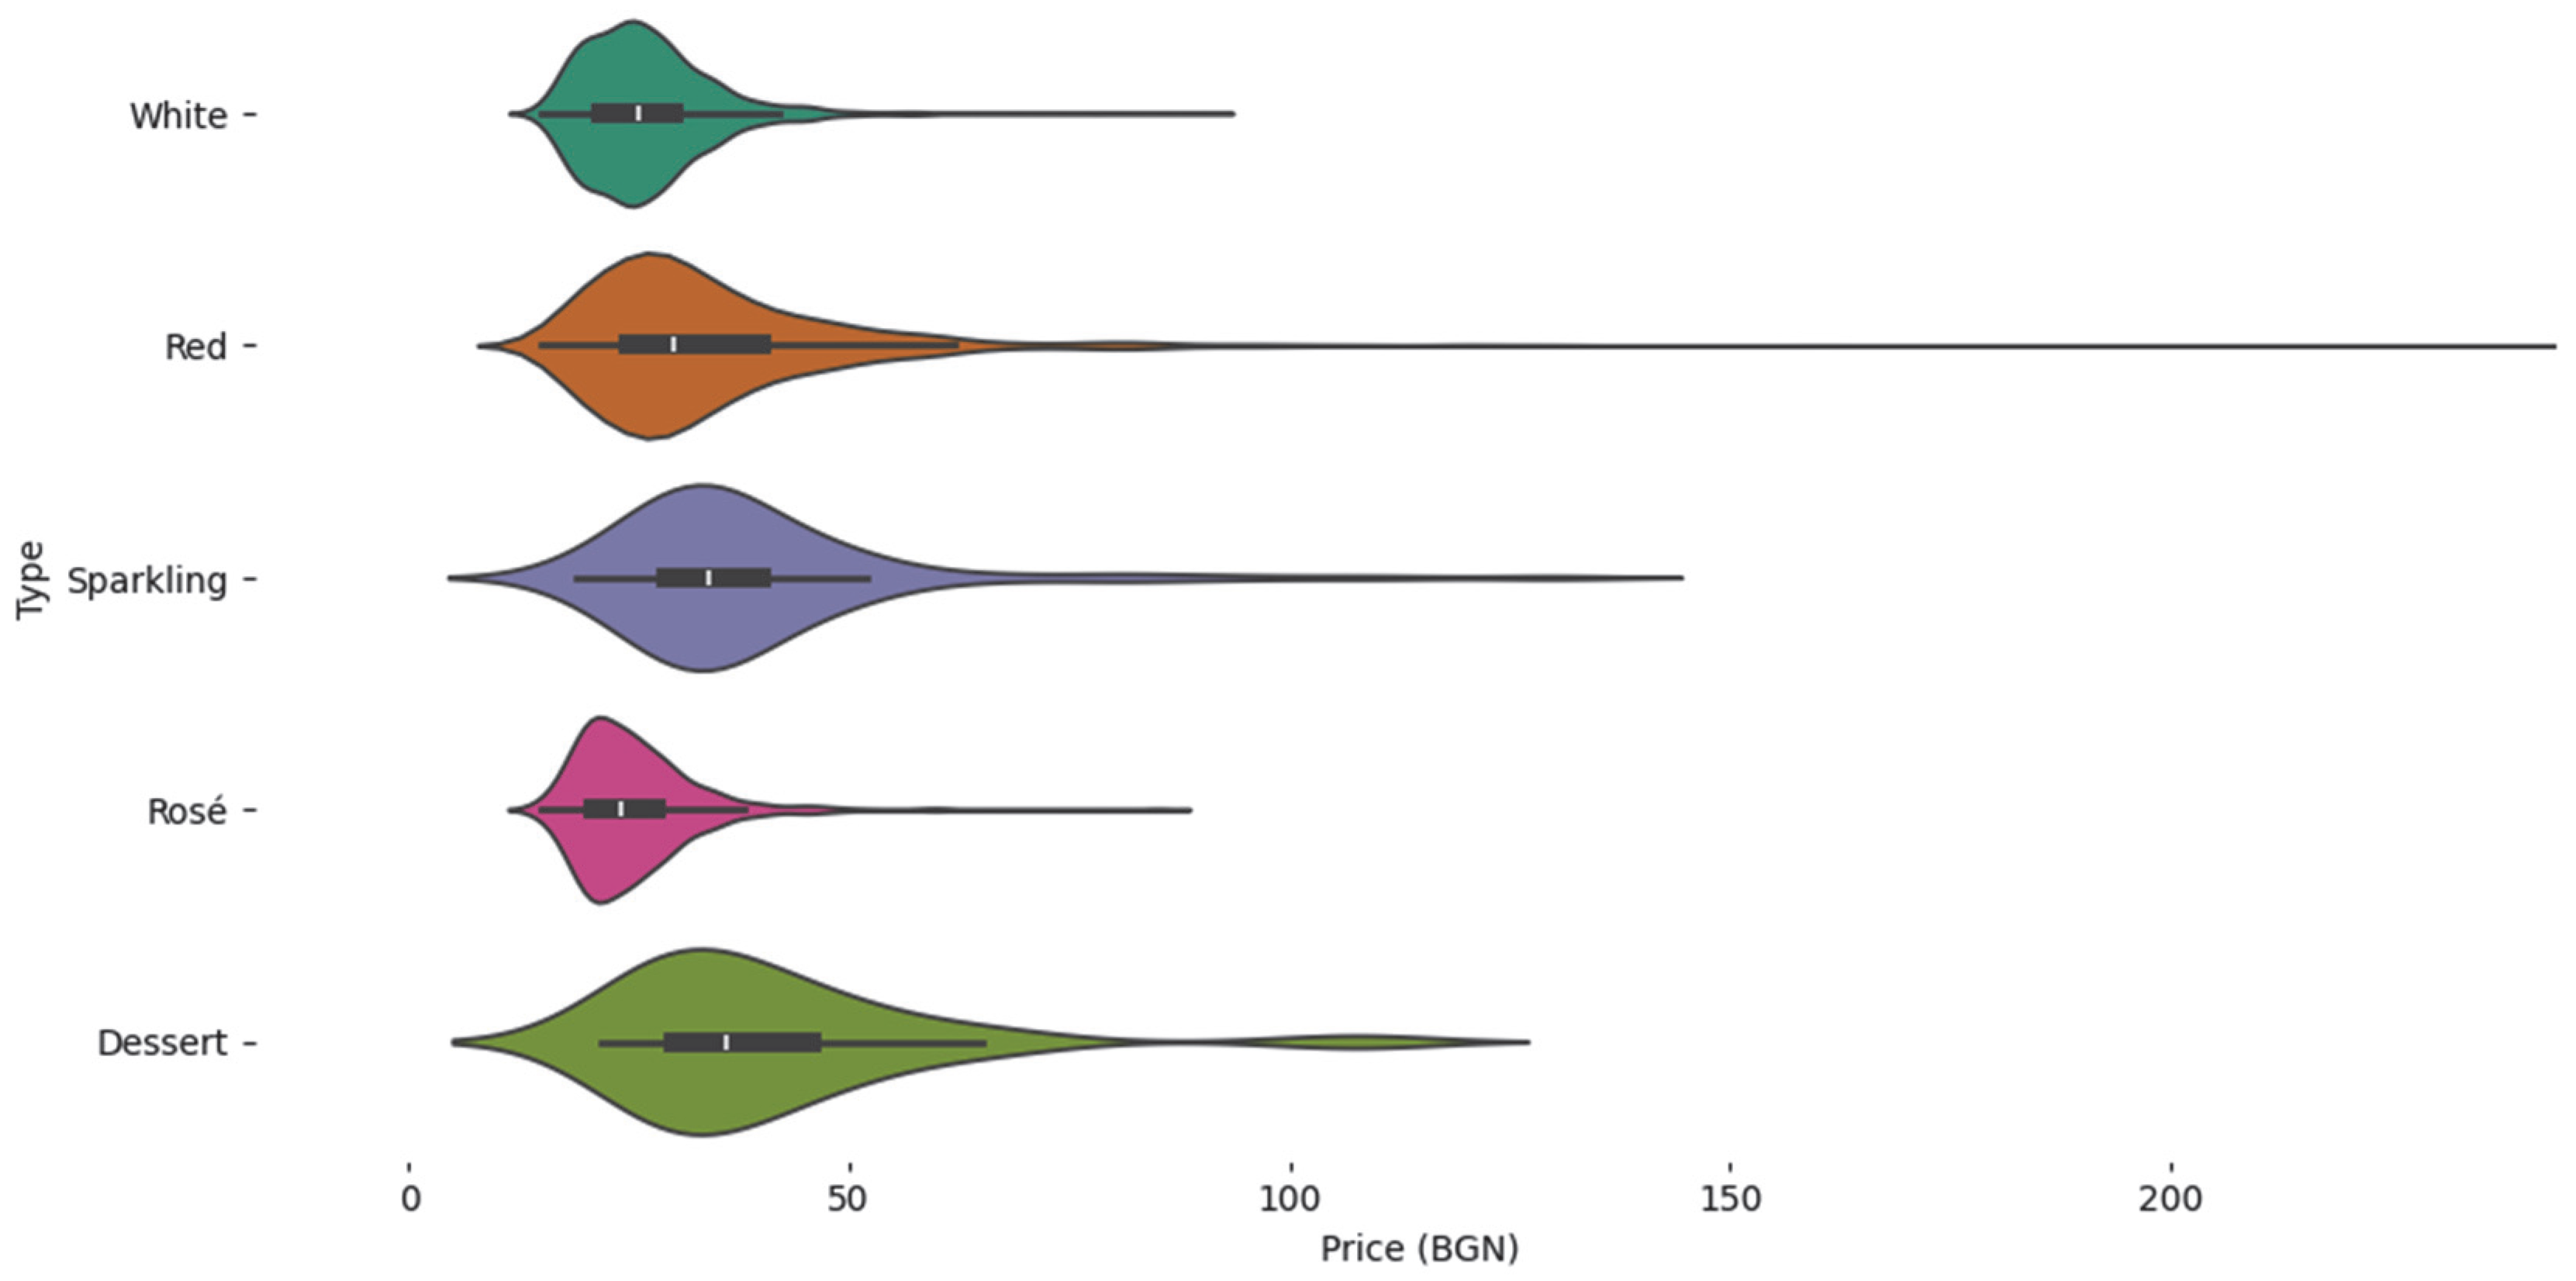
Segment analysis is an analytical approach used to divide a market or product category into clearly defined subgroups (segments) that have similar characteristics, needs, preferences, or behaviors. In this study, segment analysis was applied to Bulgarian wines divided by type (red, white, rosé, sparkling, dessert) and compared on four main characteristics: DiVino rating, tasters’ scores (Points), price (Price) and vintage (Vintage). The results are visualized by a Violin plot with horizontal orientation (
Figure 13,
Figure 14,
Figure 15 and
Figure 16).
Segment analysis of the DIVINO ratings (
Figure 13) shows that red and sparkling wines have a clear concentration of high scores within the 0–5 scale. The violin plots visualize an expansion around values above 4.0, indicating that a significant proportion of these wines received high national ratings. This positions them at the upper end of the wine market and suggests that tasters consistently rate these categories as high quality. At the same time, whites and rosés are characterized by narrower and more even graphs clustered around average scores (in the 3.5–4.0 range), indicating stability but with limited presence in the top rating range. From a marketing perspective, it can be concluded that reds and sparkling wines can be confidently promoted as high quality according to the national rating system, making them suitable for premium positioning. Whites and rosés are more suitable for standardized, mass communication.
A similar pattern can be seen in the professional scores given by the tasters: red wines and sparkling wines again dominate, with a high density of scores between 89 and 92 points (
Figure 14). This consistently high score is an important argument for their premium positioning. White and rosé wines again show a narrower and more symmetrical distribution around scores in the 85–87 point range, which is appropriate for communication strategies that emphasize lightness, accessibility and versatility. Dessert wines are characterized by greater internal variation—both in terms of ratings and scores—suggesting heterogeneous perception by tasters and the possibility of niche positioning.
The price analysis (
Figure 15) shows that red and sparkling wines again have the widest distribution, including tails to high price values. This suggests that these categories include both wines in the standard price range and those positioned as luxury products. Whites and rosés, on the other hand, are concentrated in the lower price ranges, defining them as affordable wines suitable for everyday consumption. Dessert wines occupy an intermediate position with no clear price peak, which can be interpreted as an indication of a less defined market segment. These findings are consistent with those of Kotonya et al. [
25], where significant cross-type and regional variation in wine preferences was identified on the Vivino platform.
The distribution of vintage (
Figure 16) also provides interesting results. The white, sparkling and rosé wines are mainly concentrated around the most recent vintages, which is consistent with the expected freshness and quick realization of these types of wines. In contrast, red and dessert wines show a wider range of years, including older vintages, reflecting their aging and storage potential. This is an important competition advantage when building brands based on tradition, maturity and long-term value.
The data clearly indicated that red and sparkling wines have the potential for high-end positioning, supported by high objective ratings and national recognition. This justifies the creation of premium product lines with a focus on tradition, aging and winemaking, which can be communicated through dedicated channels, tasting events and wine clubs.
Whites and rosés, with their predictable quality and lower price point, are ideal for mass campaigns aimed at the general public. They can be positioned as everyday, versatile wines that combine taste, accessibility, and a modern look, particularly effective when targeting young, urban audiences via social media.
The wide price range for red and sparkling wines allows for flexibility: the simultaneous development of basic, reserve, and exclusive ranges within the same category. This allows the core brand to cover different market segments while maintaining its identity and extending its reach.
Cui et al. [
34] demonstrate that AI-based wine price forecasting, enhanced by swarm algorithms and macroeconomic indicators (e.g., gold prices, stock indices, inflation), achieves accurate predictions and uncertainty estimation. This highlights the need to align wine descriptor profiles with dynamic economic forecasts to support sustainable premium pricing.
Yeo et al. [
46] apply Gaussian Processes and multi-task learning to forecast premium wine prices, showing that nonlinear models outperform traditional time series and enable cross-type predictions—supporting the role of stylistic profiles in price modeling.
Older vintages in red and dessert wines build narrative value—tradition, craft, and heritage—which are powerful market differentiators, especially in exports.
According to Masset et al. [
47], secondary market value is shaped by both sensory qualities and symbolic capital (vintage, brand, expert ratings), reinforcing the strategic role of storytelling and positioning.
Segment analysis confirms the need for a differentiated portfolio: flagship wines (prestige) and complementary products (market share), grounded in data.
Tranzola Santos et al. [
14] offer a quantitative selection model combining clustering, PROMETHEE II, and linear programming—ranking wines by chemical and sensory profiles, in alignment with consumer preferences and strategic goals.
Hybrid recommendation systems, such as the one in Redelinghuys and Er’s study [
48], integrate collaborative filtering and content analysis with explainability, boosting user trust and engagement.
Finally, de Azambuja et al. [
49] introduce X-Wines—an open dataset with over 21 million ratings—enabling large-scale model training, validation of stylistic profiles, and personalized recommendations based on real behavior.
3.6. Analysis of Wine Quality Prediction Models
In this section, various machine learning models are developed and used for classification and prediction. The goal of the classification task is to predict whether a wine falls into the “high-quality” category based on its characteristics (region, varietal, type, price, vintage year, description, etc.). For the purposes of this study, a wine is considered high quality if it receives a score of 87 points or more from professional tasters. The choice of a threshold of 87 points is motivated by professional practice, where a score ≥87 is perceived as an indicator of a wine of high quality and market value. This defines a binary classification problem formulated as follows:
Let X be the set of input features describing each wine:
categorical (region, variety, type),
numeric (price, year, number of words in the description),
and textual (description of taste characteristics converted by embedding or quantitative transformation).
Let
y ∈ {0,1} be the target variable that:
The objective of the model is to obtain a function f: X → {0,1} that maximizes the ability to correctly classify wines with respect to a given threshold, with the possibility of prioritizing the sensitivity (Sensitivity), due to the interest in detecting as many high-quality products as possible. The following Logistic regression, Random Forest, XGBoost and SVM models were developed to solve this problem. The obtained results are presented in tabular and graphical form.
Table 8 contains key metrics for each of the classification models. It shows that Logistic regression shows the best overall performance with the highest AUC value and excellent precision. XGBoost demonstrates the best ability to recognize high-quality wines (sensitivity). SVM fails to correctly classify any positive example and is unsuitable for the task.
The obtained results—particularly the strong performance of the logistic regression model (AUC = 0.92)—are consistent with the findings of Katumullage et al. [
22], who reported similar accuracy using a BERT-based model (AUC = 0.8912) for binary classification, illustrating that interpretable models can achieve competitive performance compared to deep learning architectures.
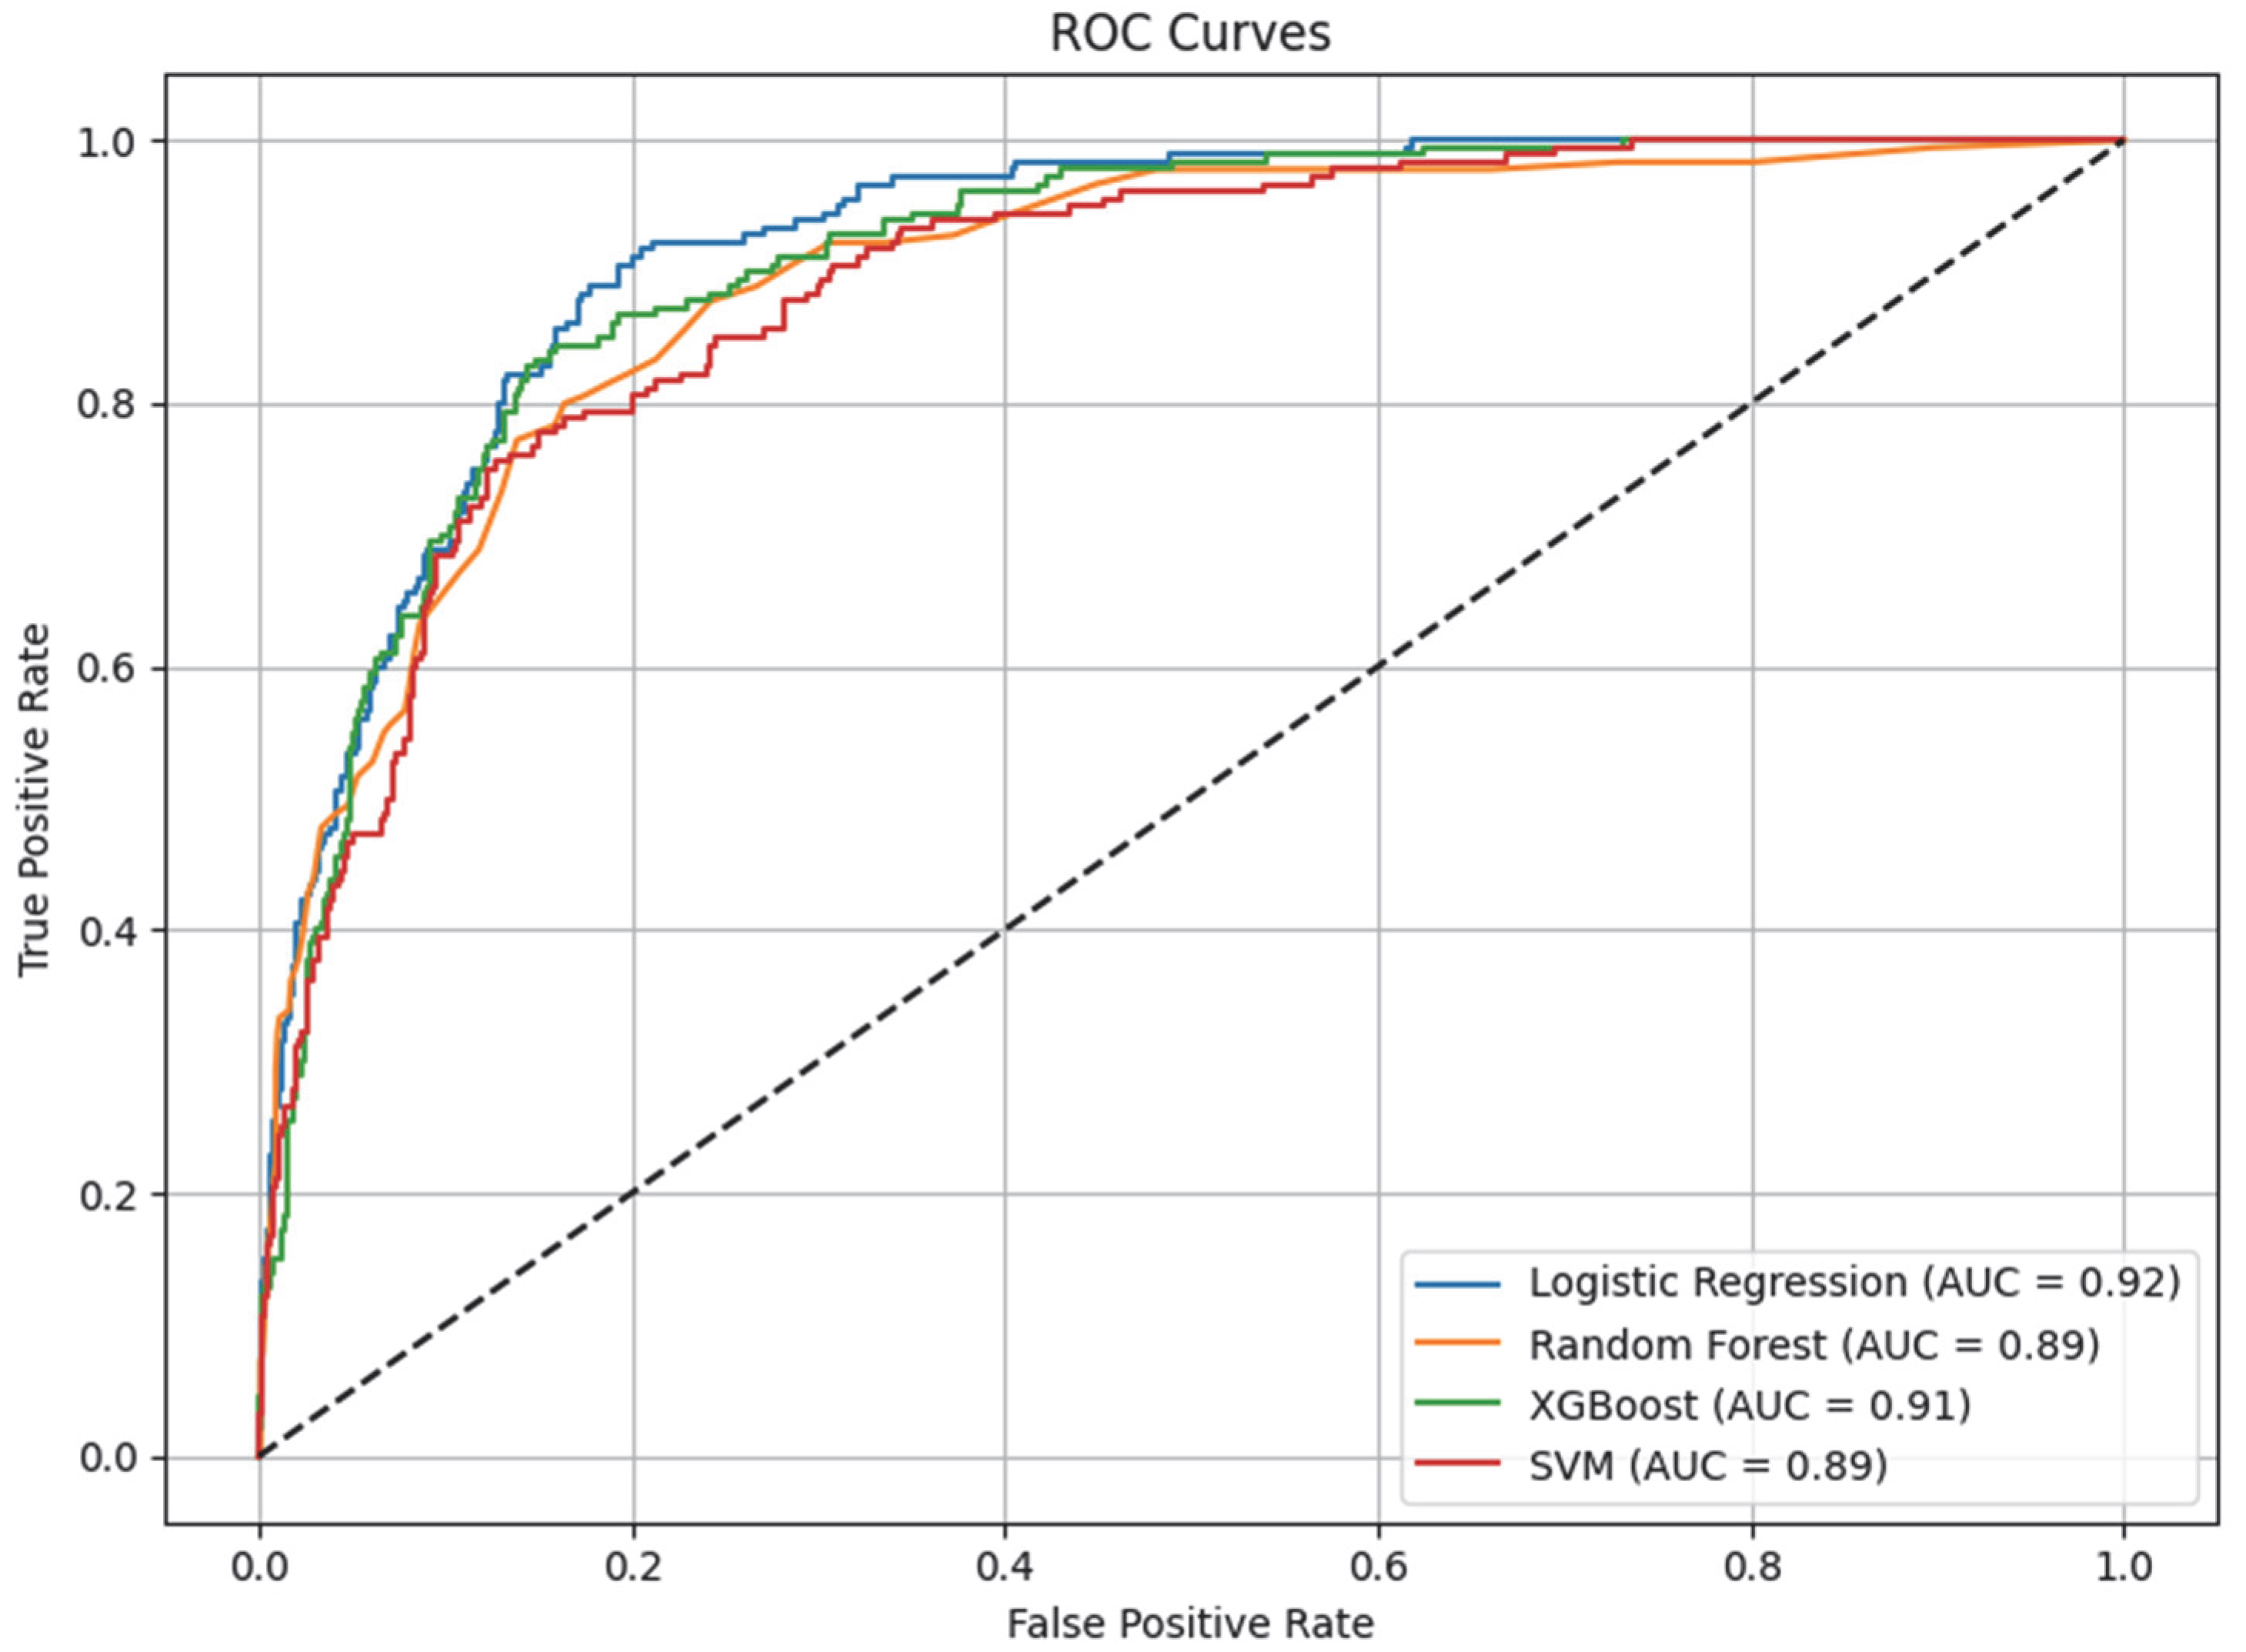
Figure 17 presents the Receiver Operating Characteristic (ROC) curves for the developed models. These are used to illustrate the ability of the classification models to discriminate between positive and negative classes, at different decision thresholds. It can be seen that Logistic Regression has the highest AUC value (0.92), meaning that it best balances between detecting positive cases and avoiding false alarms. XGBoost also shows a very good AUC (0.91), a confirmation of its flexibility in complex dependencies. Random Forest (AUC 0.89) remains competitive, albeit slightly lower. SVM shows an AUC of 0.89, but its real value is questionable as there are no correctly classified positive cases (Sensitivity = 0). In the context of unbalanced classes (many more wines below 87 points, as the dataset studied), ROC AUC is a valuable metric because it is not sensitive to imbalance. This explains why even SVM shows a high AUC, but its actual utility is zero.
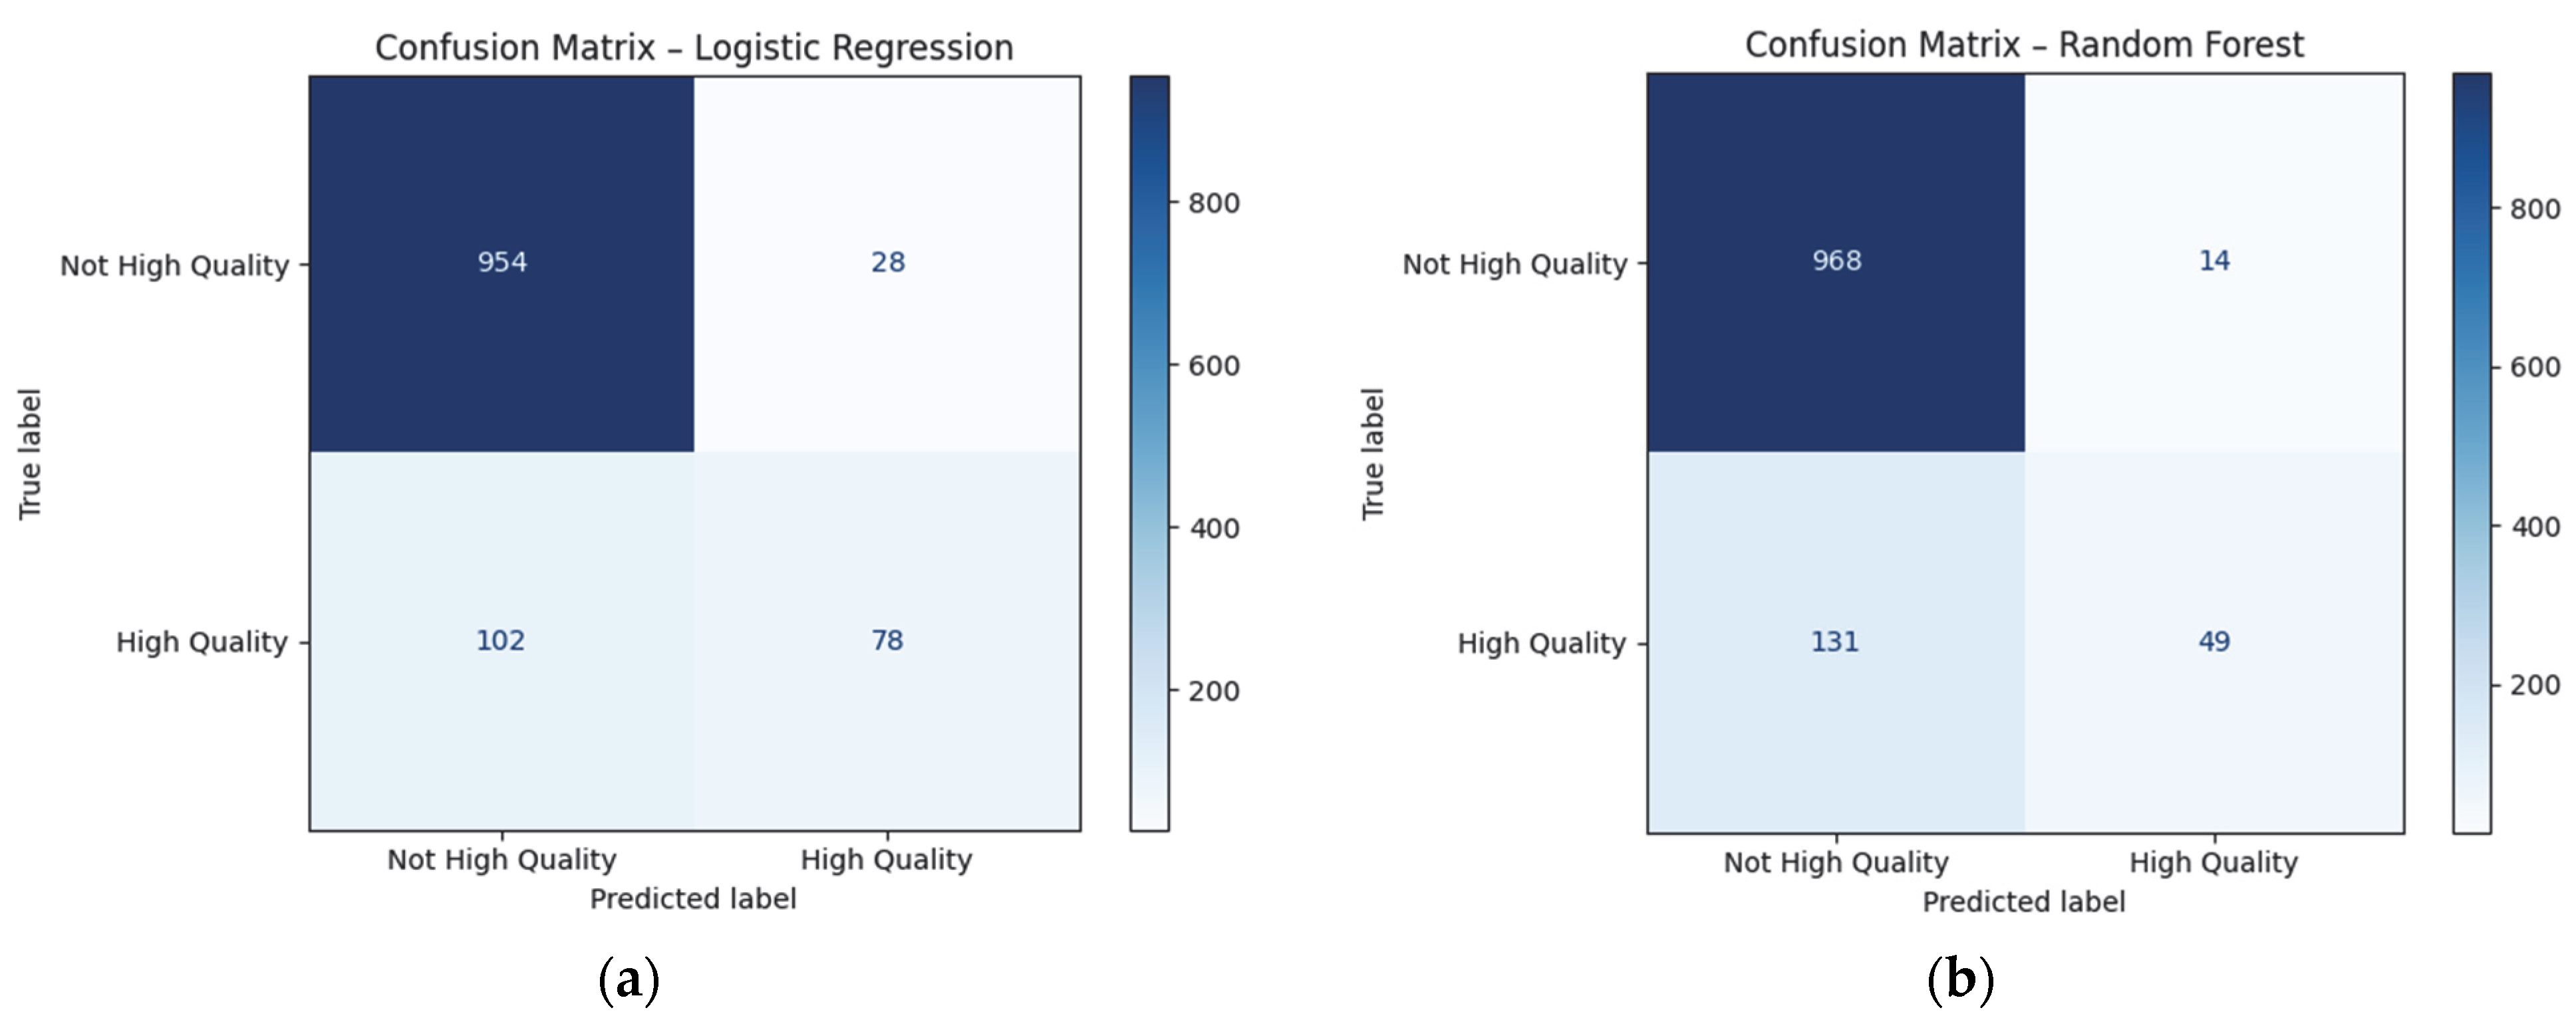
Figure 18 visualizes the Confusion Matrices for the individual classification models. It shows how many examples of each class are correctly or incorrectly classified. Logistic Regression (
Figure 18a) shows a good distribution between TP (true positive) and TN (true negative). Although Sensitivity = 0.43 (moderate ability to find “good” faults), the balance between Precision and F1 is best. This makes logistic regression suitable for mass application with reliable predictability. It could be said that logistic regression is the “happy medium”—it is neither too conservative nor too “risky”. It is suitable for standardized recommendations, automated sorting in online catalogs, and mobile applications where speed, interpretability and acceptable risk of error are required.
The Random Forest model (
Figure 18b) has a low Sensitivity (0.27), which means that the model manages to “catch” only 27% of all really good wines, but misses 73% of them. At the same time, it has a high Precision, which means that when it classifies something as “good”, it is usually correct. From a marketing point of view, this makes it suitable for maintaining an image of reliability and controlled quality, for example, when selecting wines for representative tastings, award selections or in lists of established restaurants. It is not suitable for discovering new and under-appreciated wines because it is not ‘proactive’—it will not suggest something if it is not fully convinced. Good if you want to avoid the risk of recommending a wine that does not meet your high standards.
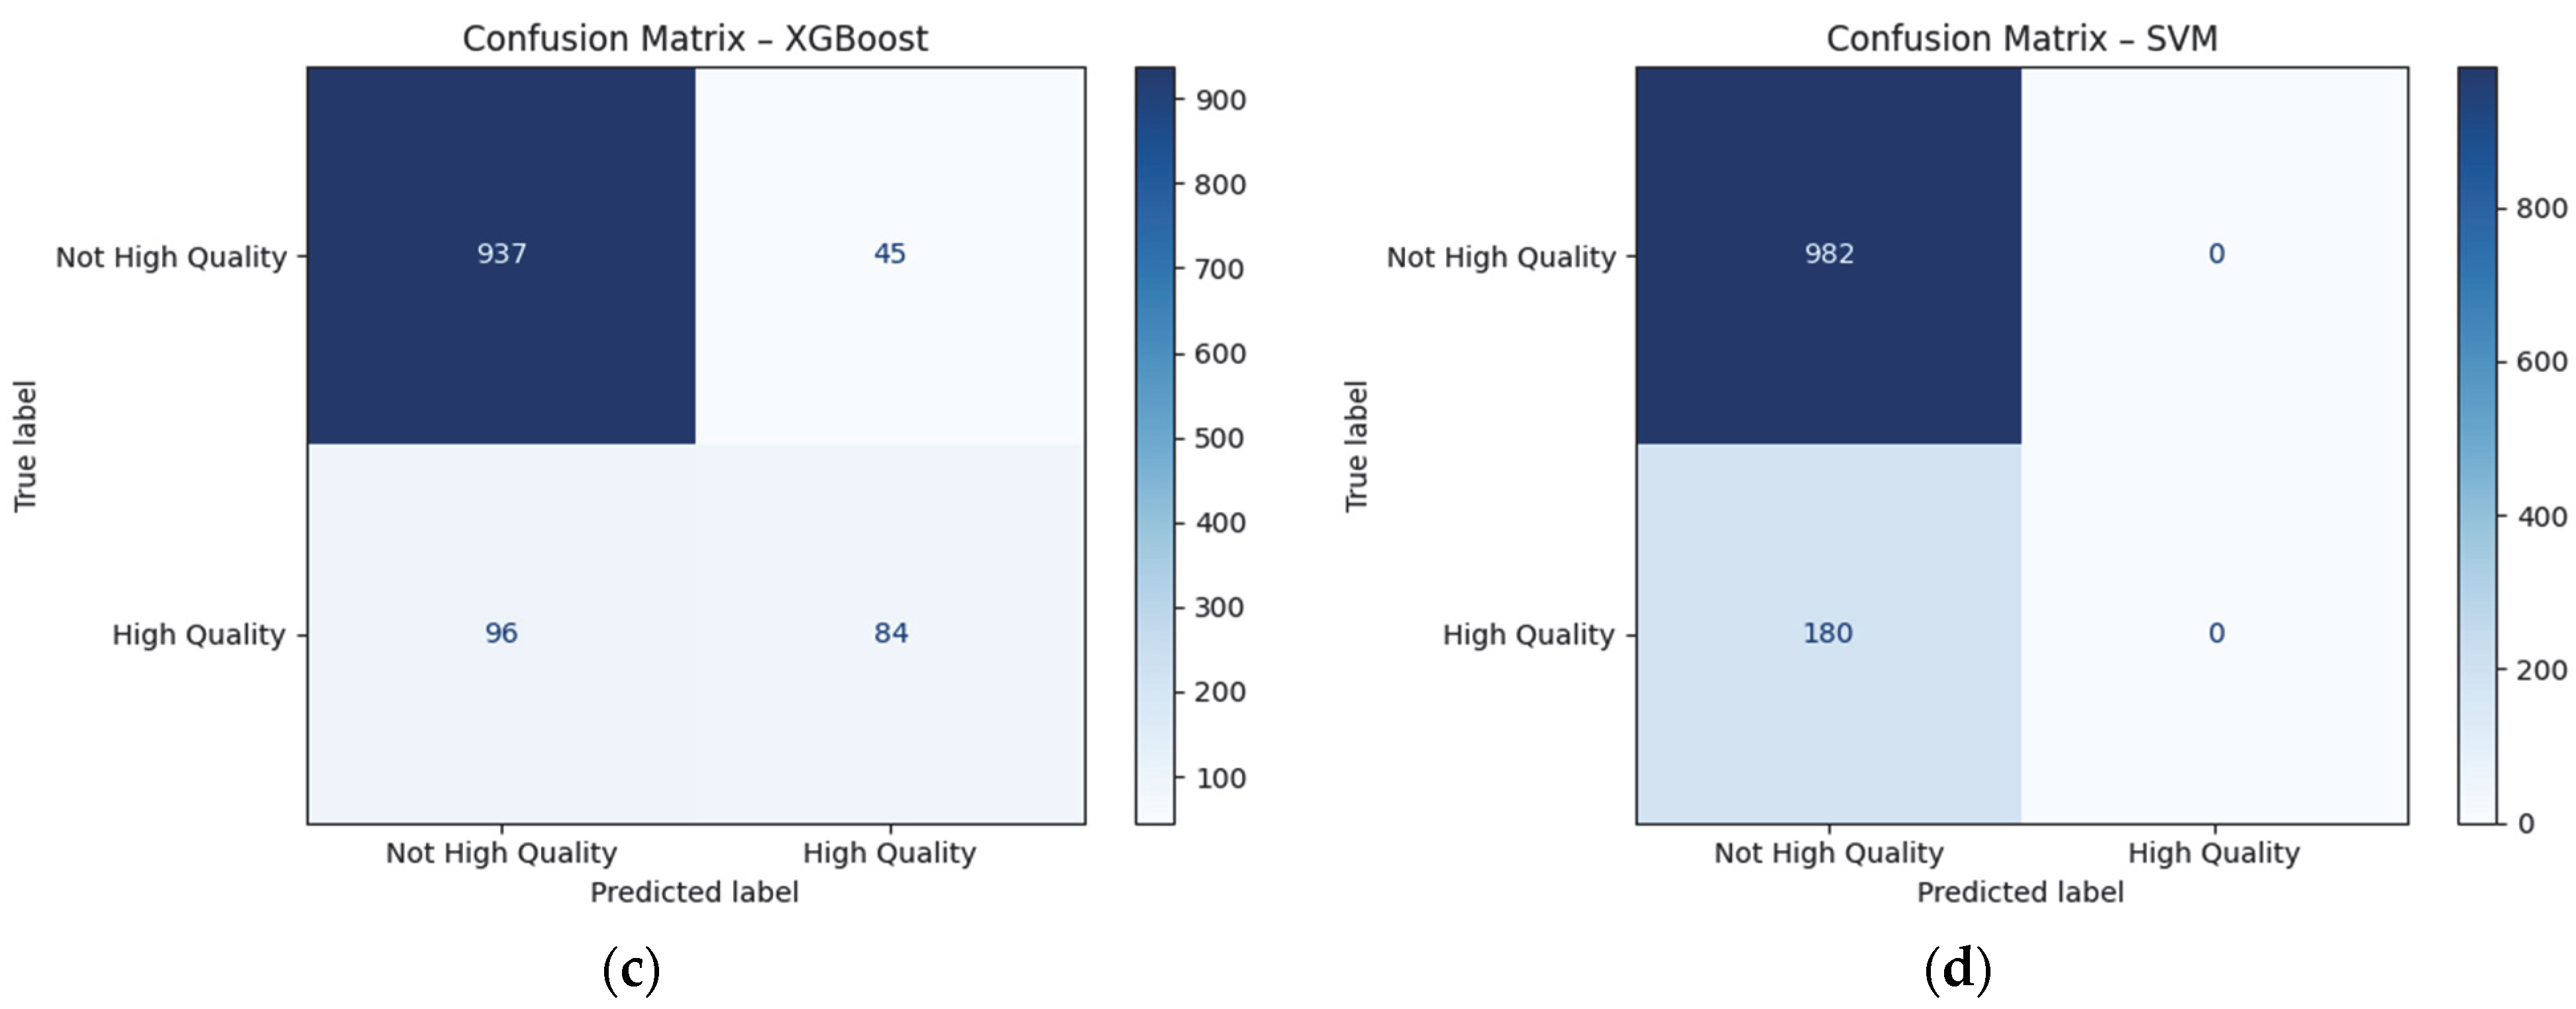
The XGBoost model (
Figure 18c) gives the best balance between positive and error detection. It has Sensitivity = 0.47, i.e., it is the most effective at identifying high-quality wines, despite lower Precision. Suitable for marketing recommendations with a focus on detecting potential flagship products—wines that are not yet recognized in the market but have a quality profile according to objective and text indicators. In marketing, it is a “discovery model”—suggesting, experimenting, and showing new possibilities. It is suitable for recommendation systems that need to be proactive—not waiting for the consumer to discover the product on their own but offering options that statistically have a high chance of success. This is particularly useful for new products, new vintages or wines from less popular regions that do not have an established market name but have high objective qualities.
The SVM model classifies all positive examples as wrong. It has Sensitivity and F1 = 0, making it inapplicable to the problem.
The second problem we aim to solve with machine learning models is a regression problem. The goal is to predict the specific professional score (in points) of a wine using its descriptive, numerical and categorical characteristics. This is a regression problem with one continuous target variable, the wine’s score on a 100-point scale set by professional tasters. Let X be the set of predictors (features) which include:
Categorical variables: wine type (Red, White, etc.), variety (Cabernet, Mavrud, etc.), region, vintage year;
Numeric variables: price, length of description;
Textual information: descriptions of taste and aroma characteristics processed by embedding or quantitative transformation (TF-IDF, bag of words, etc.).
The target variable is y ∈ R, with y denoting the wine quality score, which ranges between 80 and 95. The task is to determine a function f: X → y such that the error between the predicted estimate and the actual value of y is minimized.
The 100-point wine rating is usually on a scale of 50 to 100 points, but in the practice of professional judging—especially in selections, tasting competitions and wine publications—scores below 80 are practically not used. Furthermore, in the dataset studies, wine scores actually range from about 80 to 95 points. It is for this reason that the range of 80 to 95 points is considered in this assignment.
MLP model (neural network), Random Forest, XGBoost and SVM are developed to solve this problem. The main metrics used to evaluate these models are presented in
Table 9. It can be seen that the MLP model shows the best behavior on all metrics—it has the lowest MAE (mean absolute error), which means that its predictions deviate on average by 1.15 points, the lowest MSE and a coefficient of determination R
2 = 0.656, i.e., over 65% of the variance in scores can be explained by the model. Random Forest and XGBoost are close to MLP but with slightly higher errors. SVM is again an extremely weak regression model. The best-performing model was selected based on the evaluation results summarized in
Table 9. To avoid overloading the article with auxiliary visualizations, training loss curves are not included.
Figure 19 presents a scatter plot of predicted versus actual values for the MLP model. It can be seen that the points are located approximately linearly around the red line, indicating a good correlation between real and predicted values. This is an indicator of the high predictive ability of the MLP model. For estimates above ~90 points, the model tends to predict lower values, as evidenced by the points being below the red line. This suggests a slight overestimation of accuracy in the premium class—a possible effect of fewer observations in this area. However, upon closer examination, several wines with actual scores below the 90-point premium threshold are predicted with values above 90. These false positives indicate that the model occasionally overestimates the quality of non-premium wines. This misclassification may be due to stylistic overlap in the descriptive language of some sub-premium wines, or to modeling factors such as imbalanced data or insufficient regularization. While limited in scope, these cases carry practical implications for real-world deployment, as they may lead to inflated expectations or misaligned market positioning. Addressing such limitations—e.g., via calibration or semantic feature refinement—could enhance model robustness and trustworthiness in future applications.
In the low range, more scattered points are observed, especially below the line. This may be due to greater variation in quality or weaker textual and descriptive characterization of the wines, which do not provide sufficient predictive value.
The MLP model is suitable for quality prediction when mass automated evaluation of new products based on textual description and numerical parameters is intended. Wines where the model shows systematic underestimation can be identified as potential ‘hidden gems’—i.e., products whose communication campaign should highlight their unique quality that the algorithm has not fully captured. These biases also provide an opportunity to develop different pricing and promotional strategies, especially for wines with a high real valuation but poor predicted value.
From a marketing perspective, the regression task of predicting wine scores (Wine Points) is of strategic importance as it provides a predictive value for the quality of a product even before it is tasted or professionally rated.
In parallel with language models, other authors have developed multimodal architectures for automated wine quality assessment that also use sensory data. In [
50], 1D-CNN and LSTM were combined to analyze volatile organic compounds (VOCs) detected by an electronic nose to predict wine ratings. Their results show that even without textual descriptions or human tasting, the algorithm can achieve high classification accuracy. This opens up possibilities for future integration between language and sensory inputs, which would increase the predictive power of the models, especially for wines with difficult-to-classify lexical profiles.
4. Conclusions
The present study integrates methods from natural language processing, clustering, classification and regression to build an interpretable model for stylistic and qualitative analysis of wine descriptions. The main results show that text descriptors in reviews carry high predictive value both for classifying wine style and for assessing objective quality and market value. The BERT model, used for thematic segmentation and vectorization, demonstrates a high ability to extract semantic cores that match real stylistic differences between wines. This confirms that the language in tasting descriptions follows stable semantic structures. Among the classification models, Logistic Regression and Random Forest showed the best balance between accuracy and interpretability for predicting wine style. For Wine Points regression, the MLP model achieved the highest accuracy, but with a tendency to systematically underestimate certain wines. This feature can be used to identify “hidden gems”—products whose quality is underestimated by the algorithm but highly rated by experts. This opens up opportunities for price positioning and marketing differentiation.
From a practical point of view, the developed system can serve as a basis for automated recommendation mechanisms that associate style, price, consumer preferences, and marketing goals. Such systems would be particularly useful for e-commerce, wine clubs, producers with a rich portfolio, and distributors aiming for effective customer segmentation. In addition, thematic clustering allows for the development of stylistic profiles that can be used in storytelling campaigns, labeling, catalog layout, and visual communication.
The study, despite its contribution, also has limitations. The data are sampled and do not cover the full market; the class imbalance in the rating scale (only one wine with a score of 5) affects the stability of the regression models. Also, BERT models, despite their power, do not always allow for easy interpretation of the logic behind the classifications. Future versions of the model would be appropriate to add more balanced training data, use multimodal inputs (e.g., visual elements from labels), and explore explainable AI approaches for increased transparency. In conclusion, the study demonstrates that language analysis and machine learning can offer real solutions in the wine industry by connecting taste profiles, consumer perceptions, and market logic into a single analytical framework. The analysis conducted is one of the first large-scale studies that combines thematic clustering, text classification, quality prediction, and price positioning in the context of wine descriptions. To date, there is no other publication in the scientific literature with a similar scope and integration of linguistic, behavioral, and economic factors. In this sense, the results of this study can serve as a practical guide for the development of digital tools, recommender systems, and style profiles in the wine sector—both for research purposes and for strategic application by marketing teams, electronic platforms, and producers.


