Article

Extraction of Grape Juice: Impact of Laboratory-Scale Pressing Methods on the Chemical Composition

1
Department of Food, Environmental and Nutritional Sciences (DeFENS), Università degli Studi di Milano, Via G. Celoria 2, 20133 Milan, Italy
2
GRAPPE, Ecole Supérieure des Agricultures, USC 1422 INRAE, SFR 4207 QUASAV, 55 Rue Rabelais, BP 30748, Cedex 01, 49007 Angers, France
3
Department of Agricultural and Environmental Sciences (DISAA), Università degli Studi di Milano, Via G. Celoria 2, 20133 Milan, Italy
*
Author to whom correspondence should be addressed.
Beverages 2025, 11(1), 23; https://doi.org/10.3390/beverages11010023
Submission received: 22 December 2024 / Revised: 22 January 2025 / Accepted: 27 January 2025 / Published: 5 February 2025
(This article belongs to the Section Wine, Spirits and Oenological Products)

Abstract

:
The monitoring of grape maturity is essential for determining the ideal harvest time as well as for obtaining the expected characteristics of grape juice and, consequently, of wine. This study aimed to examine the impact of various laboratory-scale pressing methods on key chemical parameters (sugars, pH, and titratable acidity), as well as on phenolic-related indexes and antioxidant activity, in juices from Chardonnay (six grape samples) and Pinot blanc (two grape samples) across two vintages (2022 and 2023). The grape samples were characterized in terms of total and extractable flavonoids and extractability (%). Four different methods (manual pressing, vacuum pressing, small screw press, and juicer) were applied for producing grape juice. The results showed relevant differences in the extractability among the grape samples up to 64.1% and 43.8% for harvests 2022 and 2023, respectively. Comparable sugar content, pH, and titratable acidity were found in the juice samples independently from the method used. On the contrary, notable variability among the different pressing methods was revealed for phenolic-related indexes and antioxidant activity. The small screw press led to lower total phenol index values across grape batches compared to other methods, while the juice samples obtained with the juicer revealed a composition consistently differing in comparison to the other methods. Raman spectroscopy allowed to clearly classify the juice samples based on the pressing method. Good predictive models were obtained due to the composition of juice samples being clearly distinct among methods. This data suggests that an appropriate pressing method should be adopted for monitoring the grape ripening as well as for simulating the pressing under industrial scale.

1. Introduction

Grape berry maturity plays a critical role in determining the harvest time and controlling the quality of grape juice and wine. Several parameters allow to describe the grape quality and maturity status including sugars, organic acids, phenolics, aroma and aroma precursors, mineral substances, nitrogen compounds, and the mechanical properties of berries [1]. Generally, sugar content is the traditional marker of the grape maturity stage and defines the harvest date based on its ratio with acidity, known as technological maturity [2]. Especially for sparkling wine production, such a ratio goes towards the acidity that should be consistent at harvest. This is because a high-quality base wine is characterized by high acidity and low pH, and the sugar content should be relatively low leading to potential ethanol at about 11–11.5% (v/v). Moreover, low phenolic content is expected in base wine in order to prevent its susceptibility to oxidation. Besides the harvest date and grape maturity, pre-fermentative steps, especially the pressing, affect the composition of must and consequently of wine. Such aspect is of particular interest for white winemaking and sparkling wine production [3]. Understanding how pressing affects phenolic extraction is essential for improving winemaking processes. However, despite the potential of pressing, the scientific literature detailing the effects of different pressing methods is limited, underscoring the need for further research to advance winemaking practices and produce high-quality wine.
The most common approach used for the evaluation of the grape ripening is to hand-crush some grape berries. Recently, Dumas and co-authors [4] studied how different crushing devices affected the juice extracted from grape berries and the composition of the resulting grape juice. These authors found that the pH and titratable acidity were slightly impacted by the crushing method, without altering the ranking of the grape varieties. Moreover, the study suggested the monitoring of grape maturity by using a crushing method that did not extract the potassium, while maximizing the extraction rate. As a consequence, the methods causing complete berry crushing should be excluded. According to Aerny et al. [5], grape pressing techniques and juice extraction rates significantly influence juice composition. As the extraction rate increased (55% to 85%), juice density, pH, sugar, and potassium levels rose, while tartaric and malic acid concentrations declined. However, Dumas and co-authors [4] did not assess the phenolic-related indexes that should also be considered besides the general chemical parameters, in particular for the grape addressed to the sparkling wine production.
The pressing process affects the extraction of organic acids and ions, aroma compounds and their precursors, as well as proteins. Moreover, the pressing affects the color and turbidity of grape juice [3]. The maintenance of acidity is relevant for white wines as it helps to keep freshness, flavor, and color [6]. The pressing also affects the extraction of phenolics. The total phenolic content in grape juices can be influenced by multiple factors, including grape variety, maturity, geographical origin, and soil type. Additional factors like sunlight exposure and grape juice processing also play a role. Key processing variables include extraction methods, contact time between the juice and solid grape components (skins and seeds), pressing techniques, and any thermal or enzymatic treatments applied.
Chardonnay and Pinot blanc are among the white grapes used for the production of sparkling wines. These grapes are also found in mountain regions, as their climatic requirements are comparable to these geographical areas [7,8]. The mountainous areas provide the necessary heat and cool nights that enhance the grape acidity and flavor development, resulting in wines that express both freshness and complexity. Both grapes make it a significant grape variety in northern Italy, notably for use in producing high-quality sparkling wines, especially within the Franciacorta appellation [9]. In the recent years, the harvest usually begins in the first half of August, since grapes soon reach technological maturity due to the temperature increase. Climate change is significantly affecting wine production by raising temperatures and increasing the frequency of water deficits [10]. Climate has a greater impact on the development of fruit composition, compared to the soil and grapevine variety [11]. In the vine-growing period (April–October), the average rainfall is about 500–600 mm. Changes in rainfall patterns and rising temperatures increase the stress on wine-growing regions which affects the yield and grape quality [10]. In drastic conditions, emergency irrigation is allowed to be carried out in order to adapt the viticulture to the new climate conditions [12].
As the decision of harvest date is relevant for the final composition of grape juice, and consequently of wine, the monitoring of grape maturity by means of the appropriate method is of particular importance. The step of juice-making is a particularly sensitive stage as the work of Dumas et al. [4] suggested. To the best of our knowledge, no data is reported in the scientific literature with regard to the impact of the pressing method under laboratory scale in terms of the phenolic composition of the resulting juice. Moreover, the monitoring of laboratory-scale juice obtained from grapes addressed to sparkling wine production was not investigated, yet. The use of laboratory-scale grape pressing possibly simulating the winery conditions can represent an effective experimental approach for assessing the physicochemical characteristics of juice and managing winery processes. On these bases, the study aimed to investigate the effects of different pressing methods on the general chemical parameters (sugars, pH, titratable acidity) as well as on phenolic-related indexes and antioxidant capacity, for the laboratory-made juice obtained from Chardonnay and Pinot blanc over two vintages. Moreover, the application of advanced techniques, like Raman spectroscopy, had never been applied for the discrimination of grape juice obtained by different extraction methods.

2. Materials and Methods

2.1. Chemicals and Reagents
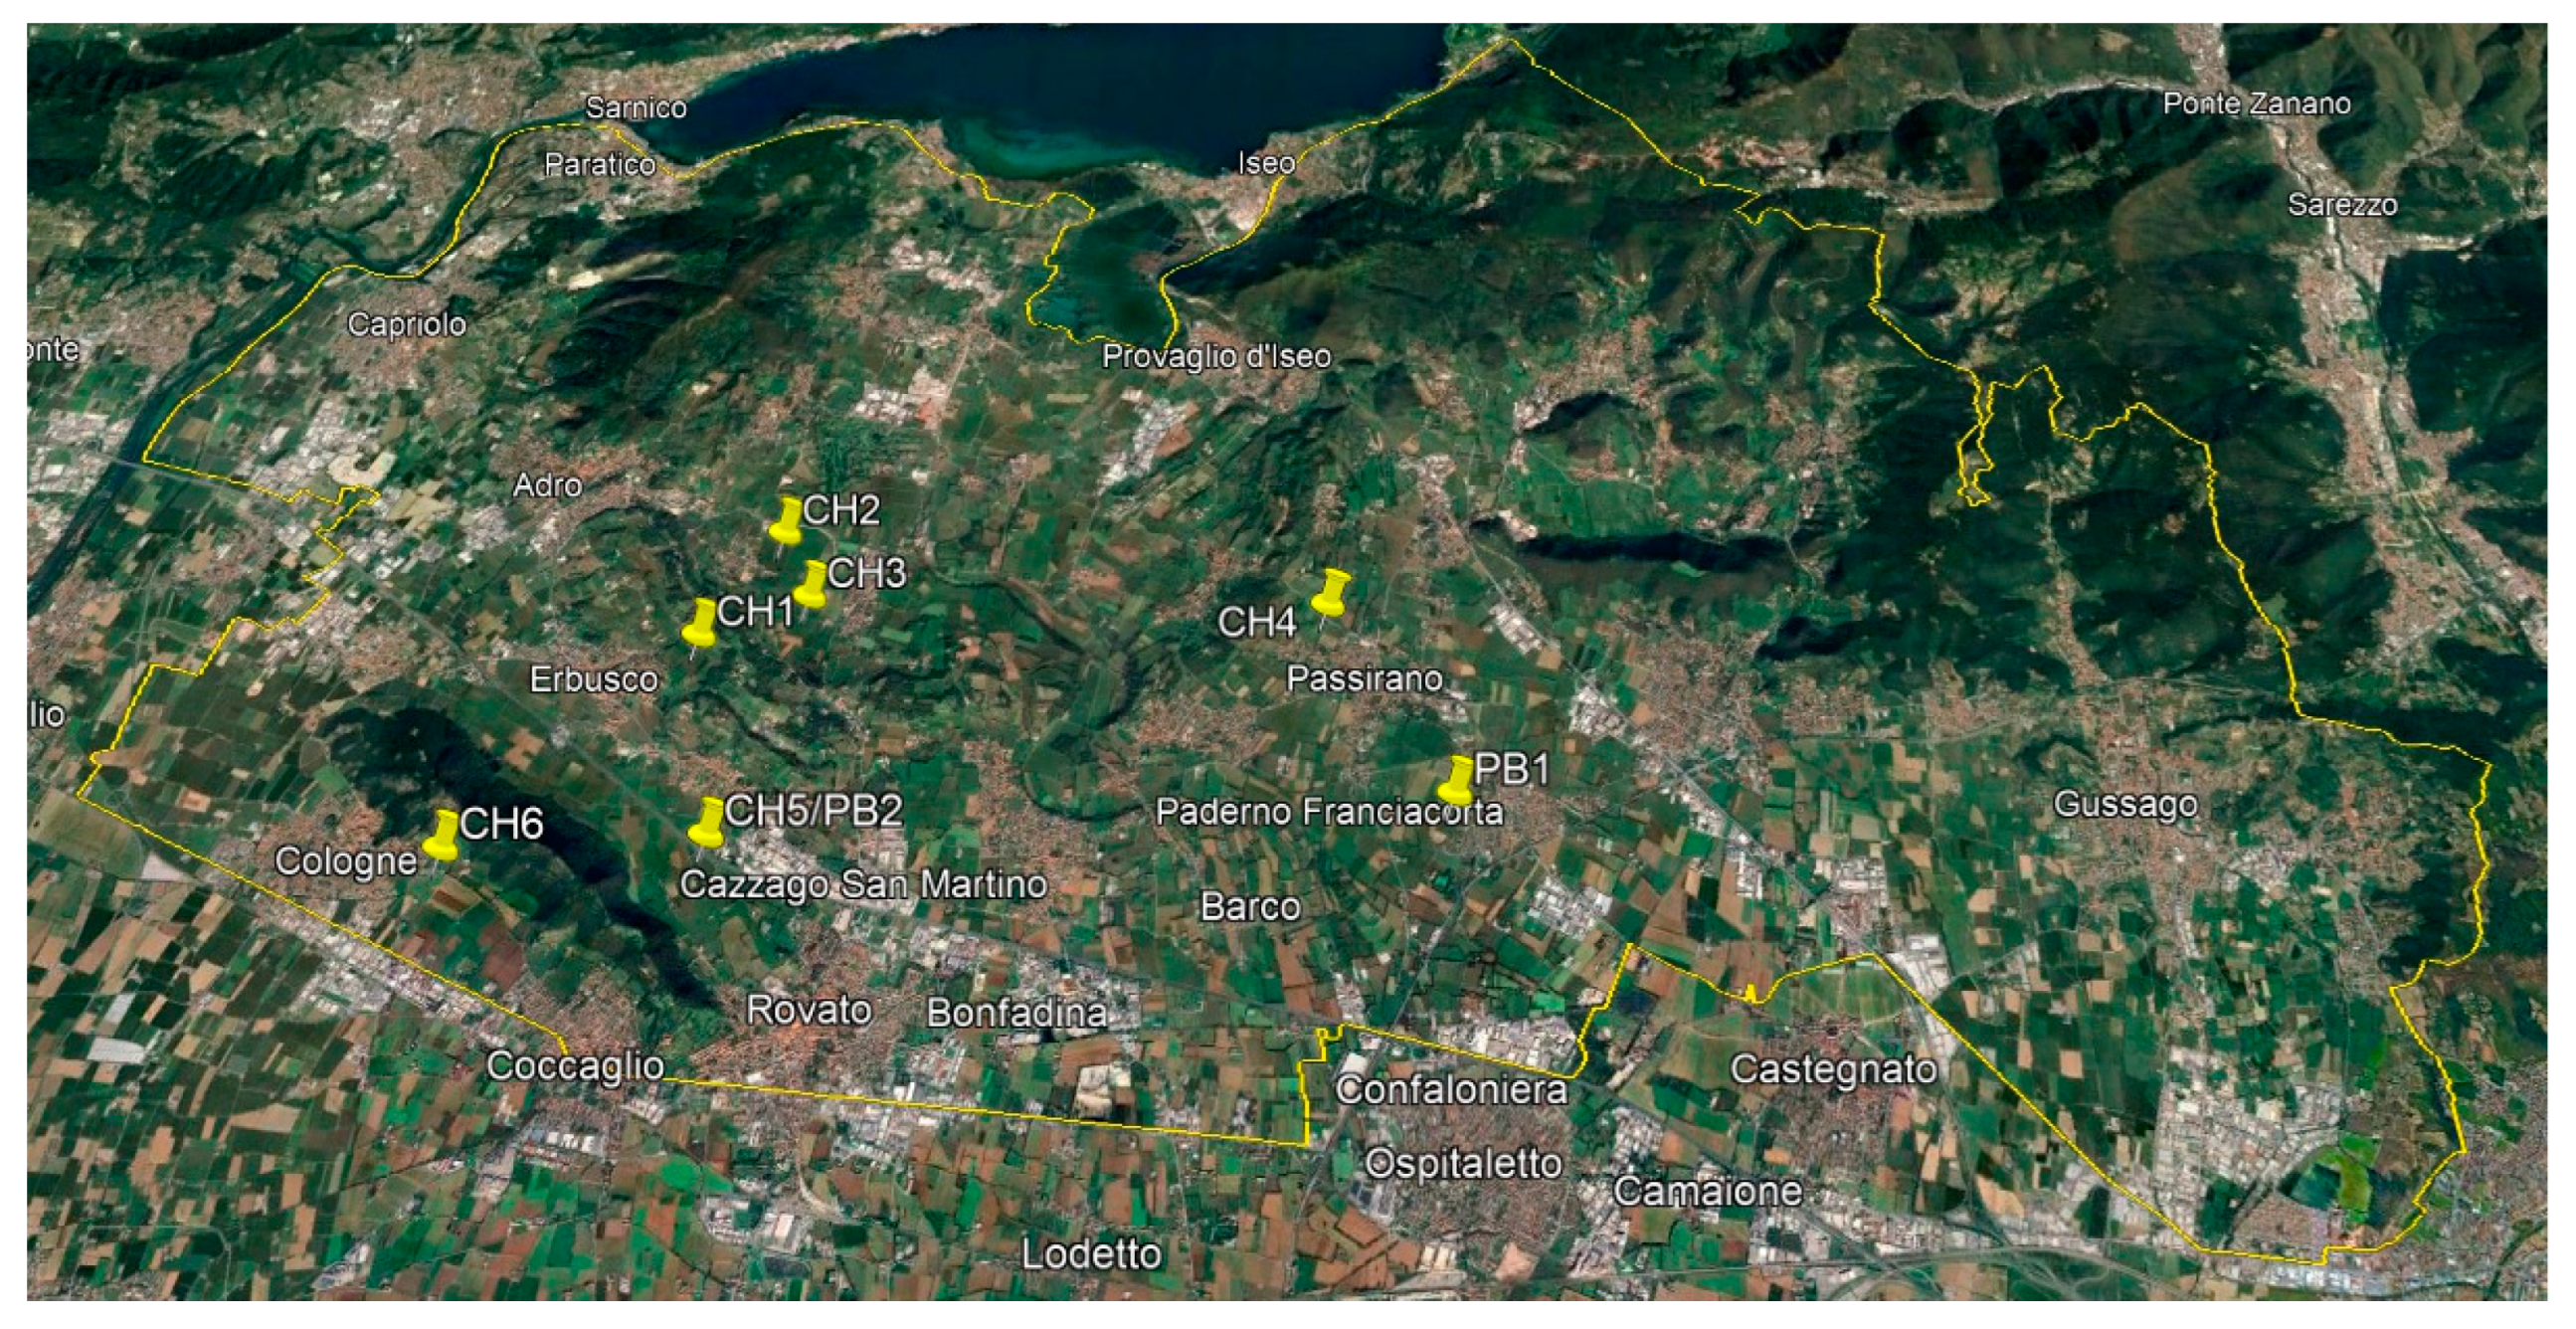
Methanol, ethanol, sodium hydroxide, sulfuric acid, hydrochloric acid, catechol, tartaric acid, 2,2-diphenyl-1-picrylhydrazyl (DPPH), 6-hydroxy-2,5,7,8-tetramethylchroman-2-carboxylic acid (Trolox), Folin–Ciocalteu reagent, gallic acid (99.85% purity), and sodium carbonate (99.99% purity) were purchased from Merck (St. Louis, MO, USA).
The hydrochloric ethanol solution was prepared as follows: ethanol/water/hydrochloric acid 37% 70/30/1 (v/v/v).
The model wine solution contained tartaric acid 5.0 g/L, ethanol 12% (v/v) with pH 3.2 adjusted with sodium hydroxide.

2.2. Grape Samples

Chardonnay (CH) and Pinot blanc (PB) grape samples (around 8–10 kg each) were taken from the sorting belt in order to have a homogenous grapple sample. The sampling was carried out in 6 different wineries for Chardonnay grape and 2 wineries for Pinot blanc grape of the Franciacorta area (Italy Lombardy) in two consecutive harvests, specifically in 2022 and 2023. The grape samples are grown in a limited area (latitude: 45.68–45.54; longitude 9.91–10.20) where the 8 vineyards are located (Figure 1). All the vines were pruned using the classic Guyot system.
An agrometeorological analysis of the two seasons was based on the Corte Franca weather station (Brescia Province Agrometeorological Network), representative of the Franciacorta PDO environmental conditions. The 2022 and 2023 vintages were compared to the reference time-series 1997–2023. The analysis focused on the comparison between the time-series and the experimental seasons, with reference to the following:
-
Tavg—mean yearly temperature;
-
HD—number of hot days (Tmax > 32 °C);
-
Ptot—total yearly precipitation and number of rainy days;
-
Pgs—precipitation in the growing season (April–August);
-
RDtot—yearly rainy days;
-
RDgs—rainy days along the growing season (April–August).
Based on the comparison with the historical data, values exceeding 1 standard deviation from the average value are considered anomalous.
Grapes were collected at the harvest date chosen by the winemakers, approximately 7–20 August for vintage 2022 and 15–31 August for vintage 2023, according to their suitability for the sparkling wine production (around 19 °Brix). The grapes were stored at 4 °C overnight prior to the grape juice preparation (Section 2.3) and the assessment of the quality parameters (Section 2.4).

2.3. Lab-Made Juice Samples

The grape samples were used to make lab-made juices using 4 different methods that are summarized in Table 1. Each treatment yielded about 60–65% of juice for the duration set for each method (Table 1). The grape berries were not sterilized or peeled prior to the pressing. Briefly, the methods applied for the lab-made grape juices were as follows:
Manual pressing. Samples of pedicel-free grape berries (500 g) were randomly collected from the bunches, weighed in a beaker, and crushed by hand. The juice was transferred to an Erlenmeyer flask under nitrogen flow without skin and seeds; the headspace was also saturated with nitrogen for 3 min. The average processing time of a sample was 5 min.
Vacuum pressing. Samples of pedicel-free grape berries (500 g) were randomly collected from the bunches and then vacuum-packed into gas-tight plastic bags at approximately 1 mbar. The grape berries were hand-crushed inside the bags. The juice was transferred to an Erlenmeyer flask under nitrogen flow without skin and seeds; the headspace was also saturated with nitrogen for 3 min. The average processing time of a sample was 10 min.
Juicer (GSX22, H.Koenig, Mitry-Mory, Île-de-France, France). Samples of pedicel-free grape berries (500 g) were randomly collected from the bunches and the juice was automatically obtained by a juicer. The device worked by means of an endless screw allowing us to obtain a grape juice free from skins and seeds. Once the juice was recovered in an Erlenmeyer flask, the headspace was saturated with nitrogen for 3 min. The average processing time of a sample was 5 min.
Small screw press (SC-FT5, VEVOR, Shanghai, China). The manual screw press was a cylindric device with holes where pedicel-free grape berries (2000 g) randomly collected from the bunches were placed. The juice was obtained through the screw connected with a metal plate leading to applying pressure on the berries. The juice was obtained from the screw device, the pomace was eventually gently handled, and the screw was newly closed. The juice was collected in an Erlenmeyer flask and the headspace was saturated with nitrogen for 3 min. The average processing time of a sample was 15 min.

2.4. Assessment of Total and Extractable Flavonoids in Grape Samples

Total and extractable flavonoids were determined as described by Di Stefano and Guidoni [13] and Di Stefano and Cravero [14]. Briefly, 300 grape berries were homogenized by a high-speed IKA Ultra-Turrax T25 (Staufen, Germany) for 3 ± 0.10 min. Total flavonoids were extracted as follows. The homogenized samples (10 g) were added with 10 mL of hydrochloric ethanol solution (see Section 2.1) and incubated for 30 min at 20 ± 2 °C. Then, samples were centrifuged at 5000× g for 15 min (Hettich, Tuttlingen, Germany). The supernatant was collected in a 50 mL volumetric flask, whereas the pellet was re-suspended in 10 mL of hydrochloric ethanol solution and then centrifuged at 5000× g for 15 min (Hettich). The supernatant was recovered into the 50 mL volumetric flask and filled with hydrochloric ethanol solution. The extractable flavonoids were obtained following the same procedure, using the model wine solution (instead of hydrochloric ethanol solution; see Section 2.1) and the extraction lasted 240 min (instead of 30 min).
The quantification of flavonoids was carried out spectrophotometrically by recording the UV–visible spectra in the range 700 to 230 nm using a Lambda 25 spectrophotometer (Perkin Elmer, Cetus, Norwalk, CT, USA) and measuring the absorption values at 280 nm as reported by Corona et al. [15]. The total flavonoids were expressed as g catechin equivalents (eq.)/kg grape [16].
The extractability was calculated as follows [13]:
E x t r a c t a b i l i t y % = E x t r a c t a b l e   f l a v o n o i d s T o t a l   f l a v o n o i d s × 100

2.5. Chemical Characterization of Lab-Made Juice Samples

The parameters assessed in lab-made juice samples were sugars, pH, titratable acidity (TA), color index at 420 nm, turbidity, antioxidant capacity (DPPH assay), total phenol index, polyphenol oxidase activity, and total flavonoids. All of the analytical determinations were carried out in triplicate.

2.5.1. General Chemical Parameters

The pH and TA were measured immediately after crushing the grape samples. A calibrated benchtop pHmeter was used to measure pH.
The titratable acidity was determined by titration with sodium hydroxide 0.1 mol/L following the method OIV-MA-AS313-01 [17]. Results were expressed as g/L of tartaric acid.
The concentration of sugars (glucose and fructose) was determined with the automatic analyzer iCUBIO i-Magic M9 (R-Biopharm, Melegnano, MI, Italy) following the manufacture instructions for the glucose/fructose kit. Results were expressed in g/L.

2.5.2. Total Flavonoids in Lab-Made Juice Samples

The quantification of total flavonoids in lab-made juice samples was carried out spectrophotometrically by recording the UV–visible spectra in the range 700 to 230 nm using a Lambda 25 spectrophotometer (Perkin Elmer) and measuring the absorption values at 280 nm as reported by Corona et al. [15]. All juice samples were diluted with hydrochloric ethanol solution up to 4 times to obtain an absorption value lower than 0.8 ± 0.05 AU at 280 nm. Results were expressed as mg catechin equivalents (eq.)/L [16].

2.5.3. Total Phenolic Index

The total phenolic index (TPI) was determined following the Folin–Ciocalteu method as reported by Fracassetti et al. [18]. Briefly, the grape juice samples were centrifuged at 6000× g for 15 min (Hettich) and properly diluted in methanol/water 50/50 (v/v): 5–10 folds for manual and vacuum pressing juice samples, 2–4 folds for a small screw press juice samples, and 10–20 folds for juicer juice samples.
The reaction mix was prepared as follows: the Folin–Ciocalteu reagent was diluted 10 times in water (v/v) and 2.5 mL were added to 0.5 mL of sample; then, 2 mL of sodium carbonate solution 75 g/L were added. The reaction mix was maintained at 20 ± 2 °C for 1 h in the dark. The absorbance was read at 765 nm (Lambda 25 spectrophotometer, Perkin Elmer). The quantification was carried out by means of the calibration curve for gallic acid (5–100 mg/L) dissolved in methanol/water 50/50 (v/v). Results were expressed as mg gallic acid/L equivalents (eq.).

2.5.4. Color Index

The juice samples were centrifuged at 6000× g for 15 min (Hettich) and undiluted samples were measured spectrophotometrically at 420 nm (Lambda 25 spectrophotometer, Perkin Elmer), using a cuvette with a 1 mm optical path.

2.5.5. Turbidity (NTU)

The turbidity of juice samples was assessed without centrifugation and dilution by spectrophotometric reading at 750 nm (Lambda 25 spectrophotometer, Perkin Elmer), which was converted into nephelometric turbidity units (NTU) through the correlation reported by Goodner [19] being also applied in another research [20].

2.5.6. Polyphenol Oxidase Activity

The polyphenol oxidase (PPO) activity was assessed by measuring the increase in absorbance at 400 nm, using catechol as substrate. Catechol 0.1 M was dissolved in a tartaric buffer solution (5 g/L of tartaric acid, adjusting the pH at 3.5 with sodium hydroxide). Then, 1.5 mL of juice samples, were separately added to 1.5 mL of tartaric buffer (control sample) or to tartaric buffer enriched with catechol 0.1 M (catechol sample) and finally incubated for 10 min. Thus, the samples were submitted for spectrophotometric reading at 400 nm (Lambda 25 spectrophotometer, Perkin Elmer). The PPO units were calculated by subtracting the AU value registered for the control sample (without catechol) from the samples added with catechol. One PPO unit was defined as the amount of enzyme leading to an increase of one absorbance unit at 400 nm in 10 min [20,21].

2.5.7. Antioxidant Activity

The antioxidant capacity was analyzed by 2,2-diphenyl-1-picrylhydrazyl free radical scavenging method (DPPH assay) following the method described by Brand-Williams et al. [22] with some modifications [23,24]. Briefly, a solution of DPPH (0.35 g/L in methanol) was prepared and diluted in methanol to reach the absorbance at 1 ± 0.03 AU at 515 nm (Lambda 25 spectrophotometer, Perkin Elmer). Samples were centrifuged at 6000× g for 15 min (Hettich) and properly diluted in methanol 70% (v/v): 2–5 folds for manual and vacuum pressing juice samples, 2 folds for small screw press juice samples, and 20 folds for juicer juice samples. The reaction mix was prepared as follows: 2.45 mL of DPPH and 50 μL of diluted sample were mixed in cuvettes and incubated at 20 ± 2 °C for 50 min in the dark. The absorbance was read at 515 nm (Lambda 25 spectrophotometer, Perkin Elmer). A calibration curve for Trolox (0.125–1.5 mM) dissolved in methanol 70% (v/v) was achieved. Results were expressed as mmol Trolox eq./L.

2.6. Raman Spectroscopy

The system QE Pro (Ocean Optics, Inc., Dunedin, FL, USA) was composed of a laser with Raman excitation wavelength at 785 nm and modified vibrational or rotary energy of the molecules in the matter from an inelastic scattering. Thus, the resulting spectra depends on the composition of the matter [25] that was controlled by the Ocean View software (version 1.6.8, Ocean Optics, Inc., Largo, FL, USA). The Raman spectra were realized with an Ocean view spectrometer, covering the spectral range between 150 and 2850 cm−1. Optic resolution was 9 cm−1 (slit 50 μm). The spectra were characterized by the intensity in y and frequency in x (shift by cm, cm−1). For the measurements, the integration time was set at 1 s; the laser intensity was set at 0.85% of the maximum intensity (i.e., 349 mW). Each spectrum corresponded to an average of 10 scans. The distance between the laser and the sample holder was 9.5 mm.

2.7. Statistical Analysis

The statistical analysis was performed by XLSTAT (Addinsoft, New York, NY, USA) software (version 2019.4.2). The one-way ANOVA was performed and significant differences were evaluated by Tukey’s HSD test for p ≤ 0.05. The equations of the calibration curves were assessed by linear regression analysis. Principal component analysis (PCA) was performed with Statistica 12 software (Statsoft Inc., Tulsa, OK, USA) on auto-scaled data for an overall overview of the methods assayed for the preparation of lab-made juice samples.
In addition, R software (version 4.3.2) was used to perform classification methods based on pressing methods for each of the two vintages (2022 and 2023): Random Forest (RF), Support Vector Machine (SVM), and PLS-DA using the Caret package in RStudio. For each year, the data were split at 90%/10% between the training and the test sets, respectively. This choice was motivated by the small size of the data set, especially for 2023 (48 observations), to ensure better model generalization while maximizing the available training data. Based on the model performances (good classification and accuracy), only the results obtained using a Random Forest algorithm were presented in this article. Classifications were realized using a leave-one-out cross-validation (LOOCV) to optimize the model parameters, which guaranteed a rigorous and independent assessment of each observation. In 2022, 11 physicochemical variables and 64 observations were used for generating the models. For the physicochemical data, the optimized parameters identified were ntree = 50 et mtry = 2, since trying higher mtry values did not allow us to reach better results and provided a simple and efficient model, limiting the risk of overfitting, while capturing the essential relationships between variables and treatments. For 2023, 11 physicochemical variables with 48 observations generated the best model using ntree = 100 et mtry = 2. The Raman data were preprocessed before chemometric analysis to ensure robust and reliable results. First, outliers were detected using the outSpec function from the hyperSpec package (Rstudio PLSfunctions_Thebault2012.R), identifying six extreme observations that were excluded from further analysis. Next, baseline correction was applied to the spectra using the modified mod-polyfit method from the baseline package to remove non-specific variations. The correct spectra were then normalized using the Standard Normal Variate (SNV) method from the prospectr package to reduce scattering effects and improve comparability between samples [26]. Following these preprocessing steps, as for the physicochemical data, the data were separated by year (64 observations for 2022 and 41 for 2023 without the outliers), and each year was further split into a training set (90%) and a test set (10%) and similar supervised classification models were constructed (Random Forest (RF), Support Vector Machine (SVM), Partial Least Squares Discriminant Analysis (PLS-DA), and Neural Networks). Each model was evaluated using leave-one-out cross-validation (LOOCV). Among the tested methods, the Random Forest model consistently showed the best performance, achieving 100% classification accuracy on both the training and test sets. Consequently, the results presented in this study focus exclusively on the performance of the Random Forest model.
An accuracy of 1.00 corresponded to 100% of good classification and, for example, 0.67 corresponded to 67% of good classification, and 33% of false classification.

3. Results and Discussion

The achievement of optimal grape berry maturity is essential for determining the ideal harvest time, as well as for obtaining the expected characteristics of grape juice and, consequently, of wine. Sugar content is a traditional indicator for choosing the ideal moment for harvest, also related to the wine intended to be produced [2,3,4,5,6,7,8,9,10,11,12,13,14,15,16,17,18,19,20,21,22,23,24,25,26,27]. Nonetheless, the ratio between sugars and acidity, known as technological maturity, needs to be considered and it should be optimal for the specific wine production. Such a ratio should be lower for the grape addressed to sparkling wine production as the acidity should be preserved and the potential ethanol should be around 11–11.5% (v/v). The characterization of grape and the selection of the proper harvest date are essential for producing high-quality wine. The assessment of chemical parameters like sugar, acidity, and phenolic content ensures optimal ripeness for the intended wine style. This is a requirement for grape pressing and the optimization of this relevant winemaking step, and wine production. For this reason, the grape berry maturity should be appropriately determined.
The study was carried out considering two consecutive vintages, specifically 2022 and 2023. Regarding temperature, 2022 showed a positive anomaly in both Tavg (fourth warmest year of the series) and HD (fourth highest in the series). Ptot, Pgs, RDtot, and RDgs showed negative anomalies (Table 2). In addition, 2023 showed a Tavg similar to 2022 but in terms of HD was an average season. With reference to precipitation, Rtot, Rgs, RDtot, and RDgs were in positive anomaly (Table 2). In conclusion, 2022 was warm and dry and the grapevine suffered from very stressing conditions for most of its growing cycle. On the other side, the main character of 2022 was the high level of precipitation with the consequent absence of water stress, and a normal summer thermal condition with limited thermal stress for grapes during ripening.

3.1. Characterization of Grape Samples

The phenolic composition of the grape samples was first assessed. Total and extractable flavonoid concentrations were determined for different grape batches and the phenol extractability was also estimated. Chardonnay grape samples showed negligible differences in total flavonoids (FLVs) for the same grape batch between the two consecutive harvests investigated (Table 3). However, total FLVs were highly variable between samples, ranging from 2.51 ± 0.08 g/L to 6.00 ± 0.04 g/L of catechin eq. for harvest 2022 and from 1.17 ± 0.01 g/L to 5.03 ± 0.17 g/L of catechin eq. for harvest 2023. However, the average content did not significantly differ among harvests (Table 3). In contrast, Pinot blanc grapes demonstrated significantly higher average values for total FLVs concentrations (4.35 ± 0.14 g/L of catechin eq.) in vintage 2023 in comparison to harvest 2022 (3.85 ± 0.55 g/L of catechin eq.).
Considering the extractable FLVs, significantly higher concentrations were found for the grape samples collected in vintage 2023 for both grape varieties (Table 3). In any case, Pinot blanc grape samples showed higher average concentrations of both total and extractable FLVs in comparison to Chardonnay grape samples, the latter being up to 2-fold lower. Nonetheless, these results could be affected by the smaller sampling performed for Pinot blanc grape which is less cultivated in the Franciacorta area (3% under vine vs. 80% under vine for Chardonnay grape).
The high variability of extractable FLVs among vineyard parcels is noteworthy. The 40% difference in extractable FLVs was notable between Chardonnay 5 and Chardonnay 6 samples that were collected from different vineyard parcels in vintage 2022. This finding highlights the influence of vineyard parcel characteristics on FLV extraction. Moreover, this suggests that even under similar environmental and management conditions, other factors can lead to substantial variations in chemical composition, such as soil, water retention, vineyard age, and weather conditions [28].
The extractability also varied significantly among grape samples and harvests, ranging from 17.5% to 64.1% for Chardonnay grape samples and from 40.0% to 48.1% for Pinot blanc grape samples for the 2023 vintage. The average extractability values for the Pinot blanc grapes were higher compared to Chardonnay grapes. This difference could be associated with the composition and the skin characteristics of Pinot blanc variety. For the latter aspect, Pinot blanc grape was more sensitive to handling in comparison to the Chardonnay grape, probably due to its different skin thickness, facilitating FLV extraction during processing. The thickness of grape skins is a critical factor during pressing as it influences the extraction of compounds like tannins and FLVs. Moreover, berry skin properties, such as break force and thickness, play a significant role in assessing phenolic content during ripening [29]. In the case of the red grape, thinner skins are linked to higher anthocyanin extractability, making skin thickness a key indicator for optimizing harvest timing and winemaking processes [30]. We could expect that white grapes with thinner skins are more prone to release phenols during the pressing. An estimation of the grape behavior can be assessed by means of the FLV extractability. Moreover, the determination of phenol extraction can be relevant for understanding oxidation susceptibility as the phenols are the main substrates of oxidation in juice and wine [31]. The proper management of oxidation susceptibility can lead to improving the quality of the final products in terms of wines with balanced sensory characteristics [6].

3.2. Lab-Made Juice Samples: Comparison of the Methods Assayed

Different methods for the production of grape juice on a laboratory scale were investigated in order to identify which pressing method could be the most adequate for the monitoring of grape ripening. Four different methods were compared in vintage 2022 by means of the assessment of the general chemical parameters, phenolic-related indexes, antioxidant capacity, turbidity, and polyphenol oxidase activity. However, the production of juice samples by the juicer was not carried out in vintage 2023. This is because the principal component analysis (PCA) showed the juice samples obtained by the juicer with both Chardonnay and Pinot blanc grapes clearly clustered (Figure 2) indicating these juice samples differed from the juice samples produced by the other methods investigated (manual, vacuum, and small screw press). The PCA explained 72.4% variance, with 53.2% and 19.2% for Factor 1 and Factor 2 (Figure 2a,b), respectively, for the Chardonnay samples. In the case of the Pinot blanc samples, the PCA explained 80.6% of the variance, with 60.8% and 19.8% for Factor 1 and Factor 2, respectively (Figure 2c,d). The clustering was mainly due to the total phenol index (TPI), color index, and antioxidant capacity for the Chardonnay grapes (Figure 2b) and the total FLVs and TPI for the Pinot blanc (Figure 2d). Moreover, higher pH values for the juice sample obtained from the juicer (Table S1) can be attributable to skin disruption that can favor the extraction of potassium leading to the precipitation of tartaric acid and the consequent pH increase. Our results were comparable to those reported by Dumas et al. [4] with the automatic sieve and tomato press, since their working mode was similar to that of the juicer, causing a fragmentation of grape skins. The other methods investigated in our study, manual, vacuum, and small screw press, did not lead to the fragmentation of skin, being less disruptive on the grape skins.
The different methods applied for the production of lab-made juice did not significantly affect the general chemical parameters, such as sugars, pH, and TA, neither for the Chardonnay samples (Table 4) nor for Pinot blanc samples (Table 5), in accordance with Dumas et al. [4]. Even if lower pH and higher TA were found in harvest 2023, no significant impact of the pressing method was found for both harvests.
Notable variability among the different pressing methods and vintages was found for the TPI, total FLVs, and antioxidant capacity as well. The small screw press led to lower TPI values across grape batches compared to other treatments. As shown in Table 3, the TPI values were significantly higher for the Chardonnay grape samples obtained with the manual pressing (641 ± 50 mg/L of gallic acid eq.) and vacuum pressing (727 ± 200 mg/L of gallic acid eq.) in comparison to the small screw press (219 ± 64 mg/L of gallic acid eq.) in harvest 2022. On the contrary, the TPI values for the Chardonnay grape samples were more consistent in 2023, in the range 150–197 mg/L of gallic acid eq. across all pressing methods (Table 4). Similarly for total FLVs, the small screw press juice samples had lower concentrations in comparison to the juice samples of the other methods in harvest 2022 (Table 4). This finding can be attributable to the climatic conditions of vintage 2022, being hot and dry, that could cause excessive phenolic compound accumulation, contributing to higher TPI values. A higher antioxidant capacity was revealed for the juices produced in harvest 2022 being around 2 folds higher than that one detected in the juices of harvest 2023 with significant differences among the methods (Table 4). However, the ratios between the antioxidant capacity and TPI were the highest in the small screw press juice samples (Table S2) suggesting that this pressing condition not only allowed a lower extraction of phenols but also that one more antioxidant could be extracted [32].
Similarly to the Chardonnay samples, the TPI, FLVs, and antioxidant capacity differed by means of pressing methods and vintages for the Pinot blanc samples (Table 5). The TPI values were significantly higher for the vacuum pressing (537 ± 30 mg/L of gallic acid eq.) and manual press (303 ± 55 mg/L of gallic acid eq.) juice samples in comparison to the small screw press juice samples (145 ± 8 mg/L of gallic acid eq.) for harvest 2022. Lower TPI values were also detected in small screw press juice samples in harvest 2023 (Table 5). As for the Chardonnay grape, the relevant differences in the TPI of the Pinot blanc samples among the two harvests could be due to the climate conditions. The small screw press juice samples did show lower total FLVs content for harvest 2022, while similar concentrations were found in harvest 2023 in the juice samples from different methods (Table 5). The antioxidant capacity was significantly affected by the methods applied as well as by the vintage (Table 5). Nonetheless, the ratios between the FLVs and TPI for the small screw press were the highest, with values of 45 ± 10 for harvest 2022 and 55 ± 15 for harvest 2023. This indicates that the concentrations of both flavonoids and total phenols were relatively low compared to other methods (Table S3). The oxidation of non-flavonoids can occur in must leading to the formation of o-quinones through the enzymatic activity of the polyphenol oxidase (PPO) enzyme in the presence of oxygen [31,32,33]. In order to understand the possible susceptibility to the oxidation of phenols related to the lab-pressing method applied, PPO activity was determined, but it was affected by neither the method nor the harvest (Table 4 and Table 5). PPO activity ranged from 8 to 577 units in the Chardonnay juice samples in vintage 2022 and from 0 to 166 units in the 2023 harvest. For Pinot blanc, PPO activity was in the range 5–144 in vintage 2022 and 0–59 units in vintage 2023. Moreover, further investigations may be necessary to better understand the relationship between PPO activity and the different treatments. This would help to better understand how the processing methods influence PPO levels and potentially impact juice quality.
In addition to phenolic compounds, grape skins are a primary source of color [34]. No significant difference was found across laboratory-scale pressing methods in color index (at 420 nm) detected in Chardonnay samples from harvest 2022. On the contrary, the significant lower color index was found in small screw press juice samples from the Chardonnay grape in harvest 2023 (Table 4). Pinot blanc juice samples produced by the small screw press had the significant lowest color index for both harvests (Table 5).
Besides the color index, the pressing methods did affect the turbidity being the lowest for juice samples obtained by the small screw press from both grape varieties in both harvests (Table 4 and Table 5). This finding could explain the differences in the color index revealed among the juice samples, while the relation between turbidity and phenol-related indexes can be excluded since the latter parameters seemed to be more affected by the grape variety and the harvest.

3.3. Lab-Made Juice Samples: Classification of the Pressing Methods

Chemical analyses showed complex results integrating the heterogeneity of the materials. Thus, we tested classification methods on the data sets to determine if it was possible to predict from which kind of pressing juices came from and thus understand their similarities. The models obtained were evaluated based on their performance, i.e., the good classification and the accuracy. The Random Forest method, using 90% of data for the training set and 10% of the data for the test set, provided the best results, which are presented below.
Based on physicochemical data, it was possible to perfectly classify the juices on their right method of pressing, both in 2022 and 2023 (Table 6), achieving an accuracy rate of 100% on both the training and test sets, i.e., 100% of good classification. The 15 samples from the training set and the single one from the data set, for each modality of pressing, were indeed all very good classified.
Thus, the classification of juices based on physicochemical data was possible and very accurate using the right classification method (Random Forest), showing important differences in the juices obtained, but also similarities due to the fact that models presented confusions in the recognition of the types of pressing when using a non-adequate method, for example, the accuracy was only of 0.50 using SVM pre-treatments of physicochemical data.
As spectral data is like a fingerprint and could contain more information than targeted physicochemical analyses, classification of the juices was also realized from Raman spectra. Results showed that we obtained 100% of good classification for both the training and the test sets with the Random Forest classification method (Table 6) and for all pressing methods. If the classifications were so good, it was because the quality of the juices produced by the different types of press was quite distinct. Thus, the type of pressing has to be selected knowing this information, meaning that a bias of the description of the grape juice and therefore of the composition of the corresponding wine depending on the manner the pressing occurred.
To sum up, using the right classification method and the right proportion of data for the training and test sets allowed a perfect classification of the juices based on the method of pressing, from both physicochemical and Raman data.
There are few studies on the classification of fruit juices, and particularly the classification of juices from different pressings. Good classification of grape juices based on their type of production (organic vs. conventional) were obtained from MID-IR data and chemometrics [35] with 100% of good classification or up to 92% of good classification from UV-VIS data using the PLS-DA classification method [36]. The use of chemometrics is more and more used, even for chemistry analyses. Data treatments start from PCA, CAH to PLS-DA, SIMCA, which request more expertise to use. They are usually applied for checking the origin, adulteration, and even assess the composition of the product [37]. The use of Raman spectroscopy in food analysis showed interesting opportunities by the ability to detect microorganisms like Escherichia coli in apple juice, to identify pectin in apple and apricot juices or classify the quality of olives in the frame of olive oil production [25]. However, our work showed for the first time that Raman spectroscopy and physicochemical data coupled with chemometrics could classify grape juice on the basis of the manner they were pressed.

4. Conclusions

This study concerned the evaluation of grape composition and the lab-pressing methods of two consecutive harvests. The two grape varieties investigated, Chardonnay and Pinot blanc, were harvested at an early maturity level appropriate for the sparkling wine production. Results highlight the relation between the grape characteristics and the pressing treatments under a laboratory scale. A relevant variability among grape batches was observed in particular in terms of extractable flavonoids and, consequently, of extractability, suggesting the need for applying an ad hoc pressing condition to obtain must fractions with the desired chemical composition. No significant differences were observed in the general chemical parameters, such as sugar content, pH, and titratable acidity, among the lab-pressing methods. No impact of pressing conditions was observed for the polyphenol oxidase enzyme that did not result a suitable marker. However, the pressing process can significantly influence the extraction of phenolic compounds with a small screw press being the pressing condition leading to lower phenolic content, color, and antioxidant capacity. Nonetheless, this method seems to extract the phenolics with higher antioxidant potential. It should be considered that quantitative analyses of phenols were carried out; qualitative assessment of phenolics may explain more accurately the differences among the pressing methods. However, this is the first investigation related to the monitoring of both general chemical parameters and phenolic-related indexes in grape juice samples obtained with different lab-pressing methods and addressed to the sparkling wine production. A spectral and physicochemical data analysis showed high accuracy in classifying juice quality based on pressing techniques, highlighting the need to carefully select pressing methods to ensure desired juice and wine composition.
Due to the soft pressing condition applied for the sparkling wine production, the use of the screw small press could represent a suitable approach for monitoring the grape pressing and selecting the proper harvest date base not only on the general chemical parameters, e.g., sugars and titratable acidity, but also considering the phenolic-related indexes.
Climate factors, such as temperature, sunlight, and rainfall patterns directly impact the maturation process, affecting parameters like sugar accumulation, acidity, and phenolic content. Additionally, each grape variety exhibits structural differences in berry skin, pulp, and seed composition, which influence juice yield and composition during pressing. This natural variability underscores the importance of adapting pressing techniques to each vintage and batch to optimize juice quality for sparkling wine production.
In winery settings, monitoring phenolic-related indexes is relevant when selecting appropriate pressing cycles and conditions, as phenolics significantly impact the sensory qualities and stability of both still and sparkling wines. In our laboratory trials, the small screw press consistently delivered reproducible results. This reliability underscores its value as a possible control method, enabling future studies to draw more precise correlations between lab-scale findings and full-scale winery outcomes. Furthermore, this approach can allow the optimization of pressing techniques based on grape variety and vintage.

Supplementary Materials

The following supporting information can be downloaded at https://www.mdpi.com/article/10.3390/beverages11010023/s1. Table S1: Chemical parameters of lab-scale Chardonnay (CH) and Pinot blanc (PB) juice samples obtained by juicer in 2022 vintage; Table S2: Ratio antioxidant capacity (AC)/total phenol index (TPI) and total flavonoids (FLVs)/total phenol index (TPI) of Chardonnay samples; Table S3: Ratio antioxidant capacity (AC)/total phenol index (TPI) and total flavonoids (FLVs)/total phenol index (TPI) of Pinot blanc samples.

Author Contributions

Conceptualization, D.F.; methodology, G.S., M.B. and C.M.; software, D.O.; validation, D.F., C.M. and V.L.-V.; formal analysis, D.O. and G.C.; investigation, G.S. and M.B.; resources, D.F. and V.L.-V.; data curation, V.L.-V. and G.C.; writing—original draft preparation, G.S., C.M. and D.F.; writing—review and editing, G.S., M.B., C.M. and D.F.; visualization, G.S., D.F. and C.M.; supervision, D.F. and C.M.; project administration, D.F. and C.M.; funding acquisition, D.F. All authors have read and agreed to the published version of the manuscript.

Funding

The doctoral scholarship was co-funded with resources in the frame of the PON REACT-EU financing Program, Action IV.5—Doctorates on green topics. The doctoral scholarship was co-funded by Istituto Oeno Italia. The study was also supported by Consorzio per la tutela del Franciacorta.

Data Availability Statement

Data are contained within the article and Supplementary Materials.

Acknowledgments

The authors are thankful to Davide Camoni and the wineries Bellavista, Ferghettina, I Barisei, Mirabella, Quadra e Vezzoli Giuseppe for collaborating on the experimental activities.

Conflicts of Interest

The authors declare no conflicts of interest.

References

  1. Río Segade, S.; Orriols, I.; Giacosa, S.; Rolle, L. Instrumental texture analysis parameters as winegrapes varietal markers and ripenes predictors. Int. J. Food Prop. 2011, 14, 1318–1329. [Google Scholar] [CrossRef]
  2. Liu, P.H.; Vrigneau, C.; Salmon, T.; Hoang, D.A.; Boulet, J.C.; Jégou, S.; Marchal, R. Influence of grape berry maturity on juice and base wine composition and foaming properties of sparkling wines from the Champagne region. Molecules 2018, 23, 1372. [Google Scholar] [CrossRef]
  3. Shanshiashvili, G.; Baviera, M.; Fracassetti, D. Exploring grape pressing for sparkling wine production: A comprehensive literature review on physicochemical parameters and technological applications. Appl. Food Res. 2024, 4, 100454. [Google Scholar] [CrossRef]
  4. Dumas, V.; Saurin, N.; Destrac Irvine, A.; Dedet, S.; Veyret, M.; Marchal, C.; Ojeda, H.; Van Leeuwen, C.; Duchêne, E. Influence of grape juice extraction methods on basic analytical parameters. Vitis 2020, 59, 77–83. [Google Scholar] [CrossRef]
  5. Aerny, J.; Dupraz, P.; Brückner, D. Influence du mode d’extraction du moût sur sa composition lors des contrôles de maturité du raisin. Rev. Suisse Vitic. Arboric. 2000, 32, 239–243. [Google Scholar]
  6. Ribéreau-Gayon, P.; Glories, Y.; Maujean, A.; Dubourdieu, D.; Towey, J. Organic acids in wine. In Handbook of Enology: The Chemistry of Wine Stabilization and Treatments, 3rd ed.; John Wiley & Sons, The Atrium, Southern Gate: Chichester, UK, 2021; Volume 2, p. 3. [Google Scholar]
  7. Huglin, M.P. Nouveau mode d’évaluation des possibilites héliothermiques d’un milieu viticole. Comptes Rendus L’académie D’agriculture Fr. 1978, 64, 1117–1126. [Google Scholar]
  8. Balotti, A.; Tscholl, S.; Vigl, L.E. Linking viticultural climatic indices to grape phenology in the South Tyrolean Alps. E3S Web Conf. 2018, 50, 01031. [Google Scholar] [CrossRef]
  9. Veronesi, V.; Schiavello, M. Ca′ del Bosco. In The Evolution of Made in Italy: Case Studies on the Italian Food and Beverage Industry, 1st ed.; Palgrave Macmillan: London, UK, 2023; Volume 1, pp. 73–85. [Google Scholar] [CrossRef]
  10. van Leeuwen, C.; Darriet, P. The Impact of Climate Change on Viticulture and Wine Quality. J. Wine Econ. 2016, 11, 150–167. [Google Scholar] [CrossRef]
  11. van Leeuwen, C.; Friant, P.; Choné, X.; Tregoat, O.; Koundouras, S.; Dubourdieu, D. Influence of climate, soil and cultivar on terroir. Am. J. Enol. Vitic. 2004, 55, 207–217. [Google Scholar] [CrossRef]
  12. Quénol, H.; Grosset, M.; Barbeau, G.; Van Leeuwen, K.; Hofmann, M.; Foss, C.; Irimia, L.; Rochard, J.; Boulanger, J.P.; Tissot, C.; et al. Adaptation of viticulture to climate change: High resolution observations of adaptation scenario for viticulture: The adviclim european project. Bull. De L’oiv 2014, 87, 395–406. [Google Scholar]
  13. Di Stefano, R.; Guidoni, S. La determinazione dei polifenoli totali nei mosti e nei vini. Vignevini 1989, 1, 47–52. [Google Scholar]
  14. Di Stefano, R.; Cravero, M.C. Metodo per lo studio dei polifenoli dell’uva. Riv. Vitic. Enol. 1991, 2, 37–45. [Google Scholar]
  15. Corona, O.; Squadrito, M.; Vento, G.; Tirelli, A.; Di Stefano, R. Over-evaluation of total flavonoids in grape skin extracts containing sulfur dioxide. Food Chem. 2015, 172, 537–542. [Google Scholar] [CrossRef] [PubMed]
  16. Fracassetti, D.; Gabrielli, M.; Corona, O.; Tirelli, A. Characterisation of Vernaccia Nera (Vitis vinifera L.) Grapes and Wine. S. Afr. J. Enol. Vitic. 2017, 38, 72–81. [Google Scholar] [CrossRef]
  17. OIV. Available online: https://www.oiv.int/it/standards/annex-a-methods-of-analysis-of-wines-and-musts/section-3-chemical-analysis/section-3-1-organic-compounds/section-3-1-3-acids/total-acidity-%28type-i%29 (accessed on 10 November 2024).
  18. Fracassetti, D.; Pozzoli, C.; Vitalini, S.; Tomás-Barberán, F.A.; Tirelli, A.; Iriti, M. Impact of cooking on bioactive compounds and antioxidant activity of pigmented rice cultivars. Foods 2020, 9, 967. [Google Scholar] [CrossRef] [PubMed]
  19. Goodner, K.L. Estimating Turbidity (NTU) from Absorption Data; Sensus Technical Note (SEN-TN-0010); Synergy Flavors: Wauconda, IL, USA, 2009; Volume 1, pp. 1–4. Available online: https://www.synergytaste.com/wp-content/uploads/sites/2/2022/05/Estimating-Turbidity-NTU-From-Absorption-Data.pdf (accessed on 10 November 2024).
  20. Fracassetti, D.; Vigentini, I.; Marai, S.; Ferrari, E.; Tirelli, A.; Foschino, R.; Guidetti, R. Suitability of ultraviolet-C irradiation for white grape must. Aust. J. Grape Wine Res. 2019, 25, 224–232. [Google Scholar] [CrossRef]
  21. Falguera, V.; Pagán, J.; Ibarz, I. Effect of UV irradiation on enzymatic activities and physicochemical properties of apple juices from different varieties. LWT—Food Sci. Technol. 2011, 44, 115–119. [Google Scholar] [CrossRef]
  22. Brand-Williams, W.; Cuvelier, M.; Berset, C. Use of a free radical method to evaluate antioxidant activity. LWT Food Sci. Technol. 1995, 28, 25–30. [Google Scholar] [CrossRef]
  23. Fracassetti, D.; Gabrielli, M.; Costa, C.; Tomás-Barberán, F.A.; Tirelli, A. Characterization and suitability of polyphenols-based formulas to replace sulfur dioxide for storage of sparkling white wine. Food Control 2016, 60, 606–614. [Google Scholar] [CrossRef]
  24. Piva, G.; Fracassetti, D.; Tirelli, A.; Mascheroni, E.; Musatti, A.; Inglese, P.; Piergiovanni, L.; Rollini, M. Evaluation of the antioxidant/antimicrobial performance of Posidonia oceanica in comparison with three commercial natural extracts and as a treatment on fresh-cut peaches (Prunus persica Batsch). Postharvest Biol. Technol. 2017, 124, 54–61. [Google Scholar] [CrossRef]
  25. Yang, D.; Ying, Y. Applications of Raman spectroscopy in agricultural products and food analysis: A review. Appl. Spectrosc. Rev. 2011, 46, 539–560. [Google Scholar] [CrossRef]
  26. Dhanoa, M.S.; Lister, S.J.; Sanderson, R.; Barnes, R.J. The link between multiplicative scatter correction (MSC) and standard normal variate (SNV) transformations of NIR spectra. J. Near Infrared Spectrosc. 1994, 2, 43–47. [Google Scholar] [CrossRef]
  27. van Leeuwen, C.; Trégoat, O.; Choné, X.; Bois, B.; Pernet, D.; Gaudillère, J.P. Vine water status is a key factor in grape ripening and vintage quality for red Bordeaux wine. How can it be assessed for vineyard management purposes? J. Int. Sci. Vigne Vin 2009, 43, 121–134. [Google Scholar] [CrossRef]
  28. Bramley, R.G.V.; Ouzman, J.; Boss, P.K. Variation in vine vigour, grape yield and vineyard soils and topography as indicators of variation in the chemical composition of grapes, wine and wine sensory attributes. Aust. J. Grape Wine Res. 2011, 17, 217–229. [Google Scholar] [CrossRef]
  29. Río Segade, S.; Giacosa, S.; Gerbi, V.; Rolle, L. Berry skin thickness as main texture parameter to predict anthocyanin extractability in winegrapes. LWT Food Sci. Technol. 2011, 44, 392–398. [Google Scholar] [CrossRef]
  30. Battista, F.; Tomas, D.; Porro, D.; Caicci, F.; Giacosa, S.; Rolle, L. Winegrape berry skin thickness determination comparison between histological observation and texture analysis determination. Ital. J. Food Sci. 2015, 27, 136–141. [Google Scholar] [CrossRef]
  31. Du Toit, W.J.; Marais, J.; Pretorius, I.S.; Du Toit, M. Oxygen in must and wine: A review. S. Afr. J. Enol. Vitic. 2006, 27, 76–94. [Google Scholar] [CrossRef]
  32. Ribéreau-Gayon, P.; Glories, Y.; Maujean, A.; Dubourdieu, D. Phenolic Compounds. In Handbook of Enology: The Chemistry of Wine Stabilization and Treatments, 4th ed.; John Wiley & Sons, The Atrium, Southern Gate: Chichester, UK, 2018; Volume 2, pp. 141–203. [Google Scholar]
  33. Yokotsuka, K. Effect of press design and pressing pressures on grape juice components. J. Ferment. Bioeng. 1990, 70, 15–21. [Google Scholar] [CrossRef]
  34. Ortega-Regules, A.; Ros-García, J.M.; Bautista-Ortín, A.B.; López-Roca, J.M.; Gómez-Plaza, E. Changes in skin cell wall composition during the maturation of four premium wine grape varieties. J. Sci. Food Agric. 2008, 88, 420–428. [Google Scholar] [CrossRef]
  35. Junges, C.H.; Guerra, C.C.; Gomes, A.A.; Ferrão, M.F. Green analytical methodology for grape juice classification using FTIR spectroscopy combined with chemometrics. Talanta Open 2022, 6, 100168. [Google Scholar] [CrossRef]
  36. Junges, C.H.; Guerra, C.C.; Reis, N.A.; Gomes, A.A.; Diogo, F.S.; Ferrão, M.F. Grape juice classification with respect agricultural production system by means of visible spectroscopy chemometrics assisted. J. Food Compos. Anal. 2022, 114, 104793. [Google Scholar] [CrossRef]
  37. Zielinski, A.A.; Haminiuk, C.W.; Nunes, C.A.; Schnitzler, E.; van Ruth, S.M.; Granato, D. Chemical composition, sensory properties, provenance, and bioactivity of fruit juices as assessed by chemometrics: A critical review and guideline. Compr. Rev. Food Sci. 2014, 13, 300–316. [Google Scholar] [CrossRef]
Figure 1. Shape of the Franciacorta area with location of the sampled vineyards. CH, Chardonnay grape; PB, Pinot blanc grape.
Beverages 11 00023 g001
Figure 2. (a) Projection of the scores and (b) loading on the factor-plane obtained for the Chardonnay (CH) juice samples, and (c) projection of the scores and (d) loading on the factor-plane obtained for the Pinot blanc (PB) juice samples for vintage 2022. Antioxidant capacity (Antiox), color, total phenolic index (TPI), total flavonoids, (FLVs), pH, and titratable acidity (TA) were considered active variable (in blue); the ratio Antiox/TPI and ratio FLVs/TPI were considered supplementary variables (in red).
Beverages 11 00023 g002
Table 1. Description of pressing methods used for the production of laboratory-scale juices.
Pressing MethodGrape Weight
(g)
Pressing
Conditions
Juice Production 1Average Processing Time (min)
Manual pressing500Under airHand-crushing5
Vacuum pressing500Under vacuumPressed in plastic bags under a vacuum machine; transfer juice into a container under nitrogen10
Juicer500Under airAutomatically separates juice from skins and seeds5
Small screw press2000Under airJuice obtained from the screw device; pressure applied manually15
1 For each method, juices free from skin and seeds were collected in an Erlenmeyer flask filled up with nitrogen for 3 min.
Table 2. Agrometeorological characterization of 2022 and 2023. The analysis is based on the 1997–2023 time series of Corte Franca (BS, Lombardy, Italy).
TavgHDPtotPgsRDtotRDgs
1997–2023Avg − SD14.016.3870.7392.769.934.3
Avg14.632.01140.0551.587.340.8
Avg + SD14.016.3870.7392.769.934.3
2022 15.351.0770.2340.471.037.0
2023 15.331.01247.6807.086.049.0
Avg, average; SD, standard deviation; Tavg, mean yearly temperature; HD, number of hot days (Tmax > 32 °C); Ptot, total yearly precipitation and number of rainy days; Pgs, precipitation the growing season (April–August); RDtot, yearly rainy days; RDgs, rainy days along the growing season (April–August).
Table 3. Total and extractable flavonoids and extractability for Chardonnay and Pinot blanc grape samples harvested in 2022 and 2023 vintages.
SamplesTotal Flavonoids (FLVs)
(g/L of Catechin eq.)
Extractable Flavonoids
(Extractable FLVs)
(g/L of Catechin eq.)
Extractability
(%)
Vintage 2022Vintage 2023Vintage 2022Vintage 2023Vintage 2022Vintage 2023
Chardonnay 12.33 ± 0.17 a2.62 ± 0.08 a0.84 ± 0.01 a0.81 ± 0.01 a36.031.0
Chardonnay 23.10 ± 0.11 b2.63 ± 0.02 a1.14 ± 0.01 b0.80 ± 0.02 a36.930.4
Chardonnay 32.51 ± 0.08 a1.17 ± 0.01 b0.88 ± 0.03 a0.75 ± 0.03 b35.164.1
Chardonnay 46.00 ± 0.04 c5.03 ± 0.17 c1.14 ± 0.01 b0.88 ± 0.02 a19.017.5
Chardonnay 52.75 ± 0.05 a3.41 ± 0.07 d0.69 ± 0.01 a0.92 ± 0.01 c25.026.9
Chardonnay 62.54 ± 0.01 a3.94 ± 0.03 d1.11 ± 0.04 b0.80 ± 0.01 a43.820.1
Average3.20 ± 1.27 a3.13 ± 1.20 a0.97 ± 0.17 b0.82 ± 0.15 a32.6 ± 8.2 a31.7 ± 15.6 a
Pinot blanc 13.3 ± 0.05 a4.4 ± 0.07 a1.45 ± 0.02 a1.80 ± 0.50 a43.940.9
Pinot blanc 24.4 ± 0.20 b4.3 ± 0.15 a1.70 ± 0.02 a2.07 ± 0.15 b38.648.1
Average3.85 ± 0.55 a4.35 ± 0.14 b1.57 ± 0.12 a1.93 ± 0.14 b41.3 ± 2.7 a44.5 ± 3.6 a
Results are average ± standard deviation. Different letters mean significant differences (Tukey’s HSD test for p ≤ 0.05).
Table 4. Chemical parameters of lab-scale Chardonnay juice samples in 2022 and 2023 vintages.
SamplesVintageSugars (g/L)pHTitratable Acidity (TA)
(g/L of Tartaric Acid)
Total Phenol Index (TPI)
(mg/L Gallic Acid eq.)
Total Flavonoids (FLVs)
(mg/L of Catechin eq.)
Antioxidant Capacity (AC)
(mmol Trolox eq./L)
Color
(ABS 420 nm)
NTUPPO Activity (unit/mL)
Manual pressing2022197 ± 2 aA3.31 ± 0.70 bA5.7 ± 0.6 aB641 ± 50 bA144 ± 57 bcA3.04 ± 0.54 bA0.55 ± 0.13 aA4902 ± 346 aA44 ± 23 aA
2023196 ± 8 aA3.19 ± 0.18 aA8.0 ± 1.0 aA186 ± 20 cB95 ± 23 aB1.55 ± 0.69 aB0.50 ± 0.24 abA3173 ± 159 bB46 ± 60 aA
Vacuum pressing2022189 ± 2 aA3.36 ± 0.89 bA6.0 ± 0.6 aB727 ± 200 bA202 ± 80 bA3.55 ± 0.57 aB0.56 ± 0.10 bA4703 ± 276 aB120 ± 205 aA
2023189 ± 4 aA3.16 ± 0.21 aB8.2 ± 1.5 aA197 ± 12 aB86 ± 18 aB1.50 ± 0.85 bA0.62 ± 0.24 aB3091 ± 179 bA12 ± 10 aA
Small screw press2022182 ± 2 aA3.31 ± 0.12 bA5.8 ± 0.4 aB219 ± 64 bA75 ± 27 cA2.55 ± 0.67 bA0.50 ± 0.01 bA1514 ± 277 bA33 ± 30 aA
2023197 ± 3 aA3.15 ± 0.23 aB8.6 ± 1.4 aA150 ± 7 aB74 ± 18 aA1.50 ± 0.83 aB0.35 ± 0.06 bB1921 ± 84 aA11 ± 18 aA
Results are average ± standard deviation. Different lowercase letters indicate significant differences among treatments in the same vintage; different uppercase letters indicate significant differences between the vintages (Tukey’s HSD test for p ≤ 0.05). PPO, polyphenol oxidase enzyme.
Table 5. Chemical parameters of lab-scale Pinot blanc juice samples in 2022 and 2023 vintages.
SamplesVintageSugars (g/L)pHTitratable Acidity (TA)
(g/L of Tartaric Acid)
Total Phenol Index (TPI)
(mg/L Gallic Acid eq.)
Total Flavonoids (FLVs)
(mg/L of Catechin eq.)
Antioxidant Capacity (AC)
(mmol Trolox eq./L)
Color
(ABS 420 nm)
NTUPPO Activity (unit/mL)
Manual pressing2022181 ± 1 aA3.22 ± 0.08 aA5.7 ± 0.0 aA303 ± 55 aA79 ± 11 aA2.90 ± 0.1 aA0.52 ± 0.07 aA4759 ± 560 aB34 ± 19 aA
2023178 ± 3 aA3.10 ± 0.01 bA7.9 ± 0.1 bB225 ± 8 bB50 ± 11 bB1.49 ± 0.6 bB0.58 ± 0.06 aA3079 ± 280 bA39 ± 22 aA
Vacuum pressing2022179 ± 1 aA3.31 ± 0.05 aA5.3 ± 0.0 aB537 ± 30 bB128 ± 4 bB3.9 ± 0.3 aA0.60 ± 0.04 abB4041 ± 154 aB91 ± 65 aA
2023177 ± 2 aA2.99 ± 0.03 bB8.7 ± 0.1 bB155 ± 7 aA52 ± 3 aA2.13 ± 0.1 bB0.58 ± 0.03 aB2527 ± 178 aA6 ± 11 aA
Small screw press2022182 ± 1 aA3.21 ± 0.06 aB5.4 ± 0.0 aA145 ± 8 aA61 ± 7 aA1.79 ± 0.1 aB0.21 ± 0.03 aA1858 ± 177 bA15 ± 11 aA
2023178 ± 3 aA3.05 ± 0.01 bB8.4 ± 0.1 bB115 ± 19 aB59 ± 19 bB2.45 ± 0.1 bA0.23 ± 0.01 aA1267 ± 100 aB8 ± 11 aA
Results are average ± standard deviation. Different lowercase letters indicate significant differences among treatments; different uppercase letters indicate significant differences between the vintages (Tukey’s HSD test for p ≤ 0.05). PPO, polyphenol oxidase enzyme.
Table 6. Confusion matrix of the different pressed juices in 2022 and 2023, with the Random Forest classification method, and a partition ratio of data of 90%/10% between, respectively, the training set and the data set, and the accuracy of the generated model. Classifications from the physicochemical data on one hand and on the other hand from the Raman spectra.
Training Set Test Set
2022—From Physicochemistry Data
PredictionManual PressSmall PressVacuum PressJuicerAccuracyManual PressSmall PressVacuum PressJuicerAccuracy
Manual press150001.0010001.00
Small press015000100
Vacuum press001500010
Juicer000150001
2023—from physicochemistry data
PredictionManual pressSmall pressVacuum pressaccuracyManual pressSmall pressVacuum pressaccuracy
Manual press15001.001001.00
Small press0150010
Vacuum press0015001
2022—from Raman spectra data
PredictionManual pressSmall pressVacuum pressJuiceraccuracyManual pressSmall pressVacuum pressJuiceraccuracy
Manual press150001.0010001.00
Small press015000100
Vacuum press001100010
Juicer000130001
2023—from Raman spectra data
PredictionManual pressSmall pressVacuum pressaccuracyManual pressSmall pressVacuum pressaccuracy
Manual press13001.001001.00
Small press0130010
Vacuum press0012001
Disclaimer/Publisher’s Note: The statements, opinions and data contained in all publications are solely those of the individual author(s) and contributor(s) and not of MDPI and/or the editor(s). MDPI and/or the editor(s) disclaim responsibility for any injury to people or property resulting from any ideas, methods, instructions or products referred to in the content.

