Article

Intensification of the Dimethyl Sulfide Precursor Conversion Reaction: A Retrospective Analysis of Pilot-Scale Brewer’s Wort Boiling Experiments Using Hydrodynamic Cavitation

by
Francesco Meneguzzo
* and
Lorenzo Albanese
Institute of Bioeconomy, National Research Council of Italy, 10 Via Madonna del Piano, 50019 Sesto Fiorentino, FI, Italy
*
Author to whom correspondence should be addressed.
Beverages 2025, 11(1), 22; https://doi.org/10.3390/beverages11010022
Submission received: 6 January 2025 / Revised: 23 January 2025 / Accepted: 27 January 2025 / Published: 5 February 2025

Abstract

:
Dimethyl sulfide (DMS), a low-boiling compound generated during barley germination and wort boiling from the conversion of its main precursor S-methylmethionine (SMM), a functional biomolecule, is detrimental to beer flavor. Vigorous and prolonged boiling, a time-consuming and energy-intensive process, is required to decrease the content of SMM and remove free DMS. The standard model, further validated in this study, assumed wort temperature and pH as the limiting factors of the SMM conversion reaction. This study aimed to assess the specific effect of hydrodynamic cavitation (HC) on the SMM conversion rate in pilot-scale experiments of brewer’s wort boiling. For the first time, the SMM conversion rate was shown to be significantly affected by HC processes. The SMM half-life was reduced by up to 70% and showed remarkable sensitivity to HC regimes. The intensification of the SMM conversion reaction could be attributed to the HC-based generation of hydroxyl radicals. Other wort processes unfolded in compliance with standard specifications, such as the removal of free DMS, the isomerization of hop alpha-acids, and the change in wort color. In conclusion, evidence supported HC for a substantial saving in process time and energy consumption in the brewer’s wort boiling step.

Graphical Abstract

1. Introduction

Dimethyl sulfide (DMS), the simplest thioether, is a sulfurous, organic chemical compound with a chemical formula of (CH3)2S [1]. Due to its low boiling point (38 °C) [2], DMS is highly volatile in brewer’s wort during the heating phase following the mash-out, which starts from a temperature of 70 to 78 °C, and the boiling phase at a temperature up to about 101 °C [3]. With odor and flavor concentration threshold in beer in the range of 30 to 60 μg/L [4], DMS is generally detrimental to beer quality, although lagers may contain higher levels than ales [5].
The chemical pathways leading to the generation of DMS in brewer’s wort have long been known. Since at least 1979, S-methylmethionine (SMM) was identified as the dominant precursor of DMS in malt [6]. SMM, with a chemical formula of (CH3)2S+CH2CH2CH(NH3+)CO2, is a sulfur ylide with three covalent bonds, which are formed by the sulfur atom, and is a typical derivative of the essential amino acid methionine [7]. A hydrophilic functional biomolecule known as vitamin U, SMM, showed efficacy for skin protection and wound healing, hepatoprotection, and digestive tract protection; its main natural sources are raw cabbage, certain green vegetables, and green malt [8].
SMM is a heat-labile compound whose half-life in conventional brewing depends on wort temperature and pH [9], according to the first-order reaction model represented in Equation (1), which still holds a few decades after its discovery:
S M M t = S M M 0 · e k · t ,
where SMM is the time-dependent SMM concentration (μg/L), t is time (minutes), and k describes the temperature- and pH-dependent reaction rate (min−1). Based on Equation (1), SMM half-life can be described by Equation (2):
H L S M M = ln 2 k ,
where HLSMM is the SMM half-life (minutes).
Original experiments aimed at determining HLSMM [9], and later experiments focused on the reaction rate of k [4], showed accurate consistency. These studies found quantitative relationships between the SMM conversion reaction rate and pH and temperature levels within the range usual for brewer’s wort.
The conversion reaction of SMM to DMS was described as a nucleophilic substitution reaction catalyzed by hydroxyl groups •OH generated from water molecules during the heat processing [10], leading to the hydrolysis of the carbon–sulfide bond [7]. Since the content of hydroxyl groups in water increases with pH, k also increases with pH, and consequently, HLSMM decreases.
Free DMS can be generated from residual SMM during beer storage due to exposure to heat and light [5]; thus, it is advisable that the total DMS content (sum of SMM and free DMS) at the end of wort boiling and before fermentation is held below approximately 100 μg/L [4,11]. However, in industrial breweries, it is common practice to set such an upper threshold at a more conservative level, such as 60 μg/L. To achieve such a target for total DMS content, besides the effective conversion of SMM, free DMS should also be effectively removed from brewer’s wort, which is usually accomplished by vigorous boiling at an approximate temperature of 101 °C for 60 to 90 min [12]. Free DMS should be rapidly and effectively removed during wort boiling also to prevent its later reforming during fermentation from the oxidized form dimethyl sulfoxide (DMSO) through metabolic reduction by brewer’s yeast [11], leading to excessive accumulation of free DMS in the end product. In turn, DMSO is generated from DMS itself during the malt kilning process. This explains the conservative approach taken by industrial breweries with the upper threshold of total DMS at the end of wort boiling.
Effective inhibitors of off-flavor compounds in certain heat-treated vegetable beverages were successfully tested, such as phenolic acids, polyphenols, vitamins, and especially the enzyme glucose oxidase, which can stabilize SMM via the reduction in the content of hydroxyl groups and the protonation of SMM and the oxidation of free DMS via hydrogen peroxide produced with gluconic acid [13]. However, such additives would substantially change pH, glucose content, and sensorial properties, and their use is not permitted in brewer’s wort.
Past studies showed specific and notable advantages of using hydrodynamic cavitation (HC) in the processing of brewer’s wort both in the mashing and boiling steps, including early saccharification and accelerated isomerization of hop alpha-acids [3], the extraction of further bioactive compounds from hops [14], and the possibility of achieving very low gluten content or gluten-free beer from a 100% barley malt recipe [15].
This study aimed to retrospectively analyze and discuss the results of recent experiments performed at the pilot scale for more general purposes, with two primary objectives: further validating the standard model for the SMM conversion reaction and, as the main focus of this study, investigating, for the first time, the effect of HC processes on the kinetics of the SMM conversion reaction in brewer’s wort compared to the standard model. Secondary objectives included analyzing the removal rate of free DMS, the isomerization rate of hop alpha-acids, and the change in wort color to assess the properties’ compliance of the HC-processed wort with standard specifications.

2. Materials and Methods

2.1. Hydrodynamic Cavitation
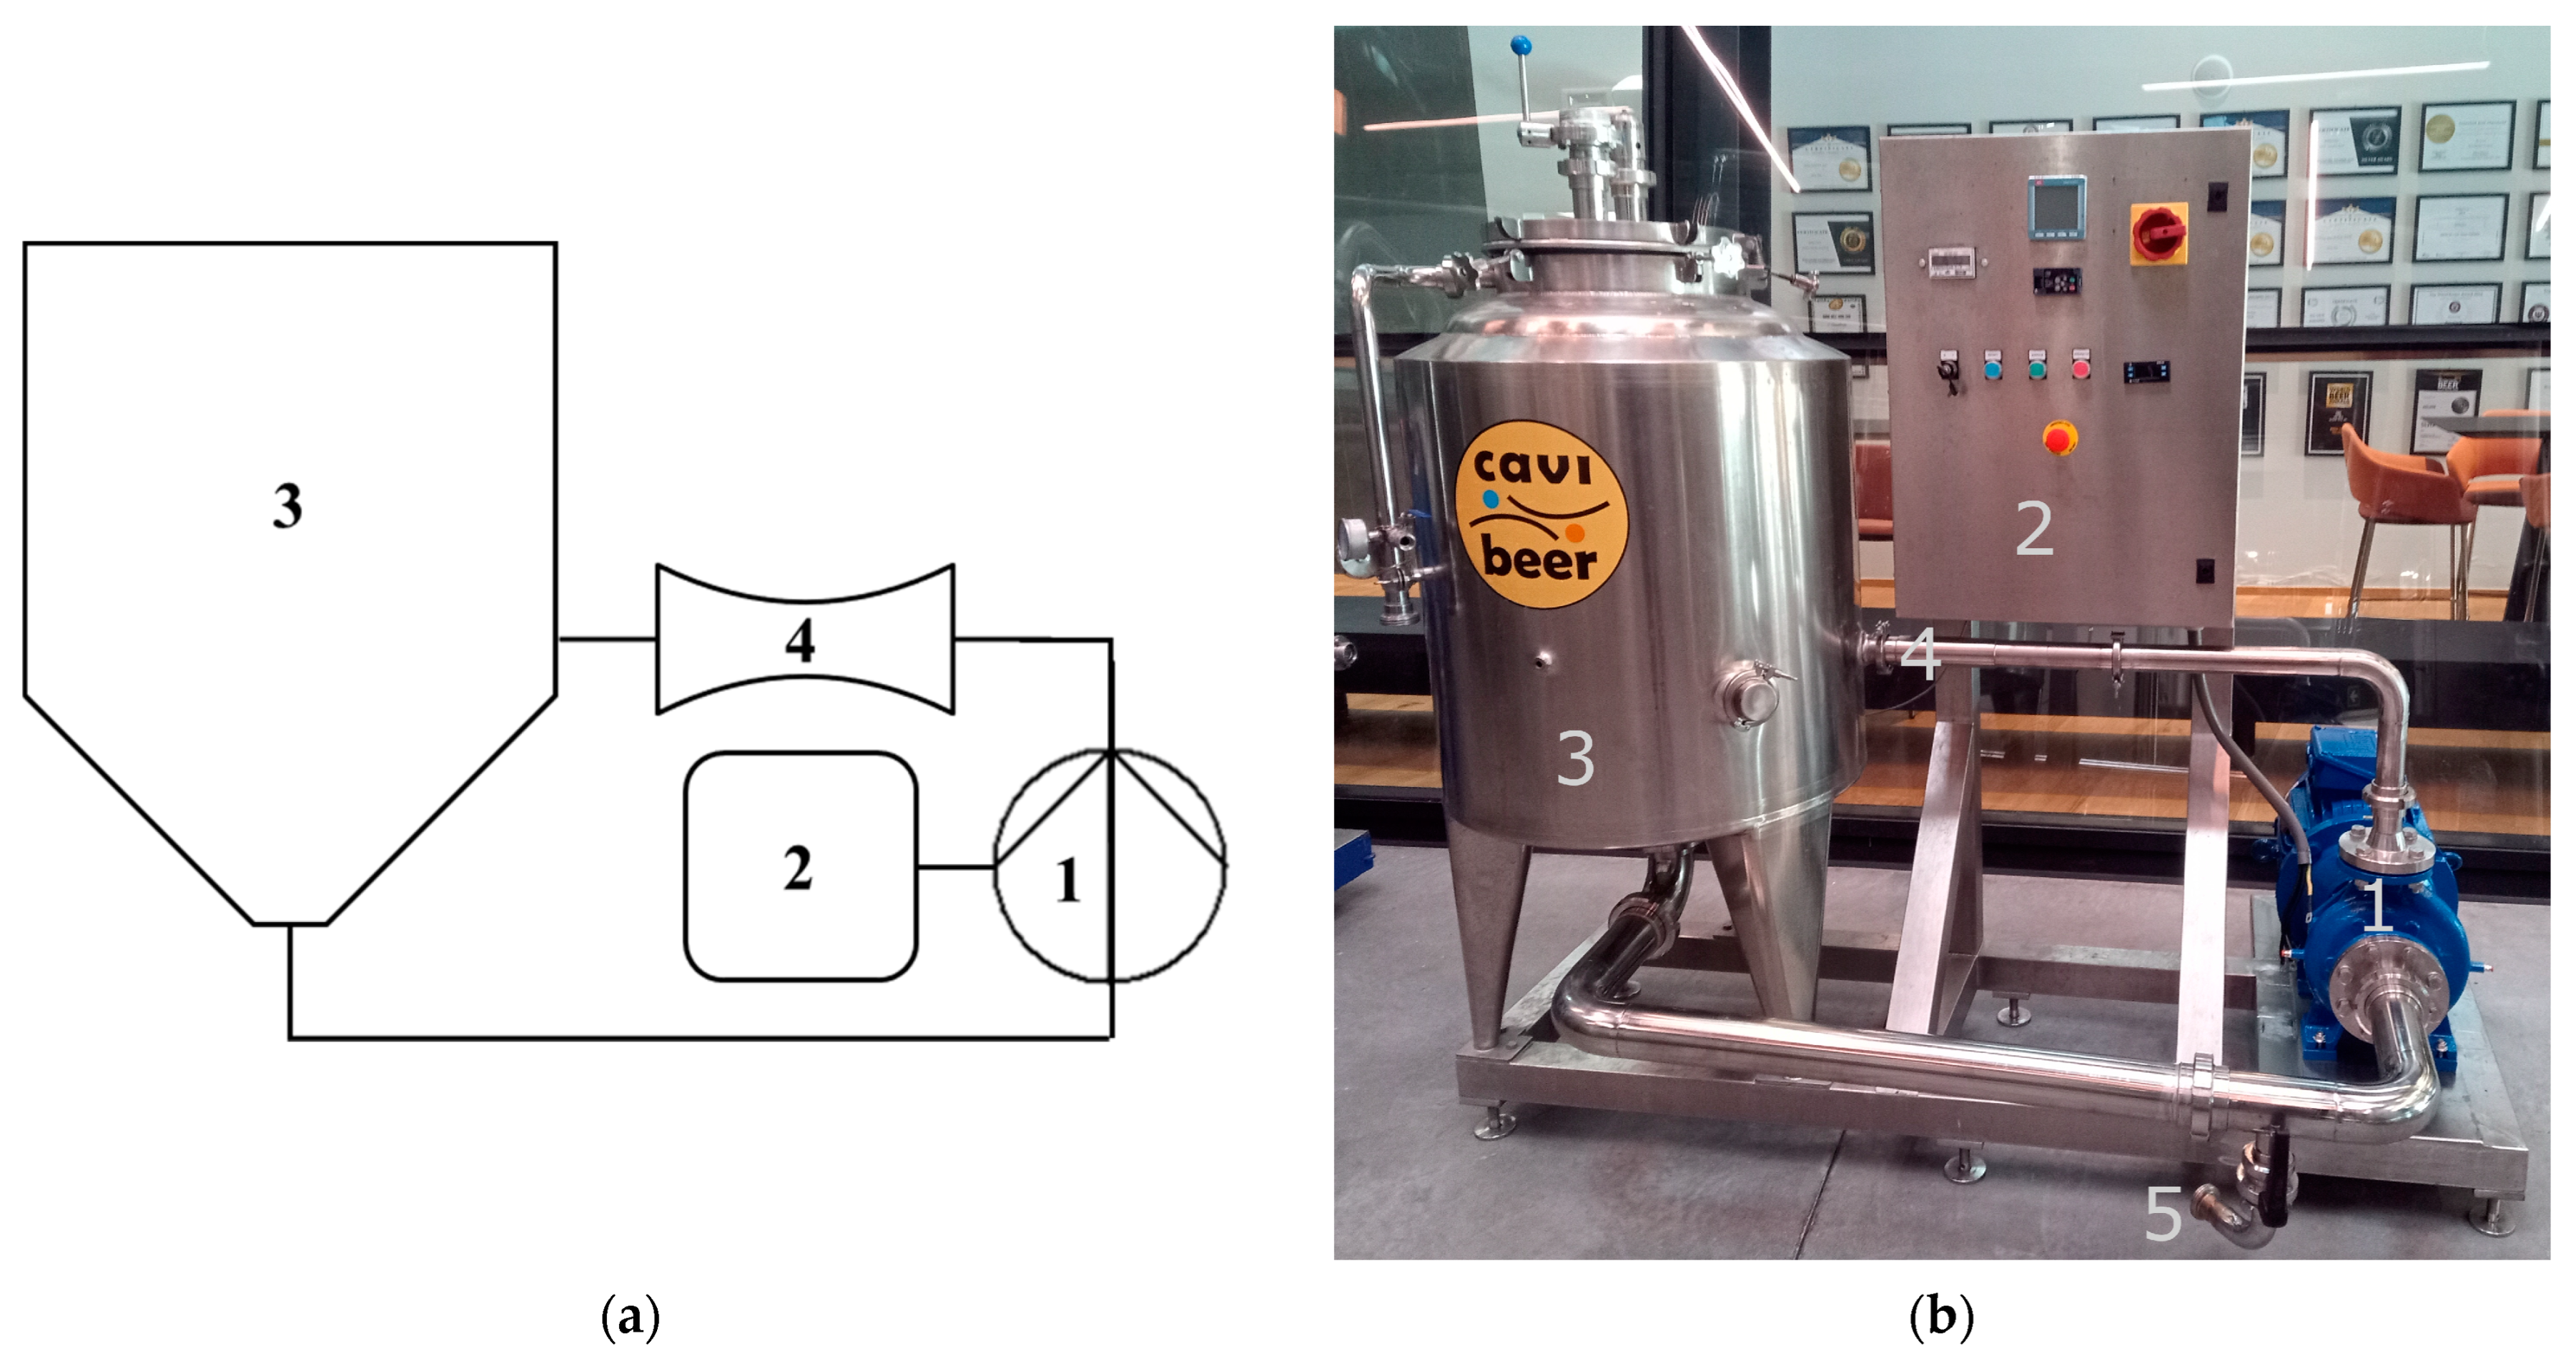
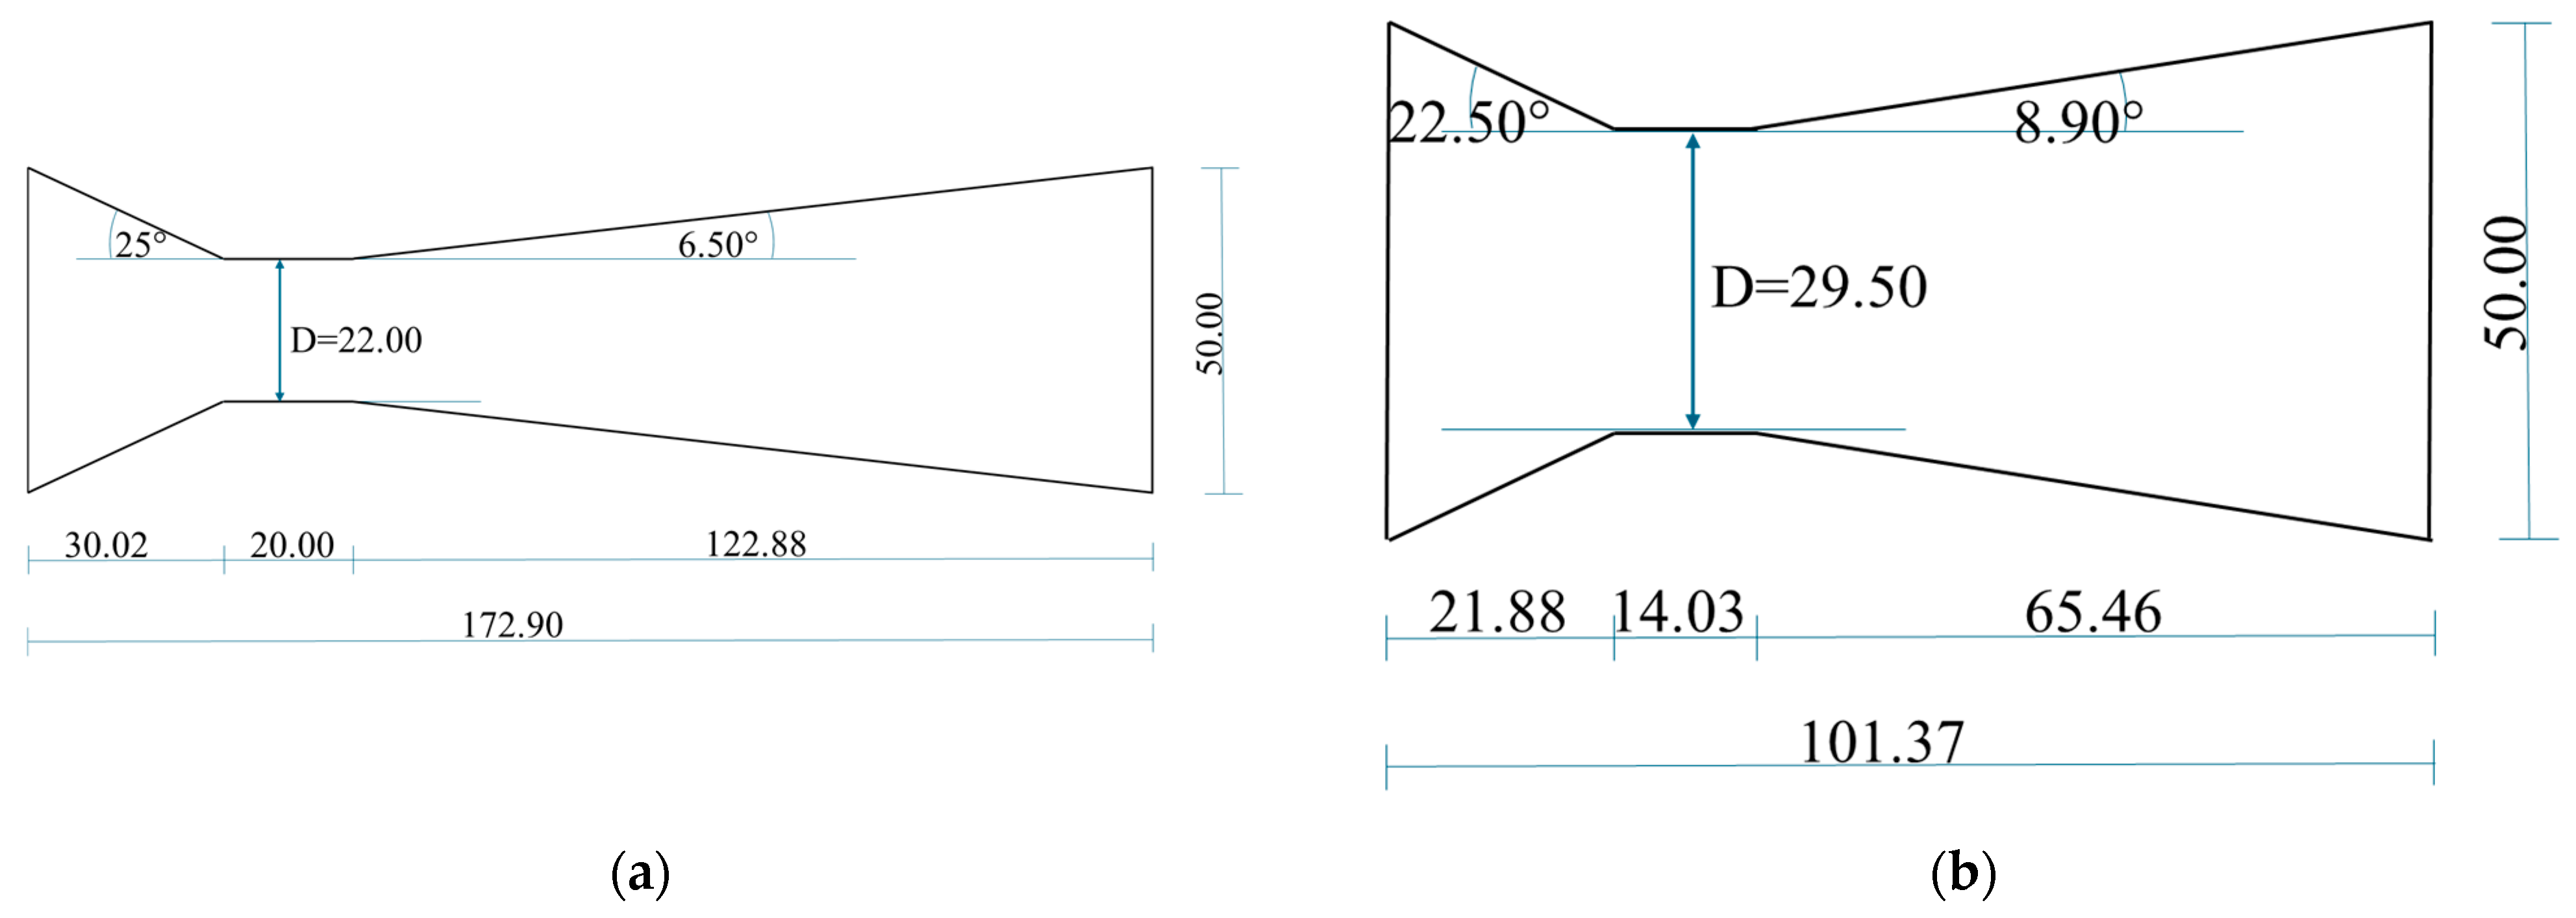
Cavitation in liquid media is a multiphase phenomenon consisting of the generation, growth, and quasi-adiabatic collapse of vapor-filled bubbles under an oscillating pressure field, resulting in pressure shockwaves (up to 1000 bar), hydraulic jets, extreme local temperatures (up to thousands of K), and the formation of free radicals, in particular, hydroxyl groups [16,17].
Across cavitation technologies, HC, implemented either by circulating a liquid or a liquid–solid mixture, through static constrictions of various geometries, or by special immersed rotary equipment, is the only fully scalable technological solution. HC showed outstanding effectiveness and efficiency for food processing, process intensification, and extraction of natural products, besides plenty of other applications [18,19].
With static HC reactors, the simplest representation of cavitation regimes is given by the cavitation number (σ), derived from Bernoulli’s law and shown in Equation (3):
σ = p 2 p s a t 0.5 ρ u 2 ,
where p2 is the recovery pressure downstream the throat (Pa); psat is the saturation vapor pressure of the liquid (Pa); σ is the liquid density (kg·m−3); u is the flow velocity through the throat (m·s−1) [20].
Cavitation intensity increases with decreasing cavitation number until the limit of chocked cavitation, the latter occurring with a remarkable increase in the number of cavities that fill the downstream zone of the reactor and reduce the cavitational effects by coalescing and damping the energy released by the neighboring cavity collapse [21]. In distilled water, the range 0.1 < σ < 1 corresponds to developed cavitation [22].
Cavitation can also occur around the impeller of a centrifugal pump and can be described by the usual cavitation number as in Equation (3) [23], where the velocity term u is assumed as the peripheral velocity of the impeller. For most practical applications of HC processes performed under atmospheric pressure, the recovery pressure term p2 can be considered equal to the atmospheric pressure (on average, 1 bar at sea level) for both the throat and the pump impeller cavitation zones [24].
Static HC reactors, such as Venturi or orifice constrictions, were shown to outperform rotation reactors, especially in full-scale applications [25,26], with static reactors showing increasing efficiency with size due to the reduction in pressure and energy requirements to achieve the same flow speed [27]. With static reactors, σ can easily be controlled through the flow velocity u, just changing the geometry of the reactor itself or the frequency of the pump used to circulate the liquid or the mixture. Moreover, all else being equal, σ changes also with the temperature of the circulating medium due to the temperature dependence of the quantities psat and ρ .
HC-based technologies and related methods appear on the verge of widespread industrial uptake, with plenty of opportunities related to the unrivaled intensification of chemical, physico-chemical, and biochemical reactions, and residual barriers due to the insufficient technological and process standardization, cultural resistance, and cost for technological implementation [28].

2.2. HC Device

The HC device consisted of a closed hydraulic circuit with a total volume of approximately 230 L, equipped with a centrifugal pump with a closed impeller of diameter 200 mm, reference speed of 2930 rpm at the frequency of 50 Hz, and operating point: flow of 48 m3/h, head of 47.4 m, power of 9.63 kW, efficiency of 64.38% (model RD 50-20, Salvatore Robuschi e C. S.r.l., Parma, Italy). Moreover, a custom-made electronic control panel including a 15 kW inverter to regulate the power frequency (model FRN0029E2S-4E, Fuji Electric, Suzuka, Japan), an inline tank with inlet and outlet connections, a Venturi-shaped HC reactor with circular section as the key components, with electricity as the only energy source. All the parts in contact with the circulating brewer’s wort were made of food-grade stainless steel. The device was qualitatively similar to the one described in previous studies [3].
The pump impeller transferred mechanical energy to the brewer’s wort, which was converted by friction into heat during the process. No active control of the heating rate was used, and only partial thermal insulation was set up, which affected the wort heating rate. Preliminary trials were performed with pure water, aimed at an approximate assessment of the sensible heat loss, tuning the frequency through the inverter in order to change the power supplied by the pump impeller to the circulating liquid until the temperature was stabilized at different levels the sensible heat loss was assessed as a function of temperature as in Equation (4):
H L O S S = 45.40596 · e 0.03835 · T ,
where HLOSS is the sensible heat loss rate (W), and T is the temperature (°C). Notably, at 94 °C, HLOSS was about 1700 W, or 30 to 50% of the power consumed by the pump operating at the allowed frequency for the temperature of 94 °C (33 to 40 Hz, due to excessive foaming).
Absorbed power and energy consumption, in the form of electricity supplied to the centrifugal pump, were measured using a three-phase digital power meter, power resolution 1 W, energy resolution 10 Wh, accuracy according to the norms EN 50470-1: 2006 [29], and EN 50470-3: 2006 [30] (model OR-WE-517, ORNO, Gliwice, Poland).
The velocity term u in Equation (3) for the cavitation number in the Venturi-shaped reactor zone was assessed based on the absorbed power measured by the digital power meter, which is univocally related to a specific head and discharge according to the pump characteristic curves, for any given level of the frequency set through the inverter. The velocity term u was calculated according to Equation (5):
u = Q π · D 2 2 ,
where Q is the discharge (m3·s−1) and D is the throat diameter (m).
The velocity term u in Equation (3) for the cavitation number in the pump impeller zone, equal to the peripheral velocity of the impeller, was calculated based on the frequency set through the inverter, which is proportional to the rotation speed of the impeller, and the impeller diameter.
Figure 1 shows a simplified layout of the HC device and a picture of the actual equipment.
Figure 2 shows the layout of two static circular Venturi-shaped reactors used in the HC trials, which had been previously designed to assess the sensitivity of brewing performance to reactor geometry.

2.3. Brewer’s Wort Boiling Trials

Brewer’s wort boiling trials were performed using clear wort resulting after mash-out, separation, and sparging, produced by a medium-sized craft brewery at a site located 500 m a.s.l., where the average atmospheric pressure was about 0.951 bar (95,100 Pa), which was the level assumed for term p2 in Equation (3). The malt used by the craft brewery to produce the clear wort was BEST Pilsen (P.A.B. S.r.l., Pasian di Prato, Udine, Italy). The hops used in the HC experiments were Saaz Shine (P.A.B. S.r.l., Pasian di Prato, Udine, Italy), with alpha-acids content of 4 ± 1%. In HC trials, a food-grade anti-foam product (FD20Pk, P.A.B. S.r.l., Pasian di Prato, Udine, Italy) was used to reduce foaming and avoid suppressing cavitation processes.
Table 1 shows a few basic features of the performed boiling trials, such as wort initial volume, initial sampling temperature, initial Plato degree, and overall process time. For trials, STD1 and STD2, the operational craft brewery boiling kettle and a separate simplified kettle with heat treatment only were used, respectively. For all the other HC trials, the device shown in Figure 1 was used. After the insertion of the clear wort into the specific device, it was immediately processed; moreover, the HC device was accurately cleaned at the end of each trial.
For each HC trial, 200 g of hops were inserted at 82 ± 2°C and the anti-foam product, generally in 2 mL, at a temperature of 83 °C.

2.4. SMM Conversion Reaction Model

The standard model for SMM conversion into free DMS was built upon the first-order reaction model represented in Equation (1), which is represented again in Equation (6) in a discrete form, expressing SMM concentration at time t as a function of SMM concentration at the previous time step t − Δt and the SMM half-life:
S M M t = S M M t t · e ln 2 H L S M M · t ,
where Δt is the time step (minutes) and HLSMM (minutes) is a function of temperature T and pH of the wort, which can be derived based on data shown in previous studies [4,9], as described in Equation (7):
H L S M M T ,   p H = c 1 · p H 2 + c 2 · p H + c 3 · e c 4 · T ¯ ,
where T is the temperature (°C) at time t, T ¯ is the average temperature between times t − Δt and t, and the coefficients assume the following values: c1 = −3,243,663.244; c2 = 32566378.970; c3 = −77,199,185.207; c4 = −0.1155. Due to quadratic interpolation, an upper limit of 4,495,717.26 was set on the trinomial in brackets on the right side of Equation (7), which is the numerical value of the same trinomial corresponding to a pH level of 4.9. The term pH in Equation (7) was also a function of time due to the acidification of the wort during heating.
Deviations of the model for SMM conversion into free DMS from the standard model due to cavitation effects were assessed by simply scaling the term HLSMM with a specific factor for each HC trial. The latter factor was assessed based on a visually acceptable fit with the SMM content data without specific statistical processing due to changing conditions during the trials.

2.5. Free DMS Removal Efficiency

The efficiency in removing free DMS, which was initially present in the wort and subsequently generated by SMM decomposition, was assessed at any measurement point as the difference between actual free DMS concentration and its potential level (previous level plus change in SMM concentration), divided by its potential level, as per Equation (8):
D R R i = D M S i D M S i 1 + S M M i S M M i 1 D M S i 1 + S M M i S M M i 1 t · 100 ,
where DRRi is the free DMS relative removal rate (min−1 × 100) at a measurement point, DMSi and DMSi-1 are free DMS concentrations at the considered and previous measurement point, respectively, and SMMi and SMMi-1 are SMM concentrations at the considered and previous measurement point, respectively. DRRi, always ≤0, is multiplied by 100 for representation purposes. To make DRRi independent from the initial conditions of the wort, as the initial content of free DMS and SMM increased with original gravity, its expression was normalized by the potential concentration level of DMS at the considered measurement point.

2.6. Sampling and Analyses

During each trial, samples were collected in sterile bottles with a volume of 1 L at the initial time and at different process times. Each sample was immediately processed in a blast chiller and stored at −20 °C until analysis. Analyses were performed by a laboratory accredited by Accredia, The Italian Accreditation Body (https://www.accredia.it/en/, accessed on 31 December 2024; laboratory No. 0754), complying with standards UNI CEI EN ISO/IEC 17025:2017 [31], and ISO 9001 [32]. All reagents were of analytical grade.
The contents of free DMS and total DMS were measured using a Headspace–Gas Chromatography–Mass Spectrometry (HS-GC-MS) method, which was described in detail and experimentally validated in a previous study [11], while the content of SMM, as the DMS precursor, was assessed as the difference between total and free DMS.
The determination of fructose, glucose, and its oligomers up to the degree of polymerization 7 was performed using HPLC in a solvent gradient and evaporative light scattering detector (ELSD). The details of the method used are available in a previous study [33].
All the other wort quantities were measured according to official methods set by the European Brewery Convention (EBC, https://europeanbreweryconvention.eu/, accessed on 31 December 2024):
  • Plato degree: Measurement of the specific weight using a densimeter and conversion to Plato degrees using a formula derived from the Goldiner/Kampf tables [34]. Reference: ANALYTICA EBC 8.3/2004 [35].
  • pH: Measurement at 20 °C with a potentiometric method. Reference: ANALYTICA EBC 8.17/1999 [36].
  • Bitterness: Determination in units of International Bitterness Unit (IBU) by extraction with trimethylpentane and spectrophotometric reading in the ultraviolet. Reference: ANALYTICA EBC 8.8/2004 [37].
  • Color: Measurement of the wort color on the EBC scale, performed using a spectrophotometric method after filtration. Reference: ANALYTICA EBC 8.5/2000 [38].
  • Free amino nitrogen (FAN): Determination with a colorimetric reading by spectrophotometer and ninhydrin. Reference: ANALYTICA EBC 8.10.1/2015 [39].
  • Viscosity: Determination with a falling-ball microviscometer. Reference: ANALYTICA EBC 8.4/2004 [40].
  • Beta glucans: Determination of high-molecular-weight beta glucans with an R-Biopharm kit (R-Biopharm Italia Srl, Melegnano, Italy) and colorimetric reading with a spectrophotometer. Reference: ANALYTICA EBC 4.16.3/2005 [41].

3. Results

3.1. SMM Model Sensitivity to the Time Step

In principle, the choice for the time step Δt in Equation (6) is critical because the computation of both SMM in Equation (6) and HLSMM in Equation (7) depends on Δt, with HLSMM showing an exponential relationship with the temperature and halving for each 6 °C increase in temperature [9], thus changing by approximately 16% for each 1 °C increase in temperature. The choice for Δt such that HLSMM changes by no more than 16% seems reasonable, corresponding to heating by 1 °C. In the analyzed HC trials, the heating rate was in the range of 0.36 °C/minute around the temperature of 78 °C to 0.14 °C/minute around the temperature of 92°C; thus, a time step of 3 min could be acceptable. However, a sensitivity analysis proved no visible change of SMM at any process time with Δt = 1 min or 3 min, a very small overestimation with Δt = 6 min, and an increasing overestimation with Δt higher than 12 min. Figure S1 in Supplementary Materials shows the sensitivity analysis results for trial H5, for which the complete data set was available across the HC trials. Prudentially, it was decided to keep Δt = 3 min.

3.2. SMM and DMS in Standard Trials

Figure 3 shows the results of brewer’s wort boiling trials STD1 and STD2, aimed at checking the standard model for the SMM conversion reaction, as represented in Equations (6) and (7). Conservatively, the concentration levels shown for the considered quantities did not consider the water evaporation that occurred during the trials (assessed between 1.5% and 4.5% based on the change in Plato degree), i.e., only directly measured data are shown.
The results for trial STD1, performed according to the operational brewery’s boiling practice, including strong agitation, showed that the evolution of SMM concentration strictly followed the standard model, as well as free DMS was effectively removed from the boiling wort after the boiling temperature of 100 °C was achieved.
The results for trial STD2, performed in a separate kettle with little or no stirring up to the temperature of 95 °C, again showed that the evolution of SMM concentration strictly followed the standard model. In this case, no effective removal of free DMS from the wort was observed; thus, the total DMS content changed very little during the process.

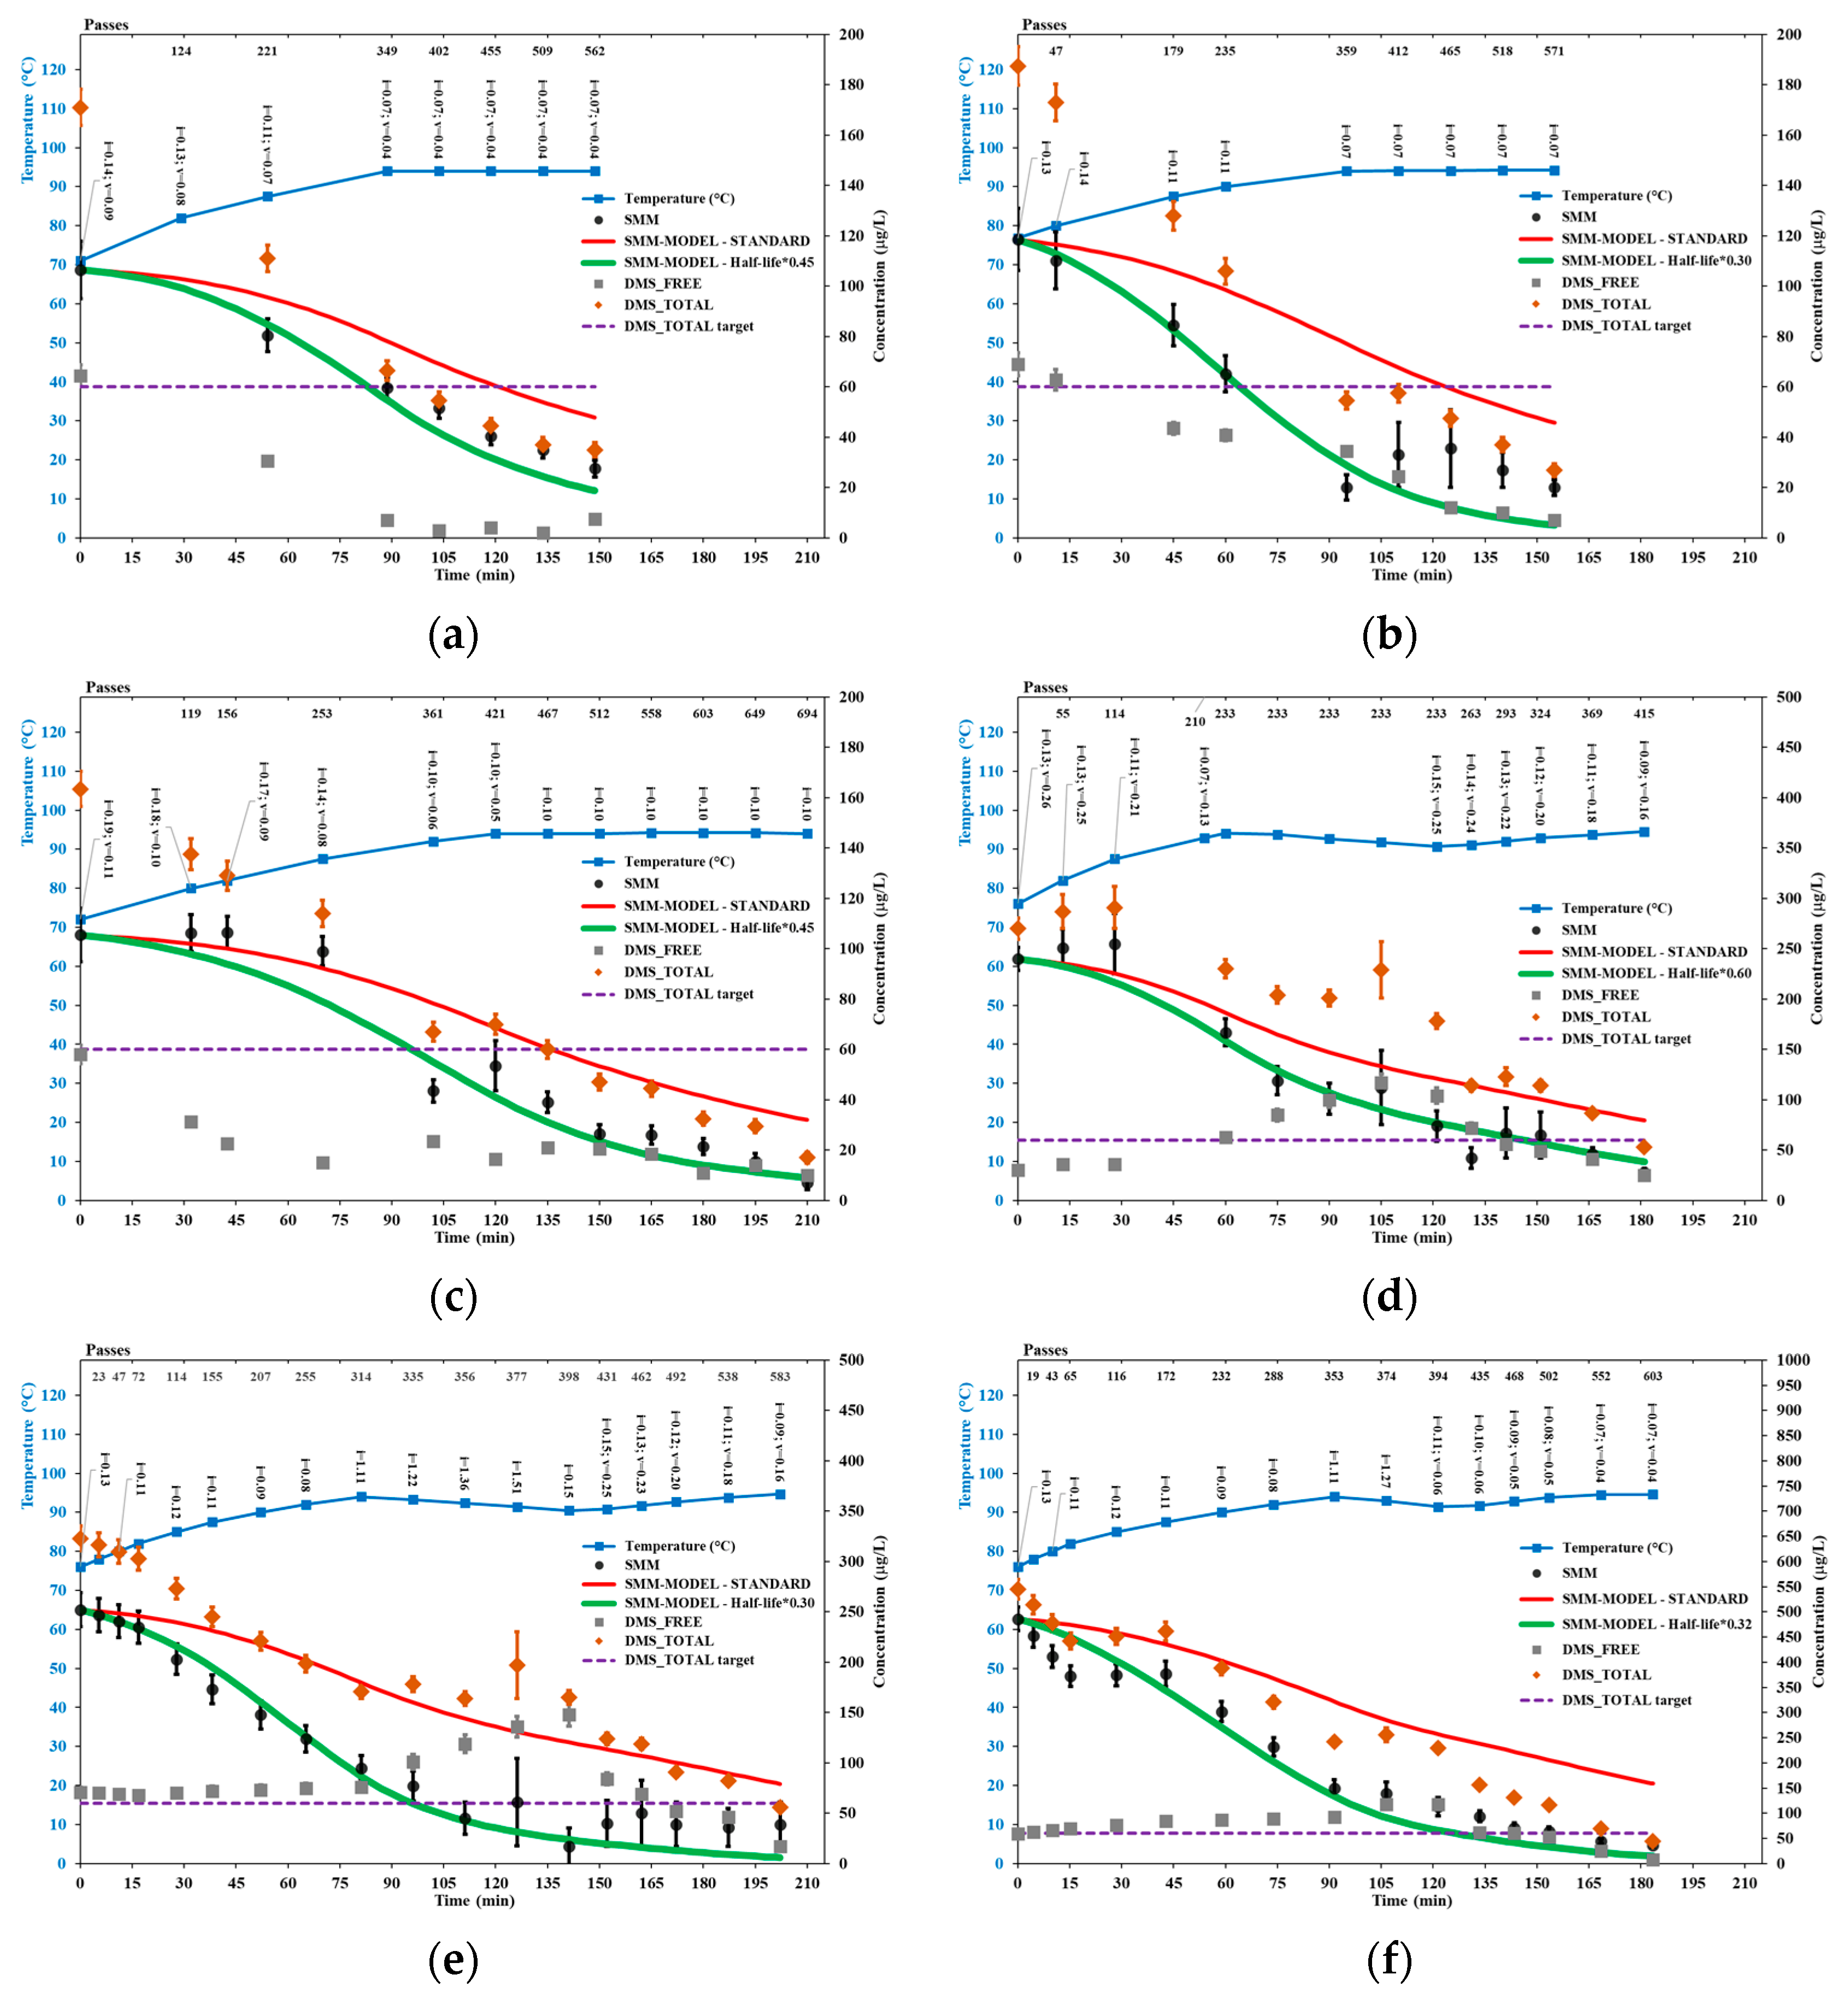
3.3. SMM and DMS in HC Trials

Figure 4 shows the results of the brewer’s wort trials performed with the HC device. Conservatively, the concentration levels shown for the considered quantities did not take into account the water evaporation that occurred during the trials (assessed between 3% and 10% based on the change in Plato degree), i.e., only directly measured data are shown.
The peak temperature in HC trials could not exceed 94.4 ± 0.4 °C, likely due to a balance between the power supplied by the pump to the circulating mixture, on the one hand, and the loss of sensible heat, represented in Equation (4), and latent heat of evaporation on the other hand. As stated in Section 2.2, at temperatures around 94 °C, the maximum allowed frequency set through the inverter was in the range of 33 to 40 Hz due to excessive foaming, which limited the power supplied by the pump.
While all the HC trials showed a remarkable intensification of the SMM conversion reaction, trials with the most significant reduction in SMM half-life (HC2, HC5, and HC6) were performed without a Venturi-shaped reactor, i.e., with the only cavitation zone in correspondence with the pump impeller, at least until a process temperature of 94 °C, with the cavitation number decreasing from approximately 0.13 to 0.06 during wort heating. Notably, the reduction in SMM half-life was practically identical (around 70%, i.e., SMM half-life multiplied by 0.3, or reaction rate increased by about 3.3 times) across trials HC2, HC5, and HC6, despite the wide range of initial contents of SMM and total DMS, as well as different levels of the Plato degree, thus of original gravity, and viscosity. These trials were comparable also regarding the passes of the entire volume through the cavitation zone, at least during the first 60 min of each process.
Trial HC6 showed a peculiar SMM pattern, with the SMM content initially decreasing very fast, followed by a temporary interruption of the decreasing trend (15 to 43 min of process time), and eventually following the modified curve until the onset of the rest phase (90 to 120 min of process time), which was introduced in the attempt to reduce the energy consumption. The temporary interruption of the decreasing trend of the SMM content could be attributed to the excessive foaming issue experienced in that phase of the trial H6, likely due to the high original gravity of the wort, which was fixed by inserting a further amount of the anti-foam product.
The effect of cavitation on the SMM conversion rate also arises based on the evident slowdown or discontinuation of the decrease in SMM content after the onset of the rest phases, such as in trials HC4 (from 60 to 120 min of process time; no recirculation), HC5 (from 80 to 140 min of process time; very slow recirculation), and HC6 (from 90 to 120 min of process time; very slow recirculation). Moreover, across the trials performed with a Venturi-shaped reactor, the SMM content initially followed the standard model in trials HC3 and HC4 but not in trial HC1. The most evident differences among such trials were the higher levels of the cavitation number in the impeller zone (HC3) or in the Venturi reactor zone (HC4) compared to HC1.
The free DMS relative removal rate (DRR) results are shown in Figure S2 in Supplementary Materials for all the HC trials and the trial STD1. DRR increased with temperature, as shown in Figure S2g for the ordinary vigorous boiling trial STD1 and any HC trial. Moreover, DRR vanished during rest phases (no active cavitation) in HC trials, such as shown in Figure S2d (trial H4), Figure S2e (trial H5), and Figure S2f (trial H6). During active cavitation phases, the level of DRR at about 94 °C was practically indistinguishable from the same level in trial STD1 at the temperature of about 100° C, which can be attributed to the cavitation-generated turbulence. Finally, during active cavitation phases, although sometimes excessive foaming could have hindered the removal of free DMS, DRR intensified with lower levels of the cavitation number, either in the Venturi or the pump impeller zone. For example, at temperatures of 90 to 94 °C, DRR was higher (more negative) in trials H1 (Figure S2a) and H6 (Figure S2f) than in trials H4 (Figure S2d) and H5 (Figure S2e).

3.4. Other Wort Properties in Selected HC Trials

A few additional properties of brewer’s wort were measured for the trials showing the greatest intensification of the SMM conversion reaction (the greatest reduction in SMM half-life), i.e., trials HC2, HC5, and HC6. Table 2 shows the IBU levels, the assessment of hop alpha-acids utilization, and the wort color. Other parameters, such as free amino nitrogen (FAN), total and specific sugars, beta-glucans, and viscosity, were practically unaffected by HC processes.
The initial IBU levels, as high as 7.0 ± 0.1 for trial HC6, were due to residual hop from previous brewing sessions in the brewery’s kettle, which conferred some bitterness to the wort used for the HC experiments. The hop utilization was affected by significant uncertainties due to the uncertainty of the alpha-acid content of the used hops (4 ± 1%); however, trial HC2 appeared to have achieved a higher utilization rate and substantially earlier compared to trials HC5 and HC6.
Wort color tended to increase in all the considered trials despite relatively significant uncertainties (about 20% of the central level). About trial HC2, which showed the lowest increase, it should be noted that the sampling was performed before the onset of the nearly isothermal phase at the temperature of 94 °C, while the last sampling for trials HC5 and HC6 was performed near the end of such phase at the temperatures of 94.8 °C and 94.5 °C, respectively.

4. Discussion

A recent study used HC to process brewer’s wort at the pilot scale according to a structured design of experiments and found a substantial acceleration of hop alpha-acids isomerization over conventional heat treatment, so much that sufficient isomerization was achieved with HC processing for 90 min at the temperature of 90 °C [42]. However, other qualitative parameters of brewer’s wort, such as total DMS and color, did not comply with standard specifications, requiring further heating to 100 °C followed by boiling for 10 min at 100 °C. Although a lower level of total DMS was achieved in the HC experiment compared to conventional heat treatment, which were performed at 90 °C for 90 min, this topic was overlooked as the study focused on the isomerization of hop alpha-acids.
The first important result of this study, presented in Section 3.2 and based on trials performed using classical boiling, was the successful validation of the standard model of the SMM conversion reaction [4,9], which allowed us to confidently assess the distinct effect of HC processes.
Based on the results presented in Section 3.3, the SMM conversion reaction was shown to be remarkably intensified by cavitation processes to an extent quite sensitive to HC process parameters, in particular to the cavitation number in the pump impeller or Venturi reactor zones. Within the limits of this retrospective study, the optimal setting for the intensification of the SMM conversion reaction, by as much as a factor of 3.3 for the reaction rate k shown in Equation (1), or a reduction by 70% of the SMM half-life shown in Equation (2), was the simple recirculation of the brewer’s wort through the centrifugal pump, provided that the level of the cavitation number in the pump impeller zone was within the range of 0.07 to 0.13, such as in trials HC2, HC5 and HC6.
However, cavitation number levels greater than 0.13, either in the pump impeller or Venturi reactor zones, appeared to completely suppress the intensification effect, while the presence of two cavitation zones, even with low levels of the cavitation number, damped the intensification effect.
As anticipated in Section 1, the conversion reaction of SMM into DMS was described as a nucleophilic substitution reaction by hydroxyl groups from water molecules during heat processing [10], leading to the hydrolysis of the carbon–sulfide bond [7]. Beyond temperature, the reaction rate is controlled by pH level, as the content of hydroxyl groups in water increases with pH. This framework offers a mechanism to explain the effect of cavitation on the intensification of the SMM conversion reaction, i.e., due to the excess generation of hydroxyl groups. Indeed, as anticipated in Section 2.1, the collapse of the cavitation bubbles generates intense hydraulic jets, shockwaves, and highly reactive species, such as, in aqueous liquids, •OH, H•, and H2O2 [43].
The HC-based generation of hydroxyl groups •OH is likely the main mechanism of intensification of the SMM conversion reaction. Due to the hydrophilic nature of SMM, this molecule could not migrate into the vapor-filled cavitation bubbles, contrary to hydrophobic substances that could undergo pyrolytic disintegration processes after migration into the bubbles. Residing in the bulk aqueous environment, SMM molecules could practically react only with residual •OH radicals created by the splitting of water molecules enhanced by cavitation processes, which did not react with other molecules at the gas–liquid interface [44].
A mathematical model was developed and experimentally validated to simulate the global production of hydroxyl radicals in pure water based on a set of differential equations that account for the hydrodynamics, mass diffusion, heat exchange, and chemical reactions inside the cavitation bubbles generated by HC inside a Venturi-shaped reactor [21]. The model results confirmed and quantified the theoretical prediction that increasing inlet pressure, i.e., increasing flow rate and decreasing cavitation number, leads to premature collapse of the cavitation bubbles, thus less violent collapse events and lower specific generation of •OH groups, with relative differences in the specific generation rate levels (number of •OH molecules generated per collapsing bubble) spanning up to more than two orders of magnitude (roughly, from 5 × 10¹⁰ to 7 × 10¹² molecules/bubble). However, a lower cavitation number leads to a higher bubble generation rate, resulting in a non-monotonic relationship between inlet pressure (cavitation number) and overall generation of •OH molecules. Within the limits of cavitation regimes, the range of relative differences in the global production rate of hydroxyl radicals as a function of inlet pressure (or cavitation number) was smaller than the range applicable to the specific production but still up to one order of magnitude. Thus, it is very likely that, for a given temperature, the content of •OH groups in a liquid medium undergoing continuous cavitation increases by substantially more than one order of magnitude compared to heat treatment alone.
A later study further confirmed the sensitivity of the global generation rate of •OH radicals in a Venturi-shaped HC reactor to the inlet pressure (cavitation number), which was even larger than previously predicted (up to roughly three orders of magnitude), as well as showed remarkable sensitivity to the geometrical features of the Venturi reactor [45]. For a simple circular Venturi reactor, with geometrical features similar to the ones used in this study, a weak local peak generation rate of •OH radicals was found at the inlet pressure of 4 bar and a substantially higher generation rate at the inlet pressure of 6 bar, further showing the non-monotonicity of the considered dependence.
The above considerations further substantiate the hypothesis that the HC-based increased generation rate of •OH molecules was a major mechanism leading to the intensification of the SMM conversion reaction.
Based on the evidence presented in Section 3.3, the extent of the reduction in SMM half-life was practically identical across trials H2, H5, and H6, despite remarkably different levels of original gravity (Plato degree), thus a load of soluble extractives, and consequently of viscosity, as shown in Table 1. Liquid viscosity is an important parameter in the equations of all cavitation models [46], and a recent study offered a direct observation of pressure shockwaves generated after bubble collapse as a function of liquid viscosity [47]. The pressure peak and energy of the primary shockwave decreased very fast with increasing viscosity at a certain distance from the bubble center and attenuated faster with distance, and the shockwave front thickened, thus decreasing the highly relevant pressure gradient.
On the other hand, in the case of aqueous mixtures containing solid particles up to the concentration of 10%, the cavitation efficiency generally increased, as shown based on the vapor content (increase up to about 5%), and, in particular, the bubbles generation rate [48]. The main mechanisms were identified in the creation of further cavitation nuclei and the increase in slip velocity and turbulent kinetic energy, also finding that the average diameter range of solid particles promoting cavitation decreased with increasing concentration.
It is known that, during the wort boiling process, the macromolecular proteins in wort and the polyphenols from malt and hops will be coagulated and precipitated [49]. Thus, it is likely that the content of solid particles continuously recirculated in the wort increased during the prolonged heating and cavitation processes, with the diameter of such particles decreasing due to cavitation-induced erosion.
Overall, the tendency to decrease cavitation intensity due to increasing viscosity could be compensated for by the cavitation intensification effect due to the increasing content of solid particles, leading to a comparable generation rate of hydroxyl groups. This could explain the comparable intensification of the SMM conversion reaction in trials H2, H5, and H6 and further reinforce the hypothesis that the HC-based excess generation of •OH molecules is the main intensification mechanism of the SMM conversion reaction.
The above discussion also explains the remarkable sensitivity of the degree of intensification of the SMM conversion reaction to the level of the cavitation number, especially in trials HC1, HC3, and HC4, based on the different global production of •OH radicals. Results achieved in trial HC1, with levels of the cavitation number in the pump impeller zone very similar to trials HC2, HC5, and HC6, could also be explained based on the lower levels of the cavitation number in the Venturi reaction zone (0.09 to 0.04).
A closer look at trial HC1, shown in Figure 4a, allows us to identify two distinct SMM patterns: a steeper decrease trend in SMM content up to about 54 min of process time, during which the cavitation number in the Venturi reactor zone decreased from 0.09 to 0.07, followed by a slower decrease trend when the cavitation number in the same zone further dropped to the level of 0.04, possibly due to the transition to a chocked cavitation regime with effective inhibition of bubble collapse and generation of •OH radicals. This consideration could be relevant for further optimization, as it was shown in Section 3.3 that the presence of both cavitation zones was favorable for the removal of free DMS, likely due to enhanced turbulence in the circulating wort. Indeed, constraining the levels of the cavitation number in both zones within an optimal range for the intensification of the SMM conversion reaction, such as 0.13 to 0.07, could also be quite effective for removing free DMS. By avoiding unnecessary rest phases, it is possible to reduce both SMM and free DMS, and, consequently, total DMS, more quickly and with significantly lower energy consumption until compliance with standard specifications is achieved. This is recommended as a subject for further fundamental and industrial research.
Finally, it can be argued that hydroxyl radicals generated by cavitation events could be effectively scavenged by the reaction with SMM molecules, leaving fewer of them for the oxidation of brewer’s wort. Although this consideration deserves further research for proper confirmation, it would explain why both in the considered experiments and previous ones, no oxidation of the brewer’s wort was observed.
It is worth noting that the target for total DMS, set at the level of 60 μg/L, was achieved in all the considered HC trials, relatively faster (about 90 min) in trials whose initial total DMS level was lower, such as in trial HC1 which showed a reduction in the SMM half-life by 55% and effective removal of free DMS, and in trial HC2, showing the maximum intensification of the SMM conversion reaction and a removal rate of free DMS only slightly lower compared to trial HC1. Notably, trial HC6, starting with much higher levels of total DMS and SMM, achieved the total DMS target more than 30 min earlier than trial HC5 despite the practically identical intensification of the SMM conversion reaction due to comparatively more effective removal of free DMS, especially during the final boiling phase up to about 94 °C when the cavitation number was substantially lower in both cavitation zones and the shorter rest period that limited the accumulation of free DMS. Due to several variables involved, such as wort temperature and cavitation occurring in two zones and the confounding effect of occasional excessive foaming, data were insufficient to derive quantitative relationships for DRR, a topic that is recommended for further research.
Besides complying with standard specifications for total DMS, the HC-processed brewer’s wort also complied with other quality standards.
Based on data presented in Section 3.4 and Table 2 for trials showing the greatest intensification of the SMM conversion reaction, i.e., HC2, HC5, and HC6, the hop utilization rate, as a measure of the effectiveness of the hop alpha-acids isomerization reaction, was affected by large uncertainties. However, the levels of hop utilization rate (45 ± 17% to 62 ± 27%) could have been even higher than in previous experiments using HC processes [3], where they did not exceed 35%. Such a difference could be preliminarily attributed to the higher levels of the cavitation number used in previous experiments. Overall, the achieved results on hop utilization rate complied with the brewery’s standard specifications and confirmed recent results about the HC effect on the intensification of the isomerization of hop alpha-acids at substantially sub-boiling temperatures [42].
While process temperatures were practically identical across the considered trials, the main process differences that could explain the higher hop utilization in trial HC2 were the following:
  • The original gravity (HC2 < HC5 < HC6), with high gravity found to hinder the hop alpha-acid isomerization process [50];
  • pH levels, which were slightly higher in trial HC2 than HC5 or HC6, with the isomerization reaction rate increasing with pH level [50];
  • As reported in Section 3.3, trial HC6 was affected by excessive foaming in its early phase, which hindered the cavitation processes;
  • The onset of a rest phase in trial HC5 that started after 80 min of process time, which likely hindered the isomerization process.
Based on the data presented in Section 3.4 and Table 2, the change in the wort color index during HC trials HC2, HC5, and HC6 aligns with the figures recently reported by Štěrba et al. for other wort boiling experiments involving HC processes and was deemed compliant with standard specifications [42], particularly regarding an overall increase by about 5 EBC points in trials HC5 and HC6. Notably, such an increase occurred between the starting point and the end (HC5) or near the end (HC6) of the trials, and in trial HC5, most of the increase in color index occurred after the end of the rest phase. Due to the practical uselessness of the rest phase, this result could have been safely achieved substantially earlier, such as after 140 min of process time. A similar consideration holds for trial HC6, which underwent a shorter rest phase of 30 min. The result shown for trial HC2, i.e., an increase in the color index of about 2 EBC points, complies with the intermediate result achieved for trial HC5, as the sampling during the trial HC2 was performed at the end of the heating phase and before the onset of the isothermal phase around the temperature of 94 °C.
As already stated in Section 3.4, other wort parameters, such as FAN, total and specific sugars, beta-glucans, and viscosity, were practically unaffected by HC processes.
Scaling up the HC device to full industrial production capacity would be straightforward, as recently demonstrated by a similar technological setup aimed at processing forestry by-products [51], and it could offer distinct advantages:
  • The sensible heat loss in full-scale HC equipment would be comparatively much lower than the pilot scale device used in the considered trials, which would help save additional energy and process time. Indeed, the balance discussed in Section 3.3 between the power supplied by the pump, on the one hand, and the loss of sensible heat and latent heat of evaporation, on the other hand, would shift to higher temperatures than 94.4 ± 0.4 °C, in turn corresponding to higher SMM conversion rates while further reducing the process time and energy consumption.
  • Larger centrifugal pumps used to drive the wort circulation in full-scale HC equipment would be more energy-efficient than the pump used in the experimental trials discussed in this study, which would help save additional energy.
  • A large amount of latent heat from evaporation is available in full-scale equipment used for brewer’s wort boiling. It is common practice in industrial breweries to use such waste heat from previous boiling sessions to perform preliminary wort heating because all the desired processes in conventional wort boiling practically occur starting from a temperature around 95 °C. Heating the wort before HC processing, for example, raising the wort temperature to 85 or 90 °C, would help achieve further and substantial energy savings due to the steep increase in the SMM conversion reaction rate with the temperature.
This study is affected by a few important limitations. First, it was a retrospective analysis of a few trials performed in the absence of a proper design of experiments. Among other things, the nature of this study prevented the elaboration of a proper statistical fitting of the scaling factors of SMM half-life against the SMM content data. Due to logistic and resource constraints, the authors could not perform other trials meant to optimize and further clarify the results. However, based on the data provided with this study, other scholars could repeat the trials, arrange a structured design of experiments, and delve deeper into the subject. Second, the authors realized the relevance of the cavitation zone at the pump impeller only after the conclusion of the experiments and the gathering of sufficient analytical data, which hampered the performance of further sensitivity tests. Furthermore, the use of atmospheric pressure for the quantity p2 in the cavitation number Equation (3) was based on the indication from Shen et al. (2024) [24]. For the sake of accuracy, p2 should be measured, but it was not foreseen in the trials that this study retrospectively analyzed. Thus, the assessment of the cavitation number presented in this study should not be considered accurate in terms of absolute levels but rather representative of different cavitation regimes. Third, the available data concerning other brewer’s wort properties were limited and could not allow a full representation of the degree of compliance of the wort quality with the standard specifications. Fourth, for the sake of proper scale-up to an industrial production capacity, the excessive foaming issue should be fixed. In the retrospectively analyzed pilot-scale trials, it was observed that foaming increased with increasing cavitation intensity (lower cavitation number, in particular in the pump impeller zone) and original gravity. More structured experiments with larger-scale devices will have to be performed to optimize the process parameters towards foam minimization.
Notwithstanding the above limitations, for the first time, this study highlighted the extraordinary performance of hydrodynamic cavitation for the intensification of the SMM conversion reaction at the pilot scale, along with the effective removal of free DMS and the achievement of an overall compliance of the wort quality with standard specifications. These findings could pave the way for a long-awaited solution to an important issue affecting the food industry, potentially contributing to remarkable savings in energy and process time. Finally, a similar approach could be advantageously used for the processing of other food resources, such as certain fruit juices or vegetable beverages, which may be affected by off-flavors caused by DMS.

5. Conclusions

A retrospective analysis of pilot-scale brewer’s wort boiling experiments found for the first time that HC processes intensified the conversion reaction rate of SMM into DMS, the main compound that causes off-flavors in the finished beer, by up to 3.3 times, without the use of additives. The likely mechanism allowing the intensification of the SMM conversion reaction was the excess generation of hydroxyl radicals, with a generation rate increasing with the easily adjustable intensity of HC processes.
Along with the effective conversion of SMM, HC-processed brewer’s wort complied with standard specifications due to the effective removal of free DMS, the accelerated isomerization of hop alpha-acids at sub-boiling temperatures, and the expected change in wort color, while other wort properties remained practically unchanged. Moreover, no oxidation of the brewer’s wort was observed, likely due to the effective scavenging of hydroxyl radicals through their reaction with SMM.
Based on the straightforward scalability of HC methods and devices, these findings could enable the transformation of the traditional time- and energy-intensive boiling step into a significantly shorter and more economical heating step to sub-boiling temperatures, with time and energy savings that increase with the size of the application. The expected energy savings, along with the possibility of using electricity from renewable sources to run HC processes, would also support the efforts of major industrial beer companies to achieve the Sustainable Development Goals set by the United Nations [52].

6. Patents

The results achieved in this study were straightforward consequences of applying the methods described in patent no. WO/2018/029715 [53].

Supplementary Materials

The following supporting information can be downloaded at https://www.mdpi.com/article/10.3390/beverages11010022/s1. Figure S1: Sensitivity analysis of model results for the concentration of SMM to the time increment based on Equation (1) and Equation (2), in the case of trial H5: (a) Δt = 1 min; (b) Δt = 3 min; (c) Δt = 6 min; (d) Δt = 12 min; (e) Δt = 24 min; and (f) Δt = 48 min; Figure S2: Relative DMS removal rate: (a) trial HC1; (b) trial HC2; (c) trial HC3; (d) trial HC4; (e) trial HC5; (f) trial HC6; and (g) trial STD1.

Author Contributions

Conceptualization, F.M.; methodology, F.M. and L.A.; validation, F.M.; formal analysis, F.M.; investigation, F.M. and L.A.; resources, F.M.; data curation, F.M. and L.A.; writing—original draft preparation, F.M.; writing—review and editing, F.M.; visualization, F.M. and L.A.; supervision, F.M.; project administration, F.M.; funding acquisition, F.M. All authors have read and agreed to the published version of the manuscript.

Funding

This research was funded by the company Cavitek S.r.l., grant number 0218915, 25 June 2024.

Institutional Review Board Statement

Not applicable.

Informed Consent Statement

Not applicable.

Data Availability Statement

The data set is available upon reasonable request from the corresponding author.

Acknowledgments

Maria Carmela Basile (CNR-UVR, Rome, Italy) is gratefully acknowledged for her continuous advice and support.

Conflicts of Interest

The authors were designated as inventors in patent no. WO/2018/029715, which was co-owned by the National Research Council of Italy (authors’ employer) until January 2021, when it was sold in its entirety to the company Cavitek Srl. Thus, the authors no longer have any financial interest related to patent no. WO/2018/029715. Company Cavitek S.r.l., the funder of this study, did not interfere with this study in any way, nor did they know any of the results or read any part of the manuscript before its submission.

References

  1. Scheuren, H.; Baldus, M.; Methner, F.-J.; Dillenburger, M. Evaporation Behaviour of DMS in an Aqueous Solution at Infinite Dilution—A Review. J. Inst. Brew. 2016, 122, 181–190. [Google Scholar] [CrossRef]
  2. Bamforth, C.W. Dimethyl Sulfide—Significance, Origins, and Control. J. Am. Soc. Brew. Chem. 2014, 72, 165–168. [Google Scholar] [CrossRef]
  3. Albanese, L.; Ciriminna, R.; Meneguzzo, F.; Pagliaro, M. Beer-Brewing Powered by Controlled Hydrodynamic Cavitation: Theory and Real-Scale Experiments. J. Clean. Prod. 2017, 142, 1457–1470. [Google Scholar] [CrossRef]
  4. Scheuren, H.; Tippmann, J.; Methner, F.J.; Sommer, K. Decomposition Kinetics of Dimethyl Sulphide. J. Inst. Brew. 2014, 120, 474–476. [Google Scholar] [CrossRef]
  5. Anness, B.J.; Bamforth, C.W. Dimethyl Sulphide—A Review. J. Inst. Brew. 1982, 88, 244–252. [Google Scholar] [CrossRef]
  6. Dickenson, C.J. Identification of the Dimethyl Sulphide Precursor in Malt. J. Inst. Brew. 1979, 85, 329–333. [Google Scholar] [CrossRef]
  7. Luo, D.; Tian, B.; Li, J.; Zhang, W.; Bi, S.; Fu, B.; Jing, Y. Mechanisms Underlying the Formation of Main Volatile Odor Sulfur Compounds in Foods during Thermal Processing. Compr. Rev. Food Sci. Food Saf. 2024, 23, e13389. [Google Scholar] [CrossRef] [PubMed]
  8. Kim, K.T.; Kim, J.S.; Kim, M.-H.; Park, J.-H.; Lee, J.-Y.; Lee, W.; Min, K.K.; Song, M.G.; Choi, C.-Y.; Kim, W.-S.; et al. Effect of Enhancers on in Vitro and in Vivo Skin Permeation and Deposition of S-Methyl-L-Methionine. Biomol. Ther. 2017, 25, 434–440. [Google Scholar] [CrossRef] [PubMed]
  9. Dickenson, C.J. The Relationship of Dimethyl Sulphide Levels in Malt, Wort and Beer. J. Inst. Brew. 1979, 85, 235–239. [Google Scholar] [CrossRef]
  10. Luo, D.; Pang, X.; Xu, X.; Bi, S.; Zhang, W.; Wu, J. Identification of Cooked Off-Flavor Components and Analysis of Their Formation Mechanisms in Melon Juice during Thermal Processing. J. Agric. Food Chem. 2018, 66, 5612–5620. [Google Scholar] [CrossRef] [PubMed]
  11. Stafisso, A.; Marconi, O.; Perretti, G.; Fantozzi, P. Determination of Dimethyl Sulphide in Brewery Samples by Headspace Gas Chromatography Mass Spectrometry (HS-GC/MS). Ital. J. Food Sci. 2011, 23, 19–27. [Google Scholar]
  12. Pires, E.; Brányik, T. Biochemistry of Beer Fermentation; Springer International Publishing AG: Cham, Switzerland, 2015; ISBN 978-3-319-15188-5. [Google Scholar]
  13. Luo, D.; Xu, X.; Bi, S.; Liu, Y.; Wu, J. Study of the Inhibitors of Cooked Off-Flavor Components in Heat-Treated XiZhou Melon Juice. J. Agric. Food Chem. 2019, 67, 10401–10411. [Google Scholar] [CrossRef] [PubMed]
  14. Ciriminna, R.; Albanese, L.; Di Stefano, V.; Delisi, R.; Avellone, G.; Meneguzzo, F.; Pagliaro, M. Beer Produced via Hydrodynamic Cavitation Retains Higher Amounts of Xanthohumol and Other Hops Prenylflavonoids. LWT 2018, 91, 160–167. [Google Scholar] [CrossRef]
  15. Albanese, L.; Ciriminna, R.; Meneguzzo, F.; Pagliaro, M. Gluten Reduction in Beer by Hydrodynamic Cavitation Assisted Brewing of Barley Malts. LWT 2017, 82, 342–353. [Google Scholar] [CrossRef]
  16. Ge, M.; Zhang, G.; Petkovšek, M.; Long, K.; Coutier-Delgosha, O. Intensity and Regimes Changing of Hydrodynamic Cavitation Considering Temperature Effects. J. Clean. Prod. 2022, 338, 130470. [Google Scholar] [CrossRef]
  17. Acciardo, E.; Tabasso, S.; Cravotto, G.; Bensaid, S. Process Intensification Strategies for Lignin Valorization. Chem. Eng. Process.-Process Intensif. 2022, 171, 108732. [Google Scholar] [CrossRef]
  18. Arya, S.S.; More, P.R.; Ladole, M.R.; Pegu, K.; Pandit, A.B. Non-Thermal, Energy Efficient Hydrodynamic Cavitation for Food Processing, Process Intensification and Extraction of Natural Bioactives: A Review. Ultrason. Sonochem 2023, 98, 106504. [Google Scholar] [CrossRef] [PubMed]
  19. Ciriminna, R.; Scurria, A.; Pagliaro, M. Natural Product Extraction via Hydrodynamic Cavitation. Sustain. Chem. Pharm. 2023, 33, 101083. [Google Scholar] [CrossRef]
  20. Zhu, X.; Tang, J.; Rahimi, M.; Halim, R.; Shen, H.; Tiwari, B.K.; Zhao, L. Chemistry of Hydrodynamic Cavitation Technology. In Chemistry of Thermal and Non-Thermal Food Processing Technologies; Brijesh, K.T., Mysore, B.L., Eds.; Academic Press: Cambridge, MA, USA, 2025; pp. 259–287. ISBN 9780443221828. [Google Scholar]
  21. Capocelli, M.; Musmarra, D.; Prisciandaro, M.; Lancia, A. Chemical Effect of Hydrodynamic Cavitation: Simulation and Experimental Comparison. AIChE J. 2014, 60, 2566–2572. [Google Scholar] [CrossRef]
  22. Bagal, M.V.; Gogate, P.R. Wastewater Treatment Using Hybrid Treatment Schemes Based on Cavitation and Fenton Chemistry: A Review. Ultrason. Sonochem 2014, 21, 1–14. [Google Scholar] [CrossRef]
  23. Wu, Y.; Xiang, C.; Mou, J.; Qian, H.; Duan, Z.; Zhang, S.; Zhou, P. Numerical Study of Rotating Cavitation and Pressure Pulsations in a Centrifugal Pump Impeller. AIP Adv. 2024, 14, 105024. [Google Scholar] [CrossRef]
  24. Shen, X.; Wu, H.; Yang, G.; Tang, R.; Chang, C.; Xu, B.; Lin, S.; Zhang, D. Experimental Study on the Classification and Evolution of the Tip Cavitation Morphology in Axial Waterjet Pumps with Two Different Blade Numbers. J. Mar. Sci. Eng. 2024, 12, 1898. [Google Scholar] [CrossRef]
  25. Sun, X.; Xu, H.; Xuan, X.; Manickam, S.; Boczkaj, G.; Wang, B. Assessing the Industrialization Progress of Hydrodynamic Cavitation Process Intensification Technology: A Review. Curr. Opin. Chem. Eng. 2024, 45, 101037. [Google Scholar] [CrossRef]
  26. Manoharan, D.; Radhakrishnan, M.; Tiwari, B.K. Cavitation Technologies for Extraction of High Value Ingredients from Renewable Biomass. TrAC—Trends Anal. Chem. 2024, 174, 117682. [Google Scholar] [CrossRef]
  27. Mathijssen, A.J.T.M.; Lisicki, M.; Prakash, V.N.; Mossige, E.J.L. Culinary Fluid Mechanics and Other Currents in Food Science. Rev. Mod. Phys. 2023, 95, 25004. [Google Scholar] [CrossRef]
  28. Iyer, G.; Pandit, A.B. Bridging Ingenuity and Utility in Cavitation─A Pioneer’s Predicament. Ind. Eng. Chem. Res. 2024, 63, 12265–12276. [Google Scholar] [CrossRef]
  29. EN 50470-1:2006. Electricity Metering Equipment (a.c.)—Part 1: General Requirements, Tests and Test Conditions—Metering Equipment (Class Indexes A, B and C). Available online: https://standards.iteh.ai/catalog/standards/clc/de32db50-81a9-4169-8710-6d969d07fe11/en-50470-1-2006 (accessed on 29 January 2025).
  30. EN 50470-3:2006. Electricity Metering Equipment (a.c.)—Part 1: General Requirements, Tests and Test Conditions—Metering Equipment (Class Indexes A, B and C). Available online: https://standards.iteh.ai/catalog/standards/clc/06ca5058-b825-47d1-bef4-85f652c79ee2/en-50470-3-2006 (accessed on 29 January 2025).
  31. General Requirements for the Competence of Testing and Calibration Laboratories (ISO/IEC 17025:2017). Available online: https://standards.iteh.ai/catalog/standards/cen/8284a587-bc96-4342-8585-8953be8f37a3/en-iso-iec-17025-2017 (accessed on 29 January 2025).
  32. ISO 9001:2015. Quality Management Systems — Requirements. Available online: https://standards.iteh.ai/catalog/standards/iso/9563cbca-c505-47c0-ba11-9c961f5a927e/iso-9001-2015 (accessed on 29 January 2025).
  33. Floridi, S.; Miniati, E.; Montanari, L.; Fantozzi, P. Carbohydrate Determination in Wort and Beer by HPLC-ELSD. Monatsschrift Fü Brauwiss. 2001, 54, 209–215. [Google Scholar]
  34. Rosendal, I.; Schmidt, F. The Alcohol Table for Beer Analysis and Polynomials for Alcohol and Extract. J. Inst. Brew. 1987, 93, 373–377. [Google Scholar] [CrossRef]
  35. 8.3—Extract of Wort. Available online: https://brewup.eu/ebc-analytica/wort/extract-of-wort/8.3 (accessed on 29 January 2025).
  36. 8.1—Sampling of Wort. Available online: https://brewup.eu/ebc-analytica/wort/sampling-of-wort/8.1 (accessed on 29 January 2025).
  37. 8.8—Bitterness of Wort. Available online: https://brewup.eu/ebc-analytica/wort/bitterness-of-wort/8.8 (accessed on 29 January 2025).
  38. 8.5—Colour of Wort: Spectrophotometric Method (IM). Available online: https://brewup.eu/ebc-analytica/wort/colour-of-wort-spectrophotometric-method-im/8.5 (accessed on 29 January 2025).
  39. 8.10.1—Free Amino Nitrogen in Wort by Spectrophotometry—Manual Method (IM). Available online: https://brewup.eu/ebc-analytica/wort/free-amino-nitrogen-in-wort-by-spectrophotometry-manual-method-im/8.10.1 (accessed on 29 January 2025).
  40. 8.4—Viscosity of Wort (IM). Available online: https://brewup.eu/ebc-analytica/wort/viscosity-of-wort-im/8.4 (accessed on 29 January 2025).
  41. 4.16.3—High Molecular Weight β-Glucan Content of Malt Wort: Spectrophotometric Method. Available online: https://brewup.eu/ebc-analytica/malt/high-molecular-weight-glucan-content-of-malt-wort-spectrophotometric-method/4.16.3 (accessed on 29 January 2025).
  42. Štěrba, J.; Punčochář, M.; Brányik, T. The Effect of Hydrodynamic Cavitation on Isomerization of Hop Alpha-Acids, Wort Quality and Energy Consumption during Wort Boiling. Food Bioprod. Process. 2024, 144, 214–219. [Google Scholar] [CrossRef]
  43. Ciriminna, R.; Albanese, L.; Meneguzzo, F.; Pagliaro, M. Wastewater Remediation via Controlled Hydrocavitation. Environ. Rev. 2017, 25, 175–183. [Google Scholar] [CrossRef]
  44. Carpenter, J.; Badve, M.; Rajoriya, S.; George, S.; Saharan, V.K.; Pandit, A.B. Hydrodynamic Cavitation: An Emerging Technology for the Intensification of Various Chemical and Physical Processes in a Chemical Process Industry. Rev. Chem. Eng. 2017, 33, 433–468. [Google Scholar] [CrossRef]
  45. Ding, W.; Hong, F.; Ying, D.; Huang, Y.; Nawaz Khan, S.; Jia, J. A Comprehensive Study on the Effects of Annular Protrusion for Cavitation Intensification in Venturi Tubes. Chem. Eng. J. 2024, 498, 155306. [Google Scholar] [CrossRef]
  46. Folden, T.S.; Aschmoneit, F.J. A Classification and Review of Cavitation Models with an Emphasis on Physical Aspects of Cavitation. Phys. Fluids 2023, 35, 81301. [Google Scholar] [CrossRef]
  47. Luo, J.; Fu, G.; Xu, W.; Zhai, Y.; Bai, L.; Li, J.; Qu, T. Experimental Study on Attenuation Effect of Liquid Viscosity on Shockwaves of Cavitation Bubbles Collapse. Ultrason. Sonochem 2024, 111, 107063. [Google Scholar] [CrossRef] [PubMed]
  48. Wang, D.; Zhao, W.G.; Han, X.D. Effects of Solid Particles at Varying Concentrations on Hydrodynamic Cavitation Evolution in a Nozzle. J. Appl. Fluid. Mech. 2025, 18, 485–503. [Google Scholar] [CrossRef]
  49. Li, Q.; Wang, J.; Liu, C. Beers. In Current Developments in Biotechnology and Bioengineering: Food and Beverages Industry; Pandey, A., Sanromán, M.Á., Du, G., Soccol, C.R., Dussap, C.-G., Eds.; Elsevier: Amsterdam, The Netherlands, 2017; pp. 305–351. ISBN 9780444636775. [Google Scholar]
  50. Mudura, E.; Muste, S. Improving the Hop Utilization in the Beer Biotechnology. Bull. UASVM 2008, 65, 281–286. [Google Scholar]
  51. Tienaho, J.; Liimatainen, J.; Myllymäki, L.; Kaipanen, K.; Tagliavento, L.; Ruuttunen, K.; Rudolfsson, M.; Karonen, M.; Marjomäki, V.; Hagerman, A.E.; et al. Pilot Scale Hydrodynamic Cavitation and Hot-Water Extraction of Norway Spruce Bark Yield Antimicrobial and Polyphenol-Rich Fractions. Sep. Purif. Technol. 2024, 360, 130925. [Google Scholar] [CrossRef]
  52. Wright, C.; Nyberg, D. Corporations and Climate Change: An Overview. WIREs Clim. Change 2024, 15, e919. [Google Scholar] [CrossRef]
  53. Meneguzzo, F.; Albanese, L. A Method and Relative Apparatus for the Production of Beer 2016. U.S. Patent 11,261,411, 18 May 2022. [Google Scholar]
Figure 1. HC device used in the experiments: (a) simplified layout; (b) picture of the actual equipment. The numbers indicate 1—centrifugal pump; 2—electronic control panel with inverter; 3—inline tank; 4—Venturi-shaped reactor; and 5—total discharge.
Beverages 11 00022 g001
Figure 2. The layout of two static circular Venturi-shaped HC reactors used in this study: (a) reactor with throat area of 22 mm; (b) reactor with throat area of 29.5 mm. All linear sizes are in mm. D is the throat diameter. The flow of the liquid mixture is from left to right.
Beverages 11 00022 g002
Figure 3. Process temperature, SMM, free and total DMS, along with a standard model for SMM and a reference model with SMM half-life reduced to by 70%, and a reference target concentration of 60 μg/L for total DMS, against process time: (a) trial STD1; (b) trial STD2.
Beverages 11 00022 g003
Figure 4. Process temperature, cumulated passes through the cavitation zones, levels of the cavitation number in the impeller (i) and Venturi reactor (v), SMM, free and total DMS, along with standard model for SMM and model with reduced SMM half-life in order to fit the SMM data, and a reference target concentration of 60 μg/L for total DMS, against process time: (a) trial HC1; (b) trial HC2; (c) trial HC3; (d) trial HC4; (e) trial HC5; (f) trial HC6.
Beverages 11 00022 g004
Table 1. Basic features of the brewer’s wort boiling trials. Initial levels of temperature, pH, viscosity, and Plato degree are shown.
Trial
ID
Wort Volume
(L)
Venturi aTemperature
(°C)
pHViscosity b
(mPa·s)
PlatoProcess Time
(Minutes)
STD15000/88.85.40 ± 0.08 13.2 ± 0.181
STD2180/75.05.35 ± 0.082.45 ± 0.0419.6 ± 0.187
HC1210V22.071.05.30 ± 0.08 13.0 ± 0.1149
HC2210/76.85.45 ± 0.081.82 ± 0.0413.8 ± 0.1155
HC3210V22.072.05.26 ± 0.08 13.7 ± 0.1210
HC4210V29.576.05.29 ± 0.08 17.8 ± 0.1181
HC5210V29.576.05.16 ± 0.082.10 ± 0.0417.0 ± 0.1202
HC6210V22.076.05.42 ± 0.082.60 ± 0.0420.8 ± 0.1183
a V22.0 = Venturi reactor with diameter of 22.0 mm; V29.5 = Venturi reactor with diameter of 29.5 mm. Venturi reactors, where indicated, were used for all or part of the trials. b Viscosity data were available for a subset of trials.
Table 2. Further wort properties for selected HC trials.
Test IDProcess Time
(Minutes)
Passes
Temperature
(°C)
pHIBU aHop Utilization
(%)
Color
(EBC)
HC20076.85.45 ± 0.083.0 ± 1.0 7.1 ± 1.9
9535994.05.38 ± 0.0825.0 ± 3.062 ± 279.3 ± 2.1
HC50076.05.16 ± 0.082.0 ± 0.1 7.4 ± 1.9
141 b39890.55.08 ± 0.0817.1 ± 0.142 ± 119.6 ± 2.2
20258394.85.04 ± 0.0818.0 ± 2.045 ± 1712.0 ± 2.4
HC60076.05.42 ± 0.087.0 ± 0.1 10.2 ± 2.2
16855294.55.26 ± 0.0823.0 ± 1.045 ± 1415.3 ± 2.8
a Hops were inserted at the temperature of 82 ± 2 °C. b Sample collected at the end of the rest phase, which followed the free heating phase.
Disclaimer/Publisher’s Note: The statements, opinions and data contained in all publications are solely those of the individual author(s) and contributor(s) and not of MDPI and/or the editor(s). MDPI and/or the editor(s) disclaim responsibility for any injury to people or property resulting from any ideas, methods, instructions or products referred to in the content.

