Adverse Hemodynamic Conditions Associated with Mechanical Heart Valve Leaflet Immobility


Abstract
1. Introduction
2. Materials and Methods
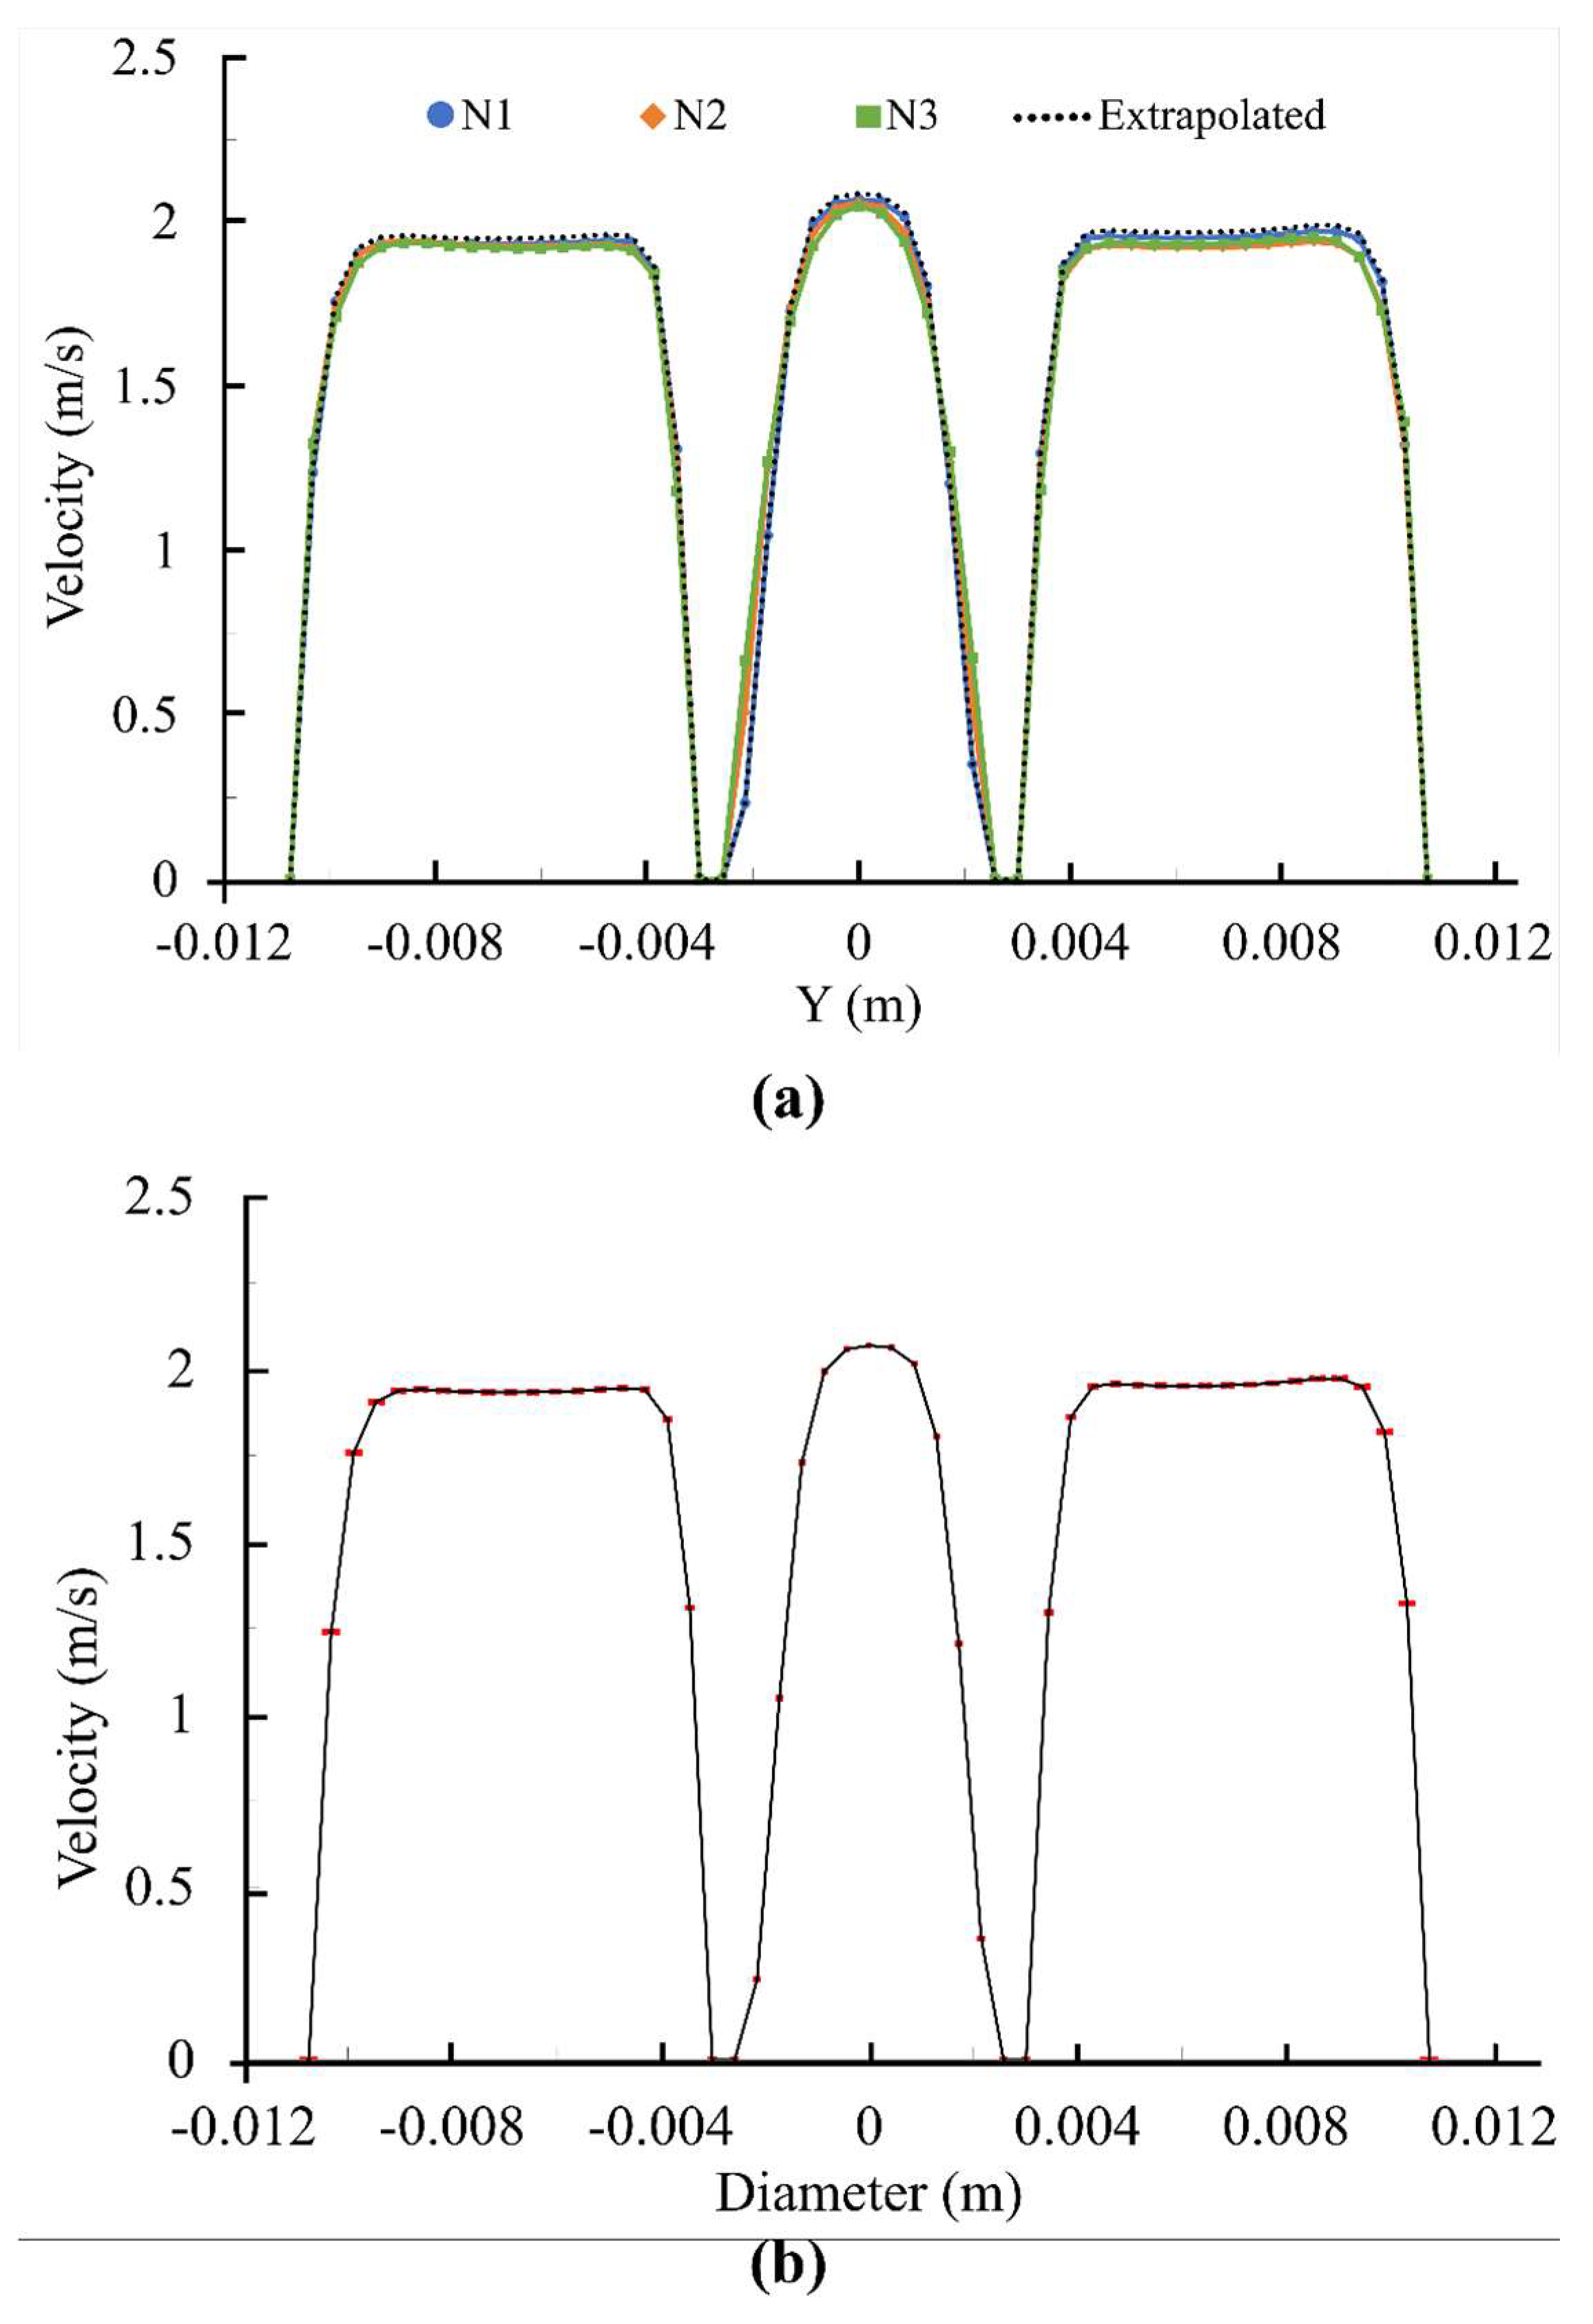
2.1. Numerical Uncertainty
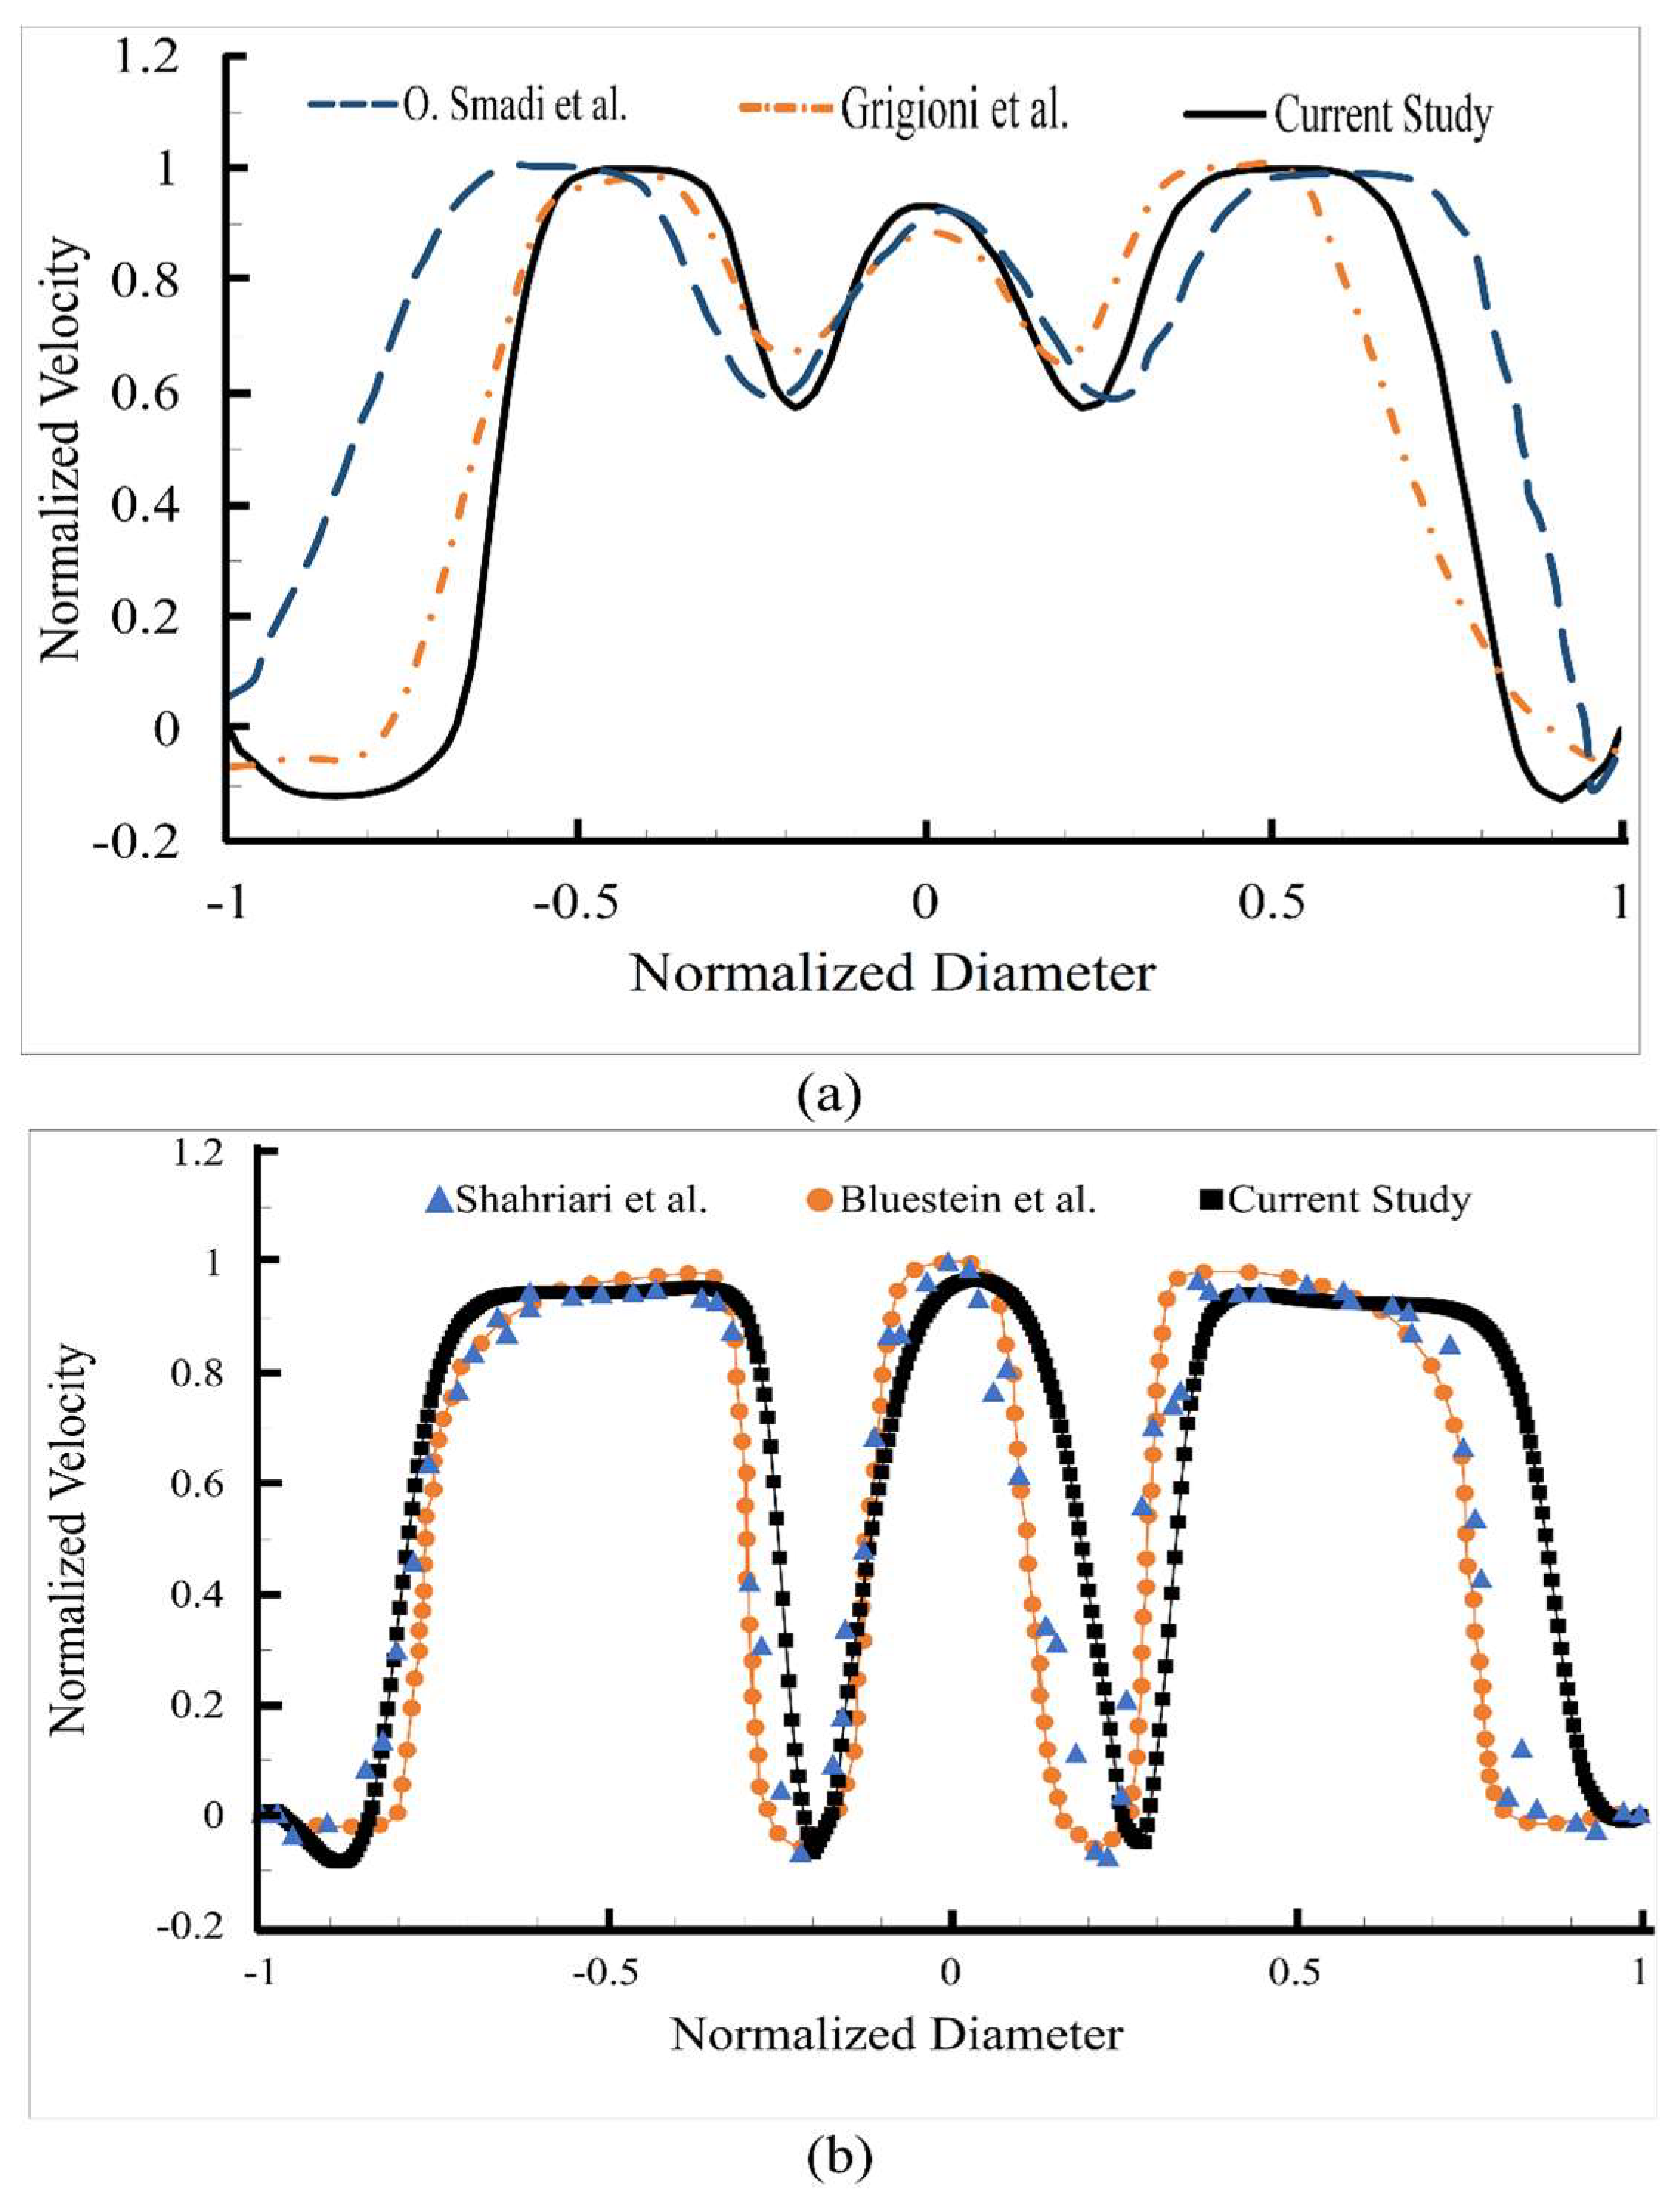
2.2. Validation
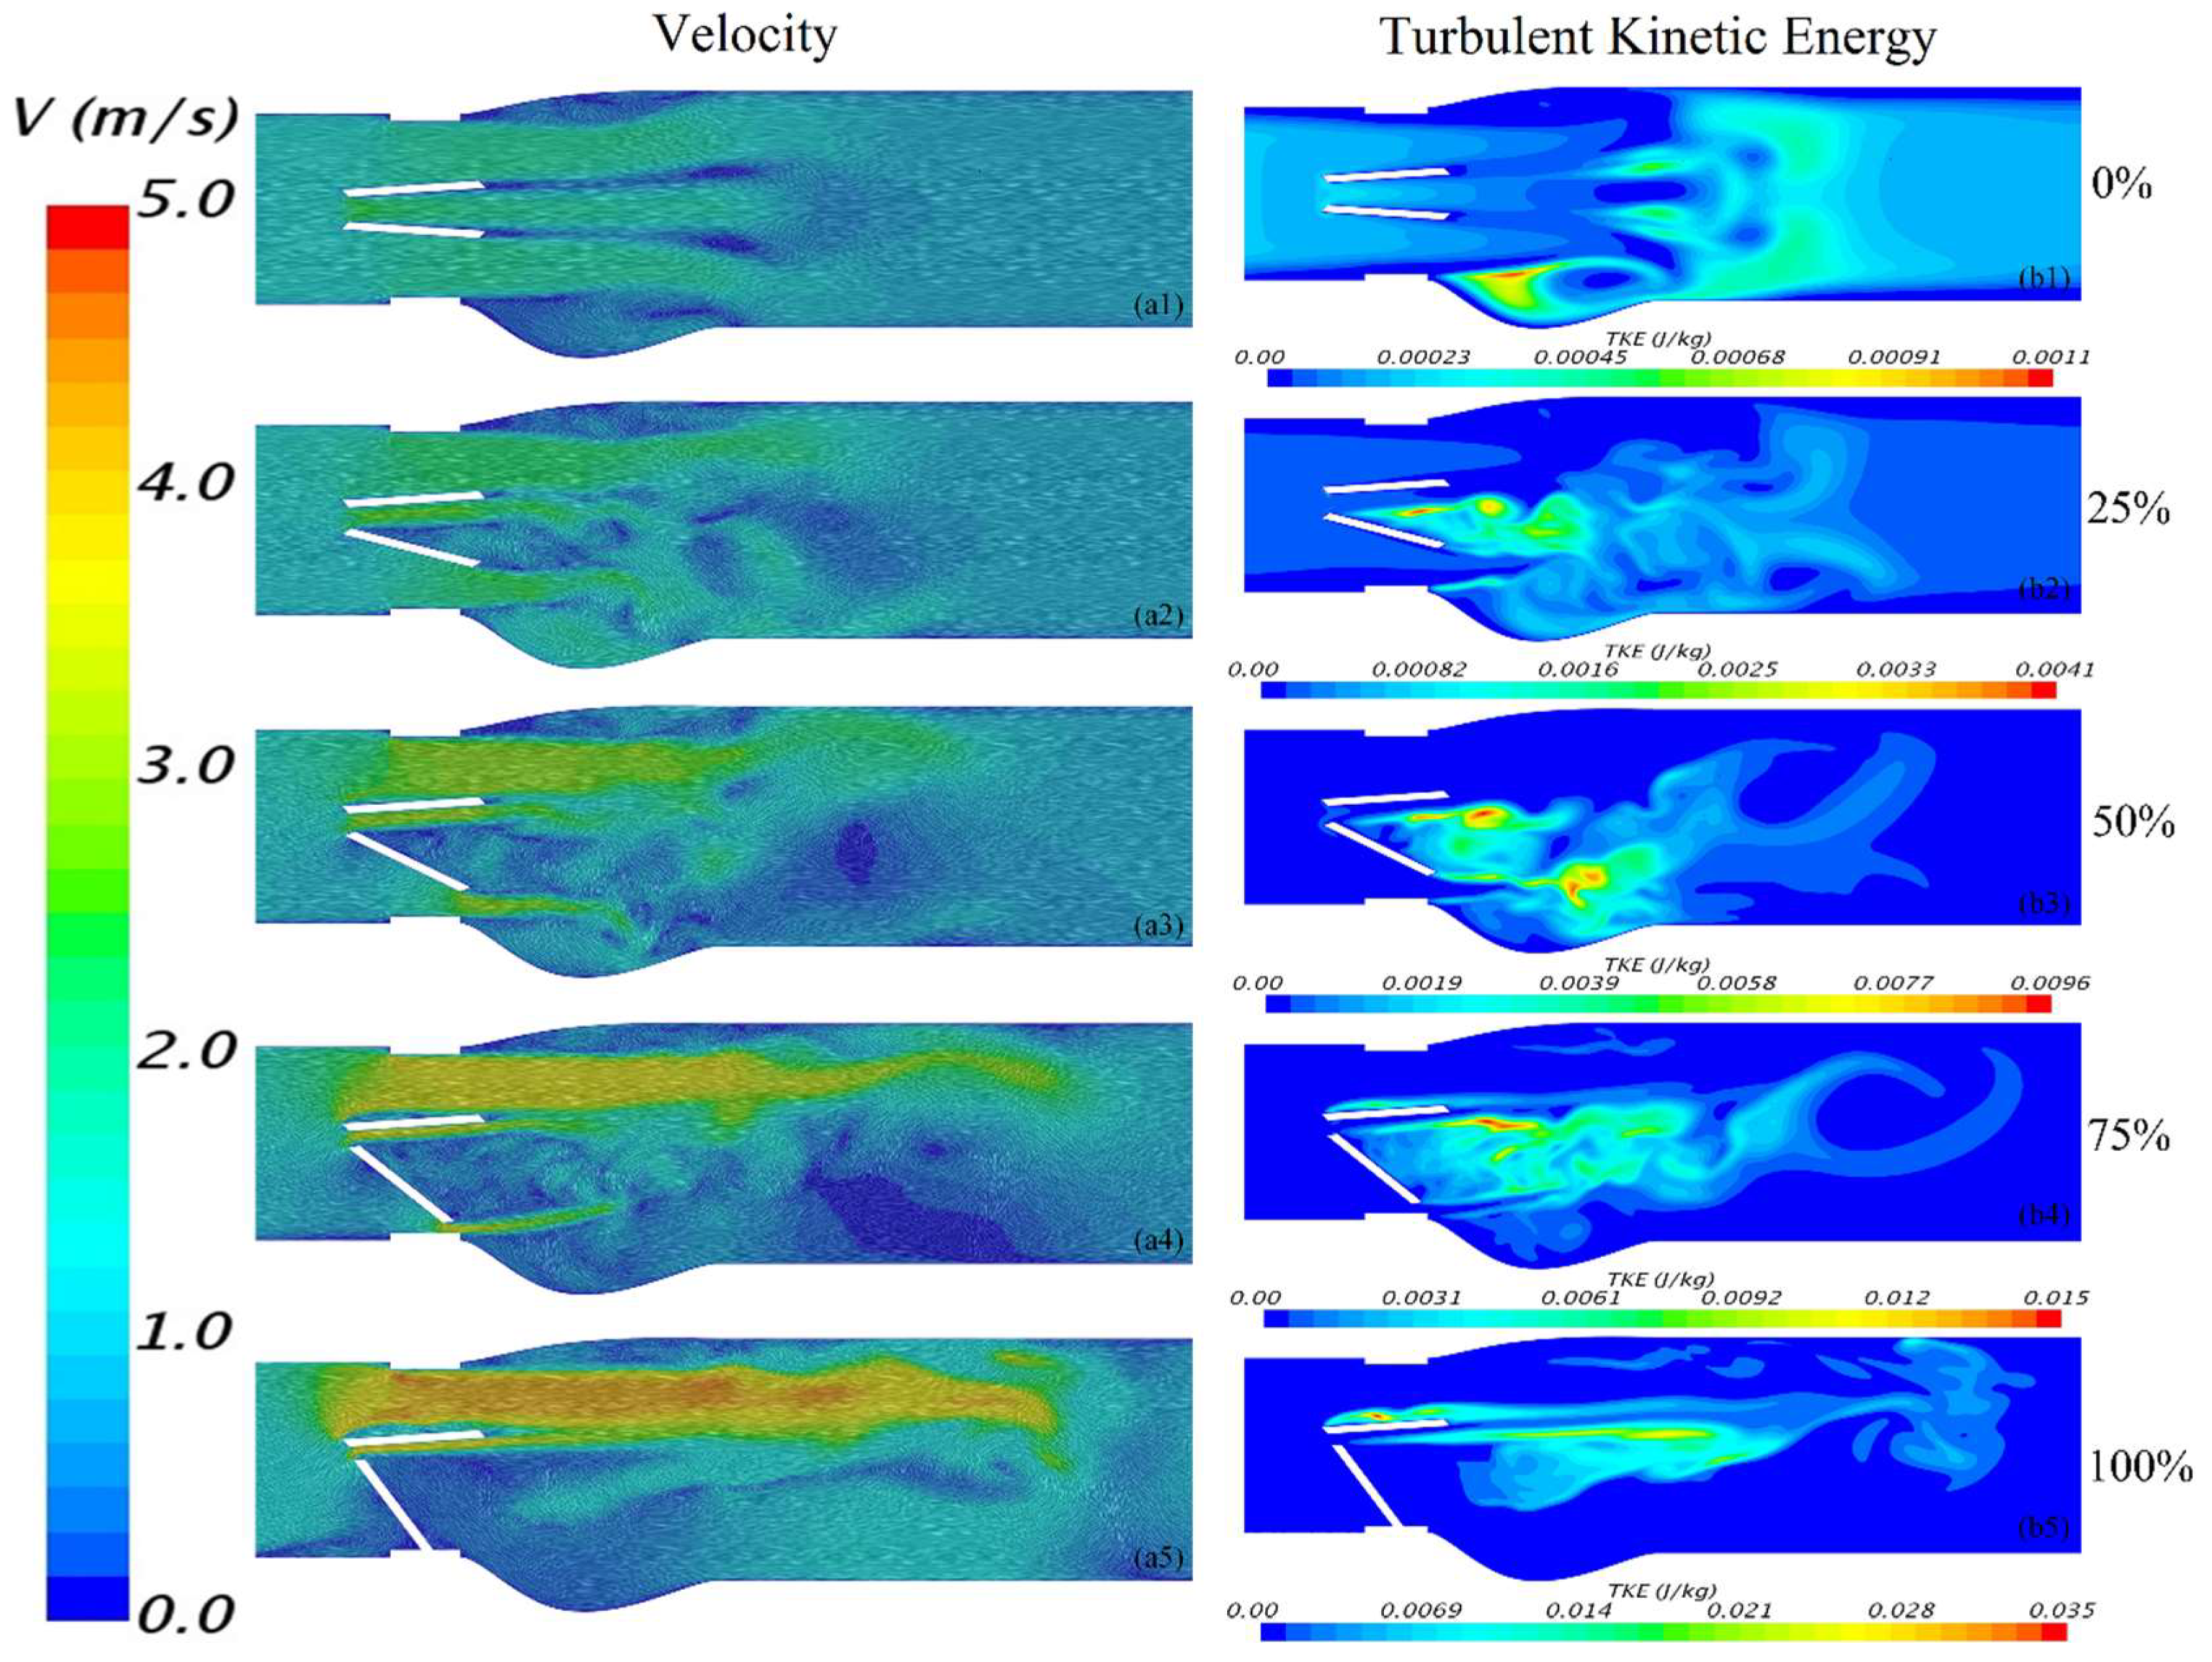
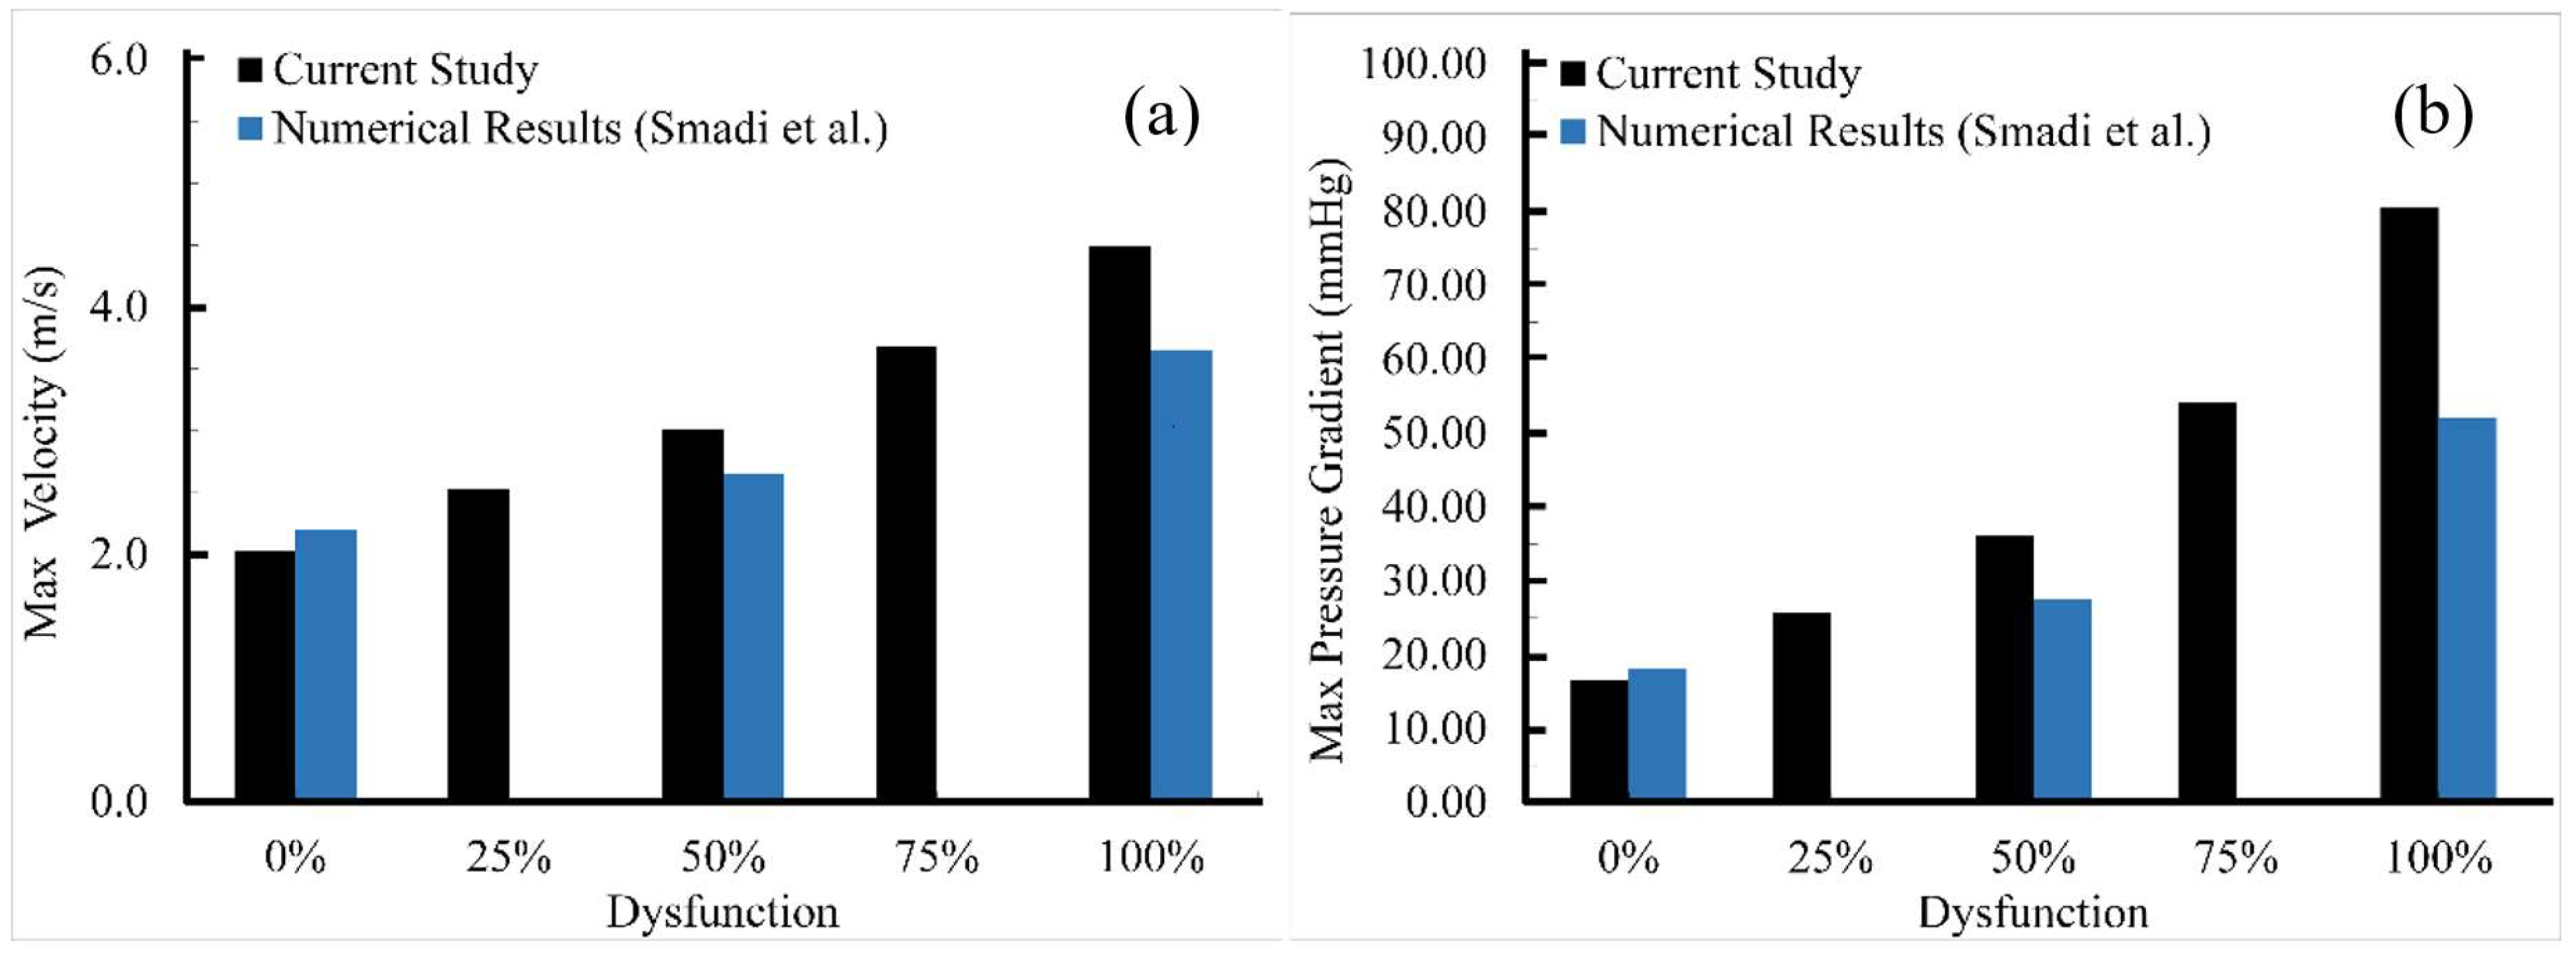
3. Results and Discussions
4. Conclusions
Author Contributions
Funding
Conflicts of Interest
References
- WHO Fact sheet: Cardiovascular Diseases (CVDs). Available online: http://www.who.int/mediacentre/factsheets/fs317/en/ (accessed on 16 September 2018).
- Smadi, O.; Hassan, I.; Pibarot, P.; Kadem, L. Numerical and experimental investigations of pulsatile blood flow pattern through a dysfunctional mechanical heart valve. J. Biomech. 2010, 43, 1565–1572. [Google Scholar] [CrossRef] [PubMed]
- Khalili, F.; Gamage, P.P.T.; Mansy, H.A. Prediction of Turbulent Shear Stresses through Dysfunctional Bileaflet Mechanical Heart Valves using Computational Fluid Dynamics. In Proceedings of the 3rd Thermal and Fluids Engineering Conference (TFEC), Fort Lauderdale, FL, USA, 4–7 March 2018; pp. 1–9. [Google Scholar]
- Emery, R.W.; Mettler, E.; Nicoloff, D.M. A new cardiac prosthesis: the St. Jude Medical cardiac valve: In vivo results. Circulation 1979, 60, 48–54. [Google Scholar] [CrossRef] [PubMed]
- Gott, V.L.; Alejo, D.E.; Cameron, D.E. Mechanical Heart Valves: 50 Years of Evolution. Ann. Thorac. Surg. 2003, 76, 2230–2239. [Google Scholar] [CrossRef]
- Deviri, E.; Sareli, P.; Wisenbaugh, T.; Cronje, S.L. Obstruction of mechanical heart valve prostheses: Clinical aspects and surgical management. J. Am. Coll. Cardiol. 1991, 17, 646–650. [Google Scholar] [CrossRef]
- Shahriari, S.; Maleki, H.; Hassan, I.; Kadem, L. Evaluation of shear stress accumulation on blood components in normal and dysfunctional bileaflet mechanical heart valves using smoothed particle hydrodynamics. J. Biomech. 2012, 45, 2637–2644. [Google Scholar] [CrossRef] [PubMed]
- Pibarot, P.; Dumesnil, J.G. Prosthetic heart valves: Selection of the optimal prosthesis and long-term management. Circulation 2009, 119, 1034–1048. [Google Scholar] [CrossRef] [PubMed]
- Vesey, J.M.; Otto, C.M. Complications of prosthetic heart valves. Curr. Cardiol. Rep. 2004, 6, 106–111. [Google Scholar] [CrossRef] [PubMed]
- Montorsi, P.; Cavoretto, D.; Alimento, M.; Muratori, M.; Pepi, M. Prosthetic mitral valve thrombosis: Can fluoroscopy predict the efficacy of thrombolytic treatment? Circulation 2003, 108, II79–II84. [Google Scholar] [CrossRef] [PubMed]
- Fernandes, V.; Olmos, L.; Nagueh, S.F.; Quiñones, M.A.; Zoghbi, W.A. Peak early diastolic velocity rather than pressure half-time is the best index of mechanical prosthetic mitral valve function. Am. J. Cardiol. 2002, 89, 704–710. [Google Scholar] [CrossRef]
- Baumgartner, H.; Schima, H.; Tulzer, G.; Kühn, P. Effect of stenosis geometry on the Doppler-catheter gradient relation in vitro: A manifestation of pressure recovery. J. Am. Coll. Cardiol. 1993, 21, 1018–1025. [Google Scholar] [CrossRef]
- Smadi, O.; Fenech, M.; Hassan, I.; Kadem, L. Flow through a defective mechanical heart valve: A steady flow analysis. Med. Eng. Phys. 2009, 31, 295–305. [Google Scholar] [CrossRef] [PubMed]
- Kinsley, R.H.; Antunes, M.J.; Colsen, P.R. Jude Medical valve replacement. An evaluation of valve performance. J. Thorac. Cardiovasc. Surg. 1986, 92, 349–360. [Google Scholar] [PubMed]
- Venugopal, P.; Kaul, U.; Iyer, K.S.; Rao, I.M.; Balram, A.; Das, B.; Sampathkumar, A.; Mukherjee, S.; Rajani, M.; Wasir, H.S. Fate of thrombectomized Björk-Shiley valves. A long-term cinefluoroscopic, echocardiographic, and hemodynamic evaluation. J. Thorac. Cardiovasc. Surg. 1986, 91, 168–173. [Google Scholar] [PubMed]
- Kurzrok, S.; Singh, A.K.; Most, A.S.; Williams, D.O. Thrombolytic therapy for prosthetic cardiac valve thrombosis. J. Am. Coll. Cardiol. 1987, 9, 592–598. [Google Scholar] [CrossRef]
- Yoganathan, A.P.; He, Z.; Casey Jones, S. Fluid Mechanics of Heart Valves. Annu. Rev. Biomed. Eng. 2004, 6, 331–362. [Google Scholar] [CrossRef] [PubMed]
- Klusak, E.; Bellofiore, A.; Loughnane, S.; Quinlan, N.J. High-Resolution Measurements of Velocity and Shear Stress in Leakage Jets From Bileaflet Mechanical Heart Valve Hinge Models. J. Biomech. Eng. 2015, 137, 111008. [Google Scholar] [CrossRef] [PubMed]
- Ellis, J.T.; Travis, B.R.; Yoganathan, A.P. An In Vitro Study of the Hinge and Near-Field Forward Flow Dynamics of the St. Jude Medical® RegentTM Bileaflet Mechanical Heart Valve. Ann. Biomed. Eng. 2000, 28, 524–532. [Google Scholar] [CrossRef] [PubMed]
- Khalili, F.; Mansy, H.A. Blood Flow through a Dysfunctional Mechanical Heart Valve. In Proceedings of the 38th Annual International Conference of the IEEE Engineering in Medicine and Biology Societ, Orlando, FL, USA, 17–20 August 2016. [Google Scholar]
- Khalili, F.; Gamage, P.P.T.; Mansy, H.A. Hemodynamics of a Bileaflet Mechanical Heart Valve with Different Levels of Dysfunction. J. Appl. Biotechnol. Bioeng. 2017, 2. [Google Scholar] [CrossRef]
- Min Yun, B.; Aidun, C.K.; Yoganathan, A.P. Blood Damage Through a Bileaflet Mechanical Heart Valve: A Quantitative Computational Study Using a Multiscale Suspension Flow Solver. J. Biomech. Eng. 2014, 136, 101009. [Google Scholar] [CrossRef] [PubMed]
- Dumont, K.; Vierendeels, J.; Kaminsky, R.; Van Nooten, G.; Verdonck, P.; Bluestein, D. Comparison of the hemodynamic and thrombogenic performance of two bileaflet mechanical heart valves using a CFD/FSI model. J. Biomech. Eng. 2007, 129, 558–565. [Google Scholar] [PubMed]
- Khalili, F. Fluid Dynamics Modeling and Sound Analysis of a Bileaflet Mechanical Heart Valve. Ph.D. Thesis, University of Central Florida, Orlando, FL, USA, May 2018. [Google Scholar]
- Sallam, A.M.; Hwang, N.H. Human red blood cell hemolysis in a turbulent shear flow: Contribution of Reynolds shear stresses. Biorheology 1984, 21, 783–797. [Google Scholar] [CrossRef] [PubMed]
- Lu, P.C.; Lai, H.C.; Liu, J.S. A reevaluation and discussion on the threshold limit for hemolysis in a turbulent shear flow. J. Biomech. 2001, 34, 1361–1364. [Google Scholar] [CrossRef]
- Woo, Y.-R.; Yoganathan, A.P. In vitro pulsatile flow velocity and shear stress measurements in the vicinity of mechanical mitral heart valve prostheses. J. Biomech. 1986, 19, 39–51. [Google Scholar] [CrossRef]
- Hasenkam, J.M. Studies of velocity fields and turbulence downstream of aortic valve prostheses in vitro and in vivo. Dan. Med. Bull. 1990, 37, 235. [Google Scholar] [PubMed]
- Chandran, K.B. Role of Computational Simulations in Heart Valve Dynamics and Design of Valvular Prostheses. Cardiovasc. Eng. Technol. 2010, 1, 18–38. [Google Scholar] [CrossRef] [PubMed]
- Kelly, S.G.D. Computational fluid dynamics insights in the design of mechanical heart valves. Artif. Organs 2002, 26, 608–613. [Google Scholar] [CrossRef] [PubMed]
- Thibotuwawa, P.G.; Khalili, F.; Azad, M.; Mansy, H. Modeling Inspiratory Flow in a Porcine Lung Airway. J. Biomech. Eng. 2017. [Google Scholar] [CrossRef]
- Khalili, F.; Gamage, P.P.T.; Mansy, H.A. The Influence of the Aortic Root Geometry on Flow Characteristics of a Bileaflet Mechanical Heart Valve. arXiv, 2018; arXiv:1803.03362. [Google Scholar]
- Khalili, F.; Gamage, P.P.T.; Mansy, H.A. Verification of Turbulence Models for Flow in a Constricted Pipe at Low Reynolds Number. In Proceedings of the 3rd Thermal and Fluids Engineering Conference (TFEC), Fort Lauderdale, FL, USA, 4–7 March 2018; pp. 1–10. [Google Scholar]
- Tiari, S. An Experimental Study of Blood Flow in a Model of Coronary Artery with Single and Double Stenoses. In Proceedings of the 2011 18th Iranian Conference of Biomedical Engineering (ICBME), Tehran, Iran, 14–16 December 2011; pp. 33–36. [Google Scholar]
- Taebi, A. Characterization, Classification, and Genesis of Seismocardiographic Signals, University of Central Florida. Ph.D. Thesis, University of Central Florida, Orlando, FL, USA, May 2018. [Google Scholar]
- Taebi, A.; Mansy, H.A. Time-Frequency Distribution of Seismocardiographic Signals: A Comparative Study. Bioengineering 2017, 4, 32. [Google Scholar] [CrossRef] [PubMed]
- Taebi, A.; Mansy, H.A. Analysis of Seismocardiographic Signals Using Polynomial Chirplet Transform and Smoothed Pseudo Wigner-Ville Distribution. In Proceedings of the 2017 IEEE Signal Processing in Medicine and Biology Symposium (SPMB), Philadelphia, PA, USA, 2 December 2017; IEEE: Philadelphia, PA, USA, 2017; pp. 1–6. [Google Scholar]
- Taebi, A.; Solar, B.E.; Mansy, H.A. An Adaptive Feature Extraction Algorithm for Classification of Seismocardiographic Signals. In Proceedings of the IEEE SoutheastCon 2018, Tampa Bay Area, FL, USA, 19–22 April 2018; IEEE: Philadelphia, PA, USA, 2018; pp. 1–5. [Google Scholar]
- Taebi, A.; Mansy, H.A. Grouping Similar Seismocardiographic Signals Using Respiratory Information. In Proceedings of the 2017 IEEE Signal Processing in Medicine and Biology Symposium (SPMB), Philadelphia, PA, USA, 2 December 2017; IEEE: Philadelphia, PA, USA, 2017; pp. 1–6. [Google Scholar]
- Khalili, F.; Gamage, P.P.T.; Mansy, H.A. A coupled CFD-FEA study of sound generated in a stenosed artery and transmitted through tissue layers. In Proceedings of the IEEE SoutheastCon 2018, Tampa Bay Area, FL, USA, 19–22 April 2018; IEEE: St. Petersburg, Russia, 2018. [Google Scholar]
- Fontaine, A.A.; Ellis, J.T.; Healy, T.M.; Hopmeyer, J.; Yoganathan, A.P. Identification of peak stresses in cardiac prostheses. A comparison of two-dimensional versus three-dimensional principal stress analyses. ASAIO J. 1996, 42, 154–163. [Google Scholar] [CrossRef] [PubMed]
- Dasi, L.P.; Ge, L.; Simon, A.H.; Sotiropoulos, F.; Yoganathan, P.A. Vorticity dynamics of a bileaflet mechanical heart valve in an axisymmetric aorta. Phys. Fluids 2007, 19. [Google Scholar] [CrossRef]
- Bluestein, D.; Rambod, E.; Gharib, M. Vortex shedding as a mechanism for free emboli formation in mechanical heart valves. J. Biomech. Eng. 2000, 122, 125–134. [Google Scholar] [CrossRef] [PubMed]
- Ge, L.; Dasi, L.P.; Sotiropoulos, F.; Yoganathan, A.P. Characterization of hemodynamic forces induced by mechanical heart valves: Reynolds vs. viscous stresses. Ann. Biomed. Eng. 2008, 36, 276–297. [Google Scholar] [CrossRef] [PubMed]
- Barannyk, O.; Oshkai, P. The Influence of the Aortic Root Geometry on Flow Characteristics of a Prosthetic Heart Valve. J. Biomech. Eng. 2015, 137, 51005. [Google Scholar] [CrossRef] [PubMed]
- Bruss, K.H.; Reul, H.; Van Gilse, J.; Knott, E. Pressure drop and velocity fields at four mechanical heart valve prostheses. Life Support Syst. 1983, 1, 3–22. [Google Scholar] [PubMed]
- Hung, T.C.; Hochmuth, R.M.; Joist, J.H.; Sutera, S.P. Shear-induced aggregation and lysis of platelets. ASAIO J. 1976, 22, 285–290. [Google Scholar]
- Bluestein, D.; Einav, S.; Hwang, N.H.C. A squeeze flow phenomenon at the closing of a bileaflet mechanical heart valve prosthesis. J. Biomech. 1994, 27, 1369–1378. [Google Scholar] [CrossRef]
- Fatemi, R.; Chandran, K.B. An in vitro comparative study of St. Jude Medical and Edwards-Duromedics bileaflet valves using laser anemometry. J. Biomech. Eng. 1989, 111, 298–302. [Google Scholar] [CrossRef] [PubMed]
- Chandran, K.B.; Yearwood, T.L. Experimental study of physiological pulsatile flow in a curved tube. J. Fluid Mech. 1981, 111, 59–85. [Google Scholar] [CrossRef]
- De Vita, F.; de Tullio, M.D.; Verzicco, R. Numerical simulation of the non-Newtonian blood flow through a mechanical aortic valve: Non-Newtonian blood flow in the aortic root. Theor. Comput. Fluid Dyn. 2016, 30, 129–138. [Google Scholar] [CrossRef]
- Reul, H.; Vahlbruch, A.; Giersiepen, M.; Schmitz-Rode, T.; Hirtz, V.; Effert, S. The geometry of the aortic root in health, at valve disease and after valve replacement. J. Biomech. 1990, 23. [Google Scholar] [CrossRef]
- Grigioni, M.; Daniele, C.; D’Avenio, G.; Barbaro, V. The influence of the leaflets’ curvature on the flow field in two bileaflet prosthetic heart valves. J. Biomech. 2001, 34, 613–621. [Google Scholar] [CrossRef]
- Wilcox, D.C. Turbulence Modeling for CFD (Second Edition); Springer: New York, NY, USA, 1998; ISBN 9781928729082. [Google Scholar]
- Nobili, M.; Morbiducci, U.; Ponzini, R.; Del Gaudio, C.; Balducci, A.; Grigioni, M.; Maria Montevecchi, F.; Redaelli, A. Numerical simulation of the dynamics of a bileaflet prosthetic heart valve using a fluid-structure interaction approach. J. Biomech. 2008, 41, 2539–2550. [Google Scholar] [CrossRef] [PubMed]
- Celik, I.B.; Ghia, U.; Roache, P.J. Procedure for estimation and reporting of uncertainty due to discretization in {CFD} applications. J. Fluids Eng.-Trans. ASME 2008, 130. [Google Scholar]
- Popov, E.P. Engineering Mechanics of Solids; Prentice Hall: Englewood Cliffs, NJ, USA, 1990. [Google Scholar]
- Sutera, S.P.; Mehrjardi, M.H. Deformation and fragmentation of human red blood cells in turbulent shear flow. Biophys. J. 1975, 15, 1–10. [Google Scholar] [CrossRef]
- Blackshear, P.L. Hemolysis at prosthetic surfaces. Chem. biosurf. 1972, 2, 523–561. [Google Scholar]
- Mohandas, N.; Hochmuth, R.M.; Spaeth, E.E. Adhesion of red cells to foreign surfaces in the presence of flow. J. Biomed. Mater. Res. 1974, 8, 119–136. [Google Scholar] [CrossRef] [PubMed]
- Bark, D.L.; Vahabi, H.; Bui, H.; Movafaghi, S.; Moore, B.; Kota, A.K.; Popat, K.; Dasi, L.P. Hemodynamic Performance and Thrombogenic Properties of a Superhydrophobic Bileaflet Mechanical Heart Valve. Ann. Biomed. Eng. 2017, 45, 452–463. [Google Scholar] [CrossRef] [PubMed]
- King, M.J.; David, T.; Fisher, J. Three-dimensional study of the effect of two leaflet opening angles on the time-dependent flow through a bileaflet mechanical heart valve. Med. Eng. Phys. 1997, 19, 235–241. [Google Scholar] [CrossRef]


| φ = Maximum Velocity in the Entire Field (m/s) | |||
|---|---|---|---|
| N1; N2; N3 6,529,062; 2,598,513; 1,390,150 | |||
| r21 (Refinement factor of N2/N1) | 1.35 | e21a | 0.11% |
| r32 (Refinement factor of N3/N2) | 1.32 | e21ext | 0.11% |
| φ1 | 2.523 | GCI21fine | 0.14% |
| φ2 | 2.521 | φ32ext | 2.515 |
| φ3 | 2.526 | e32a | 0.21% |
| P | 2.289 | e32ext | 0.24% |
| φ21ext | 2.526 | GCI32course | 0.29% |
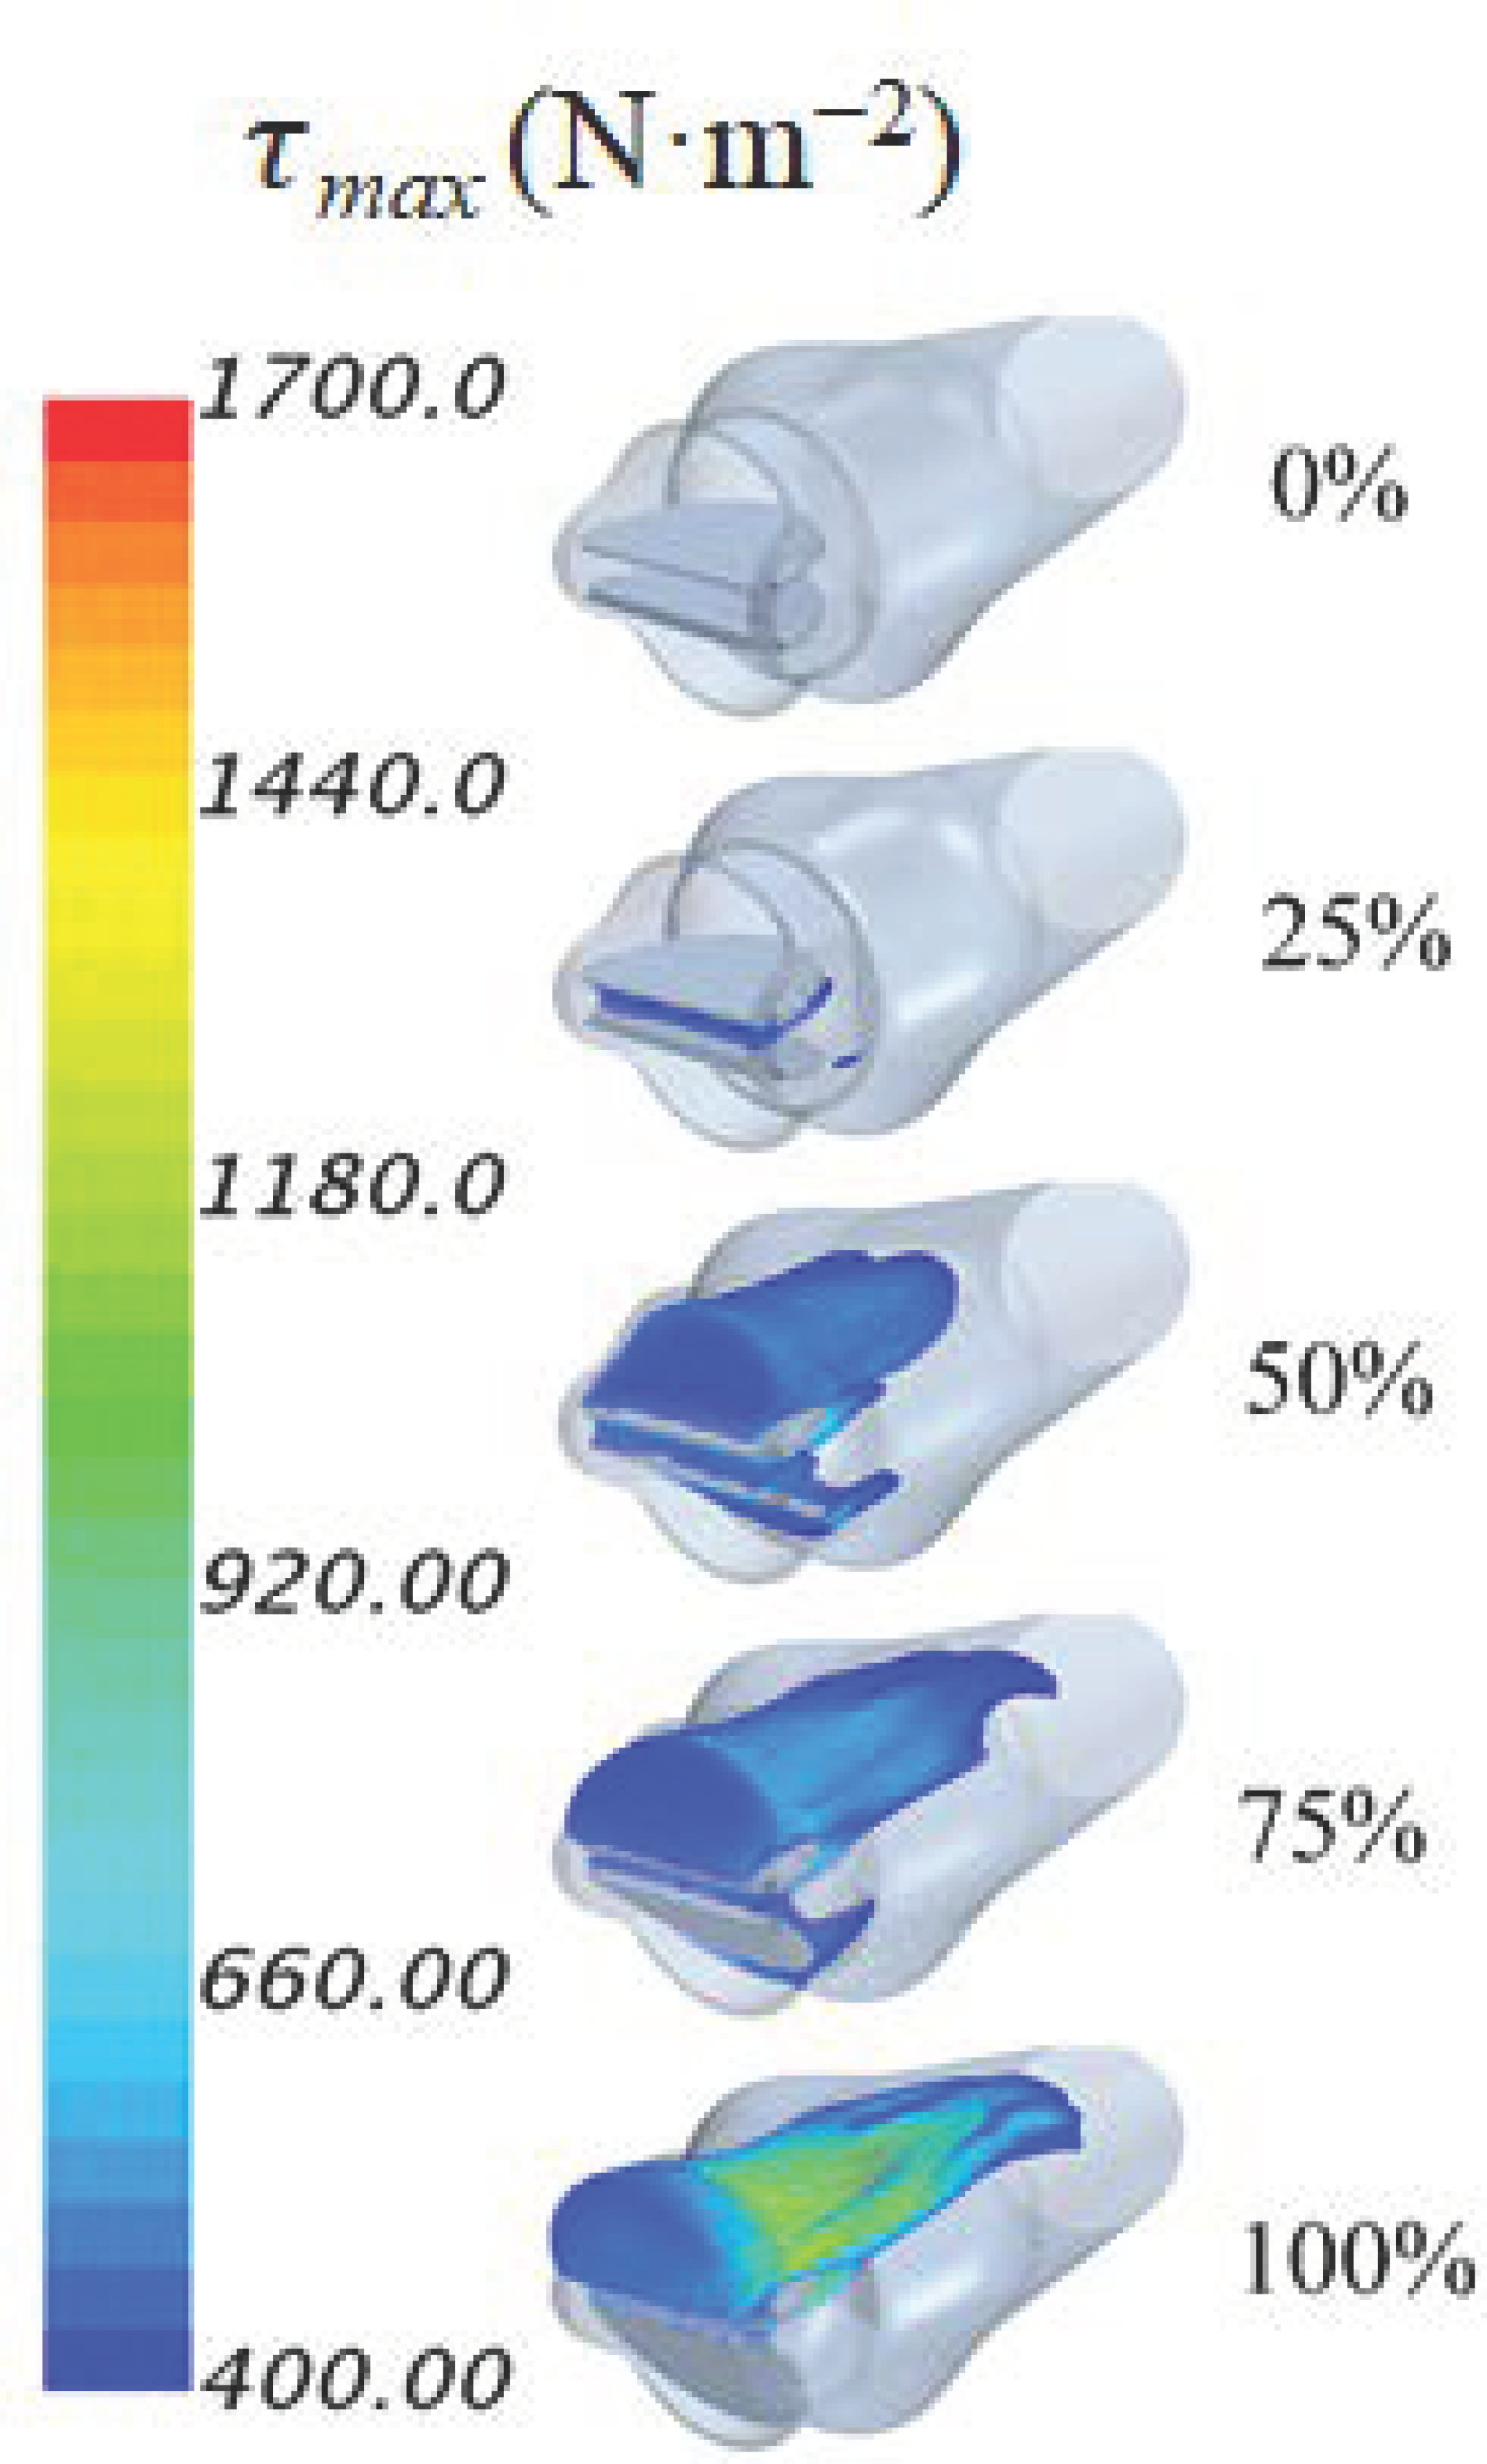
| Dysfunction | Max. Principal Shear Stress (N·m−2) | Time (s) |
|---|---|---|
| 0% | 440 | 0.102 |
| 25% | 534 | 0.103 |
| 50% | 832 | 0.112 |
| 75% | 1276 | 0.112 |
| 100% | 1972 | 0.119 |
© 2018 by the authors. Licensee MDPI, Basel, Switzerland. This article is an open access article distributed under the terms and conditions of the Creative Commons Attribution (CC BY) license (http://creativecommons.org/licenses/by/4.0/).
Share and Cite
Khalili, F.; Gamage, P.P.T.; Sandler, R.H.; Mansy, H.A. Adverse Hemodynamic Conditions Associated with Mechanical Heart Valve Leaflet Immobility. Bioengineering 2018, 5, 74. https://doi.org/10.3390/bioengineering5030074
Khalili F, Gamage PPT, Sandler RH, Mansy HA. Adverse Hemodynamic Conditions Associated with Mechanical Heart Valve Leaflet Immobility. Bioengineering. 2018; 5(3):74. https://doi.org/10.3390/bioengineering5030074
Chicago/Turabian StyleKhalili, Fardin, Peshala P. T. Gamage, Richard H. Sandler, and Hansen A. Mansy. 2018. "Adverse Hemodynamic Conditions Associated with Mechanical Heart Valve Leaflet Immobility" Bioengineering 5, no. 3: 74. https://doi.org/10.3390/bioengineering5030074
APA StyleKhalili, F., Gamage, P. P. T., Sandler, R. H., & Mansy, H. A. (2018). Adverse Hemodynamic Conditions Associated with Mechanical Heart Valve Leaflet Immobility. Bioengineering, 5(3), 74. https://doi.org/10.3390/bioengineering5030074