Article

Identification of Calculous Pyonephrosis by CT-Based Radiomics and Deep Learning

1
Department of Radiology, Tongji Hospital, Tongji Medical College, Huazhong University of Science and Technology, Wuhan 430030, China
2
Bayer Healthcare, Wuhan 430000, China
3
Department of Urology, Tongji Hospital, Tongji Medical College, Huazhong University of Science and Technology, Wuhan 430030, China
4
Department of Oncology, Tongji Hospital, Tongji Medical College, Huazhong University of Science and Technology, Wuhan 430030, China
*
Authors to whom correspondence should be addressed.
These authors contributed equally to this work.
Bioengineering 2024, 11(7), 662; https://doi.org/10.3390/bioengineering11070662
Submission received: 6 June 2024 / Revised: 18 June 2024 / Accepted: 22 June 2024 / Published: 28 June 2024
(This article belongs to the Section Biomedical Engineering and Biomaterials)

Abstract

:
Urgent detection of calculous pyonephrosis is crucial for surgical planning and preventing severe outcomes. This study aims to evaluate the performance of computed tomography (CT)-based radiomics and a three-dimensional convolutional neural network (3D-CNN) model, integrated with independent clinical factors, to identify patients with calculous pyonephrosis. We recruited 182 patients receiving either percutaneous nephrostomy tube placement or percutaneous nephrolithotomy for calculous hydronephrosis or pyonephrosis. The regions of interest were manually delineated on plain CT images and the CT attenuation value (HU) was measured. Radiomics analysis was performed using least absolute shrinkage and selection operator (LASSO). A 3D-CNN model was also developed. The better-performing machine-learning model was combined with independent clinical factors to build a comprehensive clinical machine-learning model. The performance of these models was assessed using receiver operating characteristic analysis and decision curve analysis. Fever, blood neutrophils, and urine leukocytes were independent risk factors for pyonephrosis. The radiomics model showed higher area under the curve (AUC) than the 3D-CNN model and HU (0.876 vs. 0.599, 0.578; p = 0.003, 0.002) in the testing cohort. The clinical machine-learning model surpassed the clinical model in both the training (0.975 vs. 0.904, p = 0.019) and testing (0.967 vs. 0.889, p = 0.045) cohorts.

Graphical Abstract

1. Introduction

Pyonephrosis is regarded as a urological emergency characterized by gross accumulation of pus within the renal collecting system and suppurative destruction of renal parenchyma, which may rapidly develop into renal failure, urosepsis, and uroseptic shock [1,2]. This condition differs from calculous hydronephrosis in that it typically necessitates immediate relief of obstruction, either through nephrostomy or ureteral stent placement, before proceeding with the appropriate surgical technique for stone removal [3,4]. In addition, for cases of occult pyelonephritis without obvious preoperative symptoms, if discovered during surgery, the procedure should be terminated immediately, or as soon as possible, to prevent serious postoperative infection complications. Thus, early or preoperative identification of hydronephrosis and pyonephrosis has critical clinical value, including devising a surgical strategy and preventing life-threatening outcomes.
At present, the identification of pyonephrosis primarily relies on clinical symptoms and urinary assessments for pathogens and white blood cells [5]. However, a considerable number of patients with pyonephrosis present a lack of typical symptoms like high fever, chills, and flank pain due to the abuse of broad-spectrum antibiotics, a decrease in immunity, or recurrent chronic attack, which makes the diagnosis of pyonephrosis a tricky problem [6,7]. Furthermore, a study has found that urine leukocyte counts in some patients with pyonephrosis were only slightly increased or even normal and more than 50% of patients exhibited negative in the examination of urine culture [8], which denotes that urinary evaluation sometimes could not effectively reflect the status of intrarenal infection and accurately differentiate pyonephrosis from uninfected hydronephrosis.
Ultrasound is easily influenced by the patient’s intestinal gas and the physician’s subjective experience, while magnetic resonance imaging has a low sensitivity for detecting stones, longer scanning times, and higher costs. Thus, non-contrast computed tomography (CT) is considered the preferred method for assessing hydronephrosis with the capability to display the degree and underlying cause [9,10,11]. Previous studies have also demonstrated that CT attenuation values (Hounsfield Unit—HU) of the fluid in the dilated renal collecting system may be an effective tool for differentiating calculous pyonephrosis from uninfected hydronephrosis [12,13,14]. However, with the development of precision medicine, more and more studies focus on the deep-level quantitative features in medical images rather than simple grayscale differences [15,16]. Radiomics is an emerging image analysis method that can automatically extract high-throughput quantitative statistical features from conventional medical images to establish a deep connection between radiological data and biological information [17,18]. Machine learning is pivotal in a range of biomedical engineering applications, such as multi-omics, biological and medical imaging, brain and body machine interfaces, material development, fault detection, and system integration etc. [19,20,21,22]. Particularly in the medical field, various machine-learning models are employed for clinical diagnostics, precision treatments, and health monitoring [23]. Among these, convolutional neural networks (CNNs) have attracted substantial interest for their ability to perform lesion detection, localization, segmentation, and classification in medical image analysis [23,24,25]. The three-dimensional convolutional neural network (3D-CNN) can perform image explanation by using a convolutional kernel to recognize both spectral and spatial features and then classify images according to the labels given on the training data [26]. Currently, these methods have been widely used to detect urinary infection stones, analyze the urinary stone composition, and predict the stone-free rate of flexible ureteroscopy [27,28,29], whereas the capability of radiomics and three-dimensional convolutional neural network (3D-CNN) analysis in differentiating calculous pyonephrosis from uninfected hydronephrosis is yet to be explored.
Thus, this study aims to compare the performance of the radiomics model, 3D-CNN model, and HU in identifying patients with calculous pyonephrosis and integrate the best performing one with independent clinical factors to construct a combined model, exploring whether it has added value compared to the clinical model itself. Firstly, we retrospectively enrolled patients and divided them into training and testing cohorts. Then, the lesion segmentation and HU measurement, radiomics analysis (including feature extraction, feature selection, and model construction), and 3D-CNN model training were performed. Lastly, the performance of different models was assessed and the interpretability and practicality of the final model were described.

2. Materials and Methods

2.1. Patient Selection

This retrospective study was approved by the institutional review board of our hospital and exempted from requiring patient informed consent. Patients receiving percutaneous nephrostomy tube placement or percutaneous nephrolithotomy for calculous hydronephrosis from our institution were selected by searching the medical records for the period January 2019 to January 2021. The inclusion criteria were as follows: (I) adult patients aged ≥18 years; (II) patients with unilateral upper urinary tract calculi; (III) patients who underwent non-contrast abdominal CT scan before performing the operation and the image quality was qualified. The exclusion criteria were as follows: (I) patients with low urinary tract calculi or bilateral upper urinary tract calculi; (II) patients without non-contrast abdominal CT scan before performing the operation; (III) patients with other urinary diseases such as anatomical abnormality, large solid/cystic lesion, etc.; (IV) patients with insufficient clinical information. Finally, a total of 182 patients (84 females/98 males, mean age 53 ± 13 years; age range, 23–86 years) were enrolled. These participants were randomly divided into two independent cohorts: training cohort (n = 123) and testing cohort (n = 59), based on a 7:3 ratio. The flowchart of patient selection is listed in Figure 1.

2.2. Confirmation of Pyonephrosis, Clinical Data Collection, and Clinical Model Building

The percutaneous nephrostomy or percutaneous nephrolithotomy procedure was performed by experienced urologists at our hospital, with pyonephrosis confirmed by the presence of pyuria following the needle insertion [30]. Preoperative clinical characteristics, including basic demographic data (age and gender), body mass index, clinical symptoms (fever and renal colic), coexisting conditions (hypertension and diabetes), history of stone surgery, stone characteristics (laterality, location, and size), hydronephrosis or pyonephrosis levels, the laboratory variables of blood and urine, were obtained by reviewing medical records. The degree of hydronephrosis or pyonephrosis was classified as mild, moderate, and severe according to Noble’s grading system [31]. Urine culture with a single microorganism growth of 105 colony forming units/mL for a sterile midstream urine sample and 104 colony forming units/mL for a catheterized sample were considered positive results [32].
Univariate logistic regression analysis was performed to explore clinical factors for diagnosing pyonephrosis in the training cohort, and variables with p ≤ 0.10 in univariate analysis were considered candidates for multivariate logistic regression analysis to determine the independent predictors of pyonephrosis. Variables with p ≤ 0.05 in multivariate analysis were identified as independent clinical factors and used to establish the clinical model.

2.3. Image Acquisition and Segmentation

The non-contrast CT images were retrieved from the picture archiving and communication system for analysis. All patients underwent abdominal plain CT scans using 64-slice CT scanners (Discovery 750, GE Healthcare, Chicago, IL, USA; Aquilion ONE CT, Toshiba Medical Systems Corporation, Otawara, Tochigi, Japan) with the following parameters: tube voltage, 100–120 kV; automatic tube current modulation, 200–350 mA; rotation time, 0.5 s; matrix size, 512 × 512; scan slice thickness, 5 mm and reconstruction thickness, 1.25 mm.
The CT images, stored as DICOM files, were imported into the open-source software (ITK-SNAP, version 3.8.0, www.itksnap.org, accessed on 19 March 2024). The hydronephrosis or pyonephrosis regions of interest (ROIs) were manually delineated by a radiologist (reader 1) with 5 years of diagnostic abdominal imaging experience. Based on the ROI, the HU was measured and recorded. To ensure the reproducibility and stability of radiomics analysis [33], reader 1 carried out the identical procedure twice on 20 cases that were randomly selected after 2 weeks. A radiologist (reader 2) with 8 years of experience independently segmented 50 cases that were randomly selected. The intraclass correlation coefficient (ICC) was used to measure the intra-observer and inter-observer reliability.

2.4. Feature Extraction, Selection, and Radiomics Model Building

To eliminate the influence of data from different sources on radiomics results, all the CT images underwent resampling (to a voxel size of 1 × 1 × 1 mm) and image normalization using a spline interpolation algorithm before extraction of radiomics features. A total of 1210 radiomic features were extracted from each ROI using the Pyradiomics soft-ware (version 3.0.1a1, https://pyradiomics.readthedocs.io/, accessed on 10 January 2024). The original images and two filtered images, namely laplacian of gaussian (LoG) and wavelet, were utilized for feature extraction. The feature categories included shape, first order, gray-level co-occurrence matrix (GLCM), gray-level dependence matrix (GLDM), gray-level run length matrix (GLRLM), gray-level size zone matrix (GLSZM), and neighborhood gray-tone difference matrix (NGTDM).
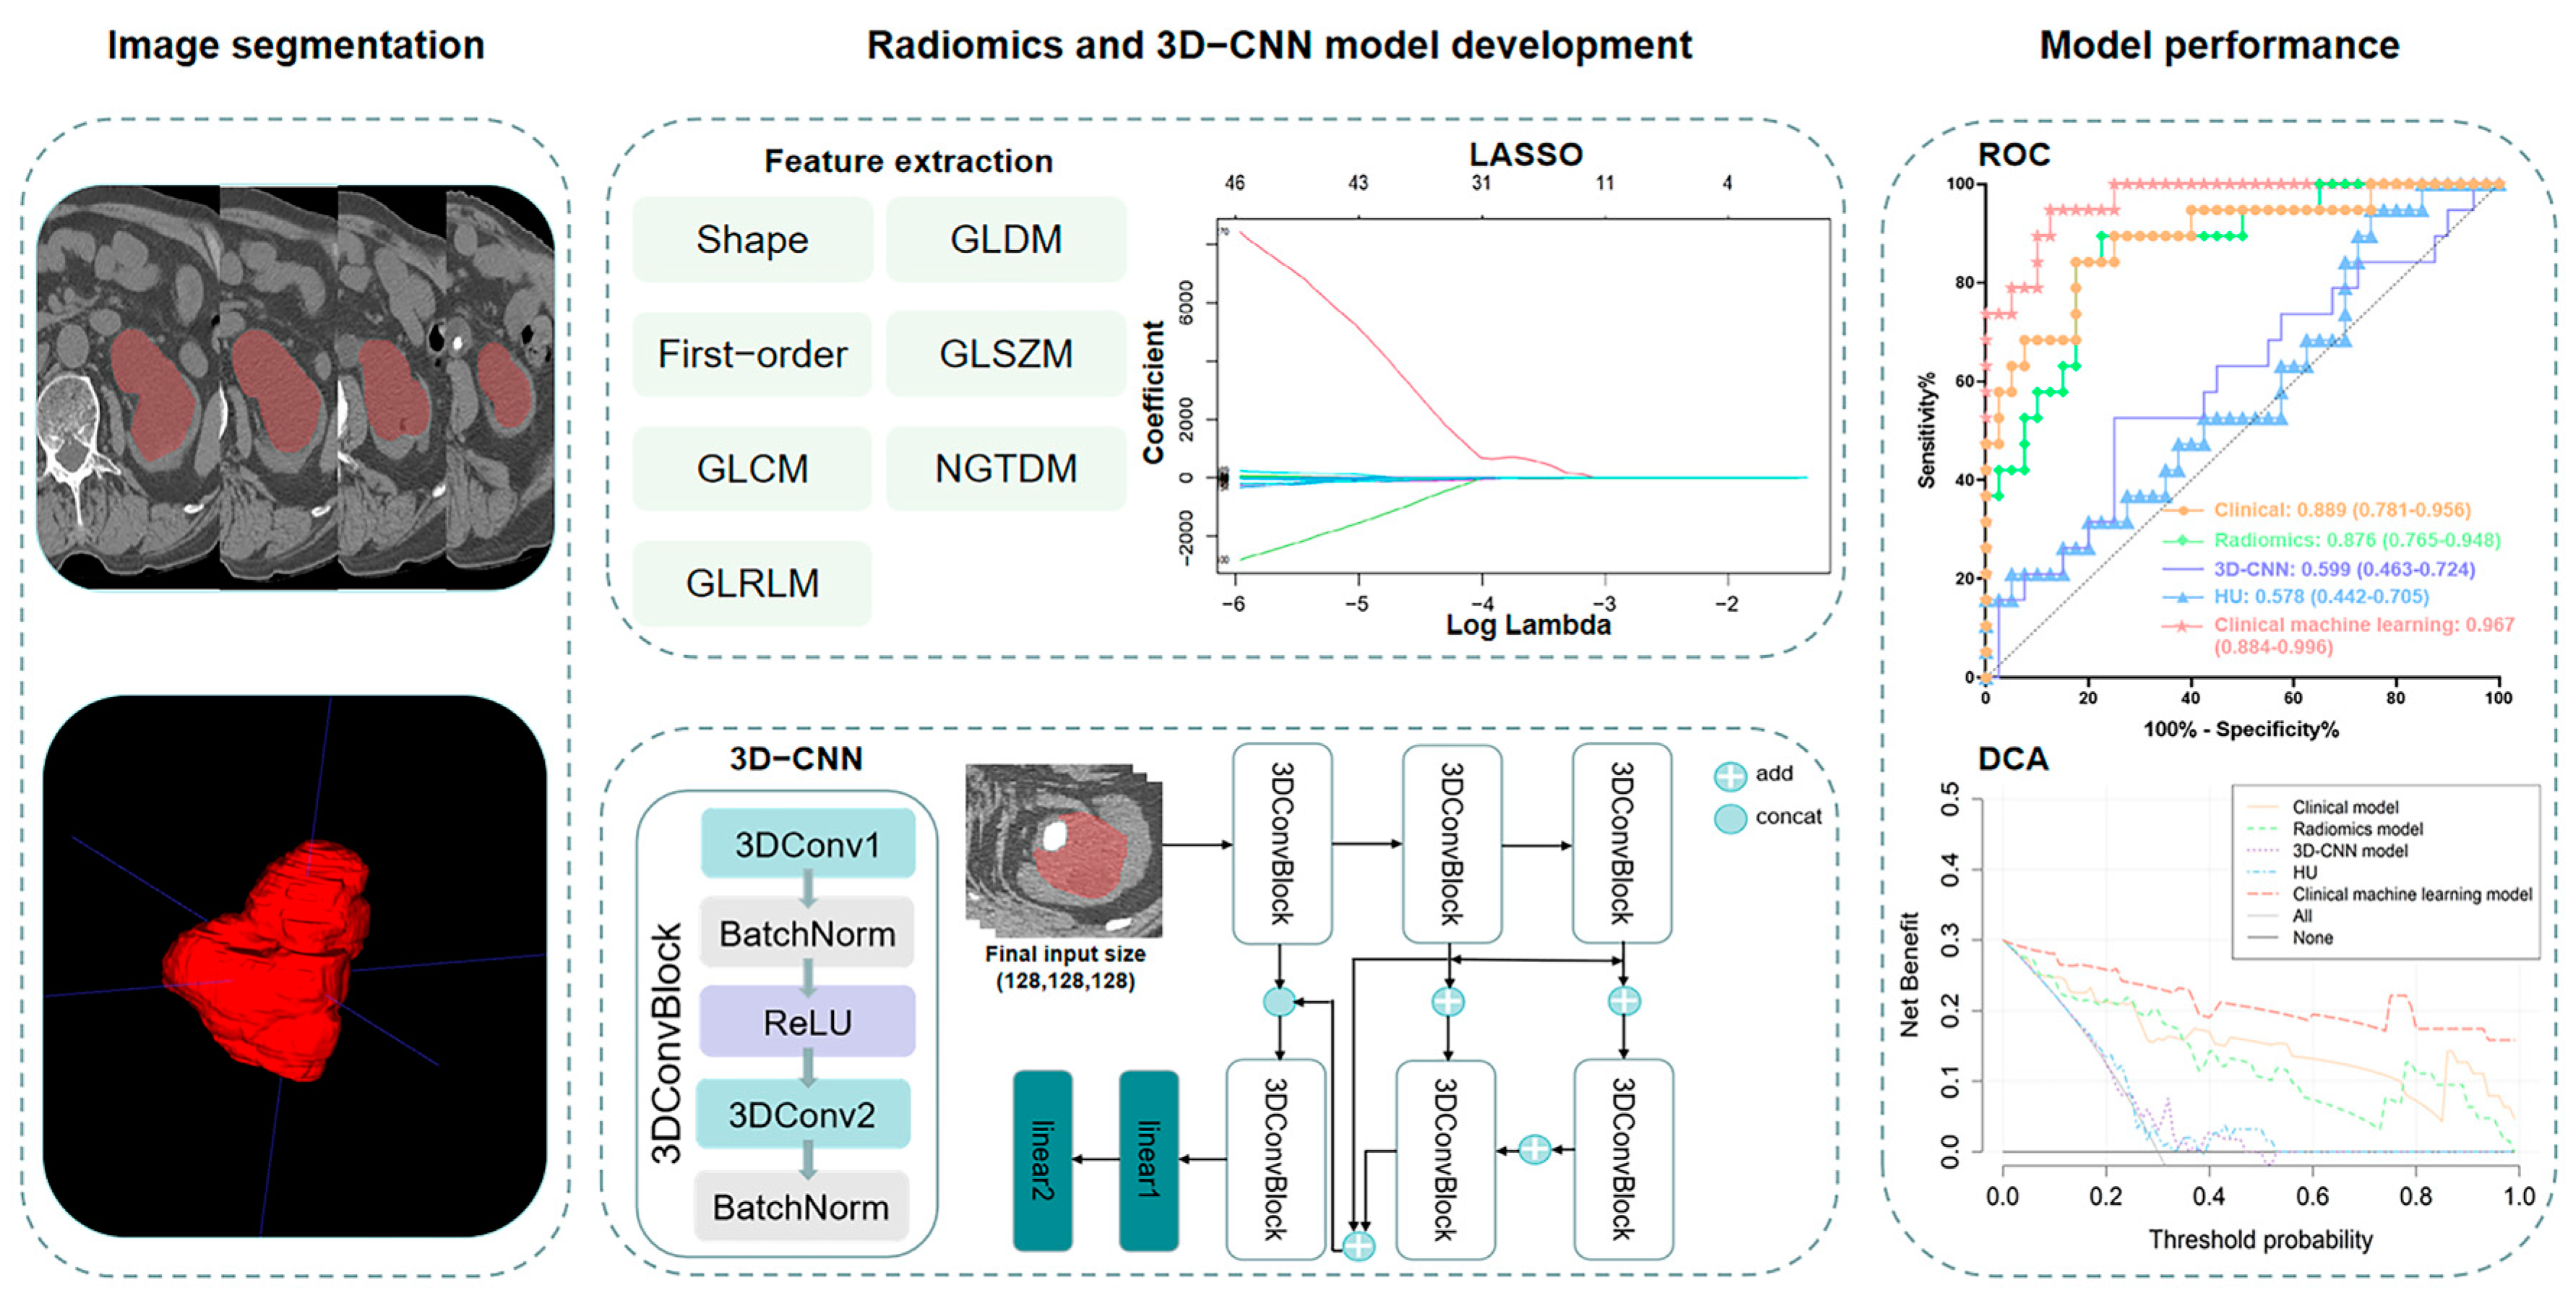
Three-step feature selection was employed to select the optimal radiomic features for diagnosing pyonephrosis. First, features with an ICC higher than 0.80 were selected. Second, the features were treated with the t-test between the pyonephrosis and hydronephrosis groups, and features with p ≤ 0.10 were retained for further analysis. Third, the least absolute shrinkage and selection operator (LASSO) method, which is suitable for the regression of high-dimensional data, was applied to further select features in the training cohort using 10-fold cross-validation. Finally, a radiomics score (Rad-score) was calculated for each patient using a linear combination of selected features weighted by their respective coefficients, and a radiomics model was then generated. The development of radiomics model is exhibited in Figure 2.

2.5. 3D-CNN Model Development

The 3D-CNN model was developed using Python (version 3.8, Python Software Foundation). Images were preprocessed on the whole cohort before inputting into the network. ROIs were extracted from images with the background pixel value set as 0. The windowing and image resize were adjusted using the bilinear interpolation for images and the nearest interpolation for masks. The final input size of images and masks into the CNN were all 128 × 128 × 128. The training and testing cohort is completely consistent with the radiomics analysis. To prevent overfitting, we also performed data augmentation including random flipping and rotation while training. The final 3D-CNN framework is shown in Figure 2.

2.6. Performance and Clinical Utility Assessment of Models

The discriminative performances of models were quantified by the receiver-operating characteristic (ROC) curve and the area under the curve (AUC) in both the training and testing cohorts. The Delong test was used to compare the AUC between the models. McNemar’s test was used to compare the sensitivity and specificity between the models. The clinical machine-learning model was established and evaluated with a combination of independent clinical factors and radiomics or CNN model with the best diagnostic performance. A nomogram was subsequently developed. To determine the clinical utility of the nomogram, decision curve analysis (DCA) was performed by calculating the net benefit at different threshold probabilities.

2.7. Statistical Analysis

Statistical analyses were performed using SPSS (version 25.0, IBM Corp, Chicago, IL, USA), MedCalc (version 15.8, Ostend, Belgium), and R software (version 3.6.3, R Foundation for Statistical Computing, Auckland, New Zealand). Continuous variables were presented as the median (interquartile range, IQR) and compared by the Mann–Whitney U test. Categorical variables were presented as numbers (percentages) and compared by the chi-squared analysis or Fisher’s exact test. All tests were two-sided and values of p ≤ 0.05 were considered statistically significant.

3. Results

3.1. Patient Characteristics and Clinical Model Building

The characteristics of the patients in the training and testing cohorts are shown in Table 1. A total of 53 patients with pyonephrosis and 129 patients with hydronephrosis were enrolled and all patients were randomly assigned to the training cohort or the testing cohort in a ratio of 7:3 (123:59). There were no statistically significant differences in characteristics between the two cohorts (all p > 0.05).
The results of univariate and multivariate logistic regression analysis for clinical factors associated with pyonephrosis in the training cohort are shown in Table 2. Multivariate analysis revealed that fever [odds ratio (OR): 24.436, 95% confidence interval (CI): 4.405–135.547, p < 0.001], blood neutrophils (OR: 1.107, 95% CI: 1.047–1.171, p < 0.001) and urine leukocytes (OR: 1.001, 95% CI: 1.000–1.002, p = 0.003) were independent clinical risk factors for pyonephrosis.
The clinical model based on the three clinical risk factors above exhibited an AUC of 0.904 (95% CI 0.837–0.950) with sensitivity and specificity of 0.853 and 0.865, respectively, in the training cohort (Table 3, Figure 3). In the testing cohort, it yielded an AUC of 0.889 (95% CI 0.781–0.956) with a sensitivity and specificity of 0.842 and 0.825, respectively, in the testing cohort (Table 4, Figure 3).

3.2. Construction of the Radiomics Model

A total of 1210 radiomics features were obtained from each ROI, of which 1111 (91.8%) radiomics features showed ICC > 0.80 in the inter-observer reproducibility analysis and 1161 (96.0%) radiomics features showed ICC > 0.80 in the intra-observer reproducibility analysis. After excluding the features with p > 0.10 in the t-test, the remaining 565 features were included in further analysis. By using the LASSO regression model, a total of eight features with non-zero coefficients were eventually selected as the input of the radiomics model. The Rad-score for each patient was calculated using the following formula:
Rad-score = (0.0243 × log-sigma-4-0-mm-3D_glszm_ZoneEntropy) + (0.3829 × log-sigma-5-0-mm 3D_glszm_ZoneEntropy) + (0.0053 × original_shape_MajorAxisLength) + (−6.0533 × original_shape_Sphericity) + 0.0093 × wavelet-HHL_glszm_GrayLevelNonUniformity) + (0.2480 × wavelet HLH_glszm_ZoneEntropy) + (3.0011 × wavelet-LLH_firstorder_Median) + (1.0610 × wavelet-LLH_glrlm_RunLengthNonUniformityNormalized) − 1.0104.
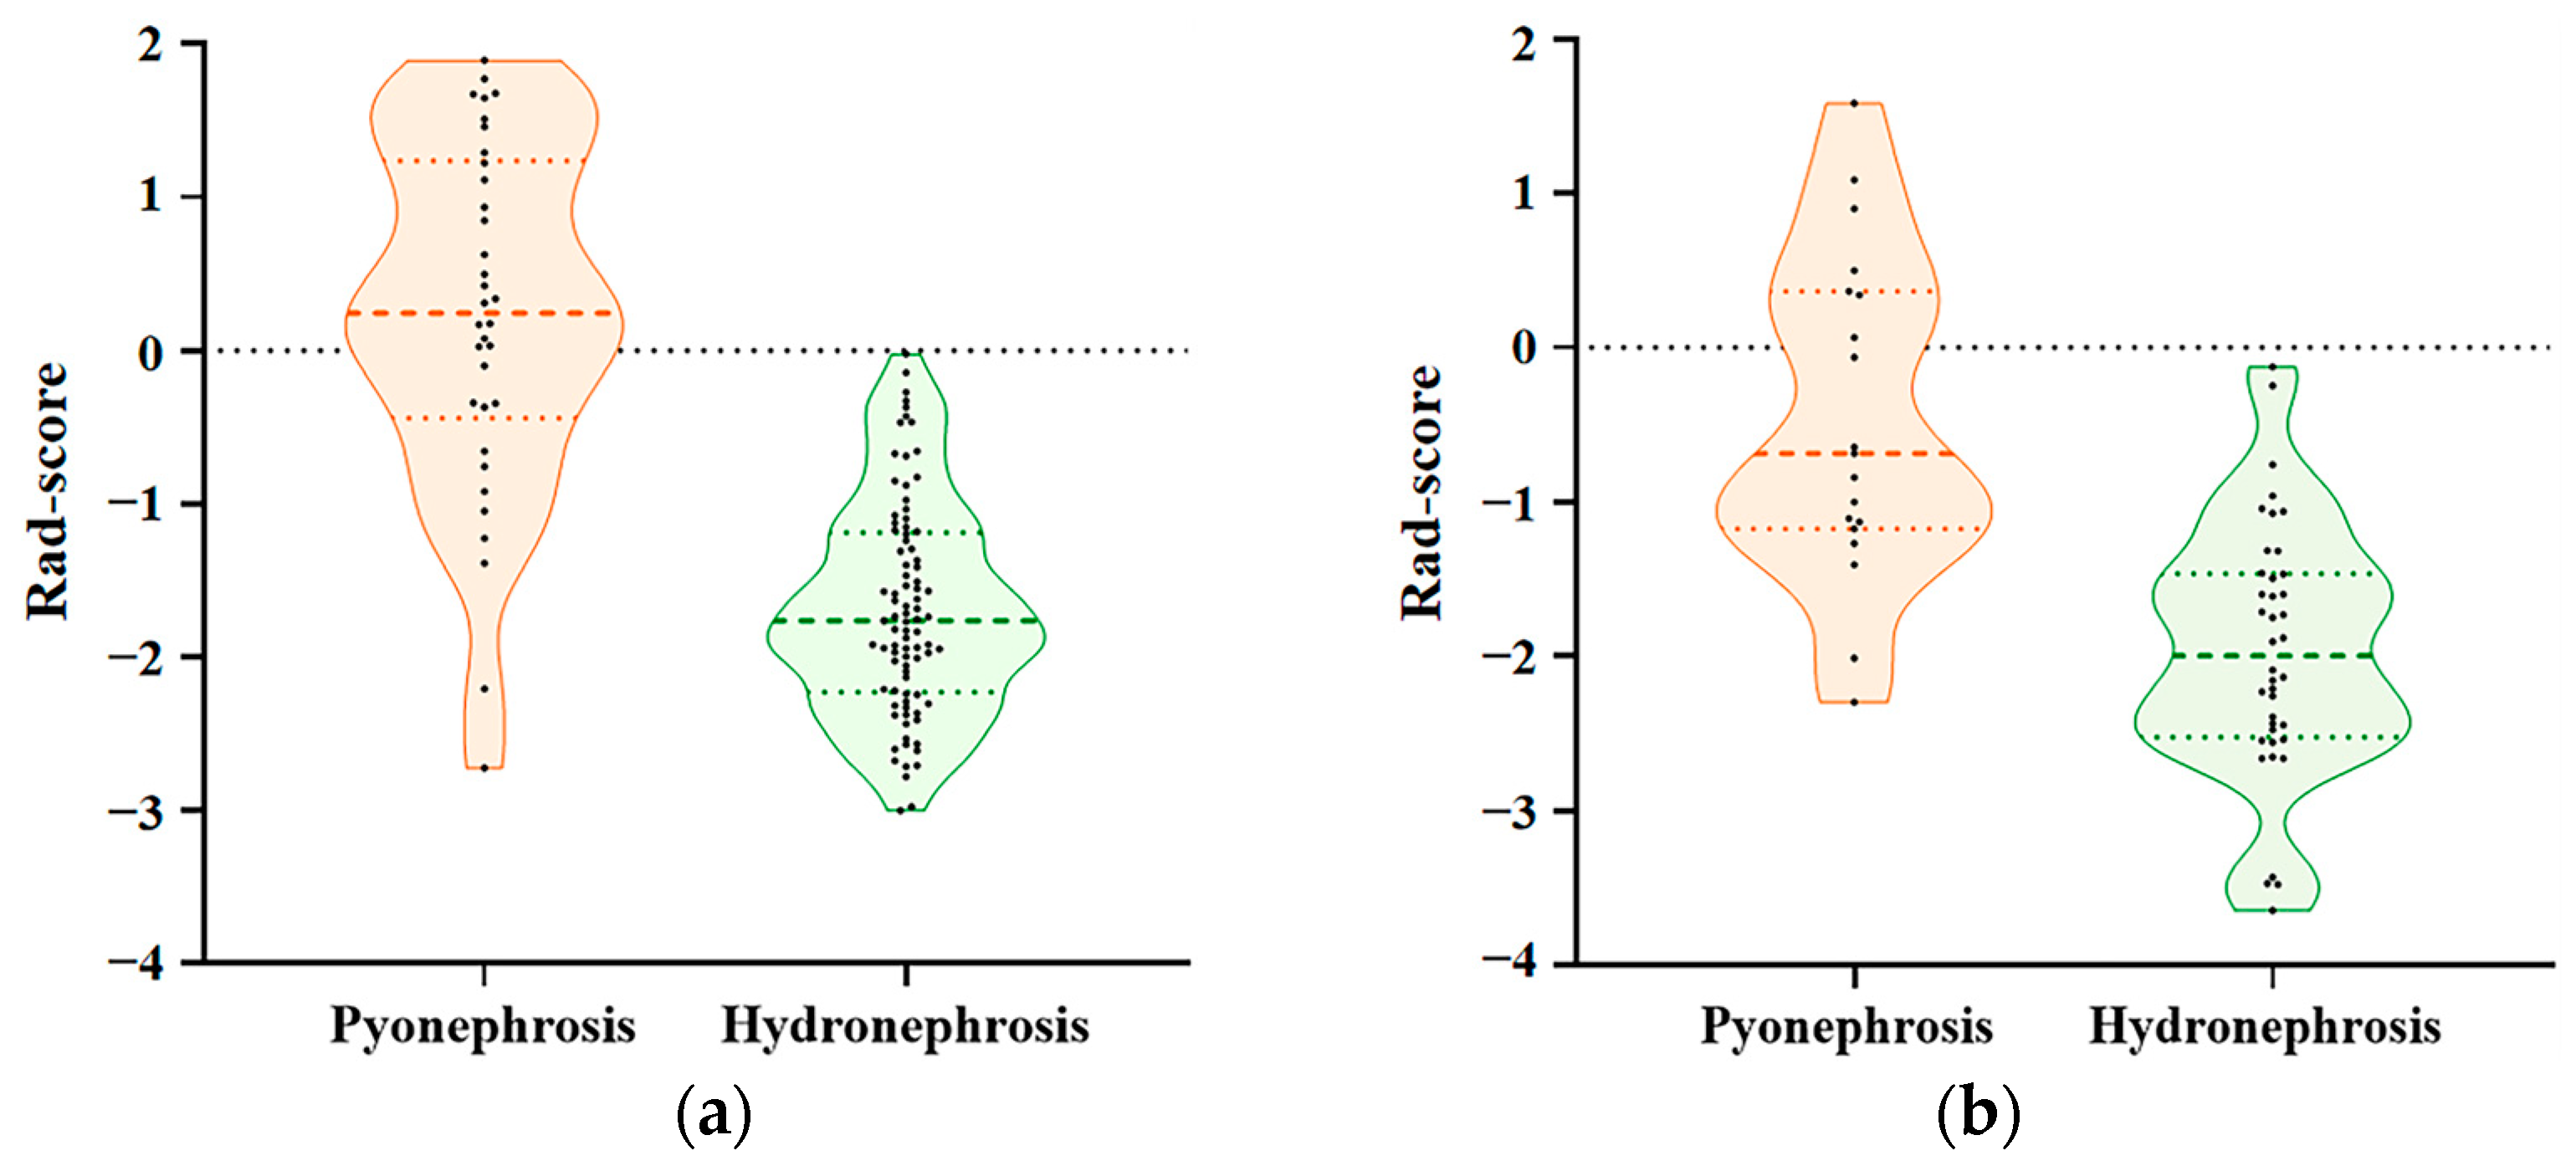
There was a significant difference in the Rad-score between the pyonephrosis and hydronephrosis groups in both the training (0.22 vs. −1.69, p < 0.001) and testing (−0.46 vs. −1.96, p < 0.001) cohorts (Figure 4). The radiomics model showed an AUC of 0.912 (95% CI: 0.848–0.956) with sensitivity and specificity of 0.765 and 0.944, respectively, in the training cohort (Table 3, Figure 3). In the testing cohort, it achieved an AUC of 0.876 (95% CI: 0.765–0.948) with a sensitivity and specificity of 0.895 and 0.775, respectively (Table 4, Figure 3).

3.3. Development of the 3D-CNN Model

The 3D-CNN model was trained based on the training cohort data and showed an AUC of 1.000 (95% CI: 0.970–1.000) in the training cohort (Table 3, Figure 3). In the testing cohort, it achieved an AUC of 0.599 (95% CI: 0.463–0.724) with a sensitivity and specificity of 0.526 and 0.750, respectively (Table 4, Figure 3).

3.4. Comparison of Radiomics Model, 3D-CNN Model, and HU Performance

The HU was not significantly different between the training and testing cohorts (9.60 ± 7.54 vs. 11.04 ± 6.82, p = 0.214). In the training cohort, the HU was significantly different between the hydronephrosis and pyonephrosis groups (7.65 ± 6.31 vs. 14.68 ± 8.19, p < 0.001). However, the difference was not significant in the testing cohort (10.20 ± 6.45 vs. 12.81 ± 7.41, p = 0.173). Univariate and multivariate logistic regression analysis revealed that the HU was an independent risk factor for pyonephrosis in the training cohort [(OR with 95% CI): 1.148 (1.076–1.226), p < 0.001; 1.160 (1.057–1.273), p = 0.002]. The HU showed an AUC of 0.747 (95% CI: 0.660–0.821) with sensitivity and specificity of 0.765 and 0.607, respectively, in the training cohort (Table 3, Figure 3). In the testing cohort, it achieved an AUC of 0.578 (95% CI: 0.442–0.705) with a sensitivity and specificity of 0.947 and 0.250, respectively (Table 4, Figure 3).
The radiomics model (0.876 vs. 0.578, p = 0.002) and 3D-CNN model (0.599 vs. 0.578, p = 0.812) both exhibited a higher AUC than the measured HU in the testing cohort. The radiomics model outperformed the 3D-CNN model (AUC: 0.876 vs. 0.599; p = 0.003) (Table 4, Figure 3).

3.5. Establishment of the Clinical Machine-Learning Model

Radiomics model had the highest AUC in the testing cohort. Therefore, independent clinical risk factors, including fever, blood neutrophils, and urine leukocytes, were combined with the Rad-score by multivariate logistic regression to establish a final clinical machine-learning model. A nomogram was constructed based on this model. For each factor, we can obtain a point according to the patient’s clinical and radiomics information, and a higher total point reflects a corresponding case with a higher probability for the occurrence of pyonephrosis (Figure 5).
The clinical machine-learning model showed an AUC of 0.975 (95% CI: 0.929–0.994) with sensitivity and specificity of 0.912 and 0.900, respectively in the training cohort. In the testing cohort, it exhibited an AUC of 0.967 (95% CI: 0.884–0.996) and sensitivity and specificity of 0.947 and 0.875, respectively. In addition, the clinical machine-learning model outperformed the clinical model and radiomics model in the training (AUC: 0.975 vs. 0.904, 0.912; p = 0.019, 0.065) and testing (AUC: 0.967 vs. 0.889, 0.876; p = 0.045, 0.061) cohorts, respectively (Table 3 and Table 4, Figure 3).
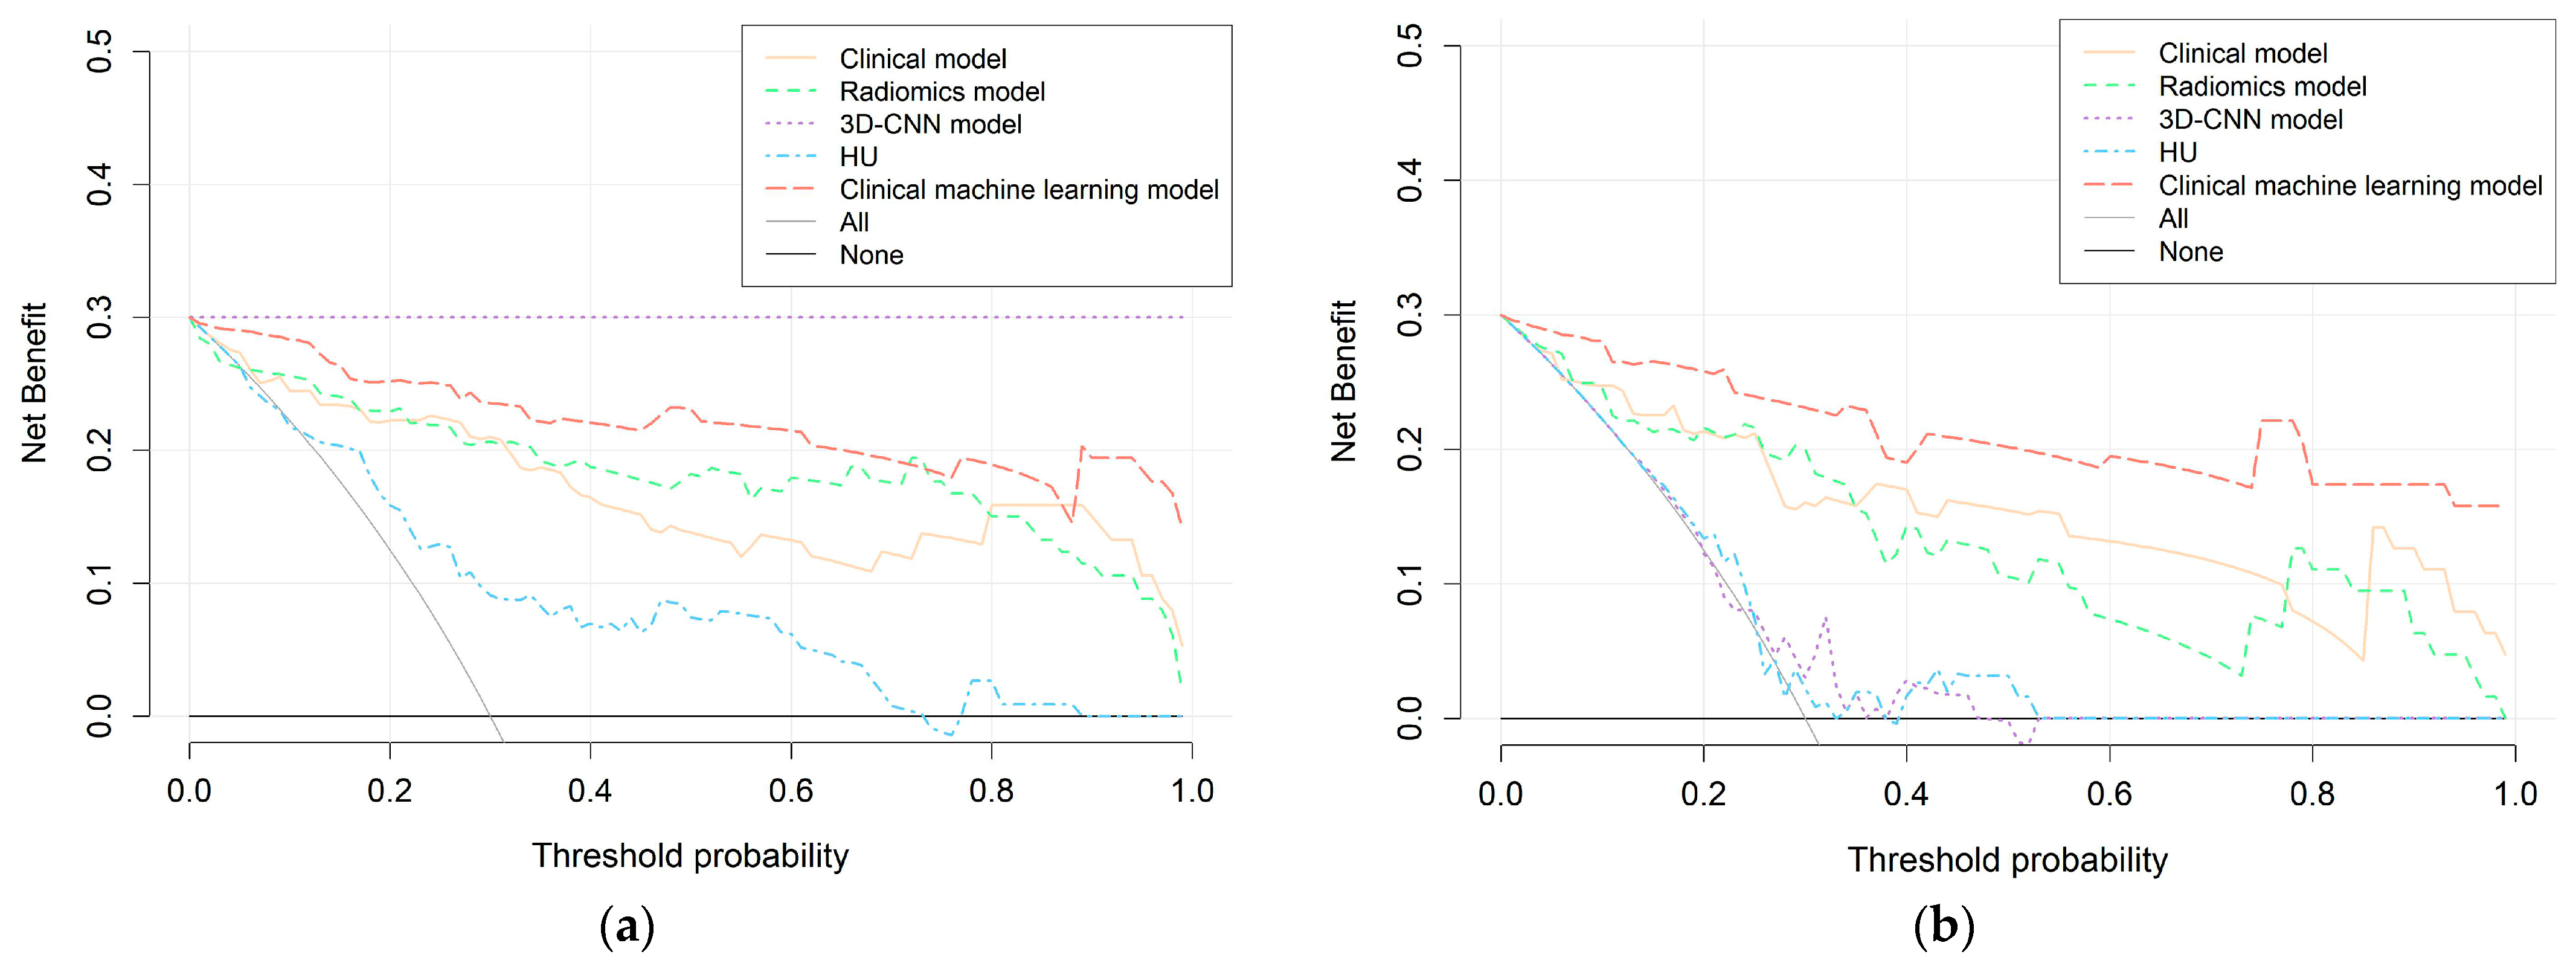
Furthermore, DCA indicated that in both the training and testing cohorts, the clinical machine-learning model provided a greater benefit than the clinical model and radiomic model in identifying calculous pyonephrosis across most of the threshold probabilities (Figure 6).

4. Discussion

In the present study, the radiomics model exhibited a good capability in identifying patients with calculous pyonephrosis, surpassing both the 3D-CNN model and HU in the testing cohort. The clinical machine-learning model, which integrates the Rad-score and three independent clinical factors, outperformed the individual clinical model. DCA further confirmed its clinical validity.
Regarding clinical indicators, the current work revealed that fever, blood neutrophils, and urine leukocytes were independent risk factors for pyonephrosis. Fever is considered an important indicative symptom of acute urinary tract infection [34] and previous research has similarly shown that the maximum body temperature is independently associated with the occurrence of pyonephrosis [12]. Neutrophils are the main cellular component of the host immune system. They were regarded as the primary mediator of innate immune defenses against invading microorganisms [35], which may explain why blood neutrophils were one of the independent risk factors for predicting pyonephrosis, as reported in the study of Wang et al. [36]. Two studies, by Wang et al. and Liu et al. [36,37], have indicated that an independent association was observed between urine leukocytes and pyonephrosis, consistent with our finding. Thus, when a patient presents with fever or elevated counts of blood neutrophils and urine leukocytes, the clinician should keep highly alert for the occurrence of pyonephrosis. Surprisingly, urine culture was not included in the establishment of the final model, likely because routine urine culture results cannot truly reflect the renal infection status due to the obstruction of the collecting system.
Several previous studies have reported that the HU can effectively differentiate pyonephrosis from hydronephrosis, with reported AUC values ranging from 0.780 to 0.854 [12,13,14]. However, our results indicated that the AUC of HU in the training and testing cohort were 0.747 and 0.578, respectively, which was lower than those previously reported. This may be attributed to the fact that previous studies measured the HU of pyonephrosis or hydronephrosis region in the single slice with the maximal collecting system surface area, whereas we measured the average HU across all slices to avoid subjective bias. Our results found that the radiomics and 3D-CNN models demonstrated higher AUC than the HU, indicating that radiomics and deep-learning features provide more valuable information.
Although the 3D-CNN model can achieve classification between hydronephrosis and pyonephrosis, its AUC on the testing cohort is significantly inferior to the radiomics model. The relatively small sample size in this study might have hindered the effective training of the 3D-CNN model. Future improvements and validations of 3D-CNN models could benefit from larger, multicenter studies. In our study, the single radiomics model has already demonstrated a good ability to identify calculous pyonephrosis. The correlation between a single radiomic feature and biological information is difficult to comprehend and building multi-feature panels is a more common assessment method, as reported in several previous studies [38,39]. After radiomic analysis, the Rad-score was finally calculated based on selected eight radiomics features. Two morphology parameters were collected from original images, which may reveal that there are differences in the volume and shape between pyonephrosis and hydronephrosis. Two LoG-filtered radiomics features were included in the final radiomics model and many studies have reported that LoG features are closely related to lesion heterogeneity, microenvironment, and molecular biological information [16,40]. Purulent fluid includes bacteria, inflammatory cells, necrotic tissue, etc., and its composition is more complex than that of the fluid of hydronephrosis. In addition, the spatial colony-growth heterogeneity further increases the complexity of the pyonephrosis region [41]. The benefits of wavelet-filtered features in enhancing model competence were demonstrated by several prior reports [42,43,44]. The radiomics model includes four wavelet features and achieved an AUC of 0.912 and 0.876 in the training and testing cohort, respectively, demonstrating its good discrimination performance. In addition, of eight selected features, four features were GLSZM-based and several prior studies have reported that it could quantify image heterogeneity in terms of zones of contiguous voxels sharing the same grey level intensity [45]. All selected GLSZM features had positive coefficients, aligning with the notion that pyonephrosis fluid is more complex than that of hydronephrosis.
In our research, the clinical machine-learning model achieved a higher AUC than the clinical model, which suggests that the clinical machine-learning model is more feasible for diagnosing pyonephrosis and may exert an indispensable effect on identifying the patients who have pyonephrosis but without certain suggestive clinical signs. In addition, comparisons and evaluations of each model by DCA further showed that the clinical machine-learning model resulted in net benefits of providing more than the clinical model or radiomics model across most of the threshold probabilities. A visualizable nomogram was generated based on the final model. With this easy-to-use scoring nomogram, clinicians could predict the individual risk probability of calculous pyonephrosis, which contributes to improving diagnostic efficiency and facilitating urgent drainage and anti-infection treatment to prevent patients from disastrous outcomes.
This study has several limitations. First, the study was retrospective in design and potential selection bias was inevitable. Hence, prospective studies are needed. Second, this investigation was conducted in a single institution and no independent external dataset was available for validation, the clinical application and generalization of the nomogram still need to be further improved and validated by multi-center studies with larger sample sizes. Third, we will attempt to apply deep-learning algorithms to achieve automatic segmentation of hydronephrosis or pyonephrosis regions to simplify clinical operations. Fourth, dynamic analysis based on machine learning has already been widely applied in single-particle tracking techniques and has garnered significant attention in recent years [46]. Our study mainly focused on the analysis of static images, but a potential future research direction is to incorporate time-series data to analyze the dynamic evolution of abnormalities, which contributes to the early diagnosis of pyonephrosis.

5. Conclusions

In summary, the radiomics and 3D-CNN models showed better performance than the HU, which suggests that the high-throughput features may offer more valuable internal information about lesions. In addition, the radiomics model was more effective in differentiating calculous pyonephrosis from uninfected hydronephrosis than the 3D-CNN model. The clinical machine-learning model constructed by combining Rad-score and clinical risk factors outperformed the individual clinical model, which provides a non-invasive and comprehensive diagnostic method for pyonephrosis. It can also be helpful for clinicians to identify patients who have pyonephrosis but without certain suggestive clinical signs and implement urgent or more appropriate treatment to prevent patients from having a poor prognosis. In the future, this clinical machine-learning model needs to be validated by multi-center large sample studies. In addition, applying advanced artificial intelligence architecture to achieve one-stop analysis from acquiring CT images to diagnosing calculous pyonephrosis, will be more conducive to assisting clinical decision-making.

Author Contributions

Conceptualization, Z.L., S.W. and C.X.; methodology, J.Z., J.C. and Z.Z.; investigation, W.Q. and P.L.; data curation, L.C. and G.Y.; writing—original draft preparation, G.Y.; writing—review and editing, C.X. and P.L.; supervision, Z.L. and Q.C.; funding acquisition, Z.L., J.Z. and Q.C. All authors have read and agreed to the published version of the manuscript.

Funding

This research was funded by the grants from National Natural Science Foundation of China (NSFC): No. 82371942, 82071889 to Z.L., No. 62131009 to Q.C., and No. 81900647 to J.Z.

Institutional Review Board Statement

This study was conducted according to the guidelines of the Declaration of Helsinki and approved by the Institutional Review Board of Tongji Hospital, Tongji Medical College, Huazhong University of Science and Technology (protocol code TJ-IRB20230907, date of approval: 18 September 2023).

Informed Consent Statement

Patient consents were waived due to the retrospective study.

Data Availability Statement

All data are available in this article.

Conflicts of Interest

Jun Chen is employed by Bayer Healthcare. The authors declare no conflict of interest.

References

  1. Wagenlehner, F.M.; Tandogdu, Z.; Bjerklund Johansen, T.E. An update on classification and management of urosepsis. Curr. Opin. Urol. 2017, 27, 133–137. [Google Scholar] [CrossRef] [PubMed]
  2. Jimenez, J.F.; Lopez Pacios, M.A.; Llamazares, G.; Conejero, J.; Sole-Balcells, F. Treatment of pyonephrosis: A comparative study. J. Urol. 1978, 120, 287–289. [Google Scholar] [CrossRef] [PubMed]
  3. Jung, H.; Osther, P.J. Acute management of stones: When to treat or not to treat? World J. Urol. 2015, 33, 203–211. [Google Scholar] [CrossRef] [PubMed]
  4. Mokhmalji, H.; Braun, P.M.; Martinez Portillo, F.J.; Siegsmund, M.; Alken, P.; Kohrmann, K.U. Percutaneous nephrostomy versus ureteral stents for diversion of hydronephrosis caused by stones: A prospective, randomized clinical trial. J. Urol. 2001, 165, 1088–1092. [Google Scholar] [CrossRef] [PubMed]
  5. Bjerklund Johansen, T.E. Diagnosis and imaging in urinary tract infections. Curr. Opin. Urol. 2002, 12, 39–43. [Google Scholar] [CrossRef] [PubMed]
  6. Li, A.C.; Regalado, S.P. Emergent percutaneous nephrostomy for the diagnosis and management of pyonephrosis. Semin. Intervent. Radiol. 2012, 29, 218–225. [Google Scholar] [PubMed]
  7. Vaidyanathan, S.; Singh, G.; Soni, B.M.; Hughes, P.; Watt, J.W.; Dundas, S.; Sett, P.; Parsons, K.F. Silent hydronephrosis/pyonephrosis due to upper urinary tract calculi in spinal cord injury patients. Spinal Cord 2000, 38, 661–668. [Google Scholar] [CrossRef] [PubMed]
  8. Dede, G.; Deveci, O.; Dede, O.; Utangac, M.; Daggulli, M.; Penbegul, N.; Hatipoglu, N.K. For reliable urine cultures in the detection of complicated urinary tract infection, do we use urine specimens obtained with urethral catheter or a nephrostomy tube? Turk. J. Urol. 2016, 42, 290–294. [Google Scholar] [CrossRef]
  9. Laquerre, J. Hydronephrosis: Diagnosis, Grading, and Treatment. Radiol. Technol. 2020, 92, 135–151. [Google Scholar]
  10. Browne, R.F.; Zwirewich, C.; Torreggiani, W.C. Imaging of urinary tract infection in the adult. Eur. Radiol. 2004, 14 (Suppl. S3), E168–E183. [Google Scholar] [CrossRef]
  11. Kawashima, A.; Sandler, C.M.; Goldman, S.M. Imaging in acute renal infection. BJU Int. 2000, 86 (Suppl. S1), 70–79. [Google Scholar] [CrossRef] [PubMed]
  12. Erdogan, A.; Sambel, M.; Caglayan, V.; Avci, S. Importance of the Hounsfield Unit Value Measured by Computed Tomography in the Differentiation of Hydronephrosis and Pyonephrosis. Cureus 2020, 12, e11675. [Google Scholar] [CrossRef] [PubMed]
  13. Boeri, L.; Fulgheri, I.; Palmisano, F.; Lievore, E.; Lorusso, V.; Ripa, F.; D’Amico, M.; Spinelli, M.G.; Salonia, A.; Carrafiello, G.; et al. Hounsfield unit attenuation value can differentiate pyonephrosis from hydronephrosis and predict septic complications in patients with obstructive uropathy. Sci. Rep. 2020, 10, 18546. [Google Scholar] [CrossRef] [PubMed]
  14. Yuruk, E.; Tuken, M.; Sulejman, S.; Colakerol, A.; Serefoglu, E.C.; Sarica, K.; Muslumanoglu, A.Y. Computerized tomography attenuation values can be used to differentiate hydronephrosis from pyonephrosis. World J. Urol. 2017, 35, 437–442. [Google Scholar] [CrossRef]
  15. Lambin, P.; Leijenaar, R.T.H.; Deist, T.M.; Peerlings, J.; de Jong, E.E.C.; van Timmeren, J.; Sanduleanu, S.; Larue, R.; Even, A.J.G.; Jochems, A.; et al. Radiomics: The bridge between medical imaging and personalized medicine. Nat. Rev. Clin. Oncol. 2017, 14, 749–762. [Google Scholar] [CrossRef] [PubMed]
  16. Gillies, R.J.; Kinahan, P.E.; Hricak, H. Radiomics: Images Are More than Pictures, They Are Data. Radiology 2016, 278, 563–577. [Google Scholar] [CrossRef] [PubMed]
  17. Lambin, P.; Rios-Velazquez, E.; Leijenaar, R.; Carvalho, S.; van Stiphout, R.G.; Granton, P.; Zegers, C.M.; Gillies, R.; Boellard, R.; Dekker, A.; et al. Radiomics: Extracting more information from medical images using advanced feature analysis. Eur. J. Cancer 2012, 48, 441–446. [Google Scholar] [CrossRef]
  18. Kumar, V.; Gu, Y.; Basu, S.; Berglund, A.; Eschrich, S.A.; Schabath, M.B.; Forster, K.; Aerts, H.J.; Dekker, A.; Fenstermacher, D.; et al. Radiomics: The process and the challenges. Magn. Reson. Imaging 2012, 30, 1234–1248. [Google Scholar] [CrossRef] [PubMed]
  19. Binson, V.A.; Thomas, S.; Subramoniam, M.; Arun, J.; Naveen, S.; Madhu, S. A Review of Machine Learning Algorithms for Biomedical Applications. Ann. Biomed. Eng. 2024, 52, 1159–1183. [Google Scholar] [CrossRef]
  20. Goh, G.D.; Lee, J.M.; Goh, G.L.; Huang, X.; Lee, S.; Yeong, W.Y. Machine Learning for Bioelectronics on Wearable and Implantable Devices: Challenges and Potential. Tissue Eng. Part A 2022, 29, 20–46. [Google Scholar] [CrossRef]
  21. Zemouri, R.; Zerhouni, N.; Racoceanu, D. Deep Learning in the Biomedical Applications: Recent and Future Status. Appl. Sci. 2019, 9, 1526. [Google Scholar] [CrossRef]
  22. Neupane, D.; Kim, Y.; Seok, J.; Hong, J. CNN-Based Fault Detection for Smart Manufacturing. Appl. Sci. 2021, 11, 11732. [Google Scholar] [CrossRef]
  23. Goecks, J.; Jalili, V.; Heiser, L.M.; Gray, J.W. How Machine Learning Will Transform Biomedicine. Cell 2020, 181, 92–101. [Google Scholar] [CrossRef]
  24. Singh, S.P.; Wang, L.; Gupta, S.; Goli, H.; Padmanabhan, P.; Gulyas, B. 3D Deep Learning on Medical Images: A Review. Sensors 2020, 20, 5097. [Google Scholar] [CrossRef] [PubMed]
  25. Tajbakhsh, N.; Shin, J.Y.; Gurudu, S.R.; Hurst, R.T.; Kendall, C.B.; Gotway, M.B.; Jianming, L. Convolutional Neural Networks for Medical Image Analysis: Full Training or Fine Tuning? IEEE Trans. Med. Imaging 2016, 35, 1299–1312. [Google Scholar] [CrossRef]
  26. Liao, H.; Yang, J.; Li, Y.; Liang, H.; Ye, J.; Liu, Y. One 3D VOI-based deep learning radiomics strategy, clinical model and radiologists for predicting lymph node metastases in pancreatic ductal adenocarcinoma based on multiphasic contrast-enhanced computer tomography. Front. Oncol. 2022, 12, 990156. [Google Scholar] [CrossRef]
  27. Zheng, J.; Yu, H.; Batur, J.; Shi, Z.; Tuerxun, A.; Abulajiang, A.; Lu, S.; Kong, J.; Huang, L.; Wu, S.; et al. A multicenter study to develop a non-invasive radiomic model to identify urinary infection stone in vivo using machine-learning. Kidney Int. 2021, 100, 870–880. [Google Scholar] [CrossRef]
  28. Xun, Y.; Chen, M.; Liang, P.; Tripathi, P.; Deng, H.; Zhou, Z.; Xie, Q.; Li, C.; Wang, S.; Li, Z.; et al. A Novel Clinical-Radiomics Model Pre-operatively Predicted the Stone-Free Rate of Flexible Ureteroscopy Strategy in Kidney Stone Patients. Front. Med. 2020, 7, 576925. [Google Scholar] [CrossRef]
  29. Fitri, L.A.; Haryanto, F.; Arimura, H.; YunHao, C.; Ninomiya, K.; Nakano, R.; Haekal, M.; Warty, Y.; Fauzi, U. Automated classification of urinary stones based on microcomputed tomography images using convolutional neural network. Phys. Med. 2020, 78, 201–208. [Google Scholar] [CrossRef] [PubMed]
  30. Yoder, I.C.; Lindfors, K.K.; Pfister, R.C. Diagnosis and treatment of pyonephrosis. Radiol. Clin. N. Am. 1984, 22, 407–414. [Google Scholar] [CrossRef]
  31. Noble, V.E.; Brown, D.F. Renal ultrasound. Emerg. Med. Clin. N. Am. 2004, 22, 641–659. [Google Scholar] [CrossRef] [PubMed]
  32. Roberts, F.J. Quantitative urine culture in patients with urinary tract infection and bacteremia. Am. J. Clin. Pathol. 1986, 85, 616–618. [Google Scholar] [CrossRef] [PubMed]
  33. Koo, T.K.; Li, M.Y. A Guideline of Selecting and Reporting Intraclass Correlation Coefficients for Reliability Research. J. Chiropr. Med. 2016, 15, 155–163. [Google Scholar] [CrossRef] [PubMed]
  34. Gupta, K.; Grigoryan, L.; Trautner, B. Urinary Tract Infection. Ann. Intern. Med. 2017, 167, ITC49–ITC64. [Google Scholar] [CrossRef] [PubMed]
  35. Rungelrath, V.; Kobayashi, S.D.; DeLeo, F.R. Neutrophils in innate immunity and systems biology-level approaches. Wiley Interdiscip. Rev. Syst. Biol. Med. 2020, 12, e1458. [Google Scholar] [CrossRef] [PubMed]
  36. Wang, X.; Tang, K.; Xia, D.; Peng, E.; Li, R.; Liu, H.; Chen, Z. A novel comprehensive predictive model for obstructive pyonephrosis patients with upper urinary tract stones. Int. J. Clin. Exp. Pathol. 2020, 13, 2758–2766. [Google Scholar] [PubMed]
  37. Liu, H.; Wang, X.; Tang, K.; Peng, E.; Xia, D.; Chen, Z. Machine learning-assisted decision-support models to better predict patients with calculous pyonephrosis. Transl. Androl. Urol. 2021, 10, 710–723. [Google Scholar] [CrossRef] [PubMed]
  38. Rutman, A.M.; Kuo, M.D. Radiogenomics: Creating a link between molecular diagnostics and diagnostic imaging. Eur. J. Radiol. 2009, 70, 232–241. [Google Scholar] [CrossRef]
  39. Kuo, M.D.; Gollub, J.; Sirlin, C.B.; Ooi, C.; Chen, X. Radiogenomic analysis to identify imaging phenotypes associated with drug response gene expression programs in hepatocellular carcinoma. J. Vasc. Interv. Radiol. 2007, 18, 821–831. [Google Scholar] [CrossRef]
  40. Lambin, P.; van Stiphout, R.G.; Starmans, M.H.; Rios-Velazquez, E.; Nalbantov, G.; Aerts, H.J.; Roelofs, E.; van Elmpt, W.; Boutros, P.C.; Granone, P.; et al. Predicting outcomes in radiation oncology—Multifactorial decision support systems. Nat. Rev. Clin. Oncol. 2013, 10, 27–40. [Google Scholar] [CrossRef]
  41. Kindler, O.; Pulkkinen, O.; Cherstvy, A.G.; Metzler, R. Burst statistics in an early biofilm quorum sensing model: The role of spatial colony-growth heterogeneity. Sci. Rep. 2019, 9, 12077. [Google Scholar] [CrossRef] [PubMed]
  42. Ma, X.; Lv, W.; Wang, C.; Tu, D.; Qiao, J.; Fan, C.; Niu, J.; Zhou, W.; Liu, Q.; Xia, L. A potential biomarker based on clinical-radiomics nomogram for predicting survival and adjuvant chemotherapy benefit in resected node-negative, early-stage lung adenocarcinoma. J. Thorac. Dis. 2022, 14, 1–17. [Google Scholar] [CrossRef] [PubMed]
  43. Zhou, J.; Lu, J.; Gao, C.; Zeng, J.; Zhou, C.; Lai, X.; Cai, W.; Xu, M. Predicting the response to neoadjuvant chemotherapy for breast cancer: Wavelet transforming radiomics in MRI. BMC Cancer 2020, 20, 100. [Google Scholar] [CrossRef] [PubMed]
  44. Majeed Alneamy, J.S.; Hameed Alnaish, Z.A.; Mohd Hashim, S.Z.; Hamed Alnaish, R.A. Utilizing hybrid functional fuzzy wavelet neural networks with a teaching learning-based optimization algorithm for medical disease diagnosis. Comput. Biol. Med. 2019, 112, 103348. [Google Scholar] [CrossRef]
  45. Wei, C.; Li, N.; Shi, B.; Wang, C.; Wu, Y.; Lin, T.; Chen, Y.; Ge, Y.; Yu, Y.; Dong, J. The predictive value of conventional MRI combined with radiomics in the immediate ablation rate of HIFU treatment for uterine fibroids. Int. J. Hyperth. 2022, 39, 475–484. [Google Scholar] [CrossRef]
  46. Muñoz-Gil, G.; Garcia-March, M.A.; Manzo, C.; Martín-Guerrero, J.D.; Lewenstein, M. Single trajectory characterization via machine learning. New J. Phys. 2020, 22, 013010. [Google Scholar] [CrossRef]
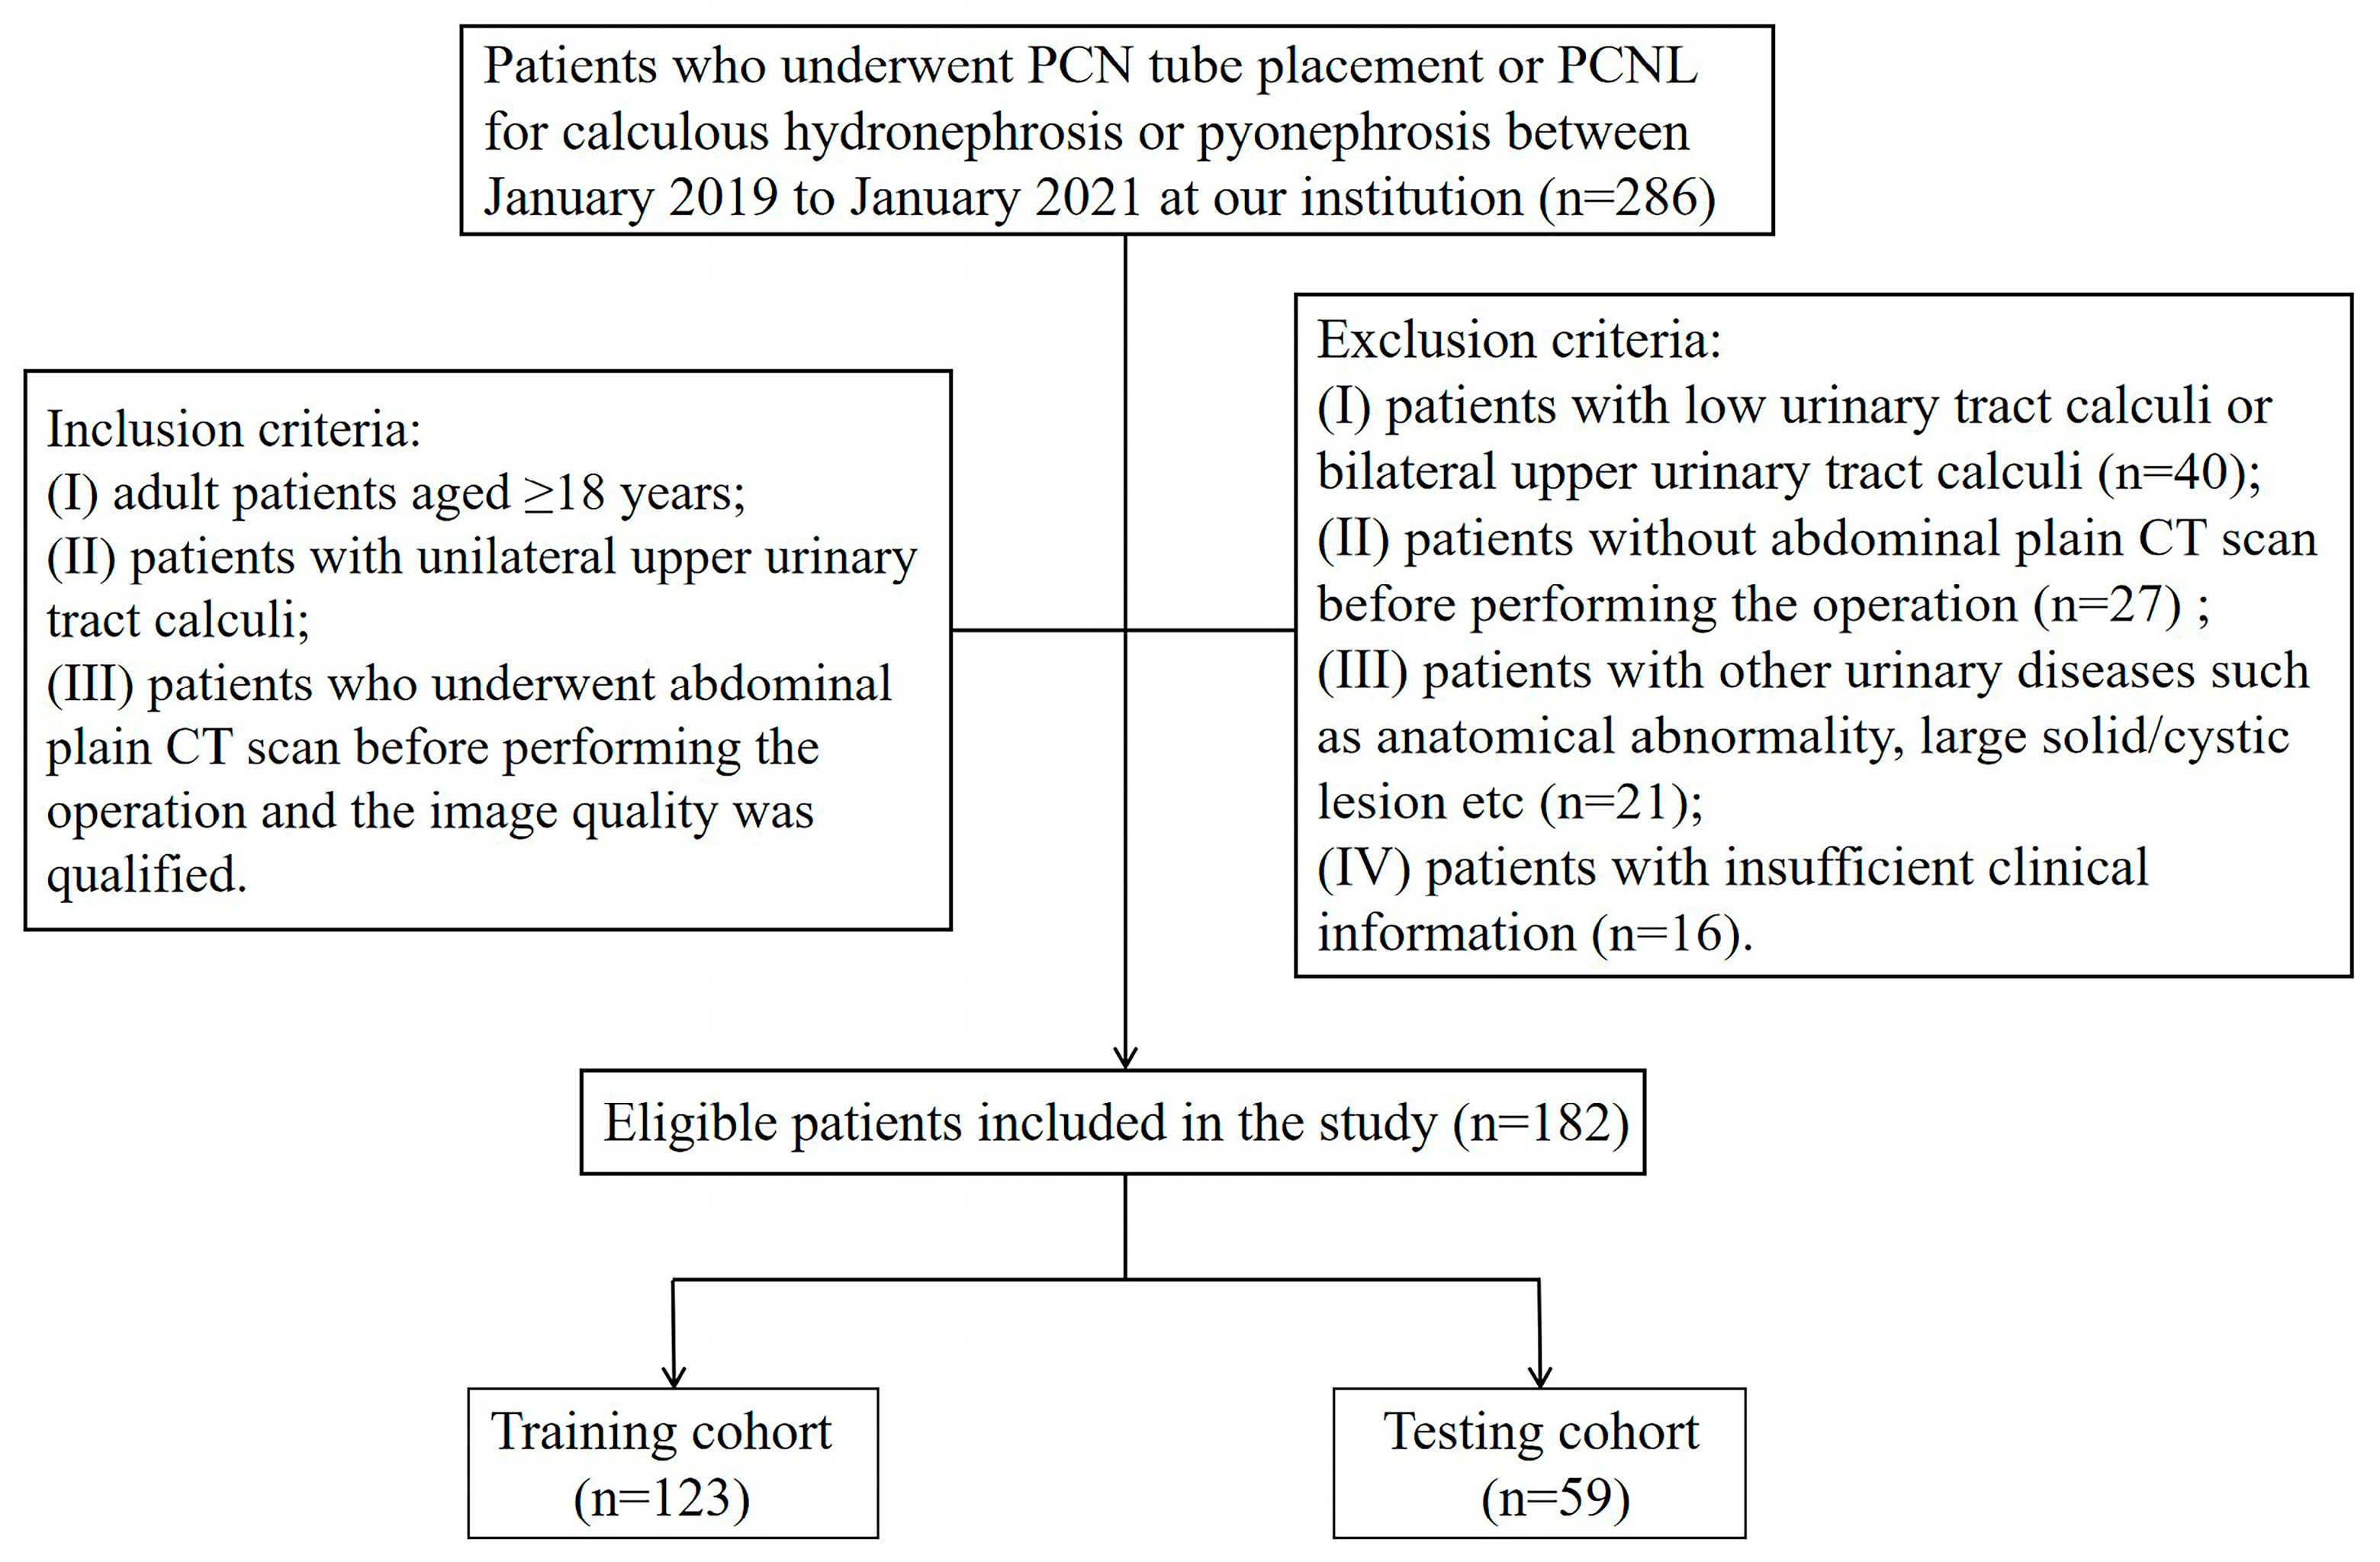
Figure 1. The flowchart for patient selection. PCN, percutaneous nephrostomy; PCNL, percutaneous nephrolithotomy; CT, computed tomography.
Bioengineering 11 00662 g001
Figure 2. The development and performance evaluation of machine-learning models. The region of interest (ROI) was manually delineated. Radiomics features were extracted based on ROI, and features were selected through LASSO algorithm to calculate radiomics score. The coefficient distribution chart for radiomics features was displayed, where colored lines indicate different features and show the change in their coefficients across various levels of regularization. The 3D-CNN was also applied and the specific framework was listed. The performance of models was compared using ROC and DCA. GLDM, gray-level dependence matrix; GLSZM, gray-level size zone matrix; GLCM, gray-level co-occurrence matrix; NGTDM, neighborhood gray-tone difference matrix; GLRLM, gray-level run length matrix; LASSO, least absolute shrinkage and selection operator; 3D-CNN, three-dimensional convolutional neural network; ROC, receiver operating characteristic; DCA, decision curve analysis.
Bioengineering 11 00662 g002
Figure 3. ROC curves of the clinical model, radiomics model, 3D-CNN model, HU, and clinical machine-learning model in the training (a) and testing (b) cohorts. 3D-CNN, three-dimensional convolutional neural network; ROC, receiver operating characteristic; AUC, area under the curve.
Bioengineering 11 00662 g003
Figure 4. The Rad-score of the pyonephrosis and hydronephrosis groups in the training (a) and testing (b) cohorts. Rad-score: radiomics score.
Bioengineering 11 00662 g004
Figure 5. The developed nomogram based on the clinical machine-learning model to predict the risk of pyonephrosis. For example, locate the patient’s neutrophils count on the “Neutrophils” axis. Draw a line straight upward to the “Points” axis to determine how many points are received for the patient’s neutrophils indicators. Conduct a similar process for other indicators. Sum the points calculated for each of the factors and track down the added sum on the “Total Points” axis. Draw a line straight down to find the patient’s risk probability of pyonephrosis.
Bioengineering 11 00662 g005
Figure 6. DCA curves of the clinical model, radiomics model, 3D-CNN model, HU, and clinical machine-learning model in the training (a) and testing (b) cohorts. The black line is the net benefit of assuming that all patients have pyonephrosis. The gray line is the net benefit of assuming that no patients have pyonephrosis. The red line, orange line, purple line, blue line, and green line represent the expected net benefit of predicting pyonephrosis using the clinical model, radiomics model, 3D-CNN model, HU, and clinical machine-learning model, respectively. DCA, decision curve analysis; 3D-CNN, three-dimensional convolutional neural network.
Bioengineering 11 00662 g006
Table 1. Characteristics of the patients in the training and testing cohorts.
CharacteristicsTraining Cohort
(n = 123)
Testing Cohort
(n = 59)
p Value
Age (years), median [IQR]54 (47–59)50 (42–60)0.138
Gender, n (%) 0.479
 Male64 (52.0%)34 (57.6%)
 Female59 (48.0%)35 (42.4%)
BMI (kg∙m−2)23.5 (21.5–25.5)23.1 (21.6–26.0)0.673
Fever 0.689
 Yes15 (12.2%)6 (10.2%)
 No108 (87.8%)53 (89.8%)
Renal colic 0.243
 Yes68 (55.3%)38 (64.4%)
 No55 (44.7%)21 (35.6%)
Hypertension 0.110
 Yes39 (31.7%)12 (20.3%)
 No84 (68.3%)47 (79.7%)
Diabetes 0.435
 Yes20 (16.3%)7 (11.9%)
 No103 (83.7%)52 (88.1%)
History of stone surgery 0.888
 Yes43 (35.0%)20 (33.9%)
 No80 (65.0%)39 (66.1%)
Stone laterality 0.710
 Left62 (50.4%)28 (47.5%)
 Right61 (49.6%)31 (52.5%)
Stone location 0.423
 Renal calculus30 (24.4%)19 (32.2%)
 Ureteral calculus31 (25.2%)14 (23.7%)
 Renal and ureteral calculus62 (50.4%)26 (44.1%)
Stone size (mm)15.2 (11.1–21.5)16.0 (11.0–19.0)0.807
Levels 0.486
 Mild/Moderate90 (73.2%)46 (78.0%)
 Severe33 (26.8%)13 (22.0%)
WBC (×109/L)6.06 (5.05–8.09)6.42 (5.24–8.11)0.544
Neutrophils (×109/L)58.9 (53.5–68.2)60.1 (53.6–68.4)0.709
Platelet (×109/L)226 (182–276)232 (171–279)0.569
Urine leukocyte (/µL)88.6 (37.8–321.2)150.4 (41.1–1111.9)0.129
Urinary nitrite 0.507
 Positive12 (9.8%)4 (6.8%)
 Negative111 (90.2%)55 (93.3%)
Urine culture 0.693
 Positive26 (21.1%)14 (23.7%)
 Negative97 (78.9%)45 (76.3%)
Abbreviations: IQR: interquartile range; BMI: body mass index; WBC: white blood cell.
Table 2. Univariate and multivariate logistic regression analysis of clinical factors for pyonephrosis.
CharacteristicsUnivariate AnalysisMultivariate Analysis
OR (95% CI)p ValueOR (95% CI)p Value
Age (years)1.011 (0.978–1.044)0.524
Gender2.168 (0.965–4.870)0.061
BMI (kg∙m−2)0.924 (0.822–1.039)0.188
Fever15.636 (4.058–60.258)<0.001 *24.436 (4.405–135.547)<0.001 *
Renal colic1.444 (0.644–3.236)0.373
Hypertension1.500 (0.655–3.436)0.338
Diabetes1.974 (0.727–5.361)0.182
History of stone surgery1.720 (0.764–3.872)0.190
Stone laterality1.203 (0.545–2.656)0.646
Stone location0.705 (0.319–1.562)0.390
Stone size (mm)1.038 (0.988–1.092)0.140
Hydronephrosis3.114 (1.328–7.300)0.009 *
WBC (×109/L)1.247 (1.092–1.425)0.001 *
Neutrophils (×109/L)1.107 (1.061–1.155)<0.001 *1.107 (1.047–1.171)<0.001 *
Platelet (×109/L)1.005 (1.001–1.009)0.033 *
Urine leukocyte (/µL)1.001 (1.000–1.002)0.002 *1.001 (1.000–1.002)0.003 *
Urinary nitrite2.020 (0.594–6.864)0.260
Urine culture2.922 (1.181–7.228)0.020 *
Abbreviations: OR: odds ratio; CI: confidence interval; BMI: body mass index; WBC: white blood cell. The character of “*” indicates a statistically significant difference.
Table 3. Diagnostic performances of different models in the training cohort.
ModelTraining Cohort (n = 123)
AUC (95% CI)pα Value Sensitivitypβ Value Specificitypγ Value
Clinical model0.904 (0.837–0.950)0.866 a0.8530.549 a0.8650.210 a
Radiomics model 0.912 (0.848–0.956)0.065 b0.7650.063 b0.9440.375 b
3D-CNN model1.000 (0.970–1.000)0.018 c*1.000/1.000/
HU0.747 (0.660–0.821)0.007 d*0.765>0.999 d0.607<0.001 d*
Clinical machine-learning model0.975 (0.929–0.994)0.019 e*0.9120.687 e0.9000.607 e
Abbreviations: AUC: area under the curve; CI: confidence interval; 3D-CNN: three-dimensional convolutional neural network; HU: Hounsfield Unit. pα: the comparison of AUC; pβ: the comparison of sensitivity; pγ: the comparison of specificity. a: the comparison between clinical model and radiomics model; b: the comparison between radiomics model and clinical machine-learning model; c: the comparison between radiomics model and 3D-CNN model; d: the comparison between radiomics model and HU; e: the comparison between clinical model and clinical machine-learning model. The 3D-CNN model is based on training cohort to learn image features of hydronephrosis or pyonephrosis and is not suitable for comparing sensitivity and specificity with other models using McNemar’s test. The character of “*” indicates a statistically significant difference.
Table 4. Diagnostic performances of different models in the testing cohort.
ModelTesting Cohort (n = 59)
AUC (95% CI)pα Value Sensitivitypβ Value Specificitypγ Value
Clinical model0.889 (0.781–0.956)0.852 a0.842>0.999 a0.8250.774 a
Radiomics model 0.876 (0.765–0.948)0.061 b0.895>0.999 b0.7750.219 b
3D-CNN model0.599 (0.463–0.724)0.003 c*0.5260.039 c*0.750>0.999 c
HU0.578 (0.442–0.705)0.002 d*0.947>0.999 d0.250<0.001 d*
Clinical machine-learning model0.967 (0.884–0.996)0.045 e*0.9470.500 e0.8750.687 e
Abbreviations: AUC: area under the curve; CI: confidence interval; 3D-CNN: three-dimensional convolutional neural network; HU: Hounsfield Unit. pα: the comparison of AUC; pβ: the comparison of sensitivity; pγ: the comparison of specificity. a: the comparison between clinical model and radiomics model; b: the comparison between radiomics model and clinical machine-learning model; c: the comparison between radiomics model and 3D-CNN model; d: the comparison between radiomics model and HU; e: the comparison between clinical model and clinical machine-learning model. The character of “*” indicates a statistically significant difference.
Disclaimer/Publisher’s Note: The statements, opinions and data contained in all publications are solely those of the individual author(s) and contributor(s) and not of MDPI and/or the editor(s). MDPI and/or the editor(s) disclaim responsibility for any injury to people or property resulting from any ideas, methods, instructions or products referred to in the content.