Article

Holistic Approach to Process Design and Scale-Up for Itaconic Acid Production from Crude Substrates

1
Fluid Process Engineering (AVT.FVT), RWTH Aachen University, 52074 Aachen, Germany
2
Biochemical Engineering (AVT.BioVT), RWTH Aachen University, 52074 Aachen, Germany
3
Process Systems Engineering (AVT.SVT), RWTH Aachen University, 52074 Aachen, Germany
4
Forschungszentrum Jülich, Institute of Bio- and Geosciences IBG-1, 52428 Jülich, Germany
*
Author to whom correspondence should be addressed.
These authors contributed equally to this work.
Bioengineering 2023, 10(6), 723; https://doi.org/10.3390/bioengineering10060723
Submission received: 15 May 2023 / Revised: 1 June 2023 / Accepted: 2 June 2023 / Published: 14 June 2023
(This article belongs to the Special Issue Design, Optimization and Scale-Up of Industrial Bioprocess)

Abstract

:
Bio-based bulk chemicals such as carboxylic acids continue to struggle to compete with their fossil counterparts on an economic basis. One possibility to improve the economic feasibility is the use of crude substrates in biorefineries. However, impurities in these substrates pose challenges in fermentation and purification, requiring interdisciplinary research. This work demonstrates a holistic approach to biorefinery process development, using itaconic acid production on thick juice based on sugar beets with Ustilago sp. as an example. A conceptual process design with data from artificially prepared solutions and literature data from fermentation on glucose guides the simultaneous development of the upstream and downstream processes up to a 100 L scale. Techno-economic analysis reveals substrate consumption as the main constituent of production costs and therefore, the product yield is the driver of process economics. Aligning pH-adjusting agents in the fermentation and the downstream process is a central lever for product recovery. Experiments show that fermentation can be transferred from glucose to thick juice by changing the feeding profile. In downstream processing, an additional decolorization step is necessary to remove impurities accompanying the crude substrate. Moreover, we observe an increased use of pH-adjusting agents compared to process simulations.

Graphical Abstract

1. Introduction

Bio-based bulk chemicals such as carboxylic acids, amines and alcohols play an important role in the transition towards a circular bioeconomy [1]. They can potentially replace fossil-based chemicals in the packaging, food and pharmaceutical industry or build new functional materials [2,3]. However, the market share of bio-based bulk chemicals in 2019 was only at 1–2%, as they struggle to compete with fully integrated and established petrochemical processes [4]. Substrate availability is one primary impediment to implementing economically feasible production processes. While pure substrates are easy to process, they are predominantly destined for the food and feed industry and typically only used for small-scale, high-value biotechnological processes [4]. Using crude substrates from the food and agricultural industry provides a promising alternative [2,4,5,6,7,8].
For some processes, such as bio-ethanol production or baker yeast fermentation, using crude substrates is state-of-the-art [9,10]. In these processes, the product is usually captured by unit operations such as filtration and overhead distillation, where impurities originating from feedstocks play a minor role. However, in the field of organic acid production, the use of complex feedstocks poses additional challenges, as potential impurities such as other organic acids, pigments, salts and preservatives [11] can influence downstream processing (DSP) [12,13,14]. Furthermore, these impurities can also impact fermentation performance [15,16]. Thus, fermentation protocols tailored to crude substrates [6], reliable online analytics and efficient separation methods [17] must be developed and aligned to create sustainable and economically feasible processes [4].
This work presents an interdisciplinary method for process development, using itaconic acid (ITA) production with Ustilago sp. as a primary example. In contrast to an independent development of single unit operations, fermentation, online analytics and DSP are established in parallel and are guided by a conceptual process design. This allows a close collaboration of these three fields and a rapid process implementation. At first, a purification route is chosen that is suited for selective ITA separation from a broth with a multitude of side components. The process is modeled using Aspen Plus (V11) (Aspen Technology, Inc., Bedford). The model uses key performance indicators (KPI) from fermentations on glucose for different Ustilago sp. [18,19], to identify a cost-efficient organism [20]. Subsequently, the process with the favored organism is experimentally investigated at laboratory-scale, using real substrates. Ultimately, the process is scaled to 100 L fermentation volume and compared with laboratory-scale results. Challenges in bioprocess design with crude substrates are discussed and further optimization potential is described.
As a dicarboxylic acid with a methylene group, ITA is primarily used as a cross-linker in synthetic latex production [21,22]. However, if the production costs are reduced, it may be used as a versatile and promising starter molecule in the production of polymers and hydrogels [23,24,25,26,27]. Considerable potential also lies in replacing malic acid anhydride in polyester resin production [28,29,30]. This broad application potential makes ITA a suitable exemplary target compound for this work. Furthermore, it offers the opportunity to evaluate the influence of new production hosts and crude substrates on DSP feasibility.
Since the 1950s, ITA has been produced with Aspergillus terreus by batch fermentation [31,32]. Fermentations found in the literature reach industrially relevant titers and productivities of up to 160 g/L [33] and 1.15 g/(L·h), respectively, [34]. Alternatively, the process can be designed for high substrate yields of up to 0.715 gITA/gglucose [35]. Nevertheless, ITA production with A. terreus remains challenging, as extensive morphological control and, in the case of crude substrates, pretreatment is necessary for high productivity [31,33,36,37]. Additionally, A. terreus is classified into biosafety level 2 in some countries [38], making the implementation of biorefineries difficult. Recent efforts to circumvent these issues target the development of new production hosts [39,40,41]. Especially natural producers such as Ustilago sp. with their broad substrate spectrum and yeast-like growth profile show great potential [19,42,43,44,45,46,47,48,49]. In this work, two ITA producing organisms are compared in a techno-economic analysis demonstrating the effect of fermentation pH, yield and product titer on process feasibility. For fermentation at neutral pH, Ustilago maydis MB215 Δ c y p 3   Δ MEL Δ UA Δ d g a t   Δ P ria::Petef  Δ f u z 7  Petef mttA_K14 (U. maydis K14) from Becker et al. (2020) [19] is used. Ustilago cynodontis NBRC 9727 Δ f u z 7   Δ c y p 3  PetefmttA Pria1ria1 (U. cynodontis ITA Max pH) has the benefit of being much more acid-tolerant than U. maydis [18] and is therefore used to evaluate fermentation at low pH values. The most promising production organism from these strains is selected for experiments on real substrates.
In contrast to defined carbon sources, crude substrates differ enormously in their composition and seasonal availability [11,50]. They also vary regarding their regional availability [4]. As a result, transportation costs can be a deciding factor for the economic feasibility of biorefineries [51] and a regional implementation shows excellent potential. This work focuses on substrates available for a decentralized biorefinery in the German Rhineland. The region has a large agricultural sector and faces structural and economic changes due to phasing out of lignite mining. Before starting this research, multiple crude substrates are considered regarding their suitability and impurities. For this study, thick juice produced by sugar beet processing is selected as feedstock. Utilizing thick juice to produce ITA is favorable opposed to additional purification for the isolation of lower-value sucrose. Furthermore, it is locally available in large quantities and has a high sugar concentration. It also shows only minor impurities such as lactic acid and pigments, which nevertheless reflect typical challenges when processing crude substrates (Appendix A).

2. Materials and Methods

2.1. Fermentation and Cultivation

For fermentation and cultivation, all chemicals are purchased from Carl Roth GmbH & Co. KG (Karlsruhe, Germany). U. cynodontis NBRC 9727 Δ f u z 7 Δ c y p 3  PetefmttA Pria1ria1 is used for all cultivation experiments [44]. The composition of thick juice used for all cultivations can be found in Appendix A.

2.1.1. Cultivation Media

Cultivations are performed in a modified Verduyn medium as described by Geiser et al. (2014) [43]. The medium is composed of 0.8 g/L NH 4 Cl, 0.2 g/L MgSO 4 · 7 H 2 O, 0.01 g/L FeSO 4 · 7 H 2 O, 0.5 g/L KH 2 PO 4 , 0.1 vol% trace element solution and 0.1 vol% vitamin solution. The trace element solution contains 15 g/L TitriplexIII ©, 4.5 g/L ZnSO 4 · 7 H 2 O, 0.84 g/L MnCl 2 · 2 H 2 O, 0.3 g/L CoCl 2 · 6 H 2 O, 0.3 g/L CuSO 4 · 5 H 2 O, 0.4 g/L Na 2 MoO 4 · 2 H 2 O, 4.5 g/L CaCl 2 · 2 H 2 O, 3 g/L FeSO 4 · 7 H 2 O, 1 g/L H 3 BO 3 and 0.1 g/L KI. The vitamin solution contains 0.05 g/L D-biotin, 1 g/L D-calcium pantothenate, 1 g/L nicotic acid, 25 g/L myo-inositol, 1 g/L thiamine hydrochloride, 1 g/L pyridoxine hydrochloride and 0.2 g/L para-aminobenzoic acid. Flask pre-cultures contain 0.03 M 2-(N-morpholino)ethanesulfonic acid as a buffer at pH 6.5. Stirred tank reactor cultivations are supplemented by 1 g/L yeast extract and 0.05 vol% Antifoam 204. All media components are either autoclaved or sterile-filtered with a 0.2 µm cut-off filter (Millipore-Sigma, Burlington, VT, USA). Thick juice from sugar beets is kindly provided by Pfeifer & Langen GmbH & Co. KG (Jülich, Germany). It is autoclaved in undiluted form and used as the sole carbon source.

2.1.2. Cultivation Conditions

U. cyndontis ITA Max pH is stored in cryogenic cultures at -80 °C, containing 30 vol% of 500 g/L glycerol stock and 70 vol% culture grown on modified Verduyn medium. For each fermentation, one YEPS plate with 10 g/L yeast extract, 10 g/L peptone, 10 g/L sucrose and 20 g/L agar-agar is inoculated from one fresh cryogenic vial and cultivated at 30 °C for 48 h. From this plate, 500 mL shake flasks with 50 mL filling volume, containing Verduyn medium with 50 g/L sucrose from thick juice and 2 g/L NH 4 Cl for growth, are inoculated as pre-culture. The flasks are cultivated overnight at 30 °C and 300 rpm with a shaking diameter of 50 mm. The filling volume is then centrifuged in a Rotina 35 R centrifuge (Andreas Hettich GmbH & Co. KG, Tuttlingen, Germany) at 4000 rpm for 10 min. The pellets are suspended in 3 mL of the resulting supernatant and the fermentation is inoculated to an optical density (OD 600 ) of 0.25.
Small-scale cultivations are performed in a 2 L Sartorius BIOSTAT® stirred tank reactor (Sartorius AG, Goettingen, Germany) equipped with a six-blade Rushton turbine with a diameter of 45 mm and four baffles. The initial filling volume is 1 L and the temperature is kept at 30 °C. Dissolved oxygen tension (DOT) is regulated at >30% by increasing the stirring frequency from 400 or 800 to 1200 rpm. pH is controlled by adding 5 M NaOH or 2.5 M Mg(OH) 2 . Due to its low solubility in water, 2.5 M Mg(OH) 2 is pumped in a cycle to avoid settling of the crystals within the tubing for the respective fermentation. A second pump delivers the Mg(OH)2 solution from the primary cycle to the fermenter. Off-gas composition is determined with a DASGIP off-gas analyzer GA4 (Eppendorf SE, Hamburg, Germany). pH and DOT are measured using an Easyferm plus PHI K8 200 (Hamilton, Hoechst, Germany) and a VisiFerm DO ECS 225 probe (Hamilton, Hoechst, Germany), respectively.
Pre-cultures for the 100 L fermentation scale are performed in 2 L Sartorius fermenters as described above. The pre-culture is run with 50 g/L sucrose from thick juice and 2 g/L NH 4 Cl. After 24 h, the whole filling volume is used to inoculate a 100 L fermenter (Frings GmbH, Rheinbach, Germany) which is equipped with three six-blade Rushton turbines with a diameter of 150 mm and four baffles. Cultivations are performed with an initial filling volume of 105 L at 30 °C and a stirring rate of 285 rpm. pH is controlled by adding 5 M NaOH. OTR and CTR are determined by measuring the off-gas with a Rosemount™X-STREAM XEFD exhaust gas analyzer (Emerson Automation Solutions, Langenfeld, Germany). pH and DOT are monitored using a Polylite Plus H VP 120 Pt100 (Hamilton, Hoechst, Germany) and a VisiPro DO Ex 120 H2 probe (Hamilton, Hoechst, Germany).
Yield is calculated in gITA/gsucrose and also converted to the amount of glucose equivalents in gITA/gglucose eq.. For the calculation of glucose equivalents, it is assumed that water hydrolyzes sucrose into glucose and fructose and the utiliziation of fructose proceeds similarly to glucose. Both values are calculated using mass balances. Space-time yield (STY) is also calculated using mass balances. As a critical fermentation parameter, the respiratory quotient (RQ) [-] is calculated dividing the CO2 transfer rate (CTR) by the O2 transfer rate (OTR). These parameters are used to draw conclusions on the organism’s metabolic behavior, as has previously been demonstrated [52,53,54] (Appendix B). Samples taken during the cultivations are included in the mass balance calculations.

2.1.3. Offline Analytics

Samples for offline analysis are drawn from fermentation at regular intervals. All analyses are done in triplicates. For each sample, 2 mL fermentation broth is centrifuged at 14,000 rpm for 10 min in a Sigma 1–15 centrifuge (Sigma Laborzentrifugen GmbH, Osterode am Harz, Germany). The supernatant is filtered with a 0.2 µm cut-off filter (Millipore-Sigma, Burlington, MA, USA) and analyzed for sugars and organic acid content by high performance liquid chromatography (HPLC). HPLC analysis is performed using a Thermo Fisher Ultimate 3000 (Thermo Fisher Scientific Inc., Waltham, MA, USA) equipped with an ERC RefractoMax 520 RID (Shodex, Munich, Germany). For separation, a ROA-Organic Acid H+ (8%) column (300 × 7.8 mm) (Phenomenex, Torrance, USA) column is heated to 30 °C and used with a mobile phase of 5 mM H 2 SO 4 running at 0.8 mL/min. Cell pellets are dried at 80 ° C for 48 h and then weighed to determine cell dry weight (CDW).

2.2. Downstream Processing

Chemicals are purchased from VWR International GmbH (Radnor, PA, USA). Decolorization resins are obtained from Fisher Scientific GmbH (Schwerte, Germany), carbon powder activated is purchased from Thermo Fisher GmbH (Kandel, Deutschland) and activated vegetal charcoal from VWR International GmbH (Randnor, PA, USA). If not stated otherwise, all experiments are performed in triplicates.

2.2.1. Determination of Solubility for ITA and ITA Salts

For solubility measurements, 1 mol ITA is added to an aqueous solution of 1 L (deionized water or fermentation broth) in a 10 mL scale. To ensure full protonation of ITA, 200 µL 25 wt% M H2SO4 is added. The samples are stirred for 2.5 h in a water bath at defined temperatures. Subsequently, the supernatant is collected by filtration with a CHROMAFIL® Xtra H-PTFE 20/25 0.2 µm filter (MARCHERY-NAGEL GmbH & Co. KG, Düren, Germany). The amount of dissolved ITA is analyzed by HPLC. Solubility of MgITA, Na2ITA, K2ITA and CaITA is measured at pH > 7.0 to ensure only precipitation of ITA salts. Measurements are performed at 20 °C. For each salt, ITA and the base of the corresponding cation (Mg(OH)2, NaOH and Ca(OH)2) are combined step-wise according to the stoichiometry of the precipitating salt. The supernatant is analyzed by HPLC (Section 2.2.4) after each addition of ITA. The maximum solubility of the salt is reached when the ITA concentration in the supernatant does not increase further.

2.2.2. Development of a Decolorization Protocol

To screen decolorization agents, resins and charcoals are washed with 20 mL distilled water per g resin. Subsequently, 95% of the washing water is removed and an artificial screening solution is added. For the artificial screening solution, 260 g/L thick juice and 50 g/L ITA are combined and the pH is adjusted to 2.0 with H2SO4, corresponding to the pH after the first cooling crystallization step and the cooling crystallization of the associated mother liquor. The thick juice concentration corresponds to the production of 50 g/L ITA at a yield of 0.3 gITA/gglucose eq.. This composition leads to a high amount of impurities in relation to ITA, thus enabling the identification of efficient decolorization agents. The samples are incubated for at least 4 h on a LS-W orbital shaker (Küner AG, Birsfelden, Switzerland) at room temperature. Subsequently, the samples are centrifuged and vacuum filtrated at 0.2 bar with a CHROMAFIL® Xtra H-PTFE 20/25 0.2 µm filter (MARCHERY-NAGEL GmbH & Co.KG, Düren, Germany). To determine the degree of decolorization, absorption between 450 nm and 700 nm is measured and referenced to the solution before incubation with decolorization agents. To quantify ITA adsorption, samples are analyzed by HPLC (Section 2.2.4) before and after incubation (Appendix C).

2.2.3. Processing of Real Fermentation Broth

For laboratory-scale purification, the fermentation broth is centrifuged with a Rotina 35 R centrifuge (Andreas Hettich GmbH & Co. KG, Tuttlingen, Germany) at 4000 rpm for 10 min and then filtrated through a Merck SteritopTM 0.2 µm filter (Merck KGaA, Darmstadt, Germany). Concentration is performed by rotary evaporation with an IKA® RV10 auto HB rotary evaporator and an IKA® VACSTAR digital vacuum pump (IKA®-Werke GmbH & Co. KG, Staufen, Germany) at 60–65 °C and 100 mbar. For the main crystallization steps, ITA is concentrated to 316–395 g/L. For crystallization of the mother liquor, ITA is concentrated to 103–106 g/L. Subsequently, crystallizations are conducted using an EasyMax 102 Titration Calorimeter (Mettler Toledo, Columbus, OH, USA). A cooling rate of 0.3 K to reach 15 °C starting from 68 °C is applied. The stirrer speed is 300 rpm. The pH is controlled at pH 2.8 by adding 5 M HCl with a SIMDOS® O2 FEM 1.02 S pump (KNF Holding AG, Sursee, Switzerland) controlled by an InLab® Semi Micro pH electrode (Mettler Toledo, Columbus, OH, USA). The resulting crystals are separated from the mother liquor by filtration with a Whatman Grade 50 Thin filter (Cytiva Europe GmbH, Freiburg im Breisgau, Germany) and dried with a VT 6060 M VACUTHERM vacuum oven (Fisher Scientific GmbH, Schwerte, Germany) at 40 °C and 200 mbar vacuum for 72 h. For decolorization of the crystals, crystals are pooled and dissolved to a concentration of 80 g/L. A decolorization agent is added prior to stirring the solution for 4 h with a magnetic stirrer. The decolorization agent is removed by filtration with a Merck SteritopTM 0.2 µm filter (Merck KGaA, Darmstadt, Germany).
For scale-up, the broth from the fermentation in 100 L scale is filtered with a 37 channel atech α -Al 2 O 3 ceramic membrane (Atech Innovations GmbH, Gladbeck, Germany; type 37/3.8, 37 channels, length 1200 mm, outer diameter 41 mm, channel diameter 3.8 mm, pore size 0.2 µL). Filtration is performed with a feed flow of 80 L/min and a transmembrane pressure of 1.5 bar. The membrane is back-flushed with nitrogen for 1 s every minute to prevent cake formation. Evaporation and crystallization are performed using a crystallization system from Normag GmbH (Illmenau, Germany) with a 10 L vessel for crystallization. For pH shift, 30 wt% HCl is used. If not stated otherwise, cooling rates and temperatures are similar to laboratory-scale experiments. After crystallization, crystals are filtered with a 4–7 µm MN 1672 cellulose filter (MARCHERY-NAGEL GmbH & Co. KG, Düren, Germany). Subsequently, crystals are washed using saturated ITA solutions at 15 °C. Decolorization is performed by adding activated charcoal and stirring for 4 h. Finally, the charcoal is removed by filtration with Merck SteritopTM 0.2 µm filters (Merck KGaA, Darmstadt, Germany).
Mass flows are tracked along the process. To close mass balances, samples are analyzed by HPLC, pH and density measurements. All solid fractions are dried after filtration to determine the solid content. The purity of resulting crystals is derived by dissolving crystals in distilled water at a defined volume, followed by HPLC analysis. Yield and purity calculations can be found in Appendix D.

2.2.4. Offline Analytics in Downstream Processing

HPLC analysis is conducted in triplicates with an Agilent 1260 Infinity II (Agilent Scientific Instruments, Santa Clara, CA, USA) setup, using a G7112B binary pump, G7167A multisampler and a G7116A column compartment. For separation, a 5 µL sample is injected and analyzed with a carboxylic acid resin of 10 cm in length and 8 mm in diameter (CS Chromatography Service GmbH, Langerwehe, Germany) and 2.5 mM H2SO4 as eluent at a flow rate of 1 mL/min at 30 °C. A refractive index detector G7162A (Agilent Scientific Instruments, Santa Clara, CA, USA) is used for detection. Evaluation is performed with the Open Lab Software 3.4.5 (Agilent Scientific Instruments, Santa Clara, CA, USA). pH is measured at room temperature with a SevenCompact pH S220-Basic pH-meter (Mettler Toledo, Columbus, OH, USA) and an InLab® Micro pH electrode (Mettler Toledo, Columbus, OH, USA). Density measurements are conducted with a DMA48 density meter (Anton Paar, Graz, Austria) at 25 °C. Absorption is measured with a Lambda 25 UV/VIS Spectrometer at wavelengths between 450 nm and 700 nm (Perkin Elmer Inc., Waldham, MA, USA) and evaluated with the UV WinLab Software (Version 6.5).

2.3. Online Analytics

Raman spectroscopy is performed with a RXN2 Raman analyzer with a 400 mW, 785 nm laser (Endress+ Hauser, Reinach, Switzerland). The system has a fiber-optic cable and 0 mm focal length, 42 cm long and 12 mm diameter immersion optic. Raman spectra for calibration of the quantification models are acquired with 5 s acquisition time and three repetitions using HoloGRAMS version 3.2. Raman spectra pretreatment and IHM are done in PEAXACT version 5.7 (S-PACT GmbH, Aachen, Germany). A linear baseline model is applied. Recorded Raman spectra are evaluated quantitatively using Indirect Hard Modelling (IHM) [55,56,57]. For online measurements in the 100 L fermenter, the probe is fitted with a custom stainless steel adapter to adjust the immersion depth at the bottom of the fermenter vessel. Data are acquired with 1 s acquisition time and 15 repetitions, providing similar intensities to the calibration data but avoiding saturation of the CCD detector of the Raman analyzer. The spectral range is reduced to 800–1800 cm−1 to exclude the DOT signal between 1545 and 1565 cm−1 that originates from air.

3. Results and Discussion

The process development for ITA production on thick juice using Ustilago sp. is pursued as follows: Conceptual process design based on parameters derived from the literature and data from artificially prepared solutions, transfer to crude substrates and scale-up. The suggested procedure shall serve as an example for the development of other carboxylic acid processes on crude substrates and pinpoint vital challenges in the design of biorefinery processes.

3.1. Conceptual Process Design

At first, a purification route suitable for the selective separation of ITA from a significant fraction of impurities is chosen. An emphasis is put on the selection of the co-salt accumulating along the process due to the use of acid and base for pH control. Subsequently, the process is set up in Aspen Plus (V11) (Aspen Technology, Inc., Bedford, MA, USA). The model is used to pursue an operative cost analysis and to identify the economically most attractive microorganism, thereby guiding further experimental investigations with real substrates. This approach also allows for an evaluation of the main operative cost drivers at an early stage.

3.1.1. Selection of Purification Route

Various purification steps for carboxylic acids can be found in the literature: evaporation [58], extraction [59,60], adsorption/chromatography [61,62], nanofiltration [63], reverse osmosis [63,64], electrodialysis [65], precipitation and crystallization [60,66,67,68]. All of these methods are either concerned with the direct isolation of the carboxylic acid, the separation of the counter-ion accumulated through base addition during fermentation or the removal of water to concentrate the product solution. Independent of the chosen purification strategy, there are common issues to be considered between the different separation processes, such as the fermentation pH, the solubility of the target compound and its salts and the co-salt removal [58]. The evaluation of various process alternatives for the purification of ITA, as in Magalhaes et al. (2017) [69], is beyond the scope of this paper. Therefore, we investigate the challenges resulting from the use of crude substrates in the industrially applied multiple crystallization process as described by Okabe et al. (2009) [22,31]. Additionally, modifications necessary to transfer the process concept for ITA DSP from A. terreus to new production hosts are outlined in the following.
The pH during the carboxylic acid production phase in the fermentation is decisive for the ITA DSP. Since A. terreus produces ITA at a pH of <3.0 [34], the literature on ITA DSP [22,70] does not explicitly state pH control measures because the amount of base and acid added during fermentation and DSP is negligible. However, ITA fermentation with U. maydis and U. cynodontis is performed at pH 6.5 and 3.6, respectively, [18,19,71]. Consequently, more base is used to control the pH in fermentation. Additionally, the pH needs to be shifted by inorganic acid addition before the crystallization to protonate ITA species sufficiently. Due to this addition of inorganic base and acid, particular attention needs to be paid to the selection of the co-salt accumulating along the fermentation and purification sequence (Section 3.1.2). Based on these considerations and experimental data obtained from artificially prepared systems (Appendix E), a process flowsheet is derived (Figure 1).
After fermentation, the biomass is separated from the broth via sterile filtration. Subsequently, the broth is concentrated by evaporation. During this step, water is removed from the system so that an ITA concentration of 350 g/L is reached immediately after evaporation. The pH is then adjusted with an inorganic acid. In the crystallization, ITA concentration in the aqueous phase decreases, leading to an increase in pH. Therefore, the amount of pH-adjusting agent is chosen to reach a pH of 2.8 after crystallization. Below a pH of 2.8, ITA solubility stays constant [13] and a yield loss connected to a lack of protonated ITA is avoided. The broth is diluted by adding acid, resulting in an ITA concentration slightly below 350 g/L before crystallization. In the first cooling crystallization step, the temperature is decreased to 15 °C at a rate of 0.3 K/min. The suspension can then be fed to a solid–liquid separator. This sequence is repeated for the mother liquor to increase the overall process yield. However, it must be assured that the broth is concentrated just enough to avoid a simultaneous crystallization of ITA and the co-salt (Section 3.1.2).
Nevertheless, a subsequent purification sequence is necessary to obtain ITA crystals with high purity. Thus, the solid fractions are dissolved again but at an elevated temperature of 80 °C to allow for high ITA concentration and avoid a large heat requirement for water removal in the following process steps. To purify ITA further, the aqueous system undergoes a decolorization treatment. During this step, the temperature is kept at 80 °C preventing simultaneous precipitation of ITA. In the final evaporative crystallization step, water is removed to generate supersaturation. Before initiating evaporation, ITA seeds are added to the solution to allow for a narrow particle size distribution. After crystallization, the mother liquor is recycled to the beginning of the DSP sequence. Residual moisture in the solid fraction is removed by drying.

3.1.2. Identification of Suitable Co-Salt for Multiple Crystallization Process

High-yield crystallization processes require feeds with sufficient product concentration. Thus, the fermentation broth is concentrated along the purification process by evaporation. However, this causes not just a growing concentration of ITA but also of nutrients and a co-salt, which originates from the cation of the base added to the fermenter and the anion of the acid for ITA protonation in DSP (e.g., Na2SO4). While remaining nutrients are present in low concentrations, the co-salt in carboxylic acid fermentations is present in up to equimolar amounts to the product. To avoid a simultaneous crystallization of ITA and the co-salt, the solubilities of those two components need to differ strongly. Either the co-salt crystallizes first while the product remains in the mother liquor or vice versa. Considering the moderate solubility of ITA [13], a proper co-salt either shows a very low or a very high solubility. The co-salt chosen further specifies the acid and base to be used in the process. Table 1 shows the solubility of common co-salts, which serve as a pool for the following selection process. To allow for a valid comparison between the co-salts, the molar concentration of ITA that can be processed before reaching the solubility limit of the co-salt is calculated and listed as molar ITA-eq. solubility in Table 1. For this, it is assumed that just as much base and acid have to be added to deprotonate and protonate ITA fully. For example, although Na2SO4 and KH2PO4 exhibit a similar molar solubility, the amount of ITA processed is more than twice as high for Na2SO4 than for KH2PO4 at the solubility limit, which is caused by phosphoric acid delivering only one proton to the system in the relevant pH range, while sulfuric acid provides two. Before choosing a co-salt from Table 1, the list is narrowed down by considering further criteria described below.
First, all ammonium salts can be excluded, as the product formation phase in ITA fermentation is initiated by nitrogen limitation [18,71]. Second, phosphates and nitrates are significantly more expensive in a direct cost comparison of the common inorganic acids (Table 2). Thus, their corresponding co-salts are also excluded.
Third, any cation fed to the system by using base should not be able to precipitate as ITA salt in the fermenter. While this approach removes ITA from the broth and reduces product toxicity, the system becomes highly viscous and biomass and product salt are hard to separate from each other [19,48]. The solubilities of typical ITA salts are experimentally determined (Table 3). While MgITA, Na2ITA, and K2ITA are highly soluble, only minor fractions of CaITA suffice to saturate the broth. Due to the inevitable challenges encountered during post-processing, Ca-salts are also excluded from further consideration as co-salt.
With respect to these criteria, no co-salt with very low solubility can be identified from Table 1, which limits the choice of co-salts to highly soluble alternatives and is consistent with the process concept suggested by Okabe et al. (2009) [22]. Within this process, the ITA yield in DSP is limited by the solubility of the co-salt. This advocates a high solubility difference between co-salt and ITA to be most suitable for the process. Consequently, MgCl2 can be identified as the most attractive option from Table 1 which sets Mg(OH)2 as base to be used in the fermentation and HCl as pH shift agent in the DSP. Additionally, MgCl2 offers the possibility to be thermally decomposed, recovering HCl and Mg(OH)2, instead of being disposed as saline waste [73].

3.1.3. Selection of Most Promising Production Organism

After a suitable purification route is selected and base/acid species for pH control can be derived from the co-salt selection, the most promising organism among the examined Ustilago sp. is determined before real substrate investigations are pursued. In this work, U. cynodontis ITA pH Max and U. maydis K14 are compared. In contrast to the corresponding wildtype strains, these organisms show no hydroxyparaconate formation, yeast-like growth and a greatly increased ITA production [18,71,74]. Moreover, for U. maydis K14, the theoretical yield of 0.72 gITA/gglucose is reached during the non-growing production phase due to a decreased synthesis of (glyco-)lipids [19]. Literature KPIs on the microbial conversion of glucose are provided in Table 4. Those KPIs comprise the pH of fermentation during product formation, final ITA product titer and overall fermentation yield. For both strains, better KPIs are available [18,19], however the KPIs in Table 4 are chosen because they are achieved under very similar pulsed-fed-batch conditions, thus allowing a better comparison.
Based on a direct KPI comparison, no clear decision for one organism can be made, as U. cynodontis ITA Max pH can produce ITA at favorable fermentation pH for DSP, but U. maydis K14 shows a higher yield and titer. Thus, it is necessary to identify the impact of each KPI on process economics and select the most suitable organism on the grounds of an operative cost analysis. Costs are calculated using the developed flowsheet model in Aspen Plus (Appendix F). Figure 2 displays the results of this analysis.
It becomes apparent that the pH-neutral fermentation of U. maydis K14 causes higher costs associated with acid/base use and saline waste. The lower energy requirement due to a higher product titer of U. maydis K14 does not compensate those additional costs. Moreover, both organisms’ substrate costs are comparable despite a higher fermentation yield of U. maydis K14. This can be explained by a higher DSP yield of 98.1% for U. cynodontis ITA Max pH, whereas U. maydis K14 attains a purification yield of only 89.8%. The yield difference originates in the second cooling crystallization. To avoid a co-crystallization of MgCl2, the preceding evaporation of water is limited. Since U. maydis K14 accumulates a larger fraction of co-salt in DSP, the ITA losses in the second cooling crystallization are significantly higher compared to U. cynodontis ITA Max pH. Overall, U. cynodontis ITA Max pH and U. maydis K14 achieve specific operational costs of 1.42 EUR/kgITA and 1.62 EUR/kgITA, respectively. Therefore, U. cynodontis ITA Max pH is considered for further process development with real substrates.

3.2. Transfer to Real Systems

The conceptual process design from Section 3.1 is based on literature data obtained from fermentation on glucose [18] and on experiments with artificially prepared ITA solutions (Appendix E). In the next step, the process is transferred to real substrates in laboratory-scale to prepare for scale-up and pinpoint technical challenges accompanying biorefinery process development with crude substrates.

3.2.1. Fermentation with U. cynodontis ITA Max pH at Laboratory-Scale

Following the techno-economic analysis (Section 3.1.3), a laboratory-scale fermentation is performed with U. cynodontis ITA Max pH as production organism (Figure 3) using a low nitrogen concentration [18]. Next to substrate concentration as well as ITA and biomass production, OTR, CTR and RQ are monitored. Biomass formation on glucose results in a RQ slightly above 1, while ITA production has a theoretical RQ of 0.66 (Equations (A7) and (A8)). The use of sucrose as the primary carbon source and the influence of impurities (Appendix A) on fermentation are discussed in the following.
ITA production is initiated by nitrogen limitation, dividing ITA fermentation into a growth and production phase [44,71]. On glucose, the growth phase of U. cynodontis ITA Max pH is not strongly affected by pH and can be conducted equally at pH 6.5 and 3.6 [74]. With thick juice as a substrate, even the acid-tolerant U. cynodontis ITA Max pH did not grow properly, which might be attributed to the lactic acid present in thick juice (Appendix A) exhibiting weak organic acid stress during the growth phase [75]. Therefore, the pH is kept at >6.5 at the beginning of the fermentation to ensure improved growth. The resulting exponential growth phase is mirrored in the exponential increase of OTR and CTR (Figure 3). In the work of Tehrani et al. (2019) [18], a drop in CO2 production correlated with the start of nitrogen limitation. Therefore, it is assumed that once the CTR decreases, nitrogen limitation initiates product formation. For optimal ITA production, a pH shift is introduced after 15.2 h of fermentation [18]. It allows the pH to drop to 3.6, where it is kept throughout the production phase. Even though nitrogen limitation is reached, the biomass increases further from 9 g/L to 18 g/L between 15.2 h and 43.1 h of fermentation, which is possible because the cells reduce their nitrogen content, as shown by Klement et al. (2012) [76]. The RQ is slightly above 1 and slowly decreasing, showing combined cell growth and increasing ITA production. As thick juice includes additional nitrogen (Appendix A), the biomass is twice as high compared to Tehrani et al. (2019) [18].
Thick juice contains sucrose as the primary substrate, which is cleaved into the monomers glucose and fructose. While up to 43.1 h of fermentation, sucrose is hydrolyzed, a nearly equimolar amount of fructose accumulates, while glucose is used up, making glucose a preferred substrate for ITA production. Fructose is used after glucose is depleted. The fermentation on two different carbon sources necessitates implementing a batch or an extended-batch fermentation for efficient substrate conversion. Feeding thick juice at a limited rate reduces STY, as the substrate uptake rate would be restricted and thus lower. Continuous overfeeding for a constant glucose concentration leads to a reduced substrate yield, as not all substrate is converted over the fermentation time due to product inhibition (Appendix G). Consequently, the feed is started after glucose is nearly depleted at 43.1 h of fermentation and terminated after 64.1 h when 62.1 g sucrose is fed into the fermenter. This termination allows a switch from glucose to fructose metabolism and, thus, a complete substrate conversion until the end of the fermentation. The RQ increases during the feeding, mirroring cell growth on additional nitrogen in thick juice (Appendix A). Simultaneously, the biomass increases further to reach a cumulative concentration of 27 g/L at the end of the fermentation. As both CTR and OTR decline until the end of fermentation, it can be assumed that cell viability also decreases due to weak organic acid stress. At the end of the fermentation, a titer of 66.6 gITA/L and a yield of 0.48 gITA/gsucrose are reached. Converted to glucose equivalents, the yield is at 0.46 gITA/gglucose eq.. Considering the additional biomass formation from nitrogen in thick juice, this is comparable to fermentations on glucose with a constant feeding profile and an ammonium chloride concentration of 4 g/L [18]. Yield and productivity of the process increase to 0.50 gITA/gsucrose when only the actual production time, starting from the pH shift until the end of the fermentation, is taken into account. This highlights the potential for in situ product removal [53,60], where the production phase is extended, leading to higher fermentation yields.
To increase the overall process yield, MgOH2 provides a viable alternative as pH-adjusting agent, as the fermentation broth can be further concentrated in the 2nd cooling crystallization (Section 3.1.2). To investigate the tolerance of U. cynodontis ITA Max pH towards Mg(OH)2 [58], an extended-batch fermentation on thick juice with U. cynodontis ITA Max pH is carried out with MgOH2 as a base (Appendix H). While growth and ITA production are possible, Mg(OH)2 shows low solubility in water at high pH values and is fed as a suspension, which presents challenges, especially regarding the blocking of tubing and pipes. Due to the increased difficulty in handling, further scale-up experiments are conducted with NaOH as a base to alleviate the proof-of-concept.

3.2.2. Decolorization Protocol

After fermentation with glucose, the fermentation broth shows a golden color. Two crystallization steps are sufficient to produce white crystals. On the contrary, fermentation broth with thick juice is of a dark brown shade due to multiple colored substances being present in the crude substrate (Appendix A and Appendix I). Crystals obtained from this more complex fermentation broth show a light to dark brown color as the pigments are incorporated into the crystals. Even though some of these pigments can be removed by applying multiple crystallization steps, as illustrated in Appendix I, developing a decolorization step is essential to obtain white crystals. While in the sugar industry, decolorization is usually implemented using anion exchange resins [77,78], decolorization in organic acid production is most commonly realized by adding activated charcoal [22,79,80,81]. However, similar to other carboxylic acids, ITA can adsorb at both types of these decolorization agents, reducing process yield and thereby economic feasibility [82] (Section 3.1.1). In this work, the potential yield loss is minimized by two measures. First, the decolorization step is located after dissolving ITA crystals obtained from the first cooling crystallization step and the cooling crystallization of the mother solution as described by Okabe et al. (2019) [22] (Section 3.1.1). As some pigments remain in the mother liquor of the crystallization steps, less decolorization agent is necessary. Consequently, less ITA can be removed from the process by adsorption to a decolorization agent. Second, different decolorization agents from both sugar and organic acid production are screened for sufficient pigment removal and minimum product loss. Two strong basic anion exchange resins and one weak basic anion exchange resin with a more hydrophobic binding site are compared to two kinds of activated charcoals. Additionally, one hydrophobic resin is compared to the activated charcoals (Table 5). Details regarding developing a screening protocol and the absorption behavior of thick juice can be found in Appendix C.
To enable parallel development of cultivation and DSP, an artificial broth at pH 2 (Section 2.2.2) is used for screening experiments. In the final process, the solution would be heated to 80 °C to facilitate the dissolution of ITA (Section 3.1.1) and to potentially reduce ITA adsorption (Appendix J). Nevertheless, due to potential difficulties in handling, especially in scale-up, experimental decolorization is conducted at 20 °C.
Figure 4a depicts the decolorization behavior of different decolorization agents. Both activated charcoals show satisfactory performance at wavelengths between 500 and 700 nm. At higher wavelengths, absorption showed a slight increase. The XAD-1180 resin depicts a similar behavior (Figure 4a). Anion exchange resins, however, cannot sufficiently decolorize the artificial broth at a resin concentration of 50 g/L. This can be correlated to the pigment composition in thick juice. They are expected to be of a hydrophobic nature at low pH values and thus not adsorb at ionic decolorization agents (Appendix A) [78,83,84]. Figure 4b illustrates ITA adsorption on decolorization agents. Activated charcoals adsorb up to 0.20 ± 0.02 gITA/gresin from artificially prepared broth, whereas the also hydrophobic XAD-1180 only adsorbs 0.04 ± 0.01 gITA/gresin. Characterization of ITA adsorption in artificially prepared systems reveals that mostly undissociated ITA is adsorbed on hydrophobic decolorization agents. Furthermore, ITA adsorption in artificially prepared systems is higher compared to the artificially prepared broth, indicating competitive adsorption of ITA and pigments (Appendix K). Corresponding to literature data [85], weak and strong anion exchange resins adsorb ITA. Combining this potential product loss with low decolorization performance, anion exchange resins are not further considered in the process development. XAD-1180, however, shows low ITA adsorption and good decolorization and is thus chosen for further experiments. Even though activated charcoals show an increased ITA adsorption, they also perform very well in decolorization. Therefore, XAD-1180 is measured against the best-performing charcoal AC-1.
To successfully implement decolorization into the process, the minimum amount of decolorization agent necessary is determined for AC-1 and XAD-1180. The re-dissolved crystals from fermentation on thick juice (Figure 3) are incubated with different resin concentration. Decolorization and yield loss are investigated. Figure 5a shows that even at high concentration, XAD-1180 cannot fully decolorize the ITA solution. Especially compounds absorbing light at low wavelengths remain in the solution as some pigments barely interact with the strictly hydrophobic XAD-1180 resin. Activated charcoals such as AC-1, on the other hand, contain multiple binding sites and can adsorb pigments with a wide variety of physiochemical properties (Figure 5b) [77,78,83]. As a result, only 4 g/L AC-1, but at least 40 g/ XAD-1180 are necessary to obtain a sufficient decolorization. When correlating the amount of resin to the potential yield loss as shown in Figure 5c, it is apparent that this would lead to a yield loss of 2.16 ± 0.02% for AC-1 and 7.00 ± 0.39% for XAD-1180. Accordingly, AC-1 at a concentration of 4 g/L is selected for the decolorization step. These findings highlight activated charcoals as promising candidates for decolorizing fermentation broth with crude substrates from the sugar industry. In future experiments, regeneration of activated charcoals, e.g., by solvents [86] or biological methods [87] must be evaluated.

3.2.3. Downstream Process Evaluation on Real Substrates at Laboratory-Scale

To prepare for scale-up, the fermentation broth produced in Section 3.2.1 is purified once by multiple crystallization in laboratory-scale. Besides using NaOH as a base, other process design specifications outlined in Section 3.1.1 and Section 3.1.2 are selectively amended to facilitate the laboratory-scale experiments. Instead of a continuous processing, the broth is purified sequentially in a batch-wise operation of the individual unit operations. Thus, a rotary evaporator and a titration unit are used for evaporation and crystallization, respectively. The titration unit is able to perform the cooling crystallization and the pH shift simultaneously. Appendix L shows an exemplary cooling crystallization profile. However, evaporative crystallization cannot be performed with the above applied equipment due to the separation of evaporation and crystallization. Therefore, the final evaporative crystallization is replaced by a third cooling crystallization at the present scale. The recycling of the mother liquor after the final crystallization is omitted due to the batch-wise processing of the fermentation broth. As stated in Section 3.2.2, dissolution and decolorization are operated at 20 °C instead of 80 °C.
The first and final crystallization step show similar yields of 91.62% and 93.64%, respectively. While no pH-adjusting agent is needed in the final crystallization, 300.4 mL 5 M HCl per liter of concentrated ITA solution are added to maintain a pH of 2.8 in the first pH-shift cooling crystallization (Appendix L). For the cooling crystallization of the mother liquor from the first crystallization, the yield is at 67.50%. The decrease in yield is caused by the limited evaporation necessary to avoid co-salt precipitation. As stated in Section 3.1.2, this decreases crystallization yield.
To evaluate the influence of crude substrates and fermentation-based side compounds, the expected crystallization yields calculated based on solubility data and the yields obtained at laboratory-scale are compared in Appendix E. If ITA solubility in artificially prepared systems is used for yield calculation, the experimental yields are well above the expected values. However, ITA solubility decreases in fermentation broth with thick juice. This may be due to the influence of salts from the fermentation medium and impurities from the substrate [13]. Furthermore, an increase in the use of pH-adjusting agents due to buffering substances in the fermentation broth can also contribute to changes in solubility (Section 3.3.3). Consequently, if solubility data from complex systems is used for yield calculations, predictions are more accurate. However, this is still insufficient to fully depict ITA yields in crystallization as water is evaporated to increase ITA concentration. This also leads to an increased concentration of side compounds not portrayed in solubility experiments with fermentation broth from crude substrates (Appendix E).
For decolorization, the yield is at 93.65%. As expected, the crystal purity of the dry solid fractions is slightly increasing over the process sequence from 97.65% in the first cooling crystallization to 98.57% in the final cooling crystallization. This is mirrored in crystal coloration (Appendix I). In future studies, recycling the mother liquor has to be considered to evaluate the influence of salts accumulating in the crystallization process on yield and purity.

3.3. Scale-Up and Comparative Assessment

The results from the conceptual process design and real substrate investigations in the laboratory are used to perform a scale-up to a fermentation broth volume of 100 L to demonstrate the feasibility of the production process for industrial application.

3.3.1. Scale-Up of Fermentation Process

The fermentation at elevated scale is performed using NaOH as a base. To allow for scale comparability, the stirring frequency is adapted to keep the volumetric power input constant during scale-up [88]. The aeration, however, is set to 1 vvm as in laboratory-scale experiments. As the volume of the fermenter decreases throughout operation due to evaporation, the aeration is adjusted accordingly. The filling volume is determined via the weight of the fermenter and spikes in the filling volume are visible when samples are taken (Figure 6). There is no effect of substrate overfeeding on U. cynodontis ITA Max pH metabolism observed in this work. Additionally, sufficient oxygen transfer can be realized (Appendix G). Thus, a batch process with an initial substrate concentration of 137 gsucrose/L from thick juice is performed to facilitate the first scale-up. Similar to laboratory-scale experiments, biomass formation, ITA production, OTR, CTR and RQ are monitored to reflect the overall metabolic activity (Figure 6). The following section will discuss the effects of the scale-up and the switch to batch fermentation mode.
The first 20 h of fermentation are comparable to fermentation in laboratory-scale (Section 3.2.1). Fluctuations in CTR are due to changes in pH value, as illustrated in Appendix M. The higher initial CDW is due to inoculation with 1 vol% instead of a specific OD. However, after the initiation of the nitrogen limitation, no increase in biomass is observed, resulting in a low CDW of 12.1 ± 0.4 g/L. The inoculation with a fully grown culture can partially explain the deviation from laboratory-scale experiments. The cells already experienced nitrogen limitation and may have changed their composition to adapt to nitrogen-limited conditions [76]. This difference in metabolic state is also reflected in OTR and CTR. Between 24 h and 125 h the CTR and OTR are decreasing from 17.8 to 9.4 mmol/(L·h) and from 18.2 to 11.4 mmol/(L·h), respectively. This leads to a constant RQ of approximately 0.8, indicating increased product formation compared to small-scale fermentation. As a result, nearly double the amount of ITA per g CDW is produced and the productivity nominated to CDW is higher as in laboratory-scale (Table 6). However, the fermentation attains a yield of 0.46 gITA/gsucrose (corresponding to 0.44 gITA/gglucose eq.) indicating more substrate being consumed for cellular maintenance, due to weak organic acid stress [89] and byproduct formation [90,91], which occurs to a large extent at the end of the fermentation. After 116.7 h, only 263 g ITA are produced, while 2.6 kg fructose are consumed. A sole substrate conversion for maintenance is unlikely due to the short time frame and no increase in the CTR. However, it has previously been shown that U. cynodontis can produce glycolipids [90,91] and, thus, more reduced hydrocarbons may be formed. This hypothesis is supported by the drop in the OTR, leading to an RQ well above 1.
The fermentation is terminated based on Raman spectra obtained during fermentation as described below (Section 3.3.2). At the end of the fermentation, 6.4 kg ITA at a STY of 0.35 g/(L·h) are produced. Considering overall yield, STY and titer, the batch fermentation at 100 L scale and the extended-batch fermentation in laboratory-scale behaved similarly (Table 6). The KPIs show the feasibility of the scale-up of an ITA fermentation with thick juice as the sole carbon source in batch mode.

3.3.2. Possibility of Fermentation Control by Raman Spectroscopy

As other crude substrates possibly show inhibitory effects, extended-batch fermentations should be established in the future. The termination of the feed needs to be closely timed to ensure a complete substrate conversion before product inhibition sets in. As crude substrates are subject to seasonal fluctuations that can influence the conversion rate and process yield [11], online analytics are indispensable for accurate feeding. Optical methods such as Raman spectroscopy show great potential, as they do not interfere with the process and provide highly time-resolved data [92]. However, the Raman spectra of various compounds overlap and more than simple univariate chemometric models are needed to translate the spectra into concentration data [92]. Nevertheless, Raman spectroscopy can be combined with indirect hard modeling (IHM) to quantify compounds with overlapping Raman bands [93]. To demonstrate the general feasibility of this method for biorefinery applications, the IHM approach from Echtermeyer et al. (2021) [93] for ITA is extended with sucrose, fructose and glucose (Appendix O). The coefficient of determination for all components is close to 1, indicating that the mixture hard model covers the underlying variance in the calibration data well (Table A4).
To evaluate the potential of controlling fermentation parameters by Raman spectroscopy, the Raman probe is assembled with the 100 L fermenter. Thus, the spectra contain not only the signal of the analytes ITA, glucose, fructose and sucrose but also the signal of other components in thick juice and media. More importantly, fluorescence resulting from thick juice and biomass also contributes to the spectra. As visible in Appendix P, this leads to a broad background that changes its shape over the fermentation time. By applying a linear baseline correction, the influence of fluorescence is reduced, thereby enabling the identification of prominent Raman bands of sucrose, such as the δ CH2 bending vibration at 1458 cm−1 or the ν C-C stretching mode at 835 cm−1 at the start of the fermentation (Figure 7a). The ν C=O stretching mode at 1697 cm−1 for ITA can be seen at the end of the fermentation (Figure 7b). These results enable the termination of the fermentation once sugar is depleted. Nevertheless, the characteristic Raman bands of the analytes are faint. While the model for artificially prepared systems is accurate, it is insufficient for quantitative Raman spectroscopy when dealing with crude substrates such as thick juice in a fermentation process. To establish a feeding profile controlled by Raman makes it necessary to remove the underlying fluorescence, e.g., by using a higher wavelength laser [94] or a mathematical approach, such as polynomial fitting [95] in future research.

3.3.3. Scale-Up of Downstream Process

As in laboratory-scale experiments, the broth is processed in a batch-wise operation without recycling of the mother liquor from the final crystallization. Decolorization is performed at 20 °C (Section 3.2.3). However, evaporation and crystallization are performed in one unit, enabling the implementation of an evaporative crystallization after decolorization. Additionally, ITA-saturated washing solutions remove the remaining solid content from the vessel walls after crystallization. The scale-up is accompanied by process simulations using the Aspen Plus flowsheet presented in Appendix F. The model is applied to determine the expected mass flows at elevated experimental scale and provides a benchmark for measured process variables. Except for the washing solutions, the model is adapted accordingly for a valid comparison of simulative and experimental results. The purification progress is illustrated in Figure 8, while Table 7 provides process yields from process simulation, laboratory-scale experiments and scale-up. Critical process parameters such as pH, ITA concentration and purity can be found in Table 8. For each purification step, results from scale-up are compared to simulation and laboratory-scale experiments.
In the first cooling crystallization, ITA is concentrated to 348.85 ± 2.71 g/L. The subsequent pH shift decreases ITA concentration to 294.65 ± 4.51 g/L. Crystallization results in a yield of 71.52%, which is considerably lower than 83.49% calculated by process simulations. This can be traced back to the pH shift, which requires 34% more HCl (30 wt%) than suggested by simulation, thereby diluting the solution for crystallization and reducing yield (Figure A4b). Beyond that, the lower yield in scale-up is caused by washing solutions (despite previous saturation with ITA), residuals in piping and losses due to filling and draining of vessels. The increased addition of HCl is also observed in laboratory-scale experiments (Section 3.2.3). However, due to a higher ITA concentration before acid addition, ITA concentration is reduced to 303.78 g/L and the reduced solubility in ITA complex systems can counteract this effect.
In the subsequent cooling crystallization of the mother liquor, the liquid fraction is concentrated to 210.55 ± 4.36 g/L. At this concentration, the solubility limit of NaCl provided by Table 1 (5.27 mol/L) should not be exceeded during the crystallization of the mother liquor. However, it appears that the theoretical solubility of the co-salt is strongly reduced by side components, which is also observed for ITA. As a result, the mother liquor leaving the crystallizer contains only 3.49 mol/L Cl. Inevitably, a co-crystallization occurs, reducing the crystal purity of the second solid fraction to approx. 31%. The co-crystallization also reduces the yield from 75.15%, as calculated in process simulations, to 57.15%. In laboratory-scale, ITA is only concentrated to 102.90 ± 0.15 g/L, avoiding co-crystallization. As the lower concentration is counteracted by decreased ITA solubility in complex systems, the yield loss in laboratory-scale compared to simulation is only small.
Decolorization in scale-up is performed after the dissolution of the solid fractions obtained from the first cooling crystallization and the crystallization of its mother liquor. Compared to laboratory-scale experiments, a high ITA yield of 98.41% is attained. As shown in Figure 8, the broth fed to the evaporative crystallization is very clear and darkens slightly after concentration. A yield of 87.93% corresponds well with process simulations and laboratory-scale experiments. The recovered ITA crystals show a high purity (Table 8) and are optically indistinguishable from commercially acquired ITA crystals.
In future works, scale-up should be performed using Mg(OH)2 as base in the fermentation allowing for a higher co-salt solubility and an overall higher ITA yield in the DSP. Additionally, the mother liquor from the final crystallization should be recycled to the first cooling crystallization to evaluate the accumulation of salts in the process and their influence on yield and crystal purity.

4. Conclusions and Outlook

A holistic approach to bioprocess development with crude substrates is presented using ITA production with U. cynodontis ITA Max pH as an example. A conceptual process design based on data from artificially prepared solutions and fermentations on glucose is used to guide experimental research and to identify main cost drivers early in process development. Over half of the production costs can be allocated to substrate costs, thus the yield shows the highest impact on process economics. By aligning pH-adjusting agents in fermentation and DSP, the process yield can be improved. Despite these insights from simulation, experimental data obtained with real systems is essential to adapt the process to the crude substrate, e.g., by developing a decolorization protocol. Furthermore, multiple carbon sources in the crude substrate prohibit the implementation of a linear feeding profile in the production phase. In this case, feeding controlled by Raman-based online analytics can provide a viable solution for process control. In future works, information obtained from experiments with real systems needs to be implemented into the conceptual process design. This process development strategy, as well as the central experimental findings of this paper, can be transferred to other, more diverse substrates such as molasses or wheat hydrolysates and new products. However, thick juice only shows comparatively few impurities. New challenges resulting from additional side compounds are to be expected.

Author Contributions

Conceptualization, K.M.S., R.K., P.-J.N., S.N., N.W., J.B. (Jochen Büchs) and A.J.; Data curation, K.M.S., R.K., P.-J.N., J.H. and J.G.; Formal analysis, K.M.S., R.K., P.-J.N. and J.H.; Funding acquisition, J.V., S.N., N.W., J.B. (Jochen Büchs) and A.J.; Investigation, K.M.S., R.K., P.-J.N. and J.H.; Methodology, K.M.S., R.K., P.-J.N., J.H., J.V., J.B. (Jochen Büchs) and A.J.; Project administration, K.M.S., J.B. (Johannes Brockkötter) and A.J.; Resources, J.V., J.B. (Jochen Büchs) and A.J.; Software, R.K., P.-J.N. and J.H.; Supervision, J.V., S.N., N.W., J.B. (Jochen Büchs) and A.J.; Validation, K.M.S., R.K., P.-J.N., J.H., J.V., J.B. (Jochen Büchs) and A.J.; Visualization, K.M.S., R.K. and P.-J.N.; Writing—original draft, K.M.S., R.K., P.-J.N. and J.H.; Writing—review and editing, K.M.S., R.K., P.-J.N., J.H., P.E., J.G., J.V., S.N., N.W., J.B. (Jochen Büchs) and A.J. All authors have read and agreed to the published version of the manuscript.

Funding

This research was funded by the Bundesministerium für Bildung und Forschung (BMBF), Germany in the project “UpRePP- Upcycling of Regional Waste Steams for the Production of Plattform Chemicals” in the project cluster “BioökonomieREVIER INNO: Entwickung der Modellregion BioökonomieREVIER Rheinland TP E” (Grant Number 031B0918E). Scale-up was enabled by the Major Research Instrumentation Programme (DFG-Gz: INST 222/1144-1 FUGB) as per Art. 91b GG in the Research Building NW1481006 “NGP2–Center for Next Generation Processes and Products”.

Institutional Review Board Statement

Not applicable.

Informed Consent Statement

Not applicable.

Data Availability Statement

All data concerning this manuscript are avaliable from the corresponding author upon reasonable request.

Acknowledgments

Special thanks goes to Daniel Sparviero who supported us in fermentation scale-up as well as to Aaron Weber, Robert Blaszczyk, Jesco Oelker and Marvin Volmert for their experimental support in scale-up and DSP development.

Conflicts of Interest

The authors declare no conflict of interest. The funders had no role in the design of the study; in the collection, analyses, or interpretation of data; in the writing of the manuscript, or in the decision to publish the results.

Abbreviations

The following abbreviations are used in this manuscript:
CDWCell Dry Weight
CFAConfirmatory Factor Analysis
CTRCO2 Transfer Rate
DOTDissolved Oxygen Tension
DSPDownstream Processing
GC-ToF-MSGas Chromatography Time-of-Flight Mass Spectrometry
glucose eq.Glucose equivalent of thick juice
HPLCHigh Performance Liquid Chromatography
ICIon Exchange Chromatography
ICP-OESInductively Coupled Plasma Optical Emission spectroscopy
IHMIndirect Hard Modelling
ITAItaconic Acid
ITAH2Fully protonated itaconic acid
ITAHSingle deprotonated itaconic acid
ITA2−Fully deprotonated itaconic acid
KPIKey Performance Indicators
LODiLimit of Detection
OTRO2 Transfer Rate
OD600Optical Density at 600 nm
RMSECiRoot mean squared error of cross-validation
RMSECViRoot mean squared error of leave-10% cross-validation
RQRespiratory Quotient
STYSpace-Time Yield
YYield

Appendix A. Substrate Analysis

Substrate analysis is performed using gas chromatography time-of-flight mass spectrometry (GC-ToF-MS) as published in de Wit et al. (2022) [96] for qualitative analysis of impurities. For quantitative analysis, inductively coupled plasma optical emission spectroscopy (ICP-OES) is used for cations while anions are quantified via ion exchange chromatography (IC). Additionally, NH4+ and PO43− concentration are determined by confirmatory factor analysis (CFA). HPLC according to Section 2.2.4 is used with a column of 30 cm length, 8 mm in diameter at a flowrate of 0.6 mL/min to quantify sugar and lactic acid content. The resulting data is depicted in Table A1. Density is determined to 1.3310 ± 0.0023 g/cm³ with a DMA48 density meter (Anton Paar, Graz, Austria) at 20 °C. Even though pigments are not detected using GC-ToF-MS, ICP-OES, IC, CFA or HPLC, thick juice shows a light to medium brown color. As it can be found in the literature, colorization of thick juice occurs during sugar production from the alkaline degradation of hexose sugars and Maillard reactions forming melanoidins [83]. Both compound groups have a large molecule size of over 2 kDa [83] and contain a variety of active groups such as carboxyl and aldehyde groups [83,84]. Furthermore, colourants not related to sucrose, e.g., phenols, flavonoids and melanin are present in crude substrates [78]. In both cases, due to their size and active groups, most of these molecules are expected to be of a more hydrophobic nature at low pH values.
Table A1. Composition of thick juice.
AnalyteMeasurementUnitMethod
Sucrose842 ± 8g/LHPLC
Glucose>1g/LHPLC
Fructose>1g/LHPLC
Lactic acid1.17 ± 0.13g/LHPLC
Cl0.048 ± 0.000wt%IC
NO30.0524 ± 0.01wt%IC
SO42−0.0833 ± 0.01wt%IC
Ca72.93 ± 1.00mg/kgICP-OES
Fe<2mg/kgICP-OES
K6660 ± 20mg/kgICP-OES
Mg12.11 ± 0.16mg/kgICP-OES
Na547 ± 3mg/kgICP-OES
P35 ± 3mg/kgICP-OES
NH4+0.0122wt%CFA
PO33−>0.0008wt%CFA

Appendix B. Calculations of Yield, STY, CTR, OTR and RQ for Fermentation Evaluation

To evaluate fermentative performance, yield, STY, CTR, OTR and RQ are calculated based on mass balances. Equation (A1) shows how to calculate the mass balance for a compound from fermentation.
m x ( t ) = c x ( t 0 ) · V L ( t 0 ) + c x , f e e d · V f e e d ( t ) t 0 t c x ( t ) · V s a m p l e ( t )
With m x ( t ) [g] as the calculated mass at time point t, c x ( t 0 ) [g/L] as the concentration of x at the beginning of the fermentation, V L (t 0 ) [L] as the initial filling volume, c x , f e e d [g/L] as the concentration of x in the feed and V f e e d ( t ) [L] as the added feeding volume at time t. Sampling is considered by summing up the substrate concentration c x (t) [g/L] times the corresponding sample volume V s a m p l e ( t ) [L].
The yield Y ( t ) [gITA/gsubstrate] can be calculated by dividing the mass of ITA produced by the summed up mass of the substrates glucose, fructose and sucrose (Equation (A2)).
Y ( t ) = m I T A ( t ) ( m g l u c o s e ( t ) + m f r u c t o s e ( t ) + m s u c r o s e ( t ) )
STY [gITA/(L·h)] is calculated by dividing the mass of ITA m I T A [g] by the sum of the filling volume V L [L] of the fermenter and the total sample volume V s a m p l e ( t ) [L] times the fermentation time t [h] (Equation (A3)).
S T Y ( t ) = m I T A ( t ) ( V L ( t ) + V s a m p l e ( t ) ) · t
Equations (A4) and (A5) describe the calculation of CTR and OTR using the gas flow rate into the fermenter q i n [L/h], the fermentation volume V L [L], the molar volume of an ideal gas V M [L/mmol] at 25 °C and the O2 and CO2 fractions in the inlet and outlet y O 2 , in , y O 2 , out , y C O 2 , i n and y C O 2 , out , [-], respectively.
C T R = q i n V F · V M · ( y C O 2 , o u t · 1 y O 2 , i n y C O 2 , i n 1 y O 2 , o u t y C O 2 , o u t y C O 2 , i n )
O T R = q i n V F · V M · ( y O 2 , i n 1 y O 2 , i n y C O 2 , i n 1 y O 2 , o u t y C O 2 , o u t · y O 2 , o u t )
Equation (A6) describes the calculation of the RQ corresponding to CTR and OTR.
R Q = C T R O T R
Equations (A7) and (A8) describe the RQ of growth on pure glucose. Calculations are based on the biomass composition from Klement et al. (2012) [76].
C 6 H 12 O 6 + 4.95 · O 2 + 0.1 · N H 4 + = C H 1.8 N 0.1 O 0.6 + 5 · C O 2 + 5.3 · H 2 O
R Q = C T R O T R = 5 4.95 = 1.01
Equations (A9) and (A10) describe the theoretical RQ of ITA production on pure glucose.
C 6 H 12 O 6 + 1.5 · O 2 = C 5 H 6 O 4 + C O 2 + 3 · H 2 O
R Q = C T R O T R = 1 1.5 = 0.67
ITA, sucrose, glucose and fructose concentration and CDW are analyzed in triplicates, mapping the error of pipetting and concentration measurements. Volumes are determined once. From there, fermentation KPIs are calculated and the mean is given. The standard deviation from the mean is also calculated and is below 5% for all values. OTR, CTR, DOT and pH are determined once for the corresponding fermentation time point.

Appendix C. Establishing a Protocol for Screening of Decolorization Resins

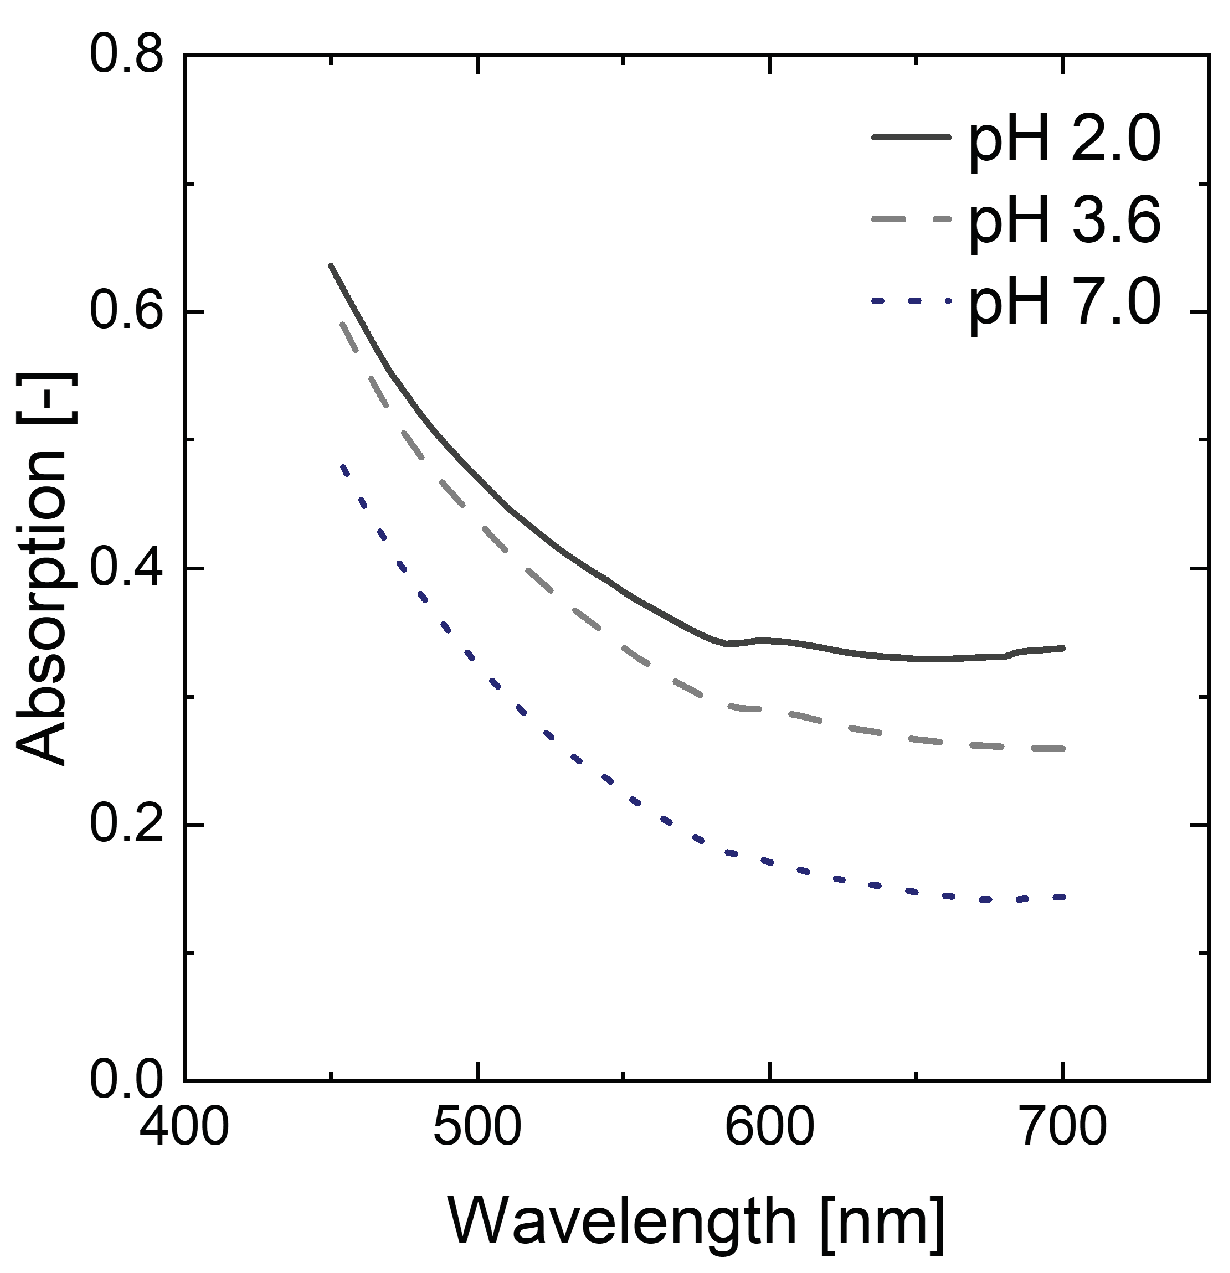
For characterization of the decolorization performance, adsorption is determined between 450 nm and 700 nm. ITA does not absorb light in this wavelength range and therefore does not contribute to the overall signal [97]. When the absorption of the artificially prepared broth prior to decolorization is investigated, no clear peaks can be identified (Figure A1). This suggests multiple compounds being involved in the colorization of the fermentation broth [79,83,84]. Furthermore, a pH dependence in adsorption is observed, indicating the presence of some pH sensitive compounds. As dilution of samples leads to a change in pH and thus adsorption, samples are measured in undiluted form. The remaining 5% of wash water are considered by diluting the reference solution accordingly.
Figure A1. Differences in adsorption from artificially prepared broth depending on pH.
Bioengineering 10 00723 g0a1
To determine the minimum incubation time, the XAD-1180 resin is used with artificially prepared broth in an exemplary study. As decolorization and ITA adsorption are constant after 4 h incubation time, the minimum incubation time is set accordingly (Figure A2).
Figure A2. Determination of minimum incubation time for decolorization.
Bioengineering 10 00723 g0a2
To calculate the resin loading with ITA L r e s [gITA/gresin], the remaining volume of washing water V w a s h [L] is considered in combination with the volume of the solution added for decolorization V a d d . [L], the ITA concentration before c t = 0 and after incubation c t = 1 and the amount of resin used m r e s [g]. (Equation (A11)).
L r e s = V F , c . a r t . · c t = 0 ( V a d d + V w a s h ) · c t = 1 m r e s i n
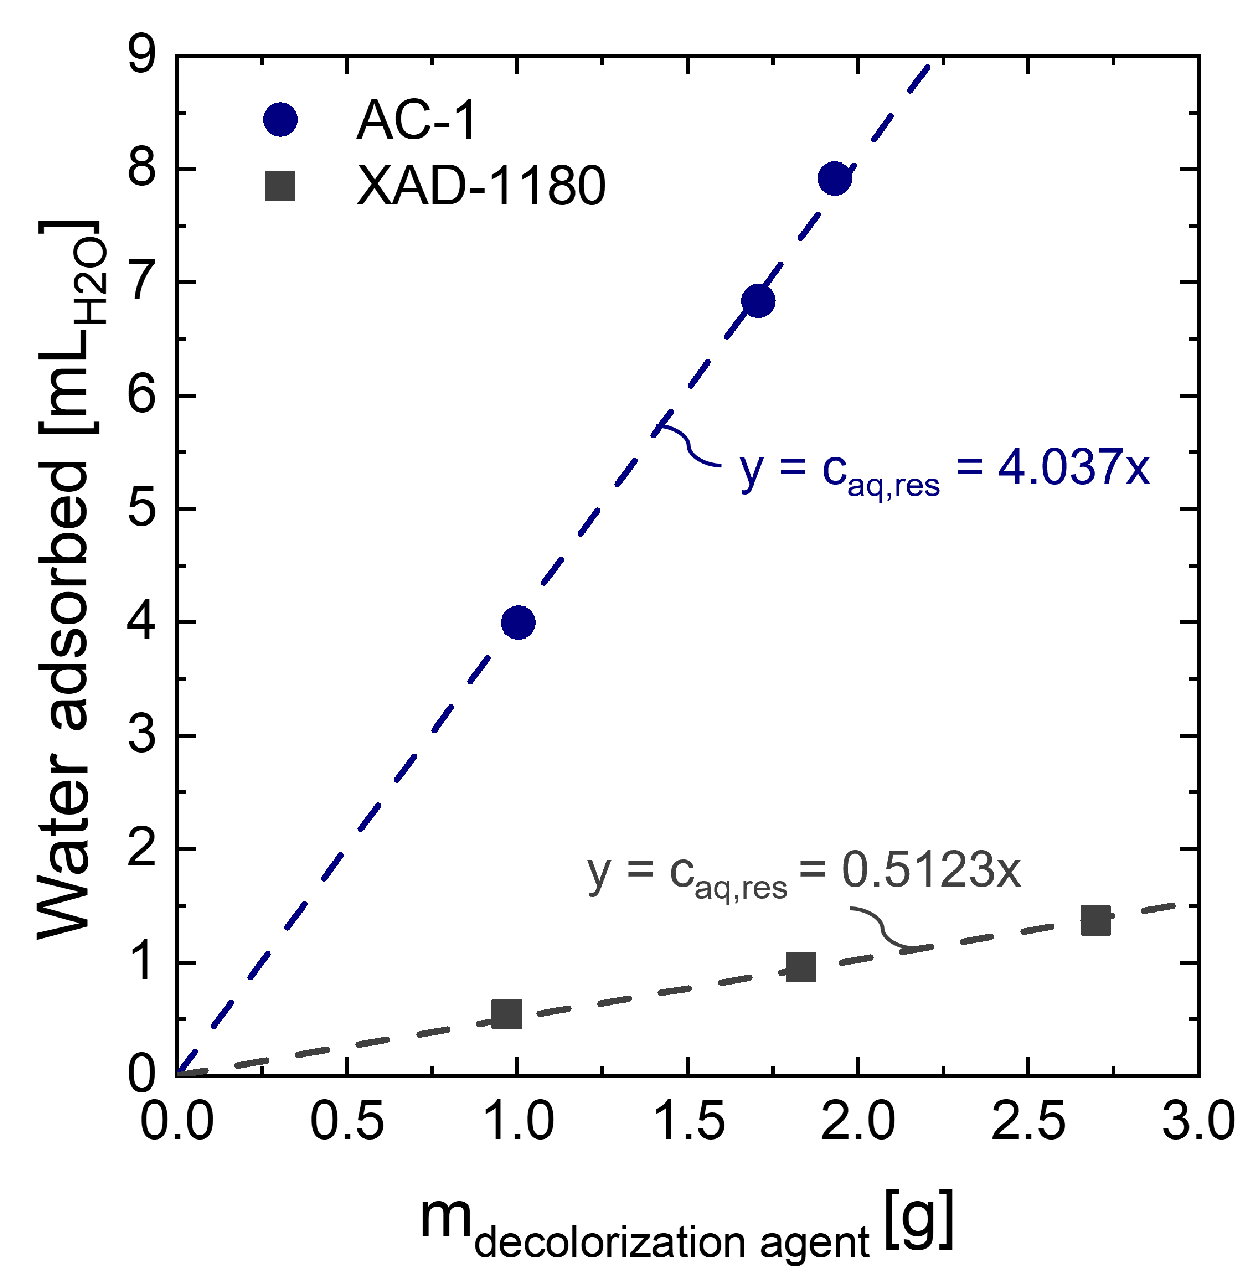
For yield calculations in decolorization depending on resin concentration, the amount of liquid remaining in decolorization agents after filtration and therefore contributing to yield loss is considered. Otherwise, process yield is overestimated. To determine the amount of liquid bound in the decolorization agent after filtration, different amounts of decolorization agent are incubated with water similar to the washing step in the screening experiments mentioned above. After vacuum filtration, the recovered water is quantified. To subtract the amount of water lost in the filter, the same filtration protocol is conducted with water only. In each filter, 4.0 ± 0.1 g distilled water are incorporated.
Yield calculation with yield loss due to water Y I T A , c is performed using the amount of water lost per g resin c a q , r e s , which can be deduced from the slope of the linear function in Figure A3 (Equation (A12)).
Y I T A , c = c I T A , t = 1 · ( V w a s h + ( V a d d c a q , r e s · m r e s ) ) V a d d · c I T A , t = 0
Figure A3. Water retained in XAD-1180 resin and AC-1 after incubation with distilled water.
Bioengineering 10 00723 g0a3

Appendix D. Calculation of Yield and Purity for Downstream Process Evaluation

A yield calculation for each unit operation is performed by dividing the mass of ITA after the unit operation t n + 1 [g] by the mass of ITA before the unit operation t n [g] to close the mass balance for each unit operation. The mass of ITA is calculated from the concentration c I T A [g/L], the density of the aqueous phase ρ a q [g/L] and the mass of the aqueous phase m a q [g] (Equation (A13)). The overall process yield was calculated based on the amount of ITA after cell separation. The standard deviations reflect errors in HPLC measurements.
Y I T A = c I T A ( t n + 1 ) · m a q ( t n + 1 ) ρ a q ( t n + 1 ) c I T A ( t n ) · m a q ( t n ) ρ a q ( t n )
Purity of ITA, P I T A [-], is calculated dividing the ITA concentration by the gravimetrically determined crystal concentration c c , g r a v [g/L].
P I T A = c I T A , H P L C c c , g r a v
Similar to fermentation, ITA, sucrose, glucose and fructose concentration are analyzed in triplicates, mapping the error of pipetting and concentration measurements. Absorption at different wavelengths and volumes are determined once. From there, DSP KPIs are calculated and the mean is given. The standard deviation from the mean is also calculated and is below 5% for all values.

Appendix E. Temperature-Dependent Solubility of Fully Protonated ITA in Pure and Complex Systems

For process modeling in Aspen Plus, solubility of fully protonated ITA is determined in distilled water. To be able to interpret experimental data with complex systems, solubility is evaluated in fermentation broth with glucose and thick juice (Figure A12).
Figure A4. (a) Temperature-dependent solubility of fully protonated ITA in water, fermentation broth with glucose and fermentation broth with thick juice. Fermentation broth with glucose is prepared according to Tehrani et al. (2019) [18] with an ammonium chloride concentration of 4 g/L at pH 3.6, fermentation broth with thick juice is obtained from Section 3.2.1. (b) Calculated yield depending on ITA concentration in the feed for systems shown in (a) correlated with actually obtained yields in laboratory-scale.
Bioengineering 10 00723 g0a4

Appendix F. Process Modeling in Aspen Plus and Techno-Economic Analysis

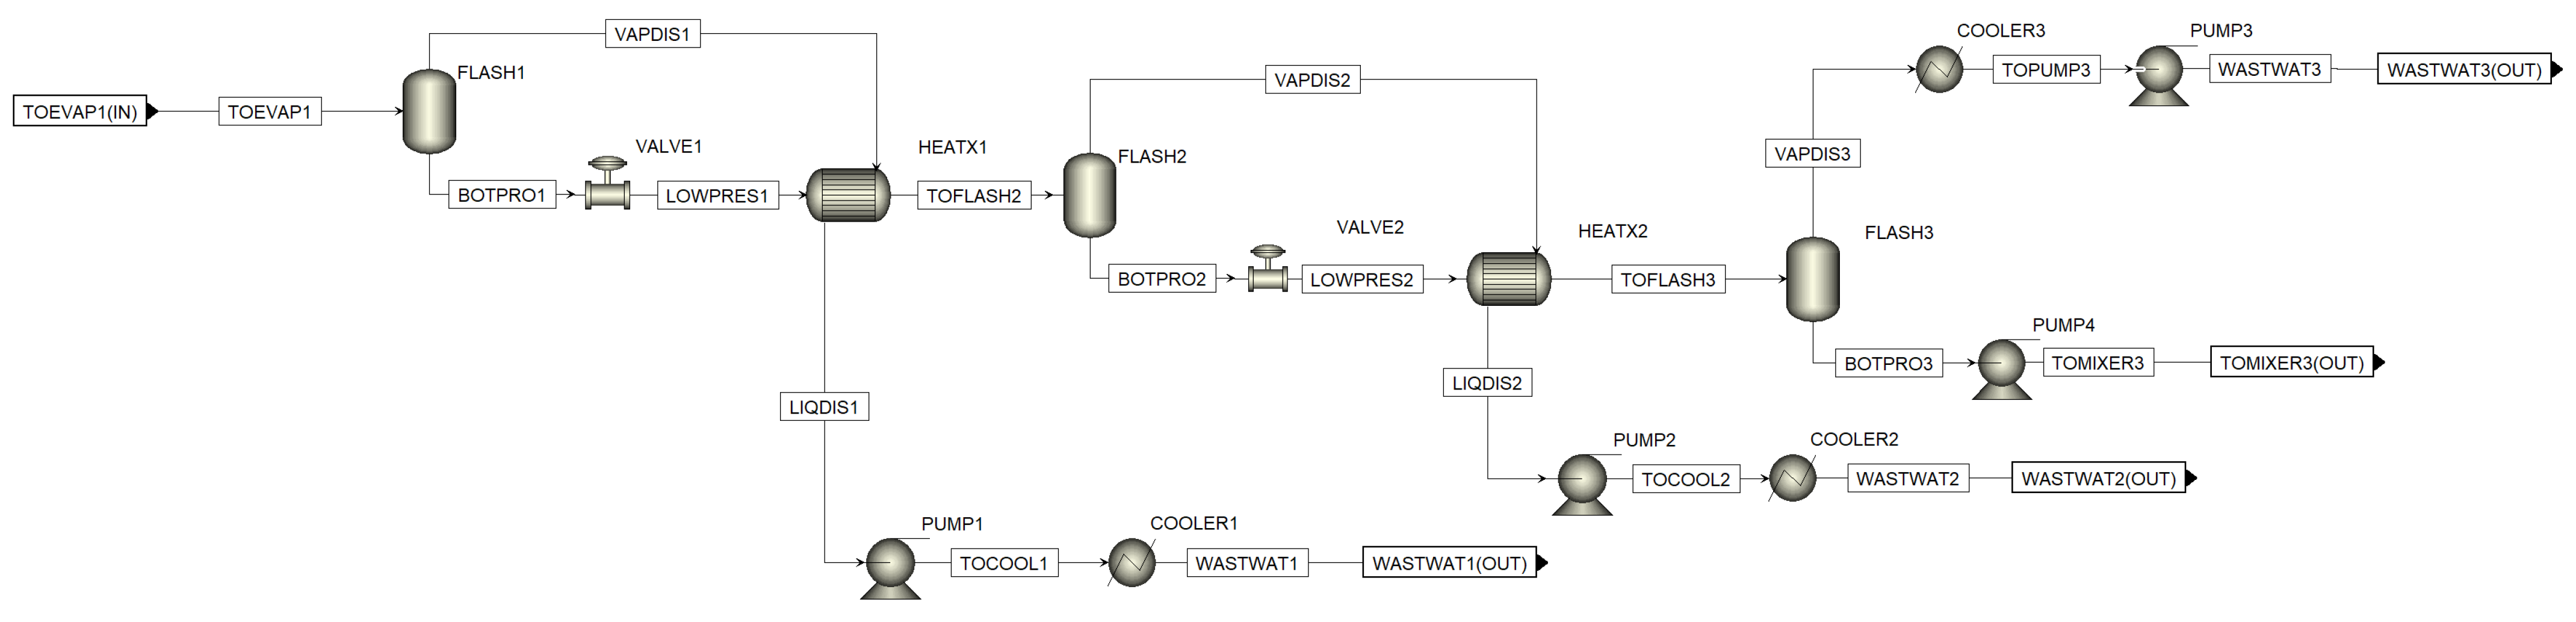
The flowsheet model is set up in Aspen Plus and displayed in Figure A5. ELECNRTL is used as global property method. UNIFAC is applied to determine missing binary interaction parameters. The Elec Wizard allowed the implementation of dissociation and precipitation behavior of inorganic components. Deprotonated ITA species are not available in Aspen component databanks. Thus, they are added by molecular structure. Respective dissociation reactions are set up in the global chemistry environment. For crystallization blocks, the method is locally adapted to SOLIDS.
Figure A5. Aspen process flowsheet of multiple crystallization process.
Bioengineering 10 00723 g0a5
The feed is modeled as glucose–water mixture representing the typical sugar content of thick juice (0.65 wt%). The water feed and base mass flows are defined by product titer and pH during product formation, respectively, (Table 4). The fermenter is implemented as RYIELD modeling the reaction as de-lumping of glucose to ITA and CO2. The overall yields in Table 4 are used as reaction coefficients. A full consumption of the sugar content is assumed. CO2 is isolated from the broth in a separator model. RESIDUES contains the residual sugar content that is not converted to ITA or CO2 and would in a real fermentation be used for biomass formation or maintenance metabolism. Additional nutrients such as NH4Cl are not considered in the simulation.
Steam is identified as the major energy cost driver in the presented process concept (Figure 2). 
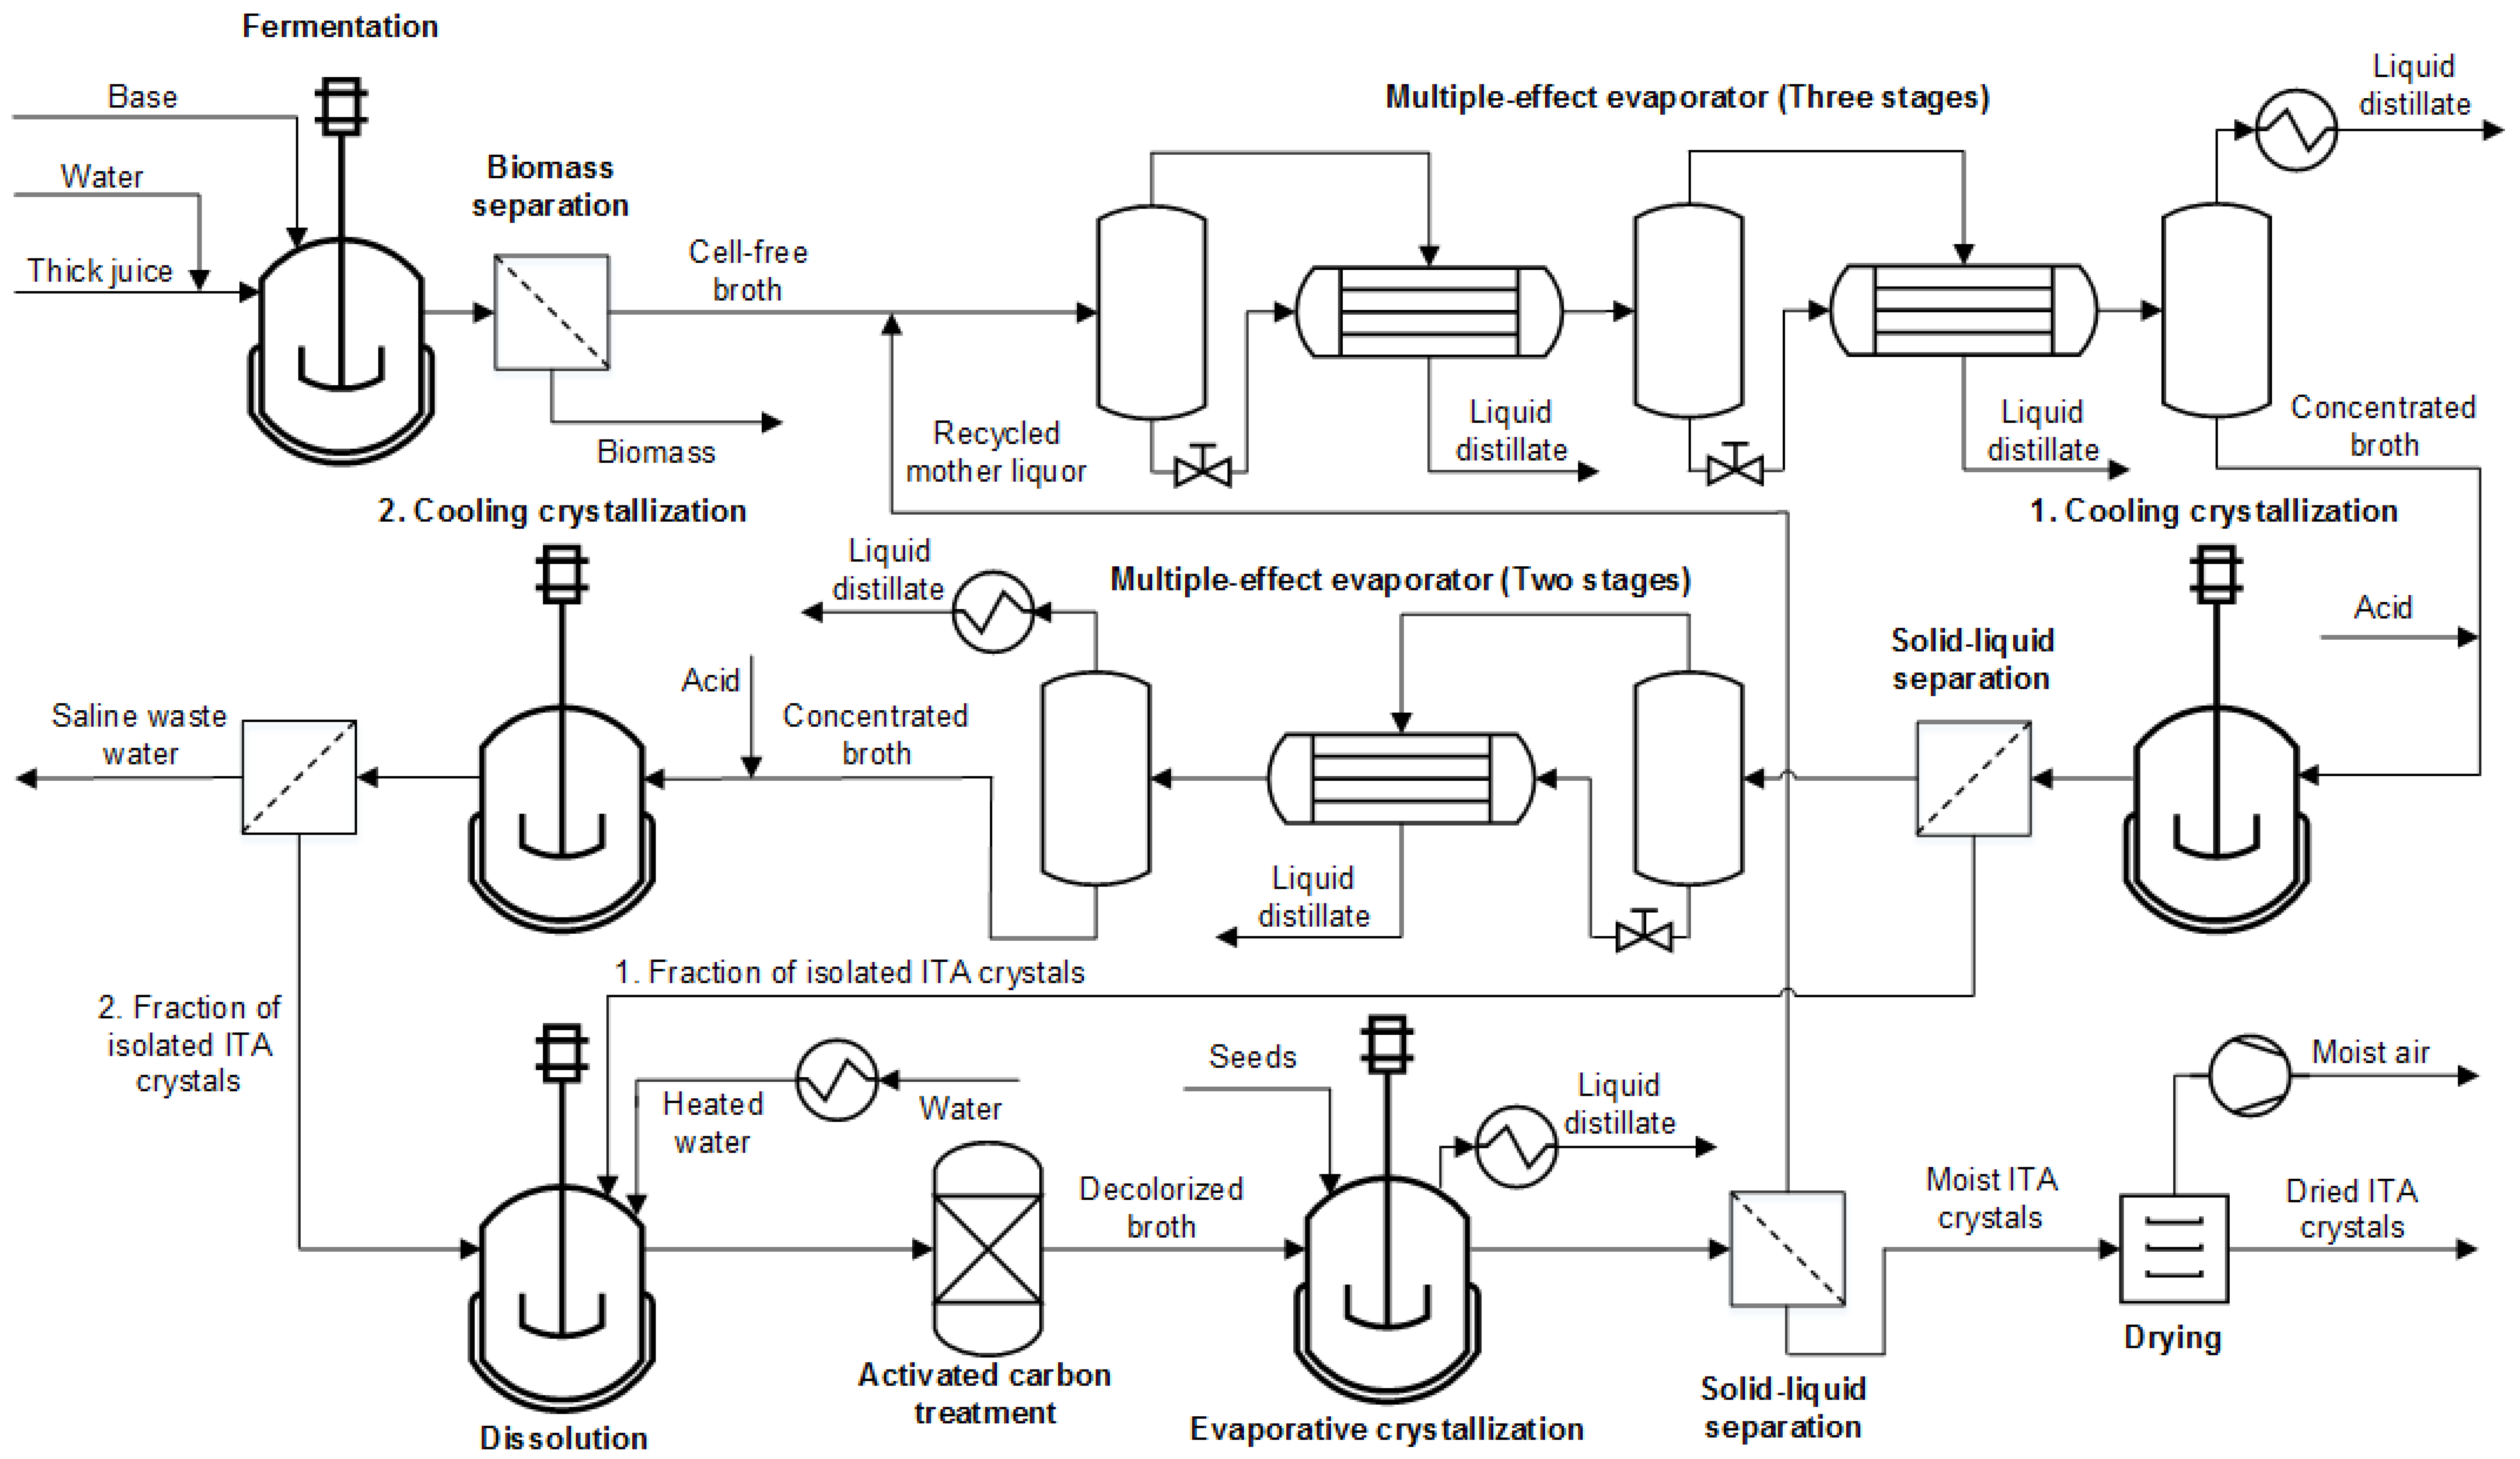
Figure A6 displays the steam consuming process steps. The evaporation steps in the first and second cooling crystallization sequence require the largest fractions of the total steam demand. Thus, we implement multiple-effect evaporators (MEE) for those concentration units to mitigate the energy requirement of the proposed process. For the purpose of flowsheet modeling, a three-stage and a two-stage MEE are implemented in the first and second cooling crystallization sequence reducing steam requirement by approximately 60% and 40% in comparison to simple flash evaporators, respectively. The pressure drop in each throttle is adjusted to just meet the minimum temperature requirement of 10 K in the heat exchangers. As described in Section 3.1.1, in the first MEE the final stage concentrates the broth up to a concentration of 350 gITA/L. However, in the second MEE the broth is concentrated so that the solubility limit of the co-salt MgCl2 is just not exceeded during the subsequent crystallization. That way, overall ITA yield is maximized. The Aspen flowsheets for the MEEs used in this process flowsheet are displayed in Figure A7 and Figure A8.
Figure A6. Gross steam requirement (without energy integration measures).
Bioengineering 10 00723 g0a6
Figure A7. Aspen process flowsheet of MEE in the first cooling crystallization sequence.
Bioengineering 10 00723 g0a7
Figure A8. Aspen process flowsheet of MEE in the second cooling crystallization sequence.
Bioengineering 10 00723 g0a8
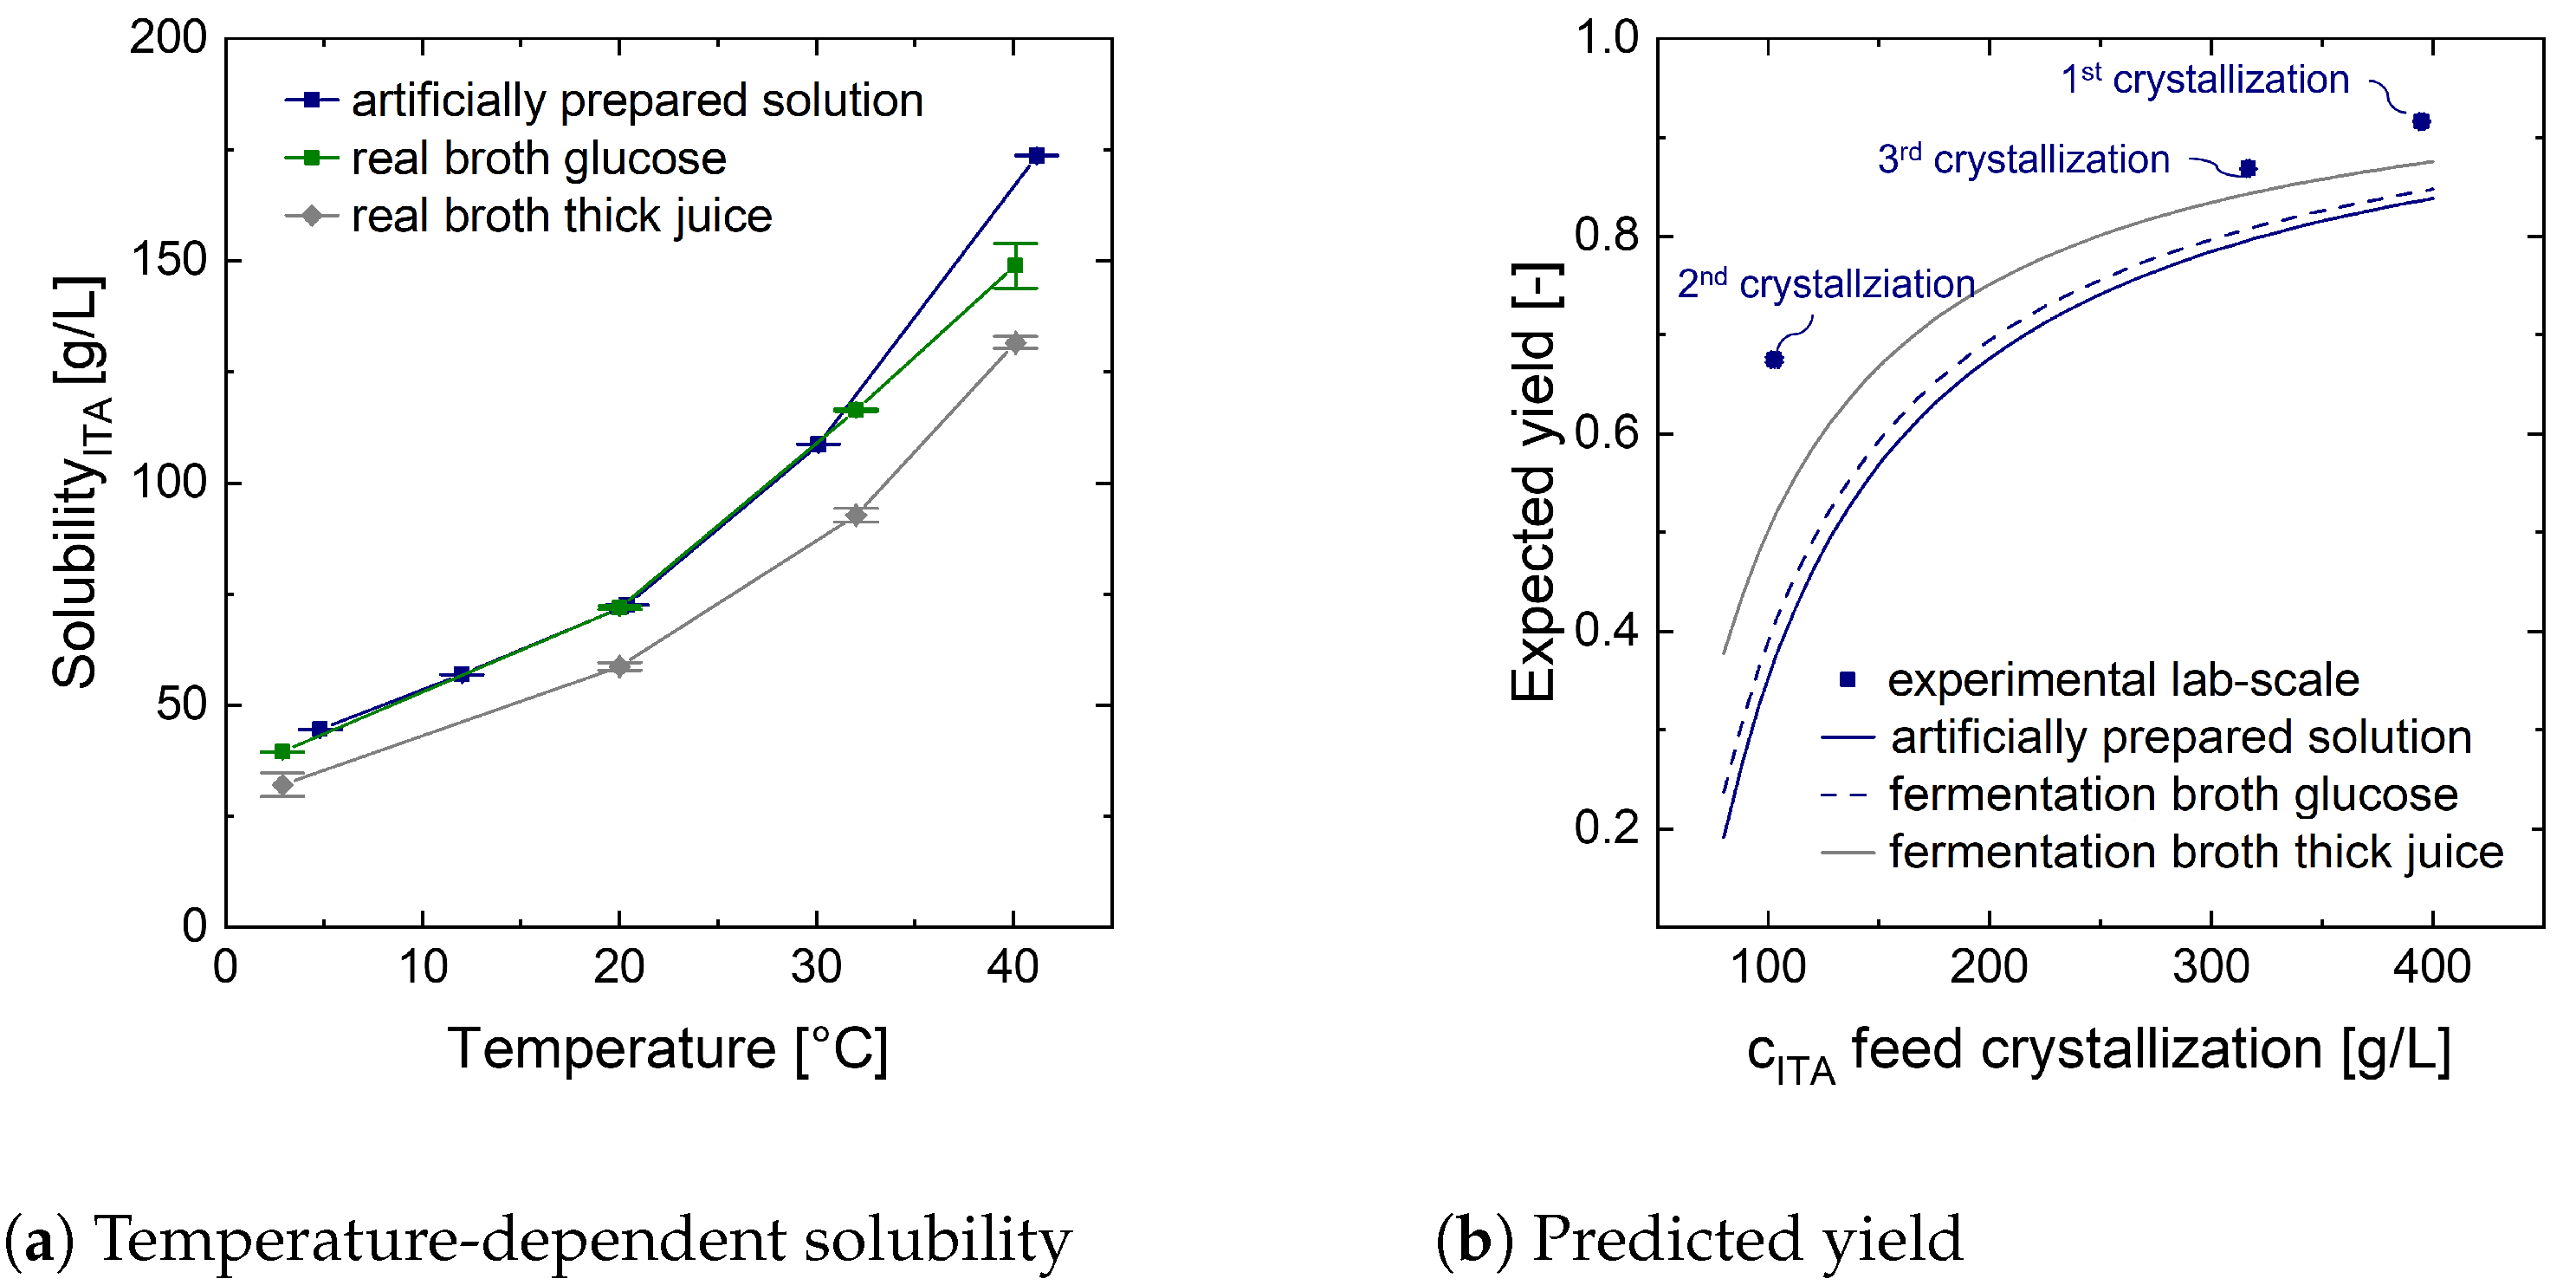
The cooling crystallization steps lower the temperature to 15 °C at 1 bar. The effluents are at solid–liquid equilibrium. The according data is experimentally determined with artificially prepared ITA systems (Figure A4a) and supplied to the model. After the second cooling crystallization sequence only the liquid fraction contains the co-salt which is then to be disposed. The saline mass fraction of this stream is priced with 110 EUR/tonne (Table A2). The solid fractions of the cooling crystallization sequences are mixed. Just enough water is added to the system until all solids are dissolved at 80 °C. The elevated temperature limits the amount of water to be evaporated in succeeding process steps. Afterwards the system is subject to an activated carbon treatment, which is only symbolically added to the Aspen flowsheet. Thus, the COLORG stream is a zero-flow. The stream is then fed to the evaporative crystallization which is operated at 80 °C. To reach an ITA yield of 90% after the crystallization, the vacuum pressure is selected accordingly. The seeds added amount to 5 wt% of the solids produced by the crystallizer. After solid–liquid separation, the mother liquor is recycled to the beginning of the DSP. Similar to the activated carbon adsorber, a dryer for ITA crystals is added to the flowsheet for symbolic reasons. Thus, MOISTAIR stream is a zero-flow.
To retrieve heat/cooling duties from crystallizers in Aspen Plus poses difficulties. Thus, coolers and a flash evaporator are integrated into the flowsheet before the cooling and the evaporative crystallizer, respectively. The operating parameters of the coolers and the flash evaporator are aligned with the crystallizer to obtain the duties required by the crystallization steps. Since ITA crystallization only occurs in the crystallizers, the energetic duty resulting from crystal formation is calculated separately using the mass flow of crystal product and the enthalpy of fusion for ITA ( Δ H fus ( 171.3 C) = 32.2 kJ/mol [98]).
All solid–liquid phase separations in the process are calculated ideally. Pumps are only integrated in the flowsheet when an elevated pressure has to be generated in a liquid phase. Coolers operate nearly isobaric. Waste water streams are cooled down by air and leave the system at ambient pressure.
As the simulation is solely applied for an operative cost analysis, the mass flows are scaled with respect to the amount of ITA produced by the process. Stream and utility prices used for the operative cost analysis are displayed in Table A2. Detailed parameterization for U. cynodontis ITA Max pH and U. maydis K14 simulation can be retrieved from Table A3.
Table A2. Stream, waste and utility prices.
Stream/UtilityCompositionPriceUnitReference
Thick juice65 wt%211.54EUR/tonne1
Mg(OH)240 wt%100.00EUR/tonne2
HCl30 wt%80.00EUR/tonne2
Process water100 wt%1.40EUR/tonne2
Waste water-2.90EUR/tonne2
Saline waste water-110EUR/tonne2,3
Electricity-0.0849EUR/kWh[99]
Low pressure steam-27.00EUR/tonne2
Cooling water-0.05EUR/kWh2,4
Process and utility-related CO2 emissions-27.37EUR/tonne[100]
1 USD 374.27 /tonneSugar (07.2020, CIF European ports), USD/EUR 1.15 (Exchange rate 07.2020 [101]), Thick juice price derived with respect to sugar weight fraction. 2 Price averaged on the grounds of personal communication with suppliers and industry representatives for the German market in 2020. 3 The provided price is only used for the saline mass fraction of WASTWAT6 since it contains large fractions of MgCl2. The regular waste water price is applied to the water mass fraction of WASTWAT6. 4 Moderately low temperature refrigerated water (Inlet: T = 5 °C, 1 bar).
Table A3. Parameterization of U. cynodontis ITA Max pH and U. maydis K14 simulations.
ParameterU. cynodontis ITA Max pHU. maydis K14
Thick juice mass flow3.84 kg/kgITA,final3.95 kg/kgITA,final
Water feed mass flow20.94 kg/kgITA,final14.76 kg/kgITA,final
Base mass flow0.12 kg/kgITA,final0.70 kg/kgITA,final
HEATER1 Temperature35.00 °C35.00 °C
HEATER1 Outlet pressure1.00 bar1.00 bar
De-lumping coefficient ITA0.39 gITA/gglucose0.42 gITA/gglucose
De-lumping coefficient CO20.1323 gCO2/gglucose0.1425 gCO2/gglucose
FLASH1 Temperature100.00 °C100.00 °C
FLASH1 Vapor mass fraction0.270.25
VALVE1 Outlet pressure0.59 bar0.57 bar
HEATX1 Hot stream outlet temperature97.00 K97.00 K
HEATX1 Δ Tmin10.00 K10.00 K
FLASH2 Temperature86.00 °C87.00 °C
FLASH2 Vapor mass fraction0.390.35
VALVE2 Outlet pressure0.33 bar0.30 bar
HEATX2 Hot stream outlet temperature82.00 K82.00 K
HEATX2 Δ Tmin10.00 K10.00 K
FLASH3 Temperature72.28 °C76.20 °C
FLASH3 Vapor mass fraction0.670.56
HCl (1. cooling crystallization)0.33 kg/kgITA1.93 kg/kgITA
COOLER4 Temperature15.00 °C15.00 °C
COOLER4 Pressure1.00 bar1.00 bar
CRYST1 Temperature15.00 °C15.00 °C
CRYST1 Pressure1.00 bar1.00 bar
FLASH4 Temperature100.00 °C100.00 °C
FLASH4 Vapor mass fraction0.390.20
VALVE4 Outlet pressure0.39 bar0.29 bar
HEATX4 Hot stream outlet temperature97.00 K87.00 K
HEATX4 Δ Tmin10.00 K10.00 K
FLASH5 Temperature86.07 °C85.77 °C
FLASH5 Vapor mass fraction0.640.27
HCl (2. cooling crystallization)0.007 kg/kgITA,final0.002 kg/kgITA,final
COOLER7 Temperature15.00 °C15.00 °C
COOLER7 Pressure1.00 bar1.00 bar
CRYST2 Temperature15.00 °C15.00 °C
CRYST2 Pressure1.00 bar1.00 bar
Water added for dissolution1.68 kg/kgITA,final1.64 kg/kgITA,final
MIXER 5 Temperature80.00 °C80.00 °C
MIXER 5 Pressure1.00 bar1.00 bar
FLASH6 Temperature80.00 °C80.00 °C
FLASH6 Vapor mass fraction0.550.54

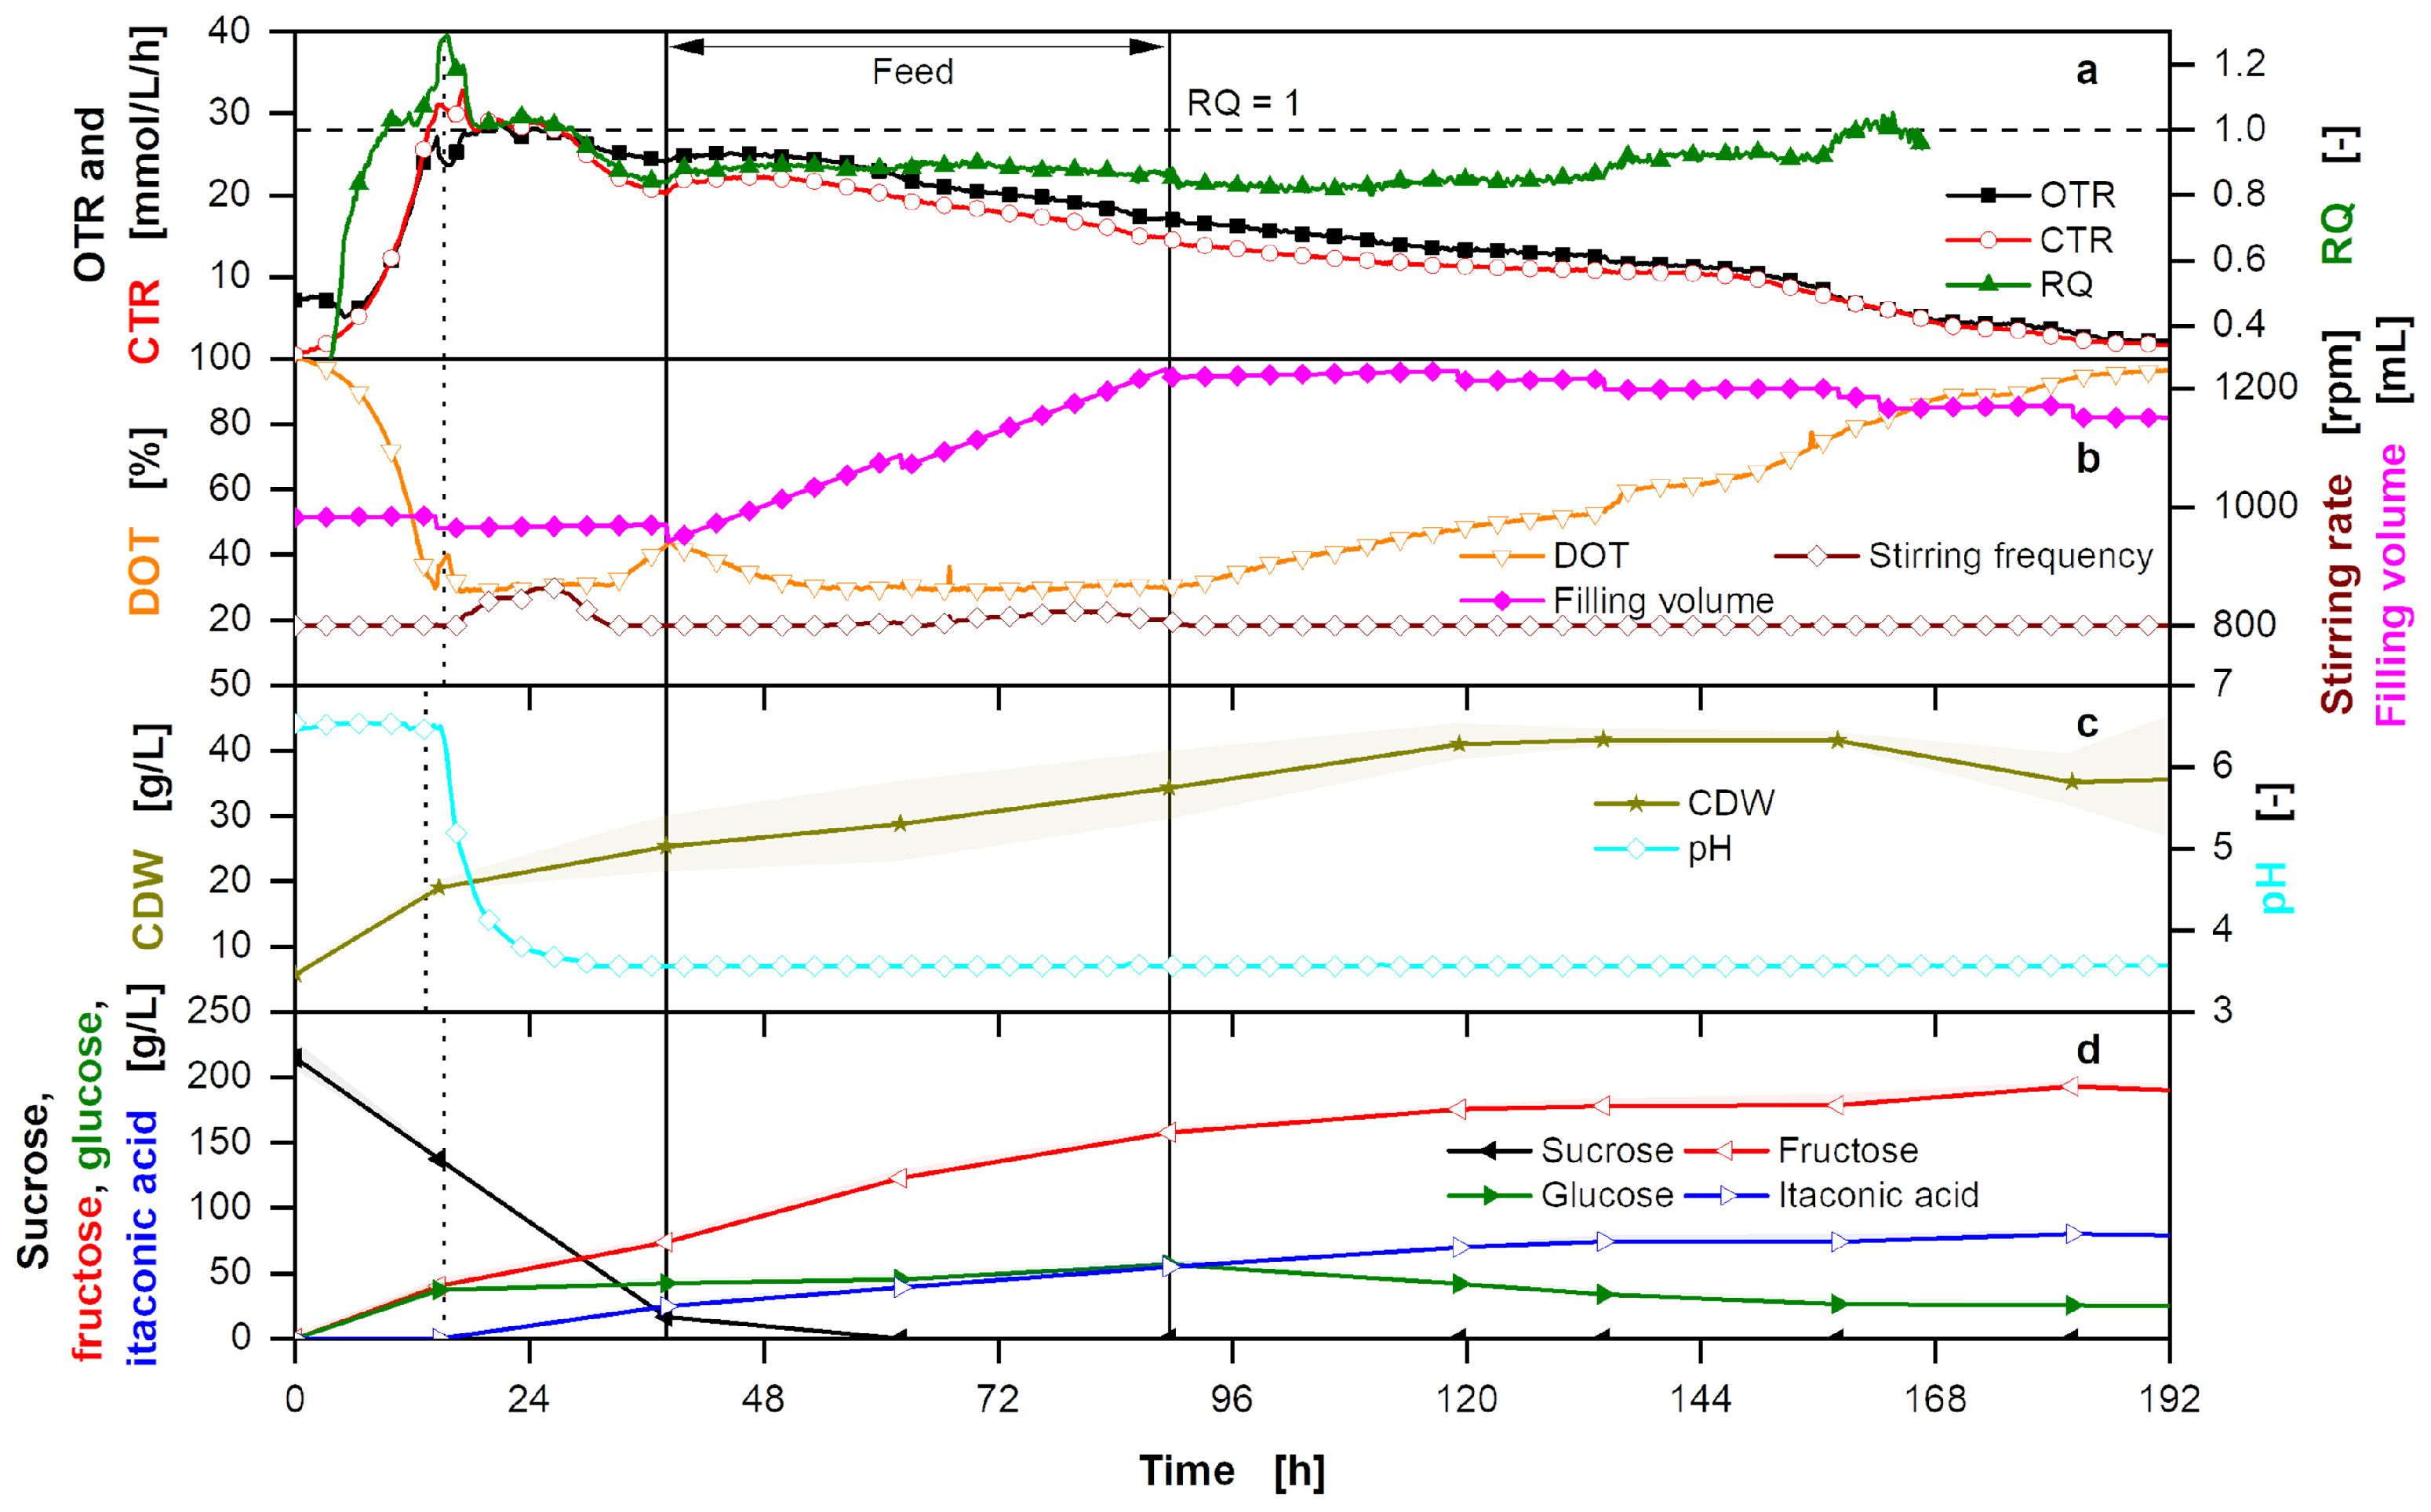
Appendix G. Overfed Fermentation of U. cynodontis ITA Max pH

A fermentation with an elongated feed profile with thick juice is depicted in Figure A9. The product yield is low, as not all substrate is used from the fermentation broth. However, this is not due to substrate inhibition. Even with high sugar concentrations of over 200 g/L sucrose, a maximum titer of 80 g/L, similiar to fermentations on glucose [74] and to the fermentation shown in Figure 3, is reached. Therefore, product inhibition by weak organic acid stress [74,89] is responsible for reduced cell viability and prevents further substrate conversion. Furthermore, no limitation in oxygen transfer due to high substrate concentration and high medium osmolarity is observed [102].
Figure A9. 
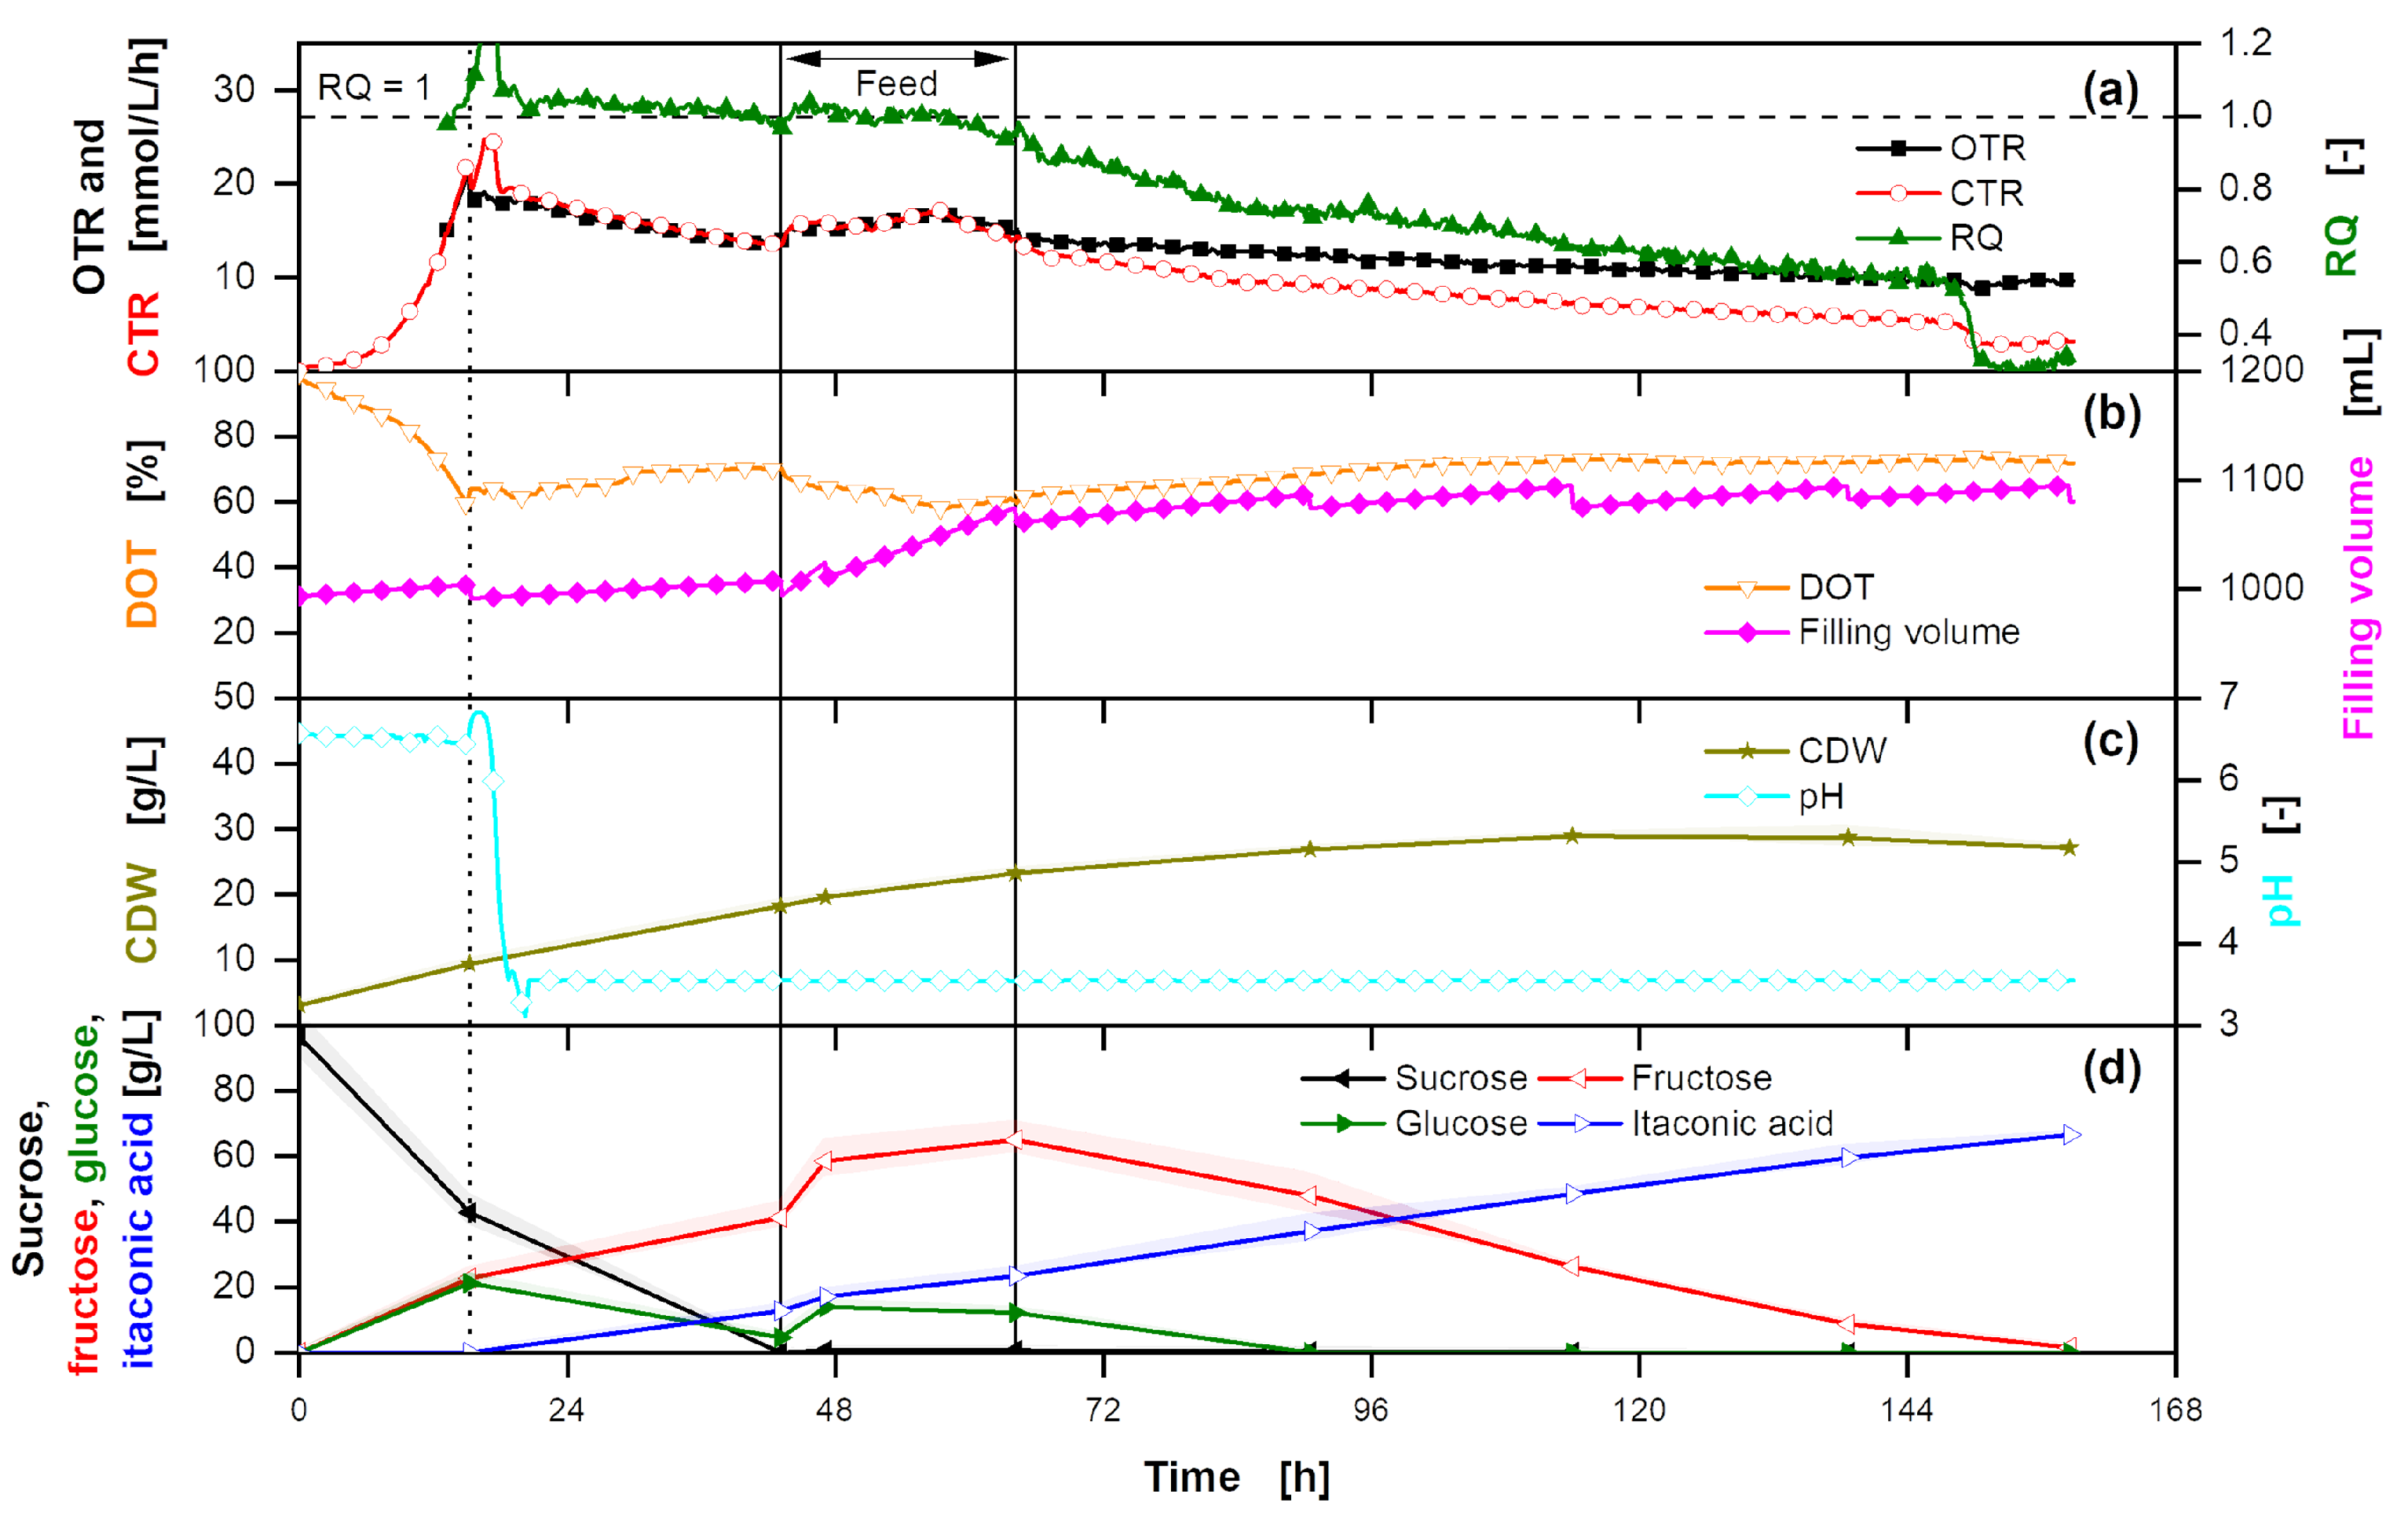
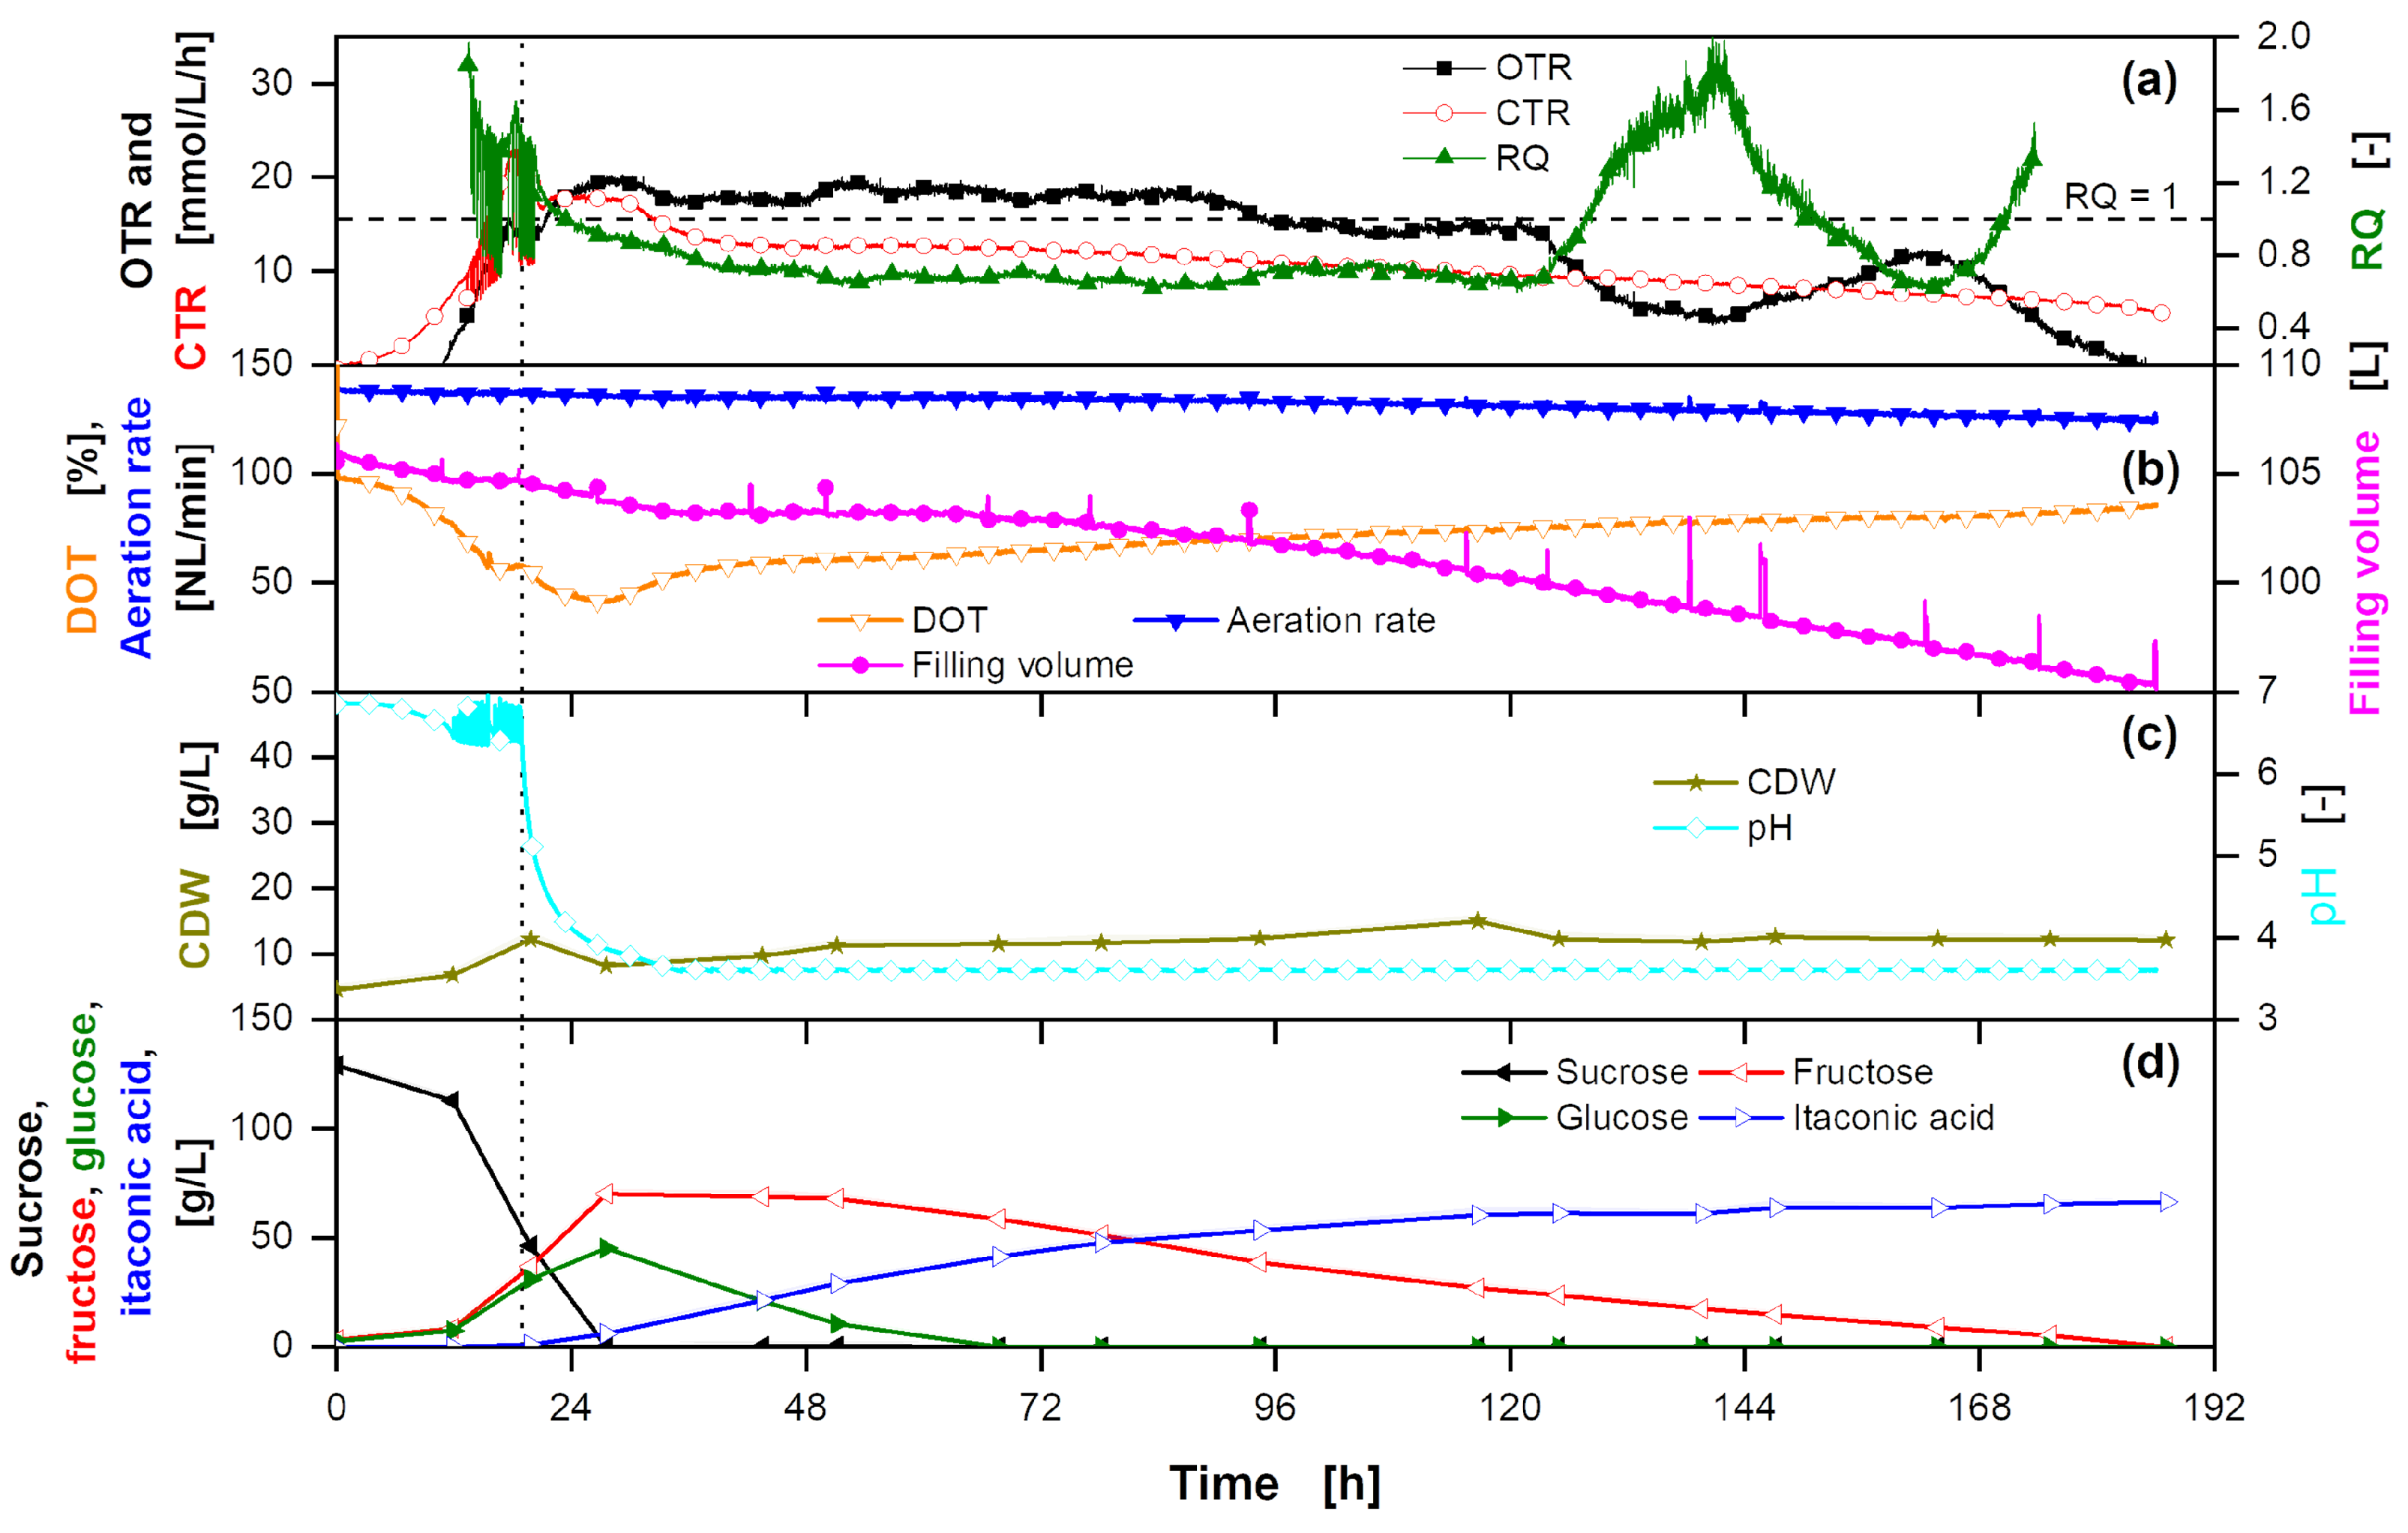
Overfed extended-batch fermentation of U. cynodontis ITA Max pH with pH shift and thick juice as carbon source. (a) OTR, CTR and RQ. The horizontal dashed line shows RQ = 1. RQ values are only shown for OTR values > 5 mmol/L/h. (b) DOT, stirring rate and filling volume. (c) CDW and pH. (d) Sucrose, glucose, fructose and ITA concentration. For the batch phase, 215 g/L sucrose from thick juice are initially added to the medium. During the feed phase (between the vertical solid lines), 215 g of additional sucrose from thick juice are added into the fermentation vessel. Cultivation is performed in a 2 L stirred tank reactor with an initial filling volume of 1 L at 30 °C with a constant aeration and stirring rate of 1 L/min and 1200 rpm, respectively. For clarity, only every 20th measured online data point is shown.
Bioengineering 10 00723 g0a9

Appendix H. Overfed Fermentation of U. cynodontis ITA Max pH with Mg(OH)2

To evaluate the potential of Mg(OH)2 as a base in fermentation (Section 3.1.2), a fermentation is performed with Mg(OH)2 instead of NaOH (Figure A10). While ITA production is similar to fermentations with NaOH, cell growth stagnates after 69.4 h of the fermentation. In combination with a similar ITA productivity, compared to fermentations with NaOH, the resulting low CDW leads to an overall process yield of 0.48 gITA/gglucose eq., without including leftover sugar in the calculations. MgOH2 is fed as a suspension, which can result in blocking of tubing and pipes, as is visible between 48 h and 69.4 h. The blocking is removed and pH control is reestablished after 69.4 h. For future process design, where the base of the fermentation and the acid for crystallization are aligned for a maximum process yield, further research into the influence of different cations resulting from base consumption on growth and productivity of U. cynodontis ITA Max pH is necessary.
Figure A10. Overfed extended-batch fermentation of U. cynodontis ITA Max pH with Mg(OH)2 as pH-adjusting agent and thick juice as carbon source. (a) CTR. (b) DOT, stirring rate and filling volume. (c) CDW and pH. (d) Sucrose, glucose, fructose and ITA concentration. For the batch phase, 160 g/L sucrose from thick juice are initially added to the medium. During the feed phase (between the vertical solid lines) 100 g of additional sucrose from thick juice are added into the fermentation vessel. Cultivation is performed in a 2 L stirred tank reactor with an initial filling volume of 1 L at 30 °C with a constant aeration rate of 1 L/min. For clarity, only every 20th measured online data point is shown.
Bioengineering 10 00723 g0a10

Appendix I. Discoloration of Crystals after Purification from Fermentation Broth

To evaluate the influence of a complex substrate on crystal colouration, a fermentation with pure glucose is conducted according to Tehrani et al. (2019) [18] with U. cynodontis ITA Max pH and a NH4Cl concentration of 4 g/L. ITA is then purified according to Section 3.2.3. However, a decolorization step is omitted. Even without this decolorization step, white crystals are obtained. If fermentation broth obtained in Section 3.2.1 is purified in the same way, it is evident, that the use of thick juice for fermentation leads to increased colorization of ITA cystals and necessitates a decolorization step (Figure A11).
Figure A11. Discolouration of crystals after purification from fermentation broth with thick juice and glucose without decolorization. Fermentation broth on glucose is prepared as described in Tehrani et al. (2019) [18].
Bioengineering 10 00723 g0a11

Appendix J. Influence of Temperature on Decolorization Performance

The influence of temperature on decolorization behavior and ITA adsorption is investigated with artificially prepared broth at a starting pH of 3.6 using the XAD-1180 resin as an example.
Figure A12. (a) Temperature-dependent decolorization behavior of artificial broth at a starting pH of 3.6. (b) Temperature-dependent adsorption behavior of ITA in artificial broth at a starting pH of 3.6.
Bioengineering 10 00723 g0a12

Appendix K. Adsorption of ITA on AC-1 and XAD-1180 in Pure Systems

Additionally to the experiments described in Section 3.2.2, ITA adsorption is characterized in artificially prepared systems for AC-1 and XAD-1180 at different pH values to confirm the ITA species primarily adsorbed and to gain information on potential competitive adsorption of pigments and ITA in artificially prepared broth. Figure A13 depicts mostly fully protonated ITA being adsorbed at the hydrophobic decolorization agents XAD-1180 and AC-1.
Figure A13. Adsorption of ITA on AC-1 and XAD-1180 at different pH values in artificially prepared systems and respective species distribution.
Bioengineering 10 00723 g0a13

Appendix L. Crystallization Profile in Laboratory-Scale

Crystallization in laboratory-scale is performed with a EasyMax 102 Titration Calorimeter (Mettler Toledo, Columbus, USA) and pH is controlled during the cooling crystallization (Figure A14). In total, 300.4 mL 5 M HCl are added per liter of concentrated ITA solution. This corresponds to a chloride concentration of 1.5 mol/L, which is 60% higher than in process simulations. After crystallization, chloride concentration is increased further to 1.75 ± 0.01 mol/L.
Figure A14. Exemplary crystallization in laboratory-scale.
Bioengineering 10 00723 g0a14

Appendix M. Additional Data for Fermentation Scale-Up

Figure A15 displays a close-up view of pH and CTR between 14 and 17 h of cultivation in the 100 L fermentation. During the first hours of cultivation, the pH fluctuates slightly. In every control step, it is regulated to 6.5 by addition of NaOH. This is coupled to a change in CO2 solubility, resulting in an oscillating CTR. The pH is constant and the CTR stabilized after the drop in OTR indicates the beginning of nitrogen limitation.
Figure A15. Close-up view of pH and CTR in the 100 L batch fermentation, shown in Figure 6, before the pH shift. Cultivation is performed in a 150 L stirred tank pressure reactor with an initial filling volume of 105 L at 30 °C with a constant stirring rate of 285 rpm. For clarity, only every fifth measured online data point is shown.
Bioengineering 10 00723 g0a15

Appendix N. Raman Spectroscopy of Sugars

For pure component models (PCM) of glucose, fructose and sucrose, 10 wt% sugar in water is used. For constructing the ITA PCMs, spectra of ITAH2 and ITA2− at pH 1.9 and pH 13.0 are used. For ITAH a binary spectrum with H2O was determined using Multivariate Curve Resolution with Alternating Least Squares (MCR-ALS) [103,104,105,
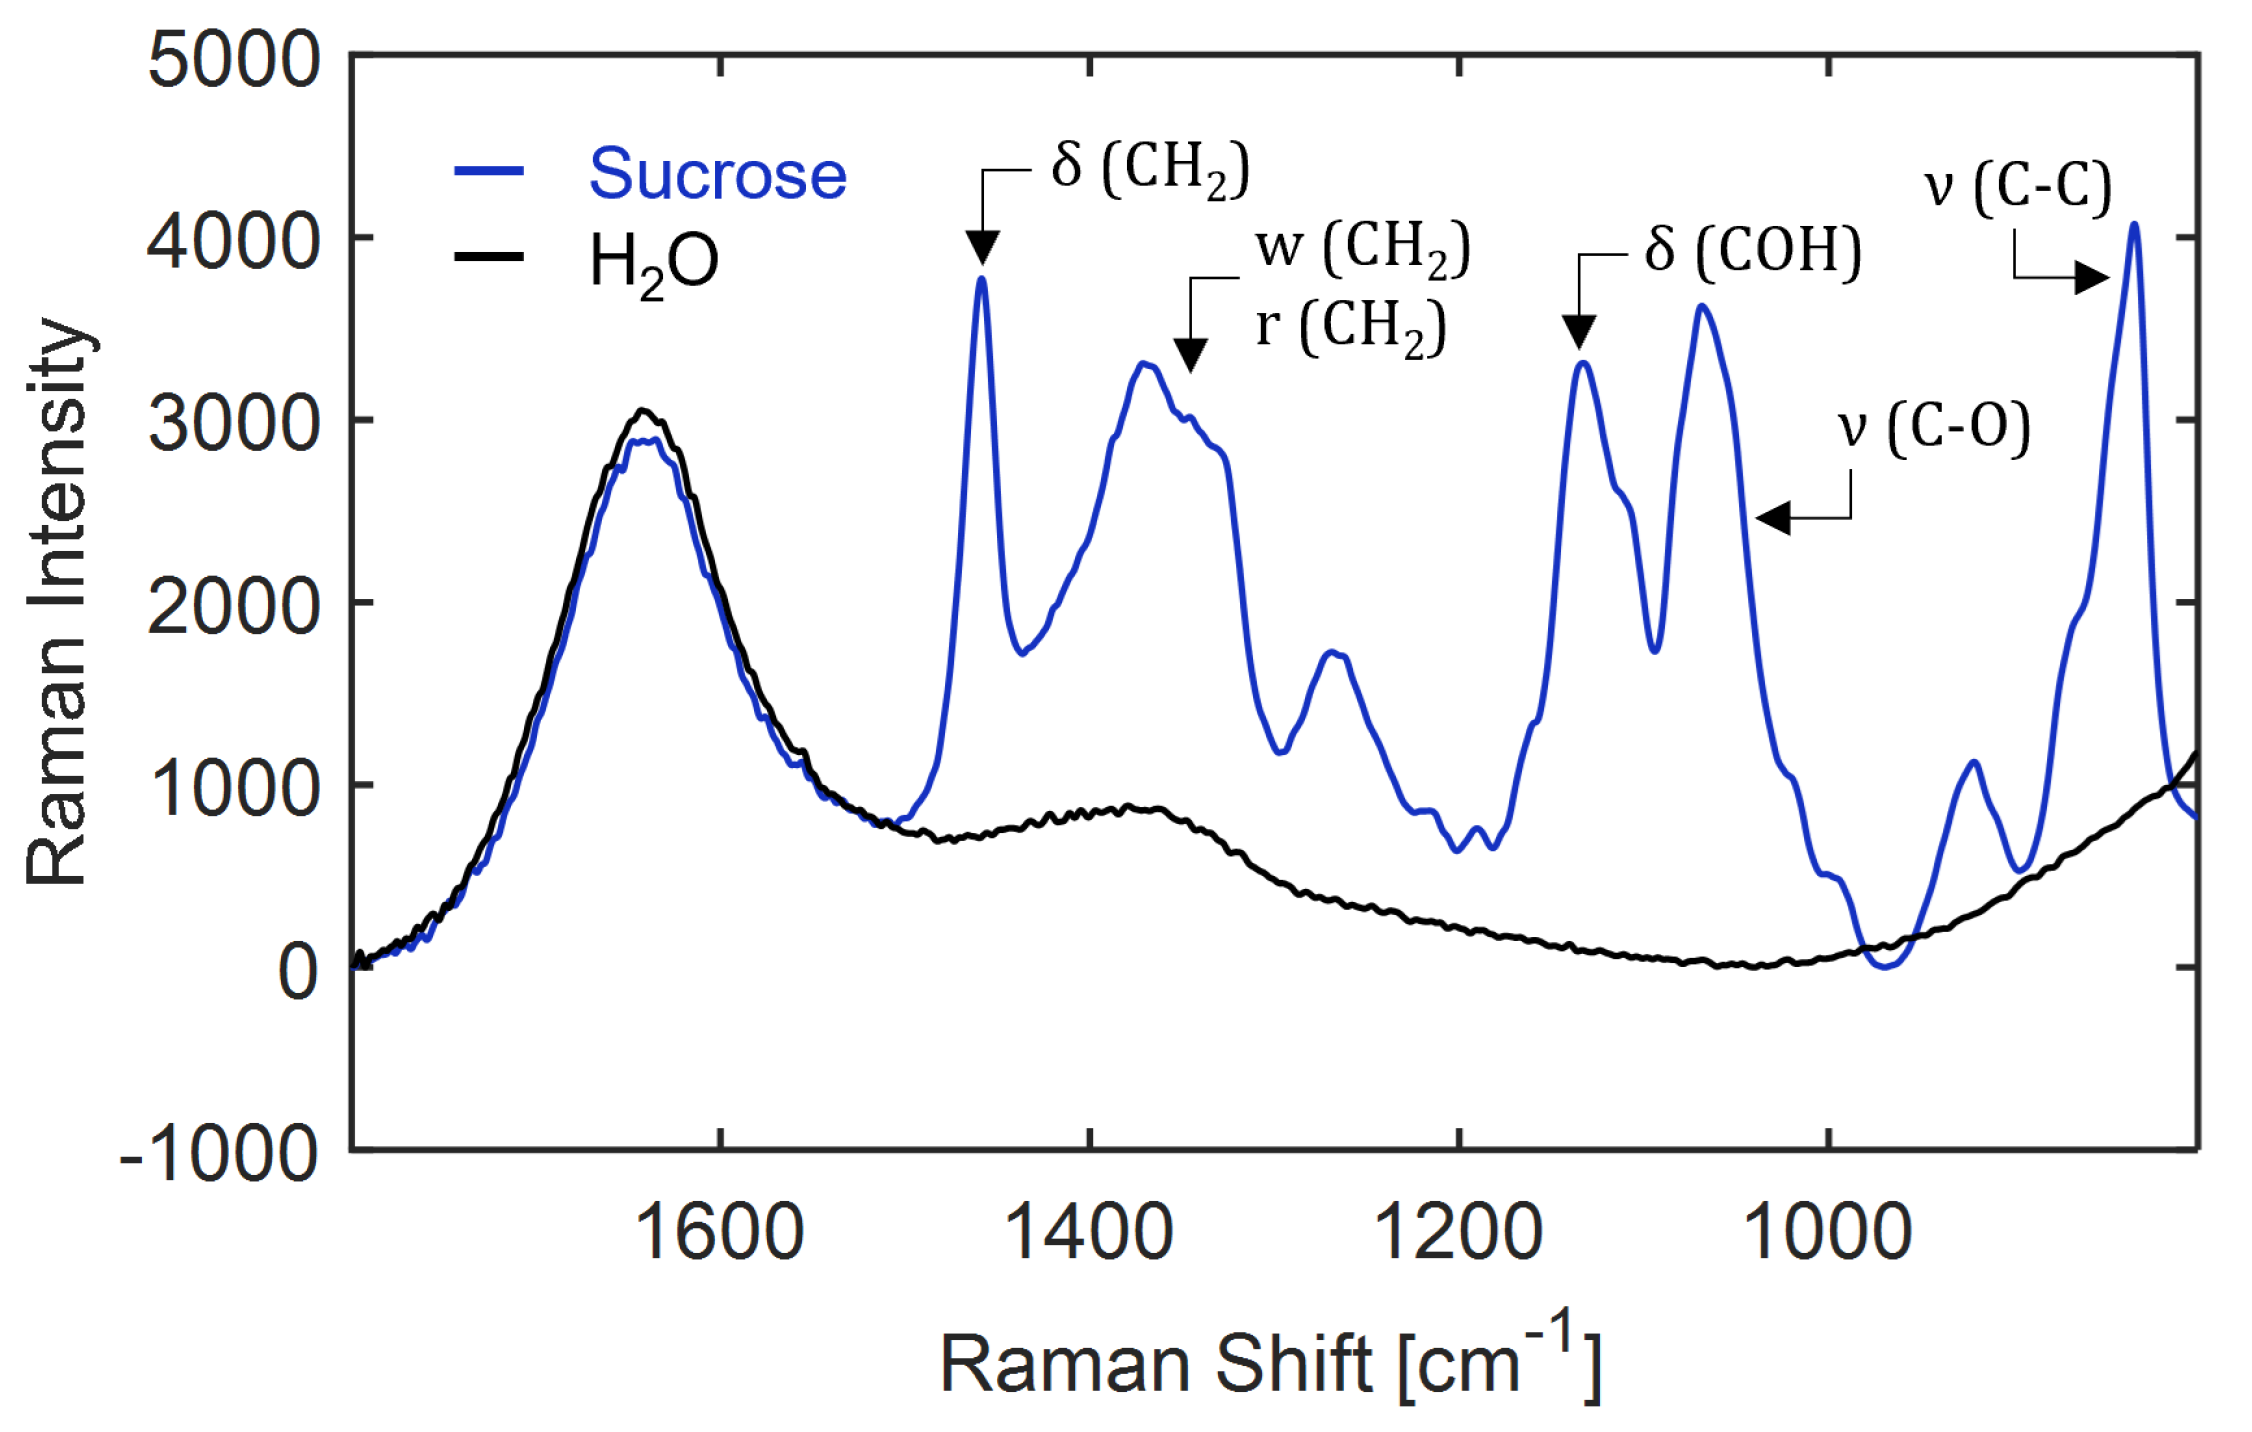
106] as it could not be recorded by itself due to being present in mixture with the other two ITA species at any given pH value. The total mixture hard model is calibrated with mixtures of sugar and ITA in water between 1 and 10 wt% and 3 and 8 wt%, respectively. Raman spectra of sucrose, fructose and glucose for PCM can be found in Figure A16Figure A18. Prominent peaks are identified in the region of 1200-1500 cm−1, where mainly Raman bands caused by -CH2 are located. A strong band at 1458 cm−1 due to the δ -CH2 bending mode, a broader set of merged peaks around 1300–1440 cm−1 due to r-CH2 rocking and w-CH2 wagging modes, and a medium to strong peak around 1264–1268 cm−1 due to τ -CH2 twisting vibrations can be found. Further bands are visible between 1000 and 1200 cm−1, where δ C-O-H bending vibrations and ν C-O stretching modes occur. Below 800 cm−1, mostly δ C-H bending vibrations and ν C-C stretching modes are present [107,108,109,110].
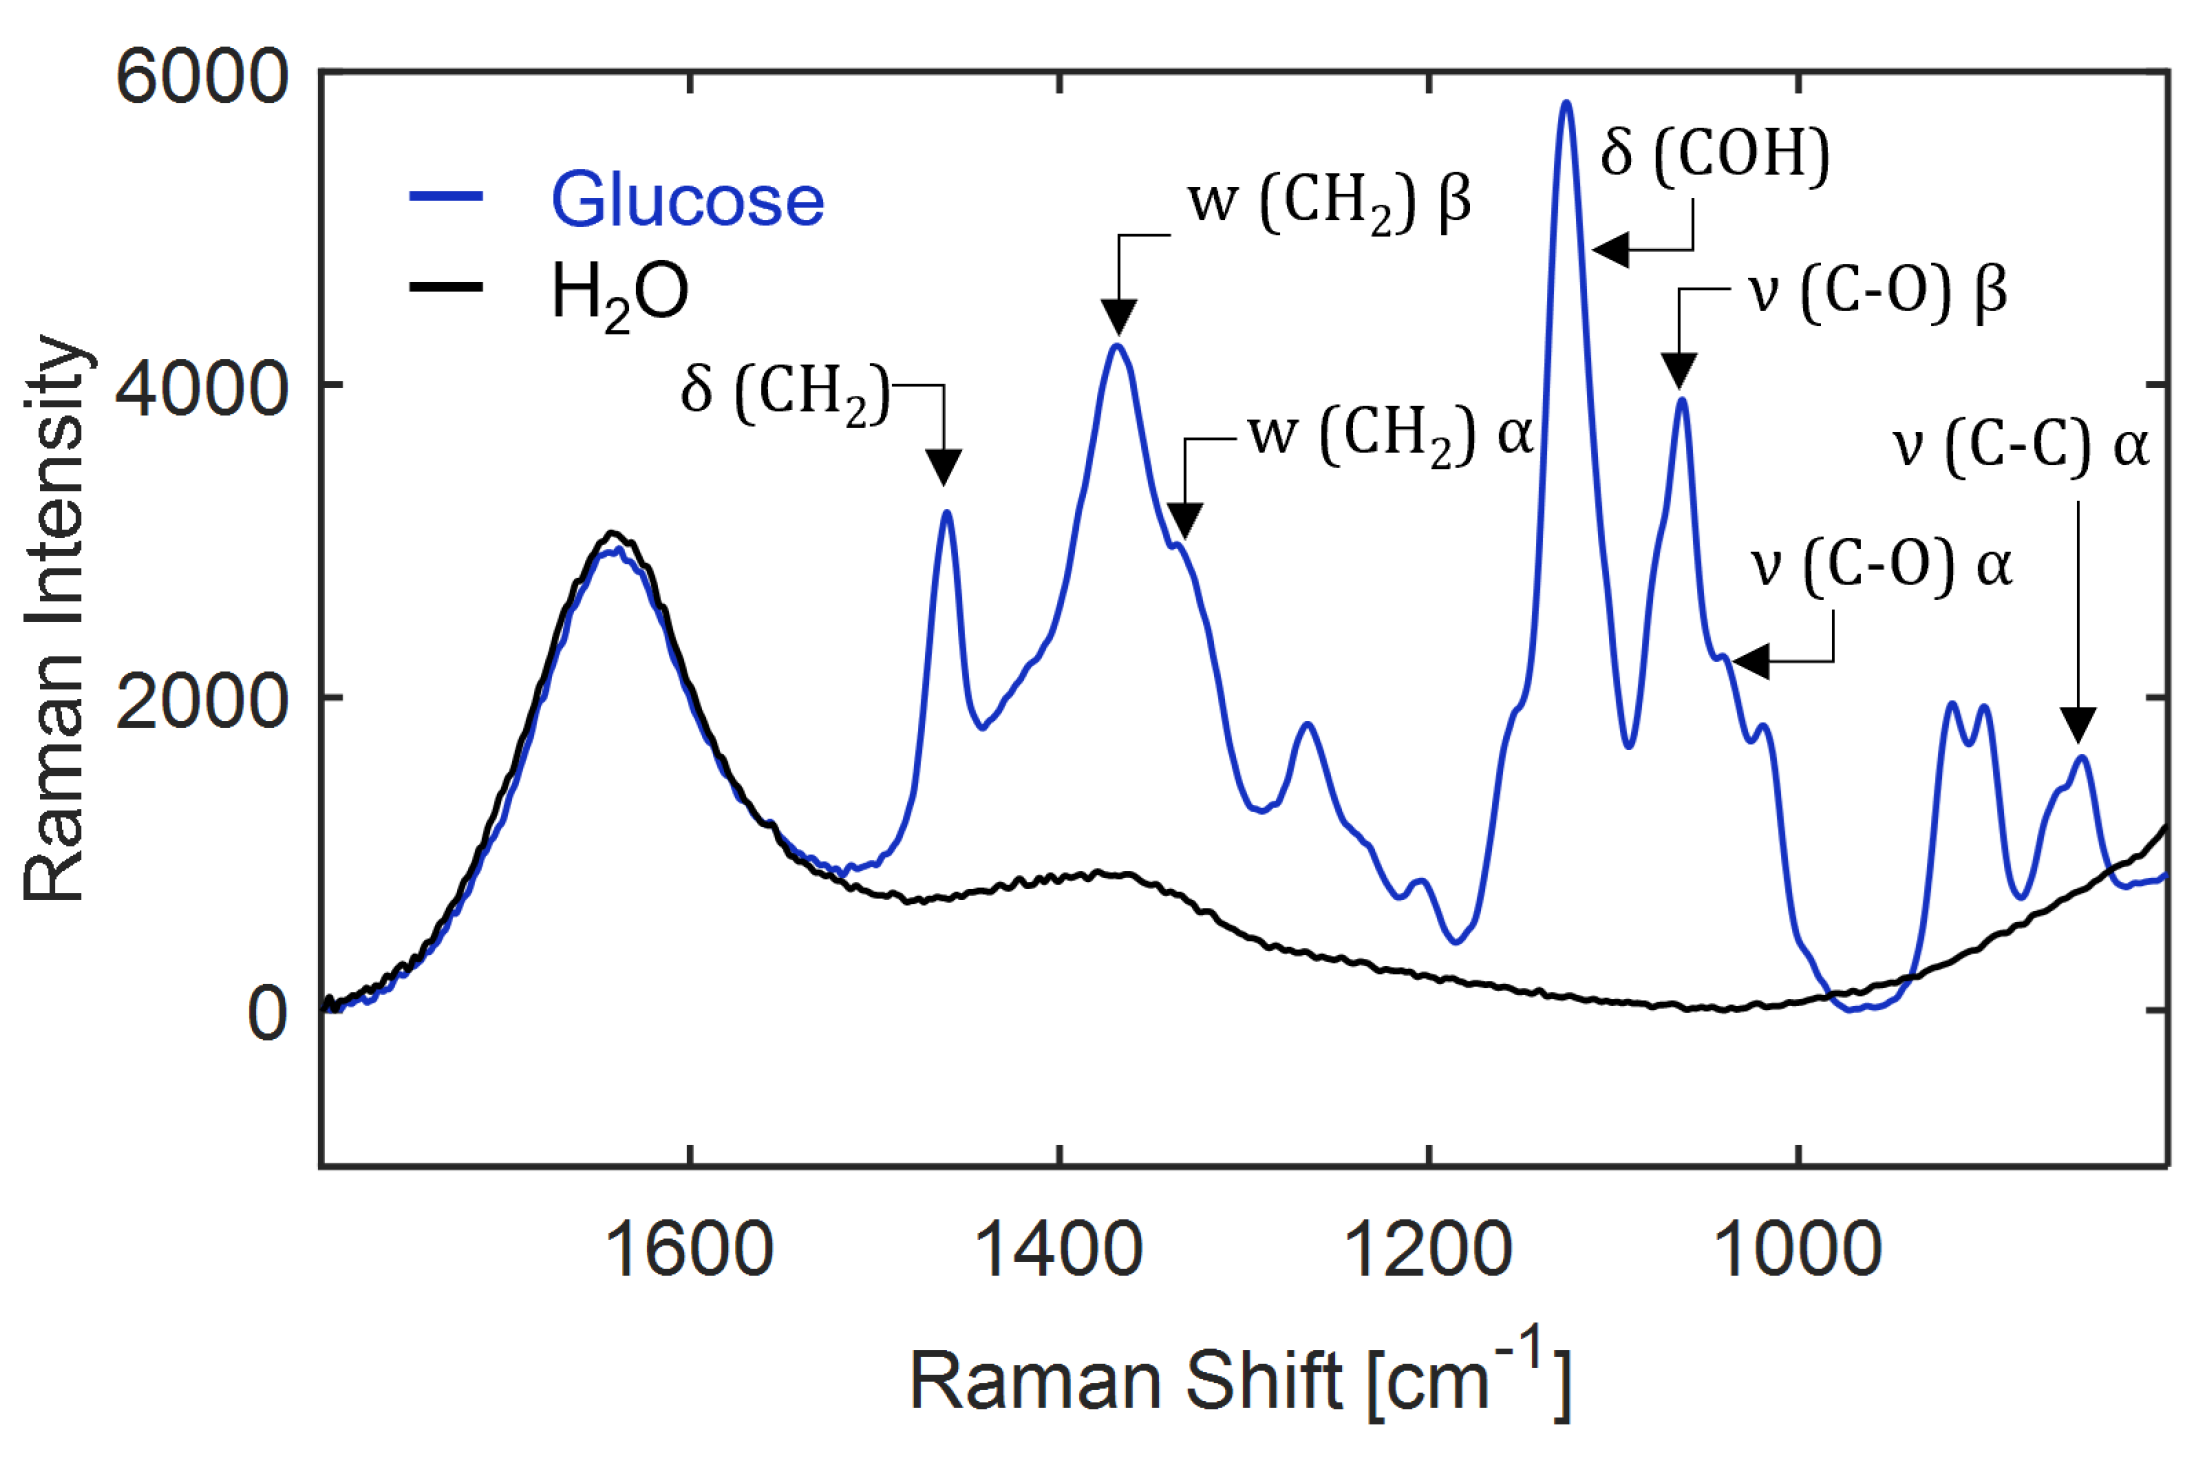
Additionally, for glucose and fructose, bands are present that are distinctly caused by its isomers. α -D-glucose has a C-O stretching mode at 1040 cm−1, while β -D-glucose has a band blue-shifted compared to α -D-glucose at 1063 cm−1 [109]. While structurally different, these compounds co-exist in approximate constant ratio when dissolved, due to equilibrium in ring opening and closing behavior at a certain temperature and pH. Hence, for glucose a single PCM is constructed that represents the Raman bands of both the α and β form of glucose in given ratios. Similarly, the fructose spectrum is a mixture of bands of β -D-fructopyranose and D-fructofuranose, which are also represented by a single PCM assuming a constant ratio of these isomers in solution [109,111].
Figure A16. Assignment of molecular vibrations to the Raman spectrum of 10 wt% sucrose in water recorded at 25 C. The pure water spectrum (black curve) is shown for reference. ν : stretching, δ : bending, w: wagging, r: rocking and γ : deformation modes.
Bioengineering 10 00723 g0a16
Figure A17. Assignment of molecular vibrations to the Raman spectrum of 10 wt% glucose in water recorded at 25 C. The pure water spectrum (black curve) is shown for reference. ν : stretching, δ : bending and w: wagging modes, α : alpha-D-glucose, β : beta-D-glucose.
Bioengineering 10 00723 g0a17
Figure A18. Assignment of molecular vibrations to the Raman spectrum of 10 wt% fructose in water recorded at 25 C. The pure water spectrum (black curve) is shown for reference. ν : stretching, δ : bending, w: wagging and τ : twisting modes, f: D-fructofuranose, p: D-fructopyranose.
Bioengineering 10 00723 g0a18
The Raman spectra of ITA can be found in Figure A19. To be able to include the sugars in the IHM approach from Echtermeyer et al. (2021) [93], the corresponding model for ITA is extended to a range of 800 to 1800 cm−1. Additional prominent bands for ITA found in the region below 1025 cm−1 are ν C-C stretching modes and ν s,(C-O) symmetric stretching vibrations related to the carboxylic acid groups [112,113]. Some of these bands shift to higher wavenumbers at higher pH values due to a higher degree of dissociation of the carboxylic acid groups and presence of ions [112].
Figure A19. Raman spectra recorded during titration of 8 wt% ITA with 1 M NaOH solution at 25 C. Spectra are treated with a linear baseline. Inset shows the concentration profiles of the ITA species, calculated using non-ideal thermodynamics, as in Echtermeyer et al. (2021) [93]. ITAH2: undissociated, ITAH: first dissociation state and ITA2−: fully dissociated ITA.
Bioengineering 10 00723 g0a19
Figure A20. Assignment of molecular vibrations to the Raman spectrum of 8 wt% (ITAH2) and 3 wt% (ITA2−) ITA in water recorded at 25 C. The pure water spectrum (black curve) is shown for reference. ν : stretching, ν s : antisymmetric stretching and γ : deformation modes. ITAH2: undissociated and ITA2−: fully dissociated ITA.
Bioengineering 10 00723 g0a20

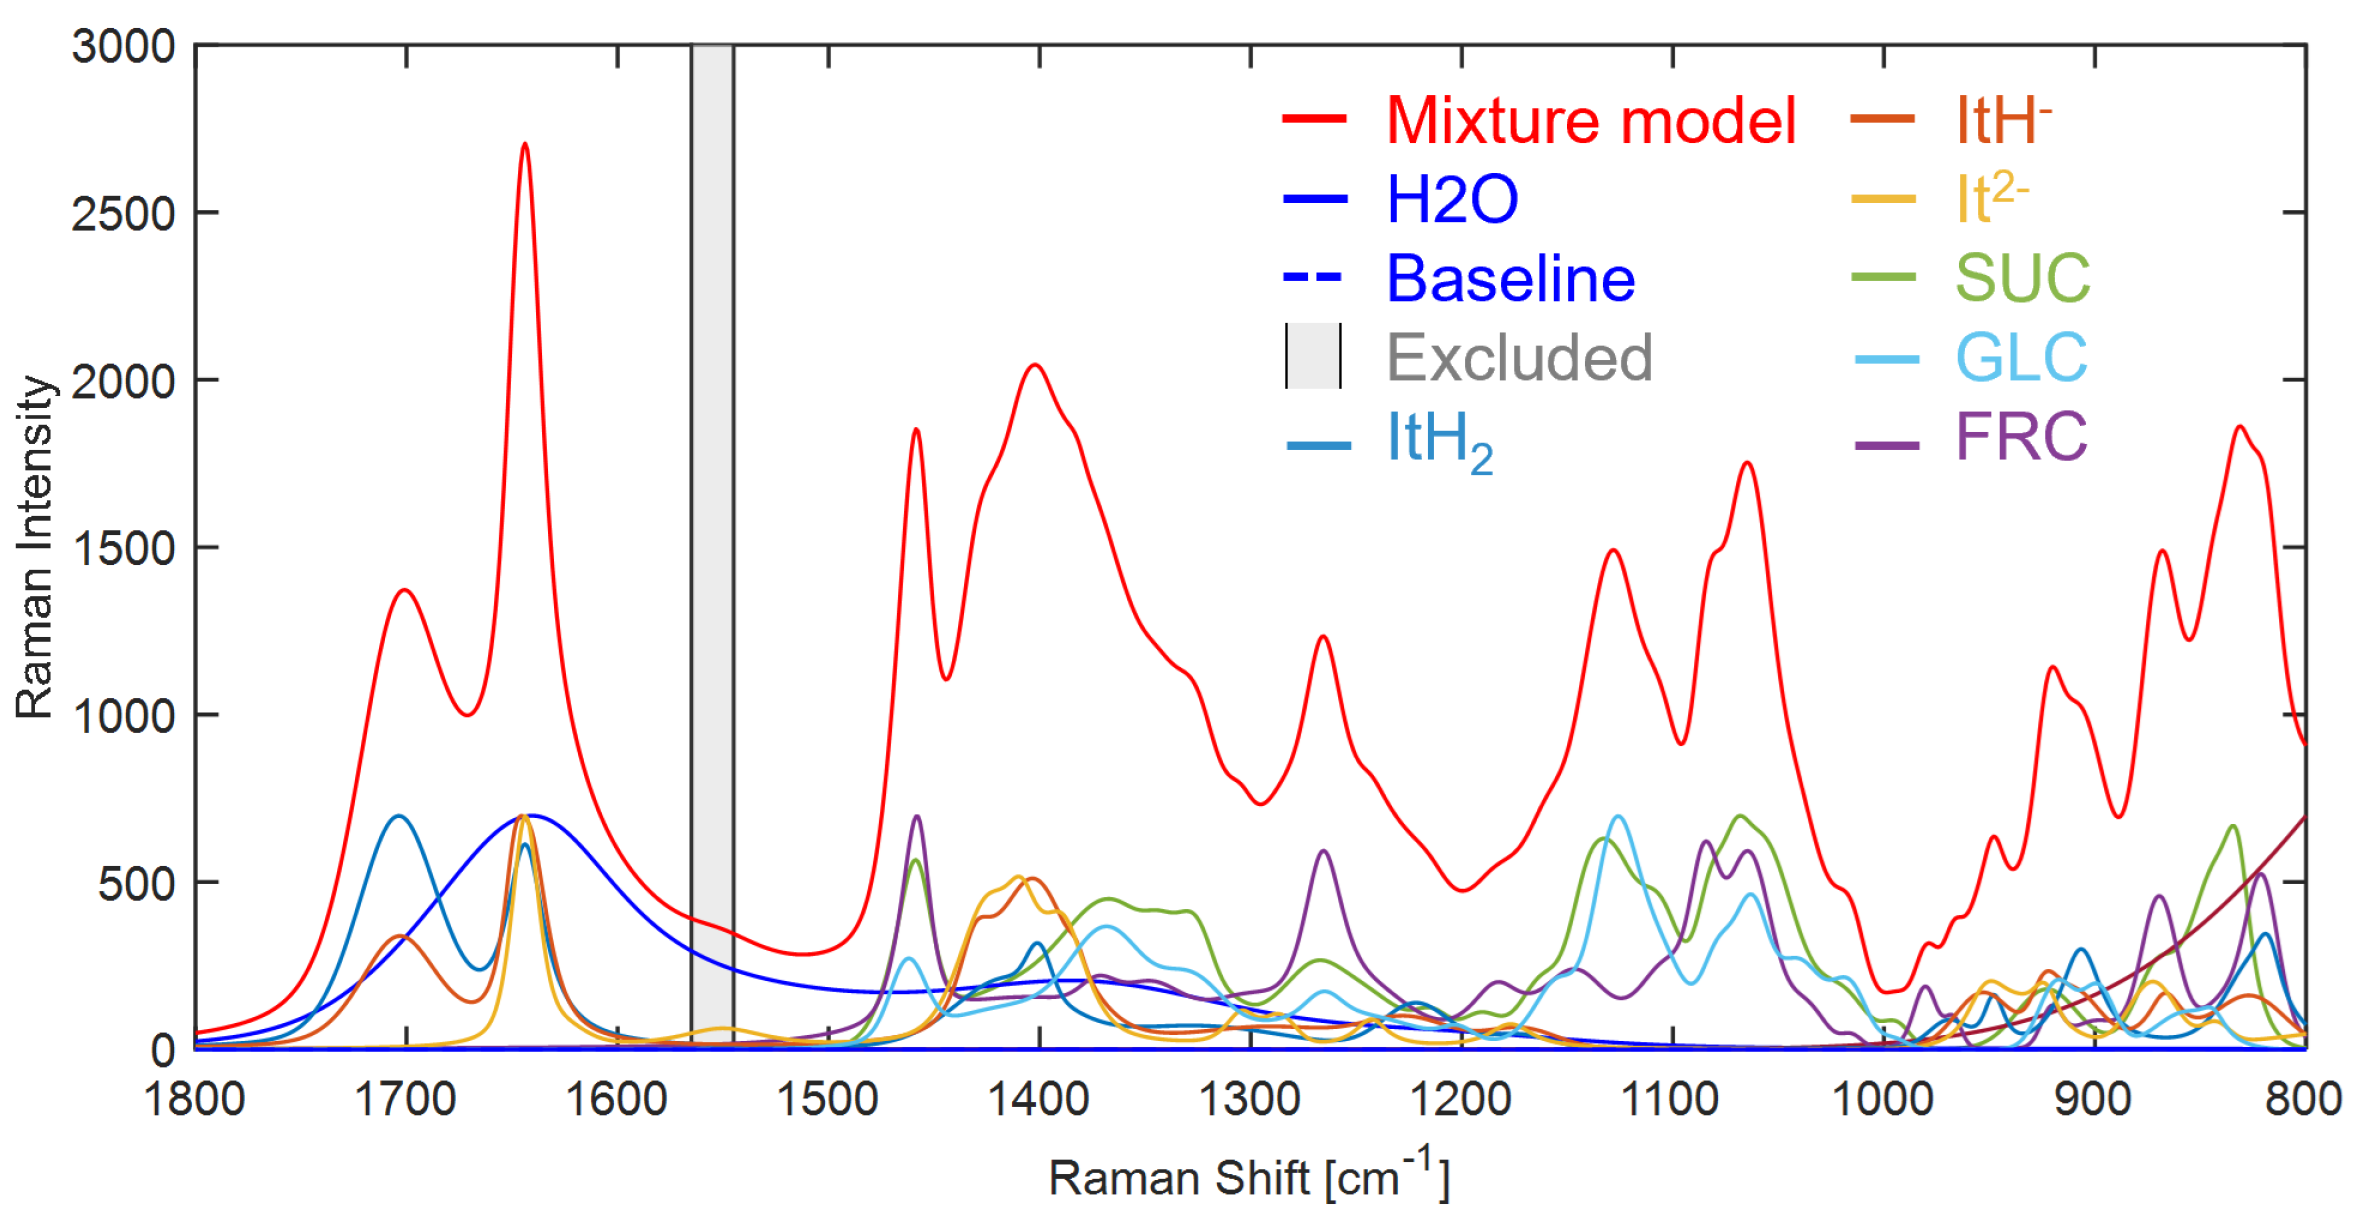
Appendix O. Indirect Hard Modelling and Figures of Merit

The mixture hard model created with IHM is set up in PEAXACT and shown in Figure A21. It is comprised of a total of seven main components represented by PCM: water, three ITA species (ITAH2, ITAH, ITA2−), sucrose, glucose and fructose. Prior to fitting a Raman spectrum, a pretreatment model is first applied which excludes the region 1545– 1565 cm−1 attributed to the oxygen gas peak and the spectral range is reduced to 800–1800 cm−1. Secondly a linear baseline model is applied, fitted through the lowest points in the spectrum. One auxiliary PCM is included to compensate for a sloped baseline below 1000 cm−1, as shown in magenta (Figure A21).
Figure A21. IHM constructed for ITA dissociation with sucrose, glucose and fructose and water solvent. ITAH2: undissociated, ITAH: first dissociation state and ITA2−: fully dissociated ITA, SUC: sucrose, GLC: glucose, FRC: fructose.
Bioengineering 10 00723 g0a21
After the mixture hard model is constructed, its goodness of fit is determined to assess the model quality and accuracy. First of all, the model is fitted to a spectrum known to contain the components present in the model as PCMs. Figure A22 shows the model fitted to a mixture of sucrose, glucose and fructose. The residuals show an absolute maximum value of 131, which is more than an order of magnitude smaller than the intensity (5981) of the maximum peak in the spectrum at 1126 cm−1 for the alcohol ( δ COH) bending vibration of the sugars. Additionally, the RMS residual is calculated (Equation (A15)).
R M S = 1 N · n N ( y m o d e l , n y m e a s u r e d , n ) 2
N is the number of data points in the spectrum and y are the Raman intensities at each point n, is calculated as 39.8, which is comparably low compared to the peak intensities in the spectrum.
Figure A22. The mixture hard model consisting of sucrose, glucose, fructose and ITA dissociation PCMs fitted to a Raman spectrum of 1 wt% fructose, 3 wt% sucrose and 8 wt% glucose. It has a linear baseline and excluded range between 1545 and 1565 cm−1.
Bioengineering 10 00723 g0a22
The following figures of merit are also calculated for the mixture hard model to assess further quality and properties of the constructed model. The calibration performance for a component i is determined by the root mean squared error of calibration (RMSECi) [g/g] and the root mean squared error of leave-10%-out cross-validation (RMSECVi) [g/g], each calculated as shown in Equation (A16).
R M S E C ( V ) i = 1 K · k = 1 K ( w p r e d i c t e d , k , i w t r u e , k , i ) 2
K is the total number of data points, k included in the calibration and w the concentration in g/g of the sample measured. The leave-10%-out cross-validation is achieved by repeating the calibration several times and at every iteration 10% of the data is left out of the calibration for calculating the RMSECV, until each datapoint has been left out at least once. Additionally, also the coefficient of determination, R2i is calculated. Furthermore, the bias of the achieved calibration for each component is assessed using the stability ϕ i [-], as depicted in Equation (A17).
ϕ i = R M S E C V i R M S E C i R M S E C i · 100 %
The detection limit [g/g] is calculated in Equation A18 by evaluating 10 measurements of a blank sample consisting of deionized water. The weight fraction, w i , b l a n k and standard deviation, s i g m a i , b l a n k are determined using the mixture model predictions of the blank samples. With a confidence factor, β of 3, a confidence of 99.86% is obtained when a normal distribution of the measurement errors is assumed [114].
L O D i = w ¯ i , b l a n k + β · σ i , b l a n k
The resulting PCMs constructed with IHM consist of 24, 19 and 24 component peaks for sucrose, glucose and fructose, respectively, in the range of 800 to 1800 cm−1. To match this range, the existing IHM from Echtermeyer et al. (2021) [93] for ITAH2, ITAH and ITA2− is extended from 1025 to 1800 cm−1 to 800 to 1800 cm−1. From there, ITA PCMs are constructed with 13, 14 and 16 component peaks, respectively, for ITAH2, ITAH and ITA2−.
The PCMs for ITA dissociation, sucrose, glucose, fructose and water are combined in a total mixture hard model (Appendix O). Except for water and ITAH, the RMSECi and RMSECVi values are below 1.218 × 10⁻³ g/g, which indicates that the model has a good accuracy. The ITAH has lower accuracy, as there is a less accurate model fit in the region between pH 3 and 5 (Figure A19) compared to Echtermeyer et al. (2021) [93]. This also affects the water accuracy, as the calibration has an additional closure constraint, stating that the total sum of the weight fractions should add up to 1. As a result, ITAH accuracy also lowers the H2O accuracy. The ϕ i is below 3% for all components and thus indicates an unbiased and stable calibration result. Finally, the Limit of Detection (LODi) shows values that are an order of magnitude lower than the RMSECVi’s, indicating a precise model. In conclusion, although similar, the overlapping spectral bands of the three sugars and ITA do not hinder an accurate and precise result in a mixture spectral hard model.
Table A4. Figures of merit for the mixture hard model.
ComponentR2i [-]RMSECi [×10−3 g/g]RMSECVi [×10−3 g/g]LODi [×10−3 g/g] ϕ i [%]
ITAH20.9970.9851.0180.1183
ITAH0.9851.4811.4900.0201
ITA−20.9931.0561.0700.1481
Sucrose0.9981.2081.218<0.011
Glucose0.9990.5510.558<0.011
Fructose0.99970.3920.398<0.012
H2O0.9862.8052.842n.d.11
1 n.d. = not defined.

Appendix P. Raman Spectra Recorded in 100 L Fermentation with Fluorescence

When the Raman probe is inserted directly into the fermenter at the start of fermentation, fluorescence occurs mostly due to biomass and biological activity and due to pigments present in the complex substrate. As the biomass contributes to fluorescence, the shape of the broad fluorescent signal overlaying the Raman bands changes during fermentation. At the end of fermentation, the fluorescence reaches its maximum, as can be seen from the increased Raman intensity, and has shifted towards higher wavenumbers. In addition, noise increases, which is caused by an overall increase in the magnitude of the fluorescence in the recorded spectra by almost a factor of two (Figure A23).
Figure A23. Raman spectra recorded inline at the start (t = 0 h) and end (t = 187 h) during the 100 L fermentation.
Bioengineering 10 00723 g0a23

References

  1. Strategy, U.B. A Sustainable Bioeconomy for Europe: Strengthening the Connection between Economy, Society and the Environment. European Commission.–2018. 2018. Available online: https://ec.europa.eu/research/bioeconomy/pdf/ec_bioeconomy_strategy_2018.pdf (accessed on 25 February 2020).
  2. Bauer, F.; Coenen, L.; Hansen, T.; McCormick, K.; Palgan, Y.V. Technological innovation systems for biorefineries: A review of the literature. Biofuels Bioprod. Biorefin. 2017, 11, 534–548. [Google Scholar] [CrossRef] [Green Version]
  3. Kohli, K.; Prajapati, R.; Sharma, B.K. Bio-based chemicals from renewable biomass for integrated biorefineries. Energies 2019, 12, 233. [Google Scholar] [CrossRef] [Green Version]
  4. Panchaksharam, Y.; Kiri, P.; Bauen, A.; vom Berg, C.; Puente, Á.; Chinthapalli, R.; Spekreijse, J.; Vos, J.; Pfau, S.; Rübberdt, K.; et al. Roadmap for the Chemical Industry in Europe Towards a Bioeconomy: Strategy Document. Project Report “Road to Bio”. 2019. Available online: https://www.google.com/url?sa=t&rct=j&q=&esrc=s&source=web&cd=&cad=rja&uact=8&ved=2ahUKEwiB5Z7_373_AhUr7LsIHUD_BuQQFnoECAwQAQ&url=https%3A%2F%2Froadtobio.eu%2Fuploads%2Fpublications%2Froadmap%2FRoadToBio_strategy_document.pdf&usg=AOvVaw1qrnY_1TW7ZLjMK51EfNPb (accessed on 15 March 2023).
  5. Purkus, A.; Hagemann, N.; Bedtke, N.; Gawel, E. Towards a sustainable innovation system for the German wood-based bioeconomy: Implications for policy design. J. Clean. Prod. 2018, 172, 3955–3968. [Google Scholar] [CrossRef]
  6. Dupont-Inglis, J.; Borg, A. Destination bioeconomy–The path towards a smarter, more sustainable future. New Biotechnol. 2018, 40, 140–143. [Google Scholar] [CrossRef] [PubMed]
  7. Keegan, D.; Kretschmer, B.; Elbersen, B.; Panoutsou, C. Cascading use: A systematic approach to biomass beyond the energy sector. Biofuels Bioprod. Biorefin. 2013, 7, 193–206. [Google Scholar] [CrossRef]
  8. Dragone, G.; Kerssemakers, A.A.; Driessen, J.L.; Yamakawa, C.K.; Brumano, L.P.; Mussatto, S.I. Innovation and strategic orientations for the development of advanced biorefineries. Bioresour. Technol. 2020, 302, 122847. [Google Scholar] [CrossRef]
  9. Qiao, Z.; Lü, X. Industrial bioethanol production: Status and bottlenecks. Advances in 2nd Generation of Bioethanol Production; Woodhead Publishing: Cambridge, UK, 2021; pp. 213–227. [Google Scholar] [CrossRef]
  10. Verstrepen, K.J.; Chambers, P.J.; Pretorius, I.S. The development of superior yeast strains for the food and beverage industries: Challenges, opportunities and potential benefits. In Yeasts in Food and Beverages; Springer: Berlin/Heidelberg, Germany, 2006; pp. 399–444. [Google Scholar] [CrossRef]
  11. Koutinas, A.A.; Vlysidis, A.; Pleissner, D.; Kopsahelis, N.; Garcia, I.L.; Kookos, I.K.; Papanikolaou, S.; Kwan, T.H.; Lin, C.S.K. Valorization of industrial waste and by-product streams via fermentation for the production of chemicals and biopolymers. Chem. Soc. Rev. 2014, 43, 2587–2627. [Google Scholar] [CrossRef]
  12. Demmelmayer, P.; Kienberger, M. Reactive extraction of lactic acid from sweet sorghum silage press juice. Sep. Purif. Technol. 2022, 282, 120090. [Google Scholar] [CrossRef]
  13. Holtz, A.; Görtz, J.; Kocks, C.; Junker, M.; Jupke, A. Automated measurement of pH-dependent solid–liquid equilibria of itaconic acid and protocatechuic acid. Fluid Phase Equilibria 2021, 532, 112893. [Google Scholar] [CrossRef]
  14. Kurzrock, T.; Weuster-Botz, D. New reactive extraction systems for separation of bio-succinic acid. Bioprocess Biosyst. Eng. 2011, 34, 779–787. [Google Scholar] [CrossRef]
  15. Zambanini, T.; Kleineberg, W.; Sarikaya, E.; Buescher, J.M.; Meurer, G.; Wierckx, N.; Blank, L.M. Enhanced malic acid production from glycerol with high-cell density Ustilago trichophora TZ1 cultivations. Biotechnol. Biofuels 2016, 9, 135. [Google Scholar] [CrossRef] [PubMed] [Green Version]
  16. Lesniak, W.; Pietkiewicz, J.; Podgorski, W. Citric acid fermentation from starch and dextrose syrups by a trace metal resistant mutant of Aspergillus niger. Biotechnol. Lett. 2002, 24, 1065–1067. [Google Scholar] [CrossRef]
  17. Huang, H.J.; Ramaswamy, S.; Tschirner, U.; Ramarao, B. A review of separation technologies in current and future biorefineries. Sep. Purif. Technol. 2008, 62, 1–21. [Google Scholar] [CrossRef]
  18. Hosseinpour Tehrani, H.; Saur, K.; Tharmasothirajan, A.; Blank, L.M.; Wierckx, N. Process engineering of pH tolerant Ustilago cynodontis for efficient itaconic acid production. Microb. Cell Factories 2019, 18, 213. [Google Scholar] [CrossRef] [Green Version]
  19. Becker, J.; Hosseinpour Tehrani, H.; Ernst, P.; Blank, L.M.; Wierckx, N. An optimized Ustilago maydis for itaconic acid production at maximal theoretical yield. J. Fungi 2020, 7, 20. [Google Scholar] [CrossRef]
  20. Noorman, H.J.; Heijnen, J.J. Biochemical engineering’s grand adventure. Chem. Eng. Sci. 2017, 170, 677–693. [Google Scholar] [CrossRef]
  21. Steiger, M.G.; Wierckx, N.; Blank, L.M.; Mattanovich, D.; Sauer, M. Itaconic acid—An emerging building block. In Industrial Biotechnology, Products and Processes; Wiley-VCH Verlag GmbH & Co. KGaA: Weinheim, Germany, 2017. [Google Scholar] [CrossRef]
  22. Okabe, M.; Lies, D.; Kanamasa, S.; Park, E.Y. Biotechnological production of itaconic acid and its biosynthesis in Aspergillus terreus. Appl. Microbiol. Biotechnol. 2009, 84, 597–606. [Google Scholar] [CrossRef] [Green Version]
  23. Marvel, C.; Shepherd, T.H. Polymerization reactions of itaconic acid and some of its derivatives. J. Org. Chem. 1959, 24, 599–605. [Google Scholar] [CrossRef]
  24. Bera, R.; Dey, A.; Chakrabarty, D. Synthesis, Characterization, and drug release study of acrylamide-co-itaconic acid based smart hydrogel. Polym. Eng. Sci. 2015, 55, 113–122. [Google Scholar] [CrossRef]
  25. Betancourt, T.; Pardo, J.; Soo, K.; Peppas, N.A. Characterization of pH-responsive hydrogels of poly (itaconic acid-g-ethylene glycol) prepared by UV-initiated free radical polymerization as biomaterials for oral delivery of bioactive agents. J. Biomed. Mater. Res. Part A 2010, 93, 175–188. [Google Scholar] [CrossRef] [Green Version]
  26. Khalid, S.; Qadir, M.; Massud, A.; Ali, M.; Rasool, M. Effect of degree of cross-linking on swelling and drug release behaviour of poly (methyl methacrylate-co-itaconic acid)[P (MMA/IA)] hydrogels for site specific drug delivery. J. Drug Deliv. Sci. Technol. 2009, 19, 413. [Google Scholar] [CrossRef]
  27. Ranjha, N.M.; Mudassir, J.; Akhtar, N. Methyl methacrylate-co-itaconic acid (MMA-co-IA) hydrogels for controlled drug delivery. J. Sol-Gel Sci. Technol. 2008, 47, 23–30. [Google Scholar] [CrossRef]
  28. Panic, V.V.; Seslija, S.I.; Popovic, I.G.; Spasojevic, V.D.; Popovic, A.R.; Nikolic, V.B.; Spasojevic, P.M. Simple one-pot synthesis of fully biobased unsaturated polyester resins based on itaconic acid. Biomacromolecules 2017, 18, 3881–3891. [Google Scholar] [CrossRef]
  29. Robert, C.; De Montigny, F.; Thomas, C.M. Tandem synthesis of alternating polyesters from renewable resources. Nat. Commun. 2011, 2, 586. [Google Scholar] [CrossRef] [Green Version]
  30. Nagai, K. New developments in the production of methyl methacrylate. Appl. Catal. A Gen. 2001, 221, 367–377. [Google Scholar] [CrossRef]
  31. Nubel, R.C.; Ratajak, E.J. Process for Producing Itaconic Acid. US Patent 3,044,941, 1962. [Google Scholar]
  32. Pfeifer, V.; Vojnovich, C.; Heger, E. Itaconic acid by fermentation with Aspergillus terreus. Ind. Eng. Chem. 1952, 44, 2975–2980. [Google Scholar] [CrossRef]
  33. Krull, S.; Hevekerl, A.; Kuenz, A.; Prüße, U. Process development of itaconic acid production by a natural wild type strain of Aspergillus terreus to reach industrially relevant final titers. Appl. Microbiol. Biotechnol. 2017, 101, 4063–4072. [Google Scholar] [CrossRef] [PubMed]
  34. Hevekerl, A.; Kuenz, A.; Vorlop, K.D. Influence of the pH on the itaconic acid production with Aspergillus terreus. Appl. Microbiol. Biotechnol. 2014, 98, 10005–10012. [Google Scholar] [CrossRef]
  35. Shin, W.S.; Lee, D.; Kim, S.; Jeong, Y.S.; Chun, G.T. Application of Scale-Up Criterion of Constant Oxygen Mass Transfer Coefficient (k_La) for Production of Itaconic Acid in a 50 L Pilot-Scale Fermentor by Fungal Cells of Aspergillus terreus. J. Microbiol. Biotechnol. 2013, 23, 1445–1453. [Google Scholar] [CrossRef] [PubMed] [Green Version]
  36. Sándor, E.; Kolláth, I.S.; Fekete, E.; Bíró, V.; Flipphi, M.; Kovács, B.; Kubicek, C.P.; Karaffa, L. Carbon-source dependent interplay of copper and manganese ions modulates the morphology and itaconic acid production in Aspergillus terreus. Front. Microbiol. 2021, 12, 680420. [Google Scholar] [CrossRef]
  37. Gao, Q.; Liu, J.; Liu, L. Relationship between morphology and itaconic acid production by Aspergillus terreus. J. Microbiol. Biotechnol. 2014, 24, 168–176. [Google Scholar] [CrossRef]
  38. Ausschuss für Biologische Arbeitsstoffe. TRBA 460 Classification of Fungi into Risk Groups. Available online: https://www.baua.de/DE/Angebote/Rechtstexte-und-Technische-Regeln/Regelwerk/TRBA/pdf/TRBA-460.pdf?__blob=publicationFile (accessed on 15 March 2023).
  39. Harder, B.J.; Bettenbrock, K.; Klamt, S. Model-based metabolic engineering enables high yield itaconic acid production by Escherichia coli. Metab. Eng. 2016, 38, 29–37. [Google Scholar] [CrossRef]
  40. Otten, A.; Brocker, M.; Bott, M. Metabolic engineering of Corynebacterium glutamicum for the production of itaconate. Metab. Eng. 2015, 30, 156–165. [Google Scholar] [CrossRef]
  41. Krull, S.; Lünsmann, M.; Prüße, U.; Kuenz, A. Ustilago Rabenhorstiana—An alternative natural itaconic acid producer. Fermentation 2020, 6, 4. [Google Scholar] [CrossRef] [Green Version]
  42. Wierckx, N.; Miebach, K.; Ihling, N.; Hussnaetter, K.P.; Büchs, J.; Schipper, K. Perspectives for the application of Ustilaginaceae as biotech cell factories. Essays Biochem. 2021, 65, 365–379. [Google Scholar] [CrossRef]
  43. Geiser, E.; Wiebach, V.; Wierckx, N.; Blank, L.M. Prospecting the biodiversity of the fungal family Ustilaginaceae for the production of value-added chemicals. Fungal Biol. Biotechnol. 2014, 1, 1–10. [Google Scholar] [CrossRef] [Green Version]
  44. Hosseinpour-Tehrani, H.; Tharmasothirajan, A.; Track, E.; Blank, L.M.; Wierckx, N. Engineering the morphology and metabolism of pH tolerant Ustilago cynodontis for efficient itaconic acid production. Metab. Eng. 2019, 54, 293–300. [Google Scholar] [CrossRef]
  45. Schlembach, I.; Hosseinpour Tehrani, H.; Blank, L.M.; Büchs, J.; Wierckx, N.; Regestein, L.; Rosenbaum, M.A. Consolidated bioprocessing of cellulose to itaconic acid by a co-culture of Trichoderma reesei and Ustilago maydis. Biotechnol. Biofuels 2020, 13, 1–18. [Google Scholar] [CrossRef]
  46. Geiser, E.; Przybilla, S.K.; Friedrich, A.; Buckel, W.; Wierckx, N.; Blank, L.M.; Bölker, M. Ustilago maydis produces itaconic acid via the unusual intermediate trans-aconitate. Microb. Biotechnol. 2016, 9, 116–126. [Google Scholar] [CrossRef] [Green Version]
  47. Regestein, L.; Klement, T.; Grande, P.; Kreyenschulte, D.; Heyman, B.; Maßmann, T.; Eggert, A.; Sengpiel, R.; Wang, Y.; Wierckx, N.; et al. From beech wood to itaconic acid: Case study on biorefinery process integration. Biotechnol. Biofuels 2018, 11, 1–11. [Google Scholar] [CrossRef]
  48. Zambanini, T.; Hosseinpour Tehrani, H.; Geiser, E.; Merker, D.; Schleese, S.; Krabbe, J.; Buescher, J.M.; Meurer, G.; Wierckx, N.; Blank, L.M. Efficient itaconic acid production from glycerol with Ustilago vetiveriae TZ1. Biotechnol. Biofuels 2017, 10, 1–15. [Google Scholar] [CrossRef] [Green Version]
  49. Couturier, M.; Navarro, D.; Olivé, C.; Chevret, D.; Haon, M.; Favel, A.; Lesage-Meessen, L.; Henrissat, B.; Coutinho, P.M.; Berrin, J.G. Post-genomic analyses of fungal lignocellulosic biomass degradation reveal the unexpected potential of the plant pathogen Ustilago maydis. BMC Genom. 2012, 13, 57. [Google Scholar] [CrossRef] [PubMed] [Green Version]
  50. Palmonari, A.; Cavallini, D.; Sniffen, C.; Fernandes, L.; Holder, P.; Fagioli, L.; Fusaro, I.; Biagi, G.; Formigoni, A.; Mammi, L. Characterization of molasses chemical composition. J. Dairy Sci. 2020, 103, 6244–6249. [Google Scholar] [CrossRef] [PubMed]
  51. Haji Esmaeili, S.A.; Sobhani, A.; Ebrahimi, S.; Szmerekovsky, J.; Dybing, A.; Keramati, A. Location allocation of biorefineries for a switchgrass-based bioethanol supply chain using energy consumption and emissions. Logistics 2023, 7, 5. [Google Scholar] [CrossRef]
  52. Heyman, B.; Tulke, H.; Putri, S.P.; Fukusaki, E.; Büchs, J. Online monitoring of the respiratory quotient reveals metabolic phases during microaerobic 2, 3-butanediol production with Bacillus licheniformis. Eng. Life Sci. 2020, 20, 133–144. [Google Scholar] [CrossRef] [PubMed] [Green Version]
  53. Kreyenschulte, D.; Heyman, B.; Eggert, A.; Maßmann, T.; Kalvelage, C.; Kossack, R.; Regestein, L.; Jupke, A.; Büchs, J. In situ reactive extraction of itaconic acid during fermentation of Aspergillus terreus. Biochem. Eng. J. 2018, 135, 133–141. [Google Scholar] [CrossRef]
  54. Peña, C.; Galindo, E.; Büchs, J. The viscosifying power, degree of acetylation and molecular mass of the alginate produced by Azotobacter vinelandii in shake flasks are determined by the oxygen transfer rate. Process Biochem. 2011, 46, 290–297. [Google Scholar] [CrossRef]
  55. Alsmeyer, F.; Koß, H.J.; Marquardt, W. Indirect spectral hard modeling for the analysis of reactive and interacting mixtures. Appl. Spectrosc. 2004, 58, 975–985. [Google Scholar] [CrossRef]
  56. Kriesten, E.; Alsmeyer, F.; Bardow, A.; Marquardt, W. Fully automated indirect hard modeling of mixture spectra. Chemom. Intell. Lab. Syst. 2008, 91, 181–193. [Google Scholar] [CrossRef]
  57. Kriesten, E.; Mayer, D.; Alsmeyer, F.; Minnich, C.; Greiner, L.; Marquardt, W. Identification of unknown pure component spectra by indirect hard modeling. Chemom. Intell. Lab. Syst. 2008, 93, 108–119. [Google Scholar] [CrossRef]
  58. López-Garzón, C.S.; Straathof, A.J. Recovery of carboxylic acids produced by fermentation. Biotechnol. Adv. 2014, 32, 873–904. [Google Scholar] [CrossRef]
  59. Song, H.; Huh, Y.S.; Lee, S.Y.; Hong, W.H.; Hong, Y.K. Recovery of succinic acid produced by fermentation of a metabolically engineered Mannheimia succiniciproducens strain. J. Biotechnol. 2007, 132, 445–452. [Google Scholar] [CrossRef] [PubMed]
  60. Eggert, A.; Maßmann, T.; Kreyenschulte, D.; Becker, M.; Heyman, B.; Büchs, J.; Jupke, A. Integrated in situ product removal process concept for itaconic acid by reactive extraction, pH-shift back extraction and purification by pH-shift crystallization. Sep. Purif. Technol. 2019, 215, 463–472. [Google Scholar] [CrossRef]
  61. Davison, B.H.; Nghiem, N.P.; Richardson, G.L. Succinic acid adsorption from fermentation broth and regeneration. In Proceedings of the Twenty-Fifth Symposium on Biotechnology for Fuels and Chemicals, Breckenridge, CO, USA, 4–7 May 2003; Humana Press: Totowa, NJ, USA, 2004; pp. 653–669. [Google Scholar] [CrossRef]
  62. González, M.I.; Álvarez, S.; Riera, F.A.; Álvarez, R. Purification of lactic acid from fermentation broths by ion-exchange resins. Ind. Eng. Chem. Res. 2006, 45, 3243–3247. [Google Scholar] [CrossRef]
  63. Pal, P.; Sikder, J.; Roy, S.; Giorno, L. Process intensification in lactic acid production: A review of membrane based processes. Chem. Eng. Process. Process Intensif. 2009, 48, 1549–1559. [Google Scholar] [CrossRef]
  64. Cuellar, M.C.; Herreilers, S.N.; Straathof, A.J.; Heijnen, J.J.; van der Wielen, L.A. Limits of operation for the integration of water removal by membranes and crystallization of l-phenylalanine. Ind. Eng. Chem. Res. 2009, 48, 1566–1573. [Google Scholar] [CrossRef]
  65. Ling, L.P.; Leow, H.F.; Sarmidi, M.R. Citric acid concentration by electrodialysis: Ion and water transport modelling. J. Membr. Sci. 2002, 199, 59–67. [Google Scholar] [CrossRef] [Green Version]
  66. Gao, M.T.; Hirata, M.; Toorisaka, E.; Hano, T. Development of a fermentation process for production of calcium-l-lactate. Chem. Eng. Process. Process Intensif. 2009, 48, 464–469. [Google Scholar] [CrossRef]
  67. Gausmann, M.; Kocks, C.; Doeker, M.; Eggert, A.; Maßmann, T.; Jupke, A. Recovery of succinic acid by integrated multi-phase electrochemical pH-shift extraction and crystallization. Sep. Purif. Technol. 2020, 240, 116489. [Google Scholar] [CrossRef]
  68. Kocks, C.; Görtz, J.; Holtz, A.; Gausmann, M.; Jupke, A. Electrochemical crystallization concept for succinic acid reduces waste salt production. Chem. Ing. Tech. 2020, 92, 221–228. [Google Scholar] [CrossRef] [Green Version]
  69. Magalhães, A.I.; de Carvalho, J.C.; Medina, J.D.C.; Soccol, C.R. Downstream process development in biotechnological itaconic acid manufacturing. Appl. Microbiol. Biotechnol. 2017, 101, 1–12. [Google Scholar] [CrossRef]
  70. Magalhaes Jr, A.I.; de Carvalho, J.C.; Thoms, J.F.; Medina, J.D.C.; Soccol, C.R. Techno-economic analysis of downstream processes in itaconic acid production from fermentation broth. J. Clean. Prod. 2019, 206, 336–348. [Google Scholar] [CrossRef]
  71. Geiser, E.; Przybilla, S.K.; Engel, M.; Kleineberg, W.; Büttner, L.; Sarikaya, E.; Den Hartog, T.; Klankermayer, J.; Leitner, W.; Bölker, M.; et al. Genetic and biochemical insights into the itaconate pathway of Ustilago maydis enable enhanced production. Metab. Eng. 2016, 38, 427–435. [Google Scholar] [CrossRef]
  72. Lide, D.R. CRC Handbook of Chemistry and Physics; CRC press: Boca Raton, FL, USA, 2004; Volume 85. [Google Scholar]
  73. De Haan, A.B.; Van Breugel, J.; van der Weide, P.L.J.; Jansen, P.P.; Lancis, J.M.V.; Baro, A.C. Recovery of carboxylic acid from their magnesium salts by precipitation using hydrochloric acid, useful for fermentation broth work-up. Google Patents. Patent No. WO2013025107A1, 21 February 2013. [Google Scholar]
  74. Hosseinpour Tehrani, H.; Becker, J.; Bator, I.; Saur, K.; Meyer, S.; Rodrigues Lóia, A.C.; Blank, L.M.; Wierckx, N. Integrated strain-and process design enable production of 220 g L- 1 itaconic acid with Ustilago maydis. Biotechnol. Biofuels 2019, 12, 1–11. [Google Scholar] [CrossRef]
  75. Tan, L.; Sun, Z.Y.; Okamoto, S.; Takaki, M.; Tang, Y.Q.; Morimura, S.; Kida, K. Production of ethanol from raw juice and thick juice of sugar beet by continuous ethanol fermentation with flocculating yeast strain KF-7. Biomass Bioenergy 2015, 81, 265–272. [Google Scholar] [CrossRef]
  76. Klement, T.; Milker, S.; Jäger, G.; Grande, P.M.; Domínguez de María, P.; Büchs, J. Biomass pretreatment affects Ustilago maydis in producing itaconic acid. Microb. Cell Factories 2012, 11, 43. [Google Scholar] [CrossRef] [Green Version]
  77. Soest, H.K.; Klipper, R.; Schnegg, U.; Gladysch, M. Sugar Juice Decolorization by Means of Mondisperse Anion Exchangers. Google Patents. Patent No. US6942805B2, 13 September 2005. [Google Scholar]
  78. Bento, L.S.M. Application of ion exchange resins for sugar liquors decolourisation. In Proceedings of the XXIII ISSCT Congress, New Delhi, India, 22–26 February 1999; Sugar Technologists’ Association of India: New Delhi, India, 1999; Volume 1, pp. 68–75. [Google Scholar]
  79. Qin, T.; Song, M.; Jiang, K.; Zhou, J.; Zhuang, W.; Chen, Y.; Liu, D.; Chen, X.; Ying, H.; Wu, J. Efficient decolorization of citric acid fermentation broth using carbon materials prepared from phosphoric acid activation of hydrothermally treated corncob. Rsc Adv. 2017, 7, 37112–37121. [Google Scholar] [CrossRef] [Green Version]
  80. Alexandri, M.; Vlysidis, A.; Papapostolou, H.; Tverezovskaya, O.; Tverezovskiy, V.; Kookos, I.K.; Koutinas, A. Downstream separation and purification of succinic acid from fermentation broths using spent sulphite liquor as feedstock. Sep. Purif. Technol. 2019, 209, 666–675. [Google Scholar] [CrossRef] [Green Version]
  81. Omwene, P.I.; Yagcioglu, M.; Sarihan, Z.B.O.; Karagunduz, A.; Keskinler, B. Recovery of succinic acid from whey fermentation broth by reactive extraction coupled with multistage processes. J. Environ. Chem. Eng. 2020, 8, 104216. [Google Scholar] [CrossRef]
  82. Ortíz-de Lira, A.; Reynel-Ávila, H.E.; Díaz-Muñoz, L.L.; Mendoza-Castillo, D.I.; Aminabhavi, T.M.; Badawi, M.; Bonilla-Petriciolet, A. Sustainable Downstream Separation of Itaconic Acid Using Carbon-Based Adsorbents. Adsorpt. Sci. Technol. 2022, 2022, 7333005. [Google Scholar] [CrossRef]
  83. Coca, M.; García, M.T.; Mato, S.; Cartón, Á.; González, G. Evolution of colorants in sugarbeet juices during decolorization using styrenic resins. J. Food Eng. 2008, 89, 429–434. [Google Scholar] [CrossRef]
  84. Luo, W.J.; Lu, H.Q.; Lei, F.H.; Cheng, L.Y.; Li, K.; Li, W. Structural elucidation of high-molecular-weight alkaline degradation products of hexoses. Food Sci. Nutr. 2020, 8, 2848–2853. [Google Scholar] [CrossRef]
  85. Gluszcz, P.; Jamroz, T.; Sencio, B.; Ledakowicz, S. Equilibrium and dynamic investigations of organic acids adsorption onto ion-exchange resins. Bioprocess Biosyst. Eng. 2004, 26, 185–190. [Google Scholar] [CrossRef]
  86. Cooney, D.O.; Nagerl, A.; Hines, A.L. Solvent regeneration of activated carbon. Water Res. 1983, 17, 403–410. [Google Scholar] [CrossRef]
  87. El Gamal, M.; Mousa, H.A.; El-Naas, M.H.; Zacharia, R.; Judd, S. Bio-regeneration of activated carbon: A comprehensive review. Sep. Purif. Technol. 2018, 197, 345–359. [Google Scholar] [CrossRef]
  88. Böhm, L.; Hohl, L.; Bliatsiou, C.; Kraume, M. Multiphase Stirred Tank Bioreactors–New Geometrical Concepts and Scale-up Approaches. Chem. Ing. Tech. 2019, 91, 1724–1746. [Google Scholar] [CrossRef]
  89. Sugiyama, M.; Sasano, Y.; Harashima, S. Mechanism of yeast adaptation to weak organic acid stress. In Stress Biology of Yeasts and Fungi; Springer: Tokyo, Japan, 2015; pp. 107–121. [Google Scholar]
  90. Aguilar, L.R.; Pardo, J.P.; Lomelí, M.M.; Bocardo, O.I.L.; Juárez Oropeza, M.A.; Guerra Sánchez, G. Lipid droplets accumulation and other biochemical changes induced in the fungal pathogen Ustilago maydis under nitrogen-starvation. Arch. Microbiol. 2017, 199, 1195–1209. [Google Scholar] [CrossRef]
  91. Morita, T.; Konishi, M.; Fukuoka, T.; Imura, T.; Kitamoto, D. Identification of Ustilago cynodontis as a new producer of glycolipid biosurfactants, mannosylerythritol lipids, based on ribosomal DNA sequences. J. Oleo Sci. 2008, 57, 549–556. [Google Scholar] [CrossRef] [PubMed] [Green Version]
  92. Jones, R.R.; Hooper, D.C.; Zhang, L.; Wolverson, D.; Valev, V.K. Raman techniques: Fundamentals and frontiers. Nanoscale Res. Lett. 2019, 14, 1–34. [Google Scholar] [CrossRef] [Green Version]
  93. Echtermeyer, A.; Marks, C.; Mitsos, A.; Viell, J. Inline Raman Spectroscopy and Indirect Hard Modeling for Concentration Monitoring of Dissociated Acid Species. Appl. Spectrosc. 2021, 75, 506–519. [Google Scholar] [CrossRef]
  94. Lupoi, J.S.; Gjersing, E.; Davis, M.F. Evaluating lignocellulosic biomass, its derivatives, and downstream products with Raman spectroscopy. Front. Bioeng. Biotechnol. 2015, 3, 50. [Google Scholar] [CrossRef] [Green Version]
  95. Wei, D.; Chen, S.; Liu, Q. Review of fluorescence suppression techniques in Raman spectroscopy. Appl. Spectrosc. Rev. 2015, 50, 387–406. [Google Scholar] [CrossRef]
  96. de Witt, J.; Ernst, P.; Gätgens, J.; Noack, S.; Hiller, D.; Wynands, B.; Wierckx, N. Characterization and engineering of the branched short-chain dicarboxylate metabolism of Pseudomonas reveals resistance to fungal 2-hydroxyparaconate. Metab. Eng. 2022, 75, 205–216. [Google Scholar] [CrossRef]
  97. Itaconic Acid Absorption Spectrum (UV-Vis). In Spectrabase. Available online: https://spectrabase.com/spectrum/v5lTSjr91J (accessed on 29 March 2023).
  98. Allan, J.; Bonner, J.; Werninck, A.; Bowley, H.; Gerrard, D. Thermal studies on itaconic acid compounds of some transition metal ions. Thermochim. Acta 1987, 122, 295–303. [Google Scholar] [CrossRef]
  99. Eurostat. (11. Mai, 2022). Industriestrompreise in Deutschland in den Jahren 2001 bis 2021 (in Euro-Cent pro Kilowattstunde). In Statista. Available online: https://de.statista.com/statistik/daten/studie/155964/umfrage/entwicklung-der-industriestrompreise-in-deutschland-seit-1995/ (accessed on 8 November 2022).
  100. Trading Economics. EU Carbon Permits, Historical Data, Price from 02.07.2020. Available online: https://tradingeconomics.com/commodity/carbon (accessed on 8 November 2022).
  101. Statista. (20 October 2022). Euro (EUR) to U.S. Dollar (USD) Exchange Rate from January 1999 to 19 October 2022. Available online: https://www.statista.com/statistics/412794/euro-to-u-s-dollar-annual-average-exchange-rate/. (accessed on 8 November 2022). (In Statista).
  102. Klöckner, W.; Gacem, R.; Anderlei, T.; Raven, N.; Schillberg, S.; Lattermann, C.; Büchs, J. Correlation between mass transfer coefficient k L a and relevant operating parameters in cylindrical disposable shaken bioreactors on a bench-to-pilot scale. J. Biol. Eng. 2013, 7, 28. [Google Scholar] [CrossRef] [PubMed] [Green Version]
  103. Tauler, R.; Kowalski, B.; Fleming, S. Multivariate curve resolution applied to spectral data from multiple runs of an industrial process. Anal. Chem. 1993, 65, 2040–2047. [Google Scholar] [CrossRef]
  104. Garrido, M.; Rius, F.; Larrechi, M. Multivariate curve resolution–alternating least squares (MCR-ALS) applied to spectroscopic data from monitoring chemical reactions processes. Anal. Bioanal. Chem. 2008, 390, 2059–2066. [Google Scholar] [CrossRef]
  105. De Juan, A.; Jaumot, J.; Tauler, R. Multivariate Curve Resolution (MCR). Solving the mixture analysis problem. Anal. Methods 2014, 6, 4964–4976. [Google Scholar] [CrossRef]
  106. Felten, J.; Hall, H.; Jaumot, J.; Tauler, R.; De Juan, A.; Gorzsás, A. Vibrational spectroscopic image analysis of biological material using multivariate curve resolution–alternating least squares (MCR-ALS). Nat. Protoc. 2015, 10, 217–240. [Google Scholar] [CrossRef]
  107. Brizuela, A.B.; Bichara, L.C.; Romano, E.; Yurquina, A.; Locatelli, S.; Brandán, S.A. A complete characterization of the vibrational spectra of sucrose. Carbohydr. Res. 2012, 361, 212–218. [Google Scholar] [CrossRef] [PubMed]
  108. Mathlouthi, M.; Luu, D.V. Laser-Raman spectra of d-fructose in aqueous solution. Carbohydr. Res. 1980, 78, 225–233. [Google Scholar] [CrossRef]
  109. Mathlouthi, M.; Luu, D.V. Laser-raman spectra of d-glucose and sucrose in aqueous solution. Carbohydr. Res. 1980, 81, 203–212. [Google Scholar] [CrossRef]
  110. Wiercigroch, E.; Szafraniec, E.; Czamara, K.; Pacia, M.Z.; Majzner, K.; Kochan, K.; Kaczor, A.; Baranska, M.; Malek, K. Raman and infrared spectroscopy of carbohydrates: A review. Spectrochim. Acta Part A Mol. Biomol. Spectrosc. 2017, 185, 317–335. [Google Scholar] [CrossRef] [PubMed]
  111. Shallenberger, R.S. Intrinsic chemistry of fructose. Pure Appl. Chem. 1978, 50, 1409–1420. [Google Scholar] [CrossRef]
  112. Génin, F.; Quilès, F.; Burneau, A. Infrared and Raman spectroscopic study of carboxylic acids in heavy water. Phys. Chem. Chem. Phys. 2001, 3, 932–942. [Google Scholar] [CrossRef]
  113. Turi, L.; Dannenberg, J. Molecular orbital study of acetic acid aggregation. 1. Monomers and dimers. J. Phys. Chem. 1993, 97, 12197–12204. [Google Scholar] [CrossRef]
  114. Long, G.L.; Winefordner, J.D. Limit of Detection A Closer Look at the IUPAC Definition. Anal. Chem. 1983, 55, 712A–724A. [Google Scholar] [CrossRef]
Figure 1. Flowsheet of multiple crystallization process for ITA purification.
Bioengineering 10 00723 g001
Figure 2. Operative cost analysis of ITA production by Ustilago sp.
Bioengineering 10 00723 g002
Figure 3. Extended-batch fermentation of U. cynodontis ITA Max pH with pH shift and thick juice as carbon source. (a) OTR, CTR and RQ. The horizontal dashed line shows RQ = 1. RQ values are only shown for OTR > 10 mmol/(L·h). (b) DOT and filling volume. (c) CDW and pH. (d) Sucrose, glucose, fructose and ITA concentration. For the batch phase, 100 g/L sucrose via thick juice are initially added to the medium. During the feed phase (between the vertical solid lines) a total of 62.1 g of additional sucrose are added into the fermentation vessel. Cultivation is performed in a 2 L stirred tank reactor with an initial filling volume of 1 L at 30 °C with a constant aeration and stirring rate of 1 L/min and 800 rpm, respectively. Drops in the filling volume indicate sampling points. pH is kept above 6.5 or 3.6 before and after the pH shift, respectively, by addition of 5 M NaOH. For clarity, only every 15th measured online data point is shown.
Bioengineering 10 00723 g003
Figure 4. Identification of suitable decolorization agents. (a) Decolorization of artificially prepared broth with 50 g/L decolorization agent. (b) ITA adsorption from artificially prepared broth. Artificially prepared broth consists of 50 g/L ITA and 260 g/L thick juice at pH 2.0. The screening is performed at 20 °C.
Bioengineering 10 00723 g004
Figure 5. Amount of resin needed for XAD-1180 and AC-1 to sufficiently decolorize crystals after the first and second pH shift cooling crystallization. (a) Decolorization with XAD-1180. (b) Decolorization with AC-1. Dashed lines indicate the proposed resin concentration for sufficient decolorization. (c) ITA yield depending on resin concentration for XAD-1180 and AC-1.
Bioengineering 10 00723 g005
Figure 6. 100 L batch fermentation of U. cynodontis ITA Max pH with pH shift and thick juice as sole carbon source. (a) OTR, CTR and RQ. The horizontal dashed line shows RQ = 1. RQ values are only shown for OTR values > 10 mmol/(L·h). (b) DOT, absolute aeration rate and filling volume. (c) CDW concentration and pH. (d) Sucrose, glucose, fructose and ITA concentration. 137 g/L sucrose from thick juice are initially added to the medium. Cultivation is performed in a 150 L stirred tank pressure reactor with an initial filling volume of 105 L at 30 °C with a stirring rate of 285 rpm and gauge pressure of 300 mbar. pH is controlled by addition of 5 M NaOH.
Bioengineering 10 00723 g006
Figure 7. Assignment of molecular vibrations to the Raman spectrum of fermentation broth, recorded during the 100 L fermentation. (a) At 0 h, the broth contains 137 g/L sucrose and no product, as confirmed by the presence of sucrose bands. (b) At 187 h, broth contains 66.4 g/L ITA and no sugars, as confirmed by the presence of ITA bands. A linear baseline has been applied to both spectra. ν : stretching, ν s: symmetric stretching and γ : deformation modes.
Bioengineering 10 00723 g007
Figure 8. Broth or crystal sample at each process step along the purification sequence.
Bioengineering 10 00723 g008
Table 1. Solubility of common co-salts in water at 25 °C.
Co-Salt 1Solubility [72] [gAnhydrous/kgH2O]Volumetric Solubility 2 [mol/LSolution]Volumetric ITA-eq. Solubility [molITA-eq/LSolution]
NaCl360.005.272.63
Na2SO4281.001.791.79
NaH2PO4949.005.632.81
NaNO3912.007.633.81
KCl355.004.032.02
K2SO4120.000.660.66
KH2PO4250.001.660.83
KNO3383.003.201.60
NH4Cl395.005.852.92
(NH4)2SO4764.004.034.03
NH4H2PO4404.002.861.43
NH4NO32130.0011.875.94
CaCl2813.005.305.30
CaSO42.050.020.02
Ca(H2PO4)2No value found--
Ca(NO3)21440.005.565.56
MgCl2560.004.734.73
MgSO4357.002.612.61
Mg(H2PO4)2No value found--
Mg(NO3)2712.003.663.66
1 Chemical formulas are written in anhydrous form, although the actual precipitate may be a hydrate. 2 Volume of mixture is calculated ideally.
Table 2. Costs of selected acids for pH adjustment before crystallization.
AcidSpecific Acid Price 1 [USD/tonne]Molar Acid Price [USD/kmol]Number of Protons Provided (pH = 2–7)Acid Price Per Proton eq. [USD/kmolH+-eq]
HCl2007.2917.29
H2SO420019.6229.81
H3PO470068.60168.60
HNO333020.79120.79
1 Prices are averaged on the grounds of personal communication with suppliers for the German market in 2020.
Table 3. Solubility of ITA-salts in water at T = 25 °C and pH > 7 1.
Itaconate SaltSpecific Solubility [g/L]Molar Solubility [mol/L]
Na2ITA420.18 ± 1.342.41 ± 0.01
K2ITA 1571.37 ± 56.644.39 ± 0.43
MgITA403.35 ± 13.492.65 ± 0.09
CaITA6.27 ± 0.210.04 ± 0.00
1 Solubility might be higher, the experiment is terminated at this concentration due to high viscosity.
Table 4. Fermentation data of Ustilago sp. on pure glucose in pulsed fed-batch fermentations.
OrganismFermentation ConditionsProduct Titer [gITA/L]Overall Yield [gITA/gGlucose]
U. cynodontis NBRC 9727 Δ f u z 7   Δ c y p 3 P etefmttA Pria1ria1pH = 6.0 (growth phase), pH = 3.6 (production phase), 0.8 gNH4Cl/L [18]41.8 ± 0.30.39 ± 0.0
U. maydis MB215 Δ c y p 3   Δ MEL Δ UA Δ d g a t   Δ P ria::Petef  Δ f u z 7 Petef mttA_K14pH = 6.5, 0.8 gNH4Cl/L [19]59.6 ± 5.90.42 ± 0.02
Table 5. Decolorization resins used in screening experiments.
Decolorization AgentAbbreviationAdsorption BehaviorFunctional GroupParticle Size [mm]
Activated vegetal charcoalAC-1hydrophobicmultiplepowder
Carbon powder activatedAC-2hydrophobicmultiplepowder
Amberlite XAD-1180XAD-1180hydrophobicnone0.350–0.600
Amberlite IRA-96IRA-96weak base aniontertiary amine 10.550–0.750
Amberlite IRA-900 (Cl)IRA-900strong base aniontrimethylammonium0.650–0.820
Amberlite IRA-410 (Cl)IRA-410strong base aniondimethylethanol ammonium0.600-0.750
1 no specific data to the nature of tertiary amine available in DuPont datasheet.
Table 6. Fermentation KPIs in laboratory-scale and 100 L scale.
FermentationITA Production Normalized to CDW [gITA/gCDW]STY Normalized to CDW [gITA/(h·CDW)]Yield [gITA/gglucose]Final Titer [gITA/L]
Thick juice, 1L2.450.0150.4666.6
Thick juice, 100 L5.490.0290.4466.4
Table 7. Experimental and simulated ITA yields of each process step.
Process StepYieldlab [%]Yield100L [%]Yieldsim [%]
1. concentration and cooling crystallization91.6271.5283.49
2. concentration and cooling crystallization67.5057.1574.15
Decolorization93.6598.41100.00
Evaporative crystallization86.8387.9390.01
Table 8. Experimental 1 and simulated process variables.
Process StreampHlab [-]pH100L [-]pHsim [-]cITA,lab [g/L]cITA,100L [g/L]cITA,sim [g/L]cCl-,lab [mol/L]cCl-,100L [mol/L]cCl-,sim [mol/L]Puritylab [wt%]Purity100L [wt%]
Filtered broth3.673.673.6762.68 ± 1.0453.29 ± 0.3653.330.000.000.00--
Broth after 1st concentration3.623.633.67394.90 ± 1.18348.85 ± 2.71353.480.20 ± 0.010.000.00--
Broth after 1st pH shift2.802.14 21.94303.78 ± 0.94294.65 ± 4.51310.0931.06 ± 0.020.94--
1st Solid fraction---------97.65 ± 0.0197.64 ± 0.24
Mother liquor after 1st crystallization2.832.622.8041.30 ± 0.3559.52 ± 0.2269.631.75 ± 0.011.66 ± 0.011.21--
Broth after 2nd concentration2.542.272.71102.90 ± 0.15210.55 ± 4.36201.164.41 ± 0.053.12 ± 0.063.51--
Broth after 2nd pH shift2.562.272.02102.90 ± 0.15 3210.55 ± 4.36198.9833.12 ± 0.063.55--
2nd Solid fraction---------101.63 ± 0.5931.22 ± 4.06
Mother liquor after 2nd crystallization2.722.552.8037.56 ± 0.34111.15 ± 4.1767.474.74 ± 0.043.49 ± 0.124.48--
Solution after Dissolution1.991.962.0672.94 ± 0.2772.54 ± 0.3272.480.06 ± 0.010.05 ± 0.000.00--
Solution after Decolorization1.982.082.0669.65 ± 0.4669.95 ± 0.8472.480.06 ± 0.010.05 ± 0.000.00--
3rd Solid fraction---------98.57 ± 3.39101.05 ± 1.00
Mother liquor after 3rd crystallization2.142.452.0655.02 ± 0.0649.23 ± 0.8373.820.59 ± 0.011.55 ± 0.010.00--
1 Experimental parameters are determined offline at 20 °C; 2 Determined online at approx. 60 °C since ambient conditions cause solid precipitation; 3 not determined as pH-shift and cooling are conducted simultaneously (Appendix L).
Disclaimer/Publisher’s Note: The statements, opinions and data contained in all publications are solely those of the individual author(s) and contributor(s) and not of MDPI and/or the editor(s). MDPI and/or the editor(s) disclaim responsibility for any injury to people or property resulting from any ideas, methods, instructions or products referred to in the content.

