Collinearity and Dimensionality Reduction in Radiomics: Effect of Preprocessing Parameters in Hypertrophic Cardiomyopathy Magnetic Resonance T1 and T2 Mapping
Abstract
1. Introduction
2. Materials and Methods
2.1. Dataset
2.2. Cardiac MRI
2.3. T1 and T2 Maps Preprocessing
2.4. Radiomic Features Estimation
2.5. Collinearity Analysis and Dimensionality Reduction
- Effect A
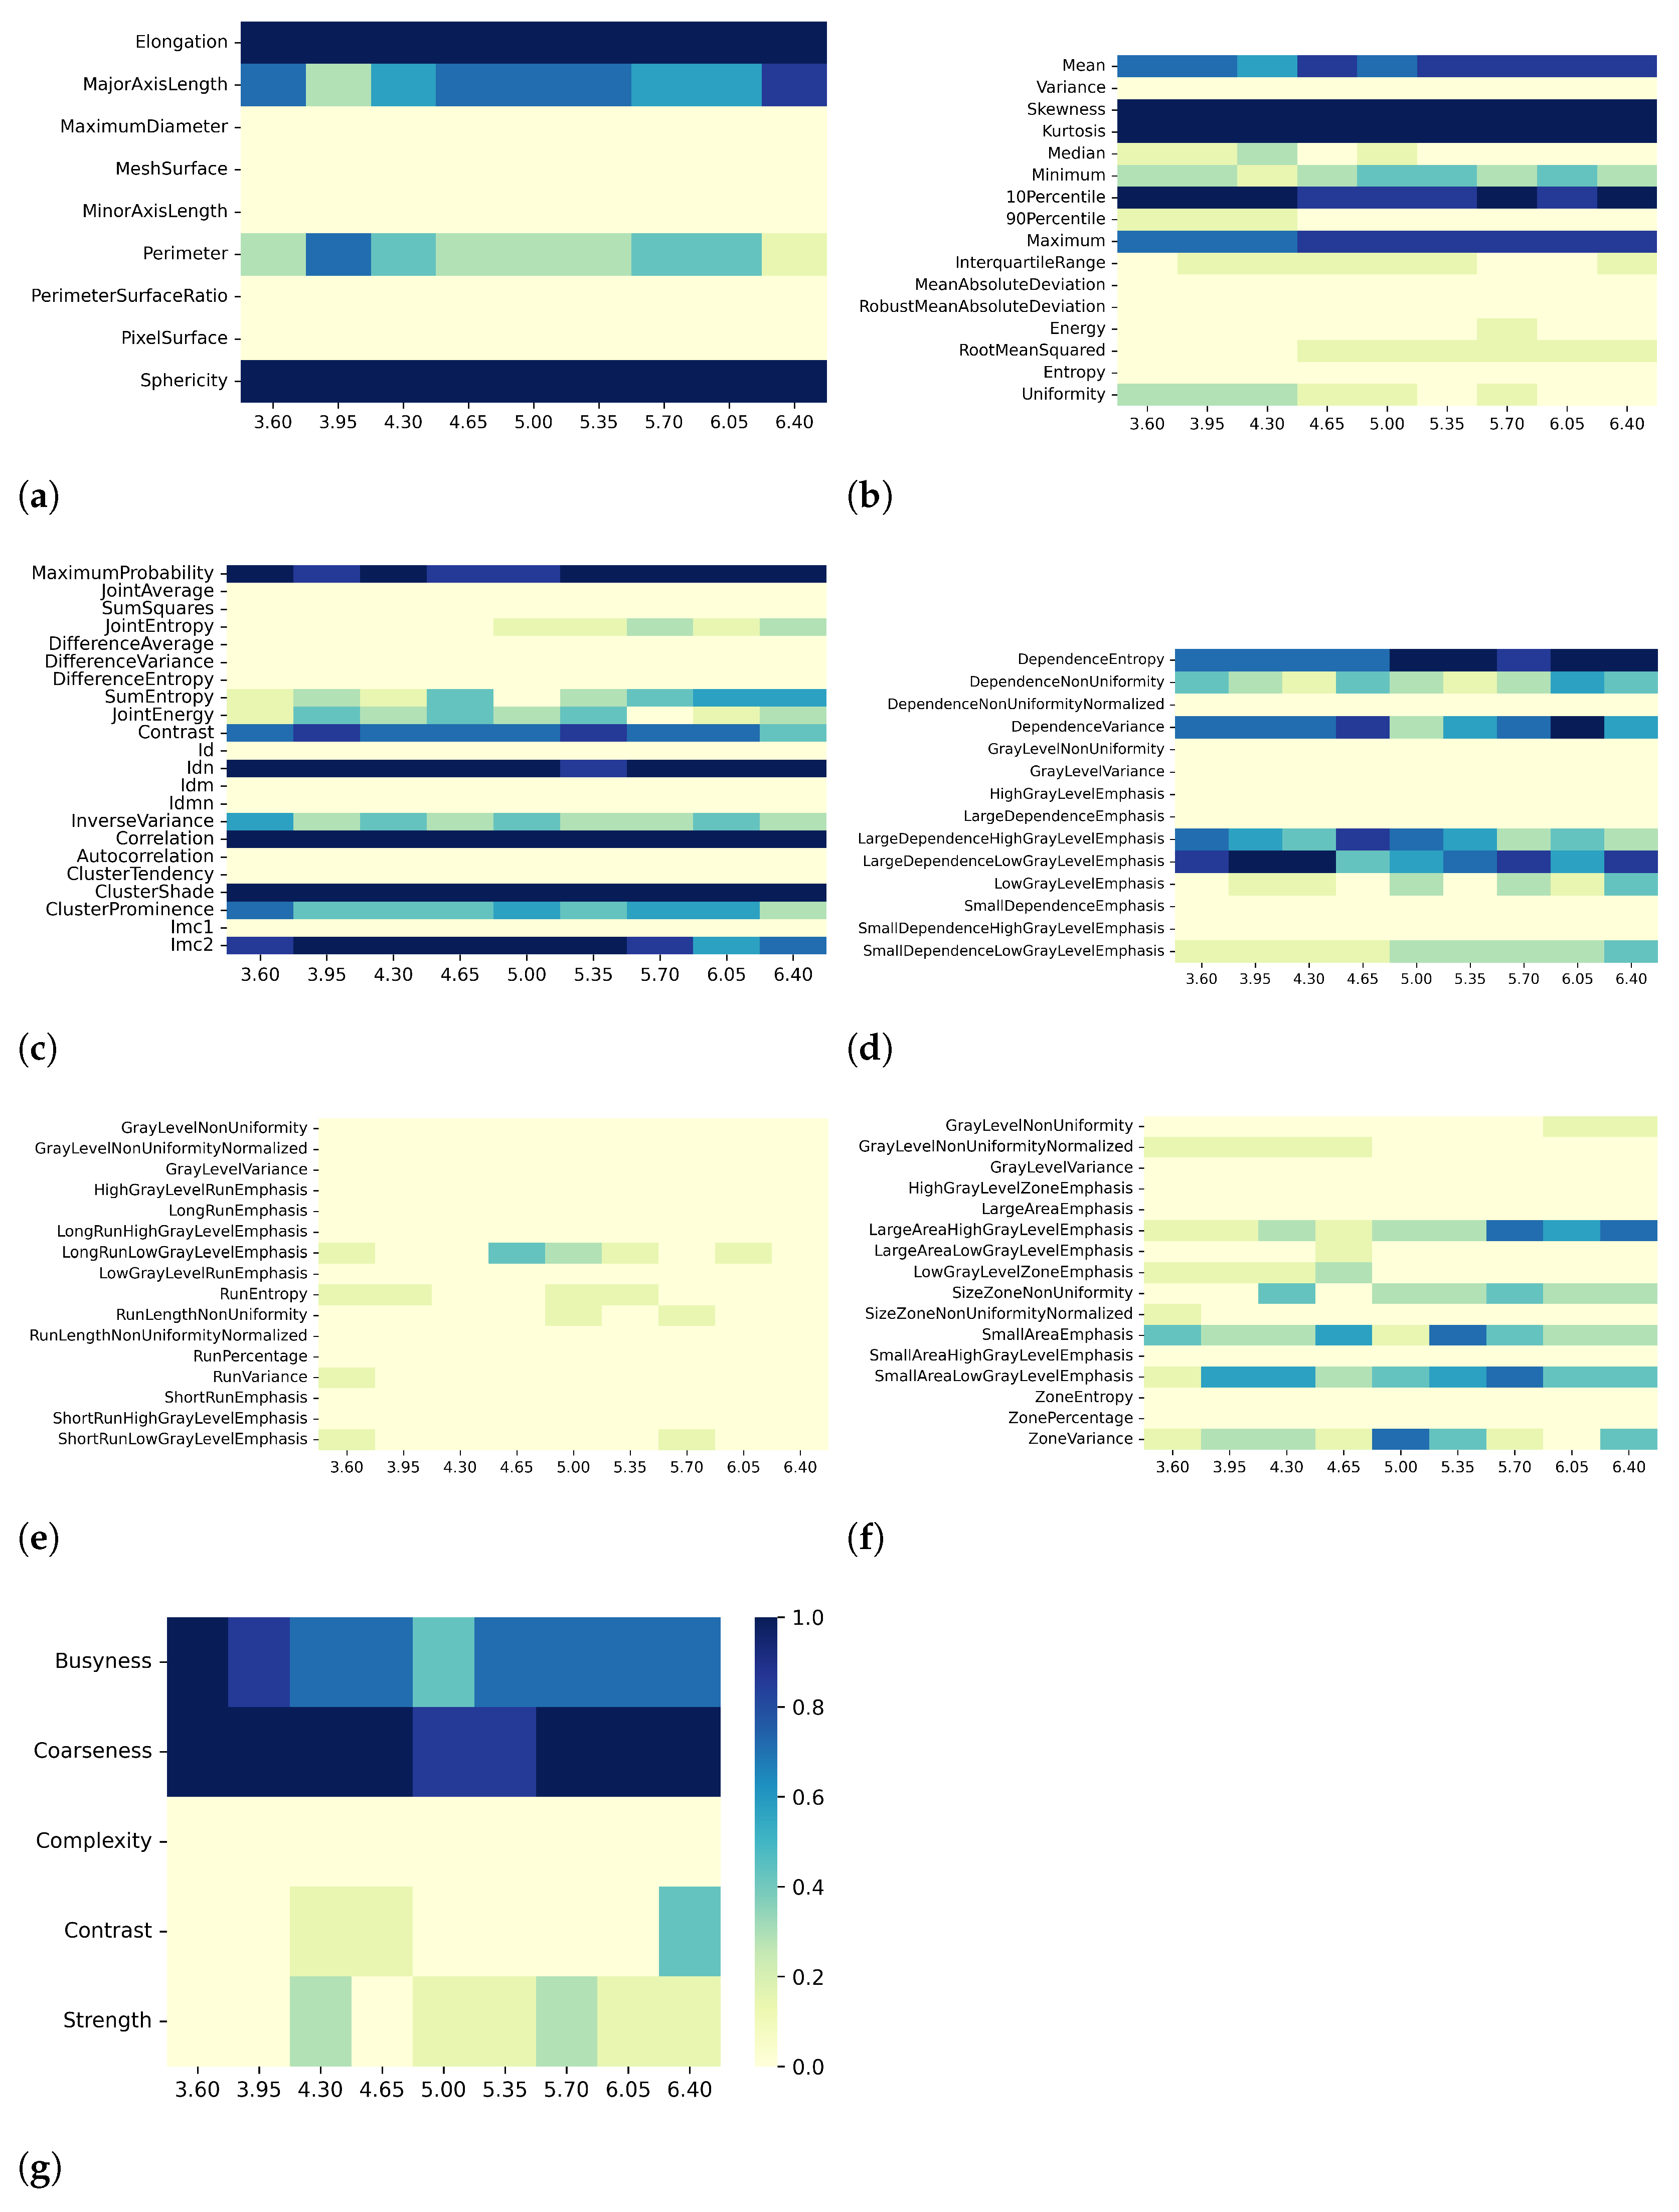
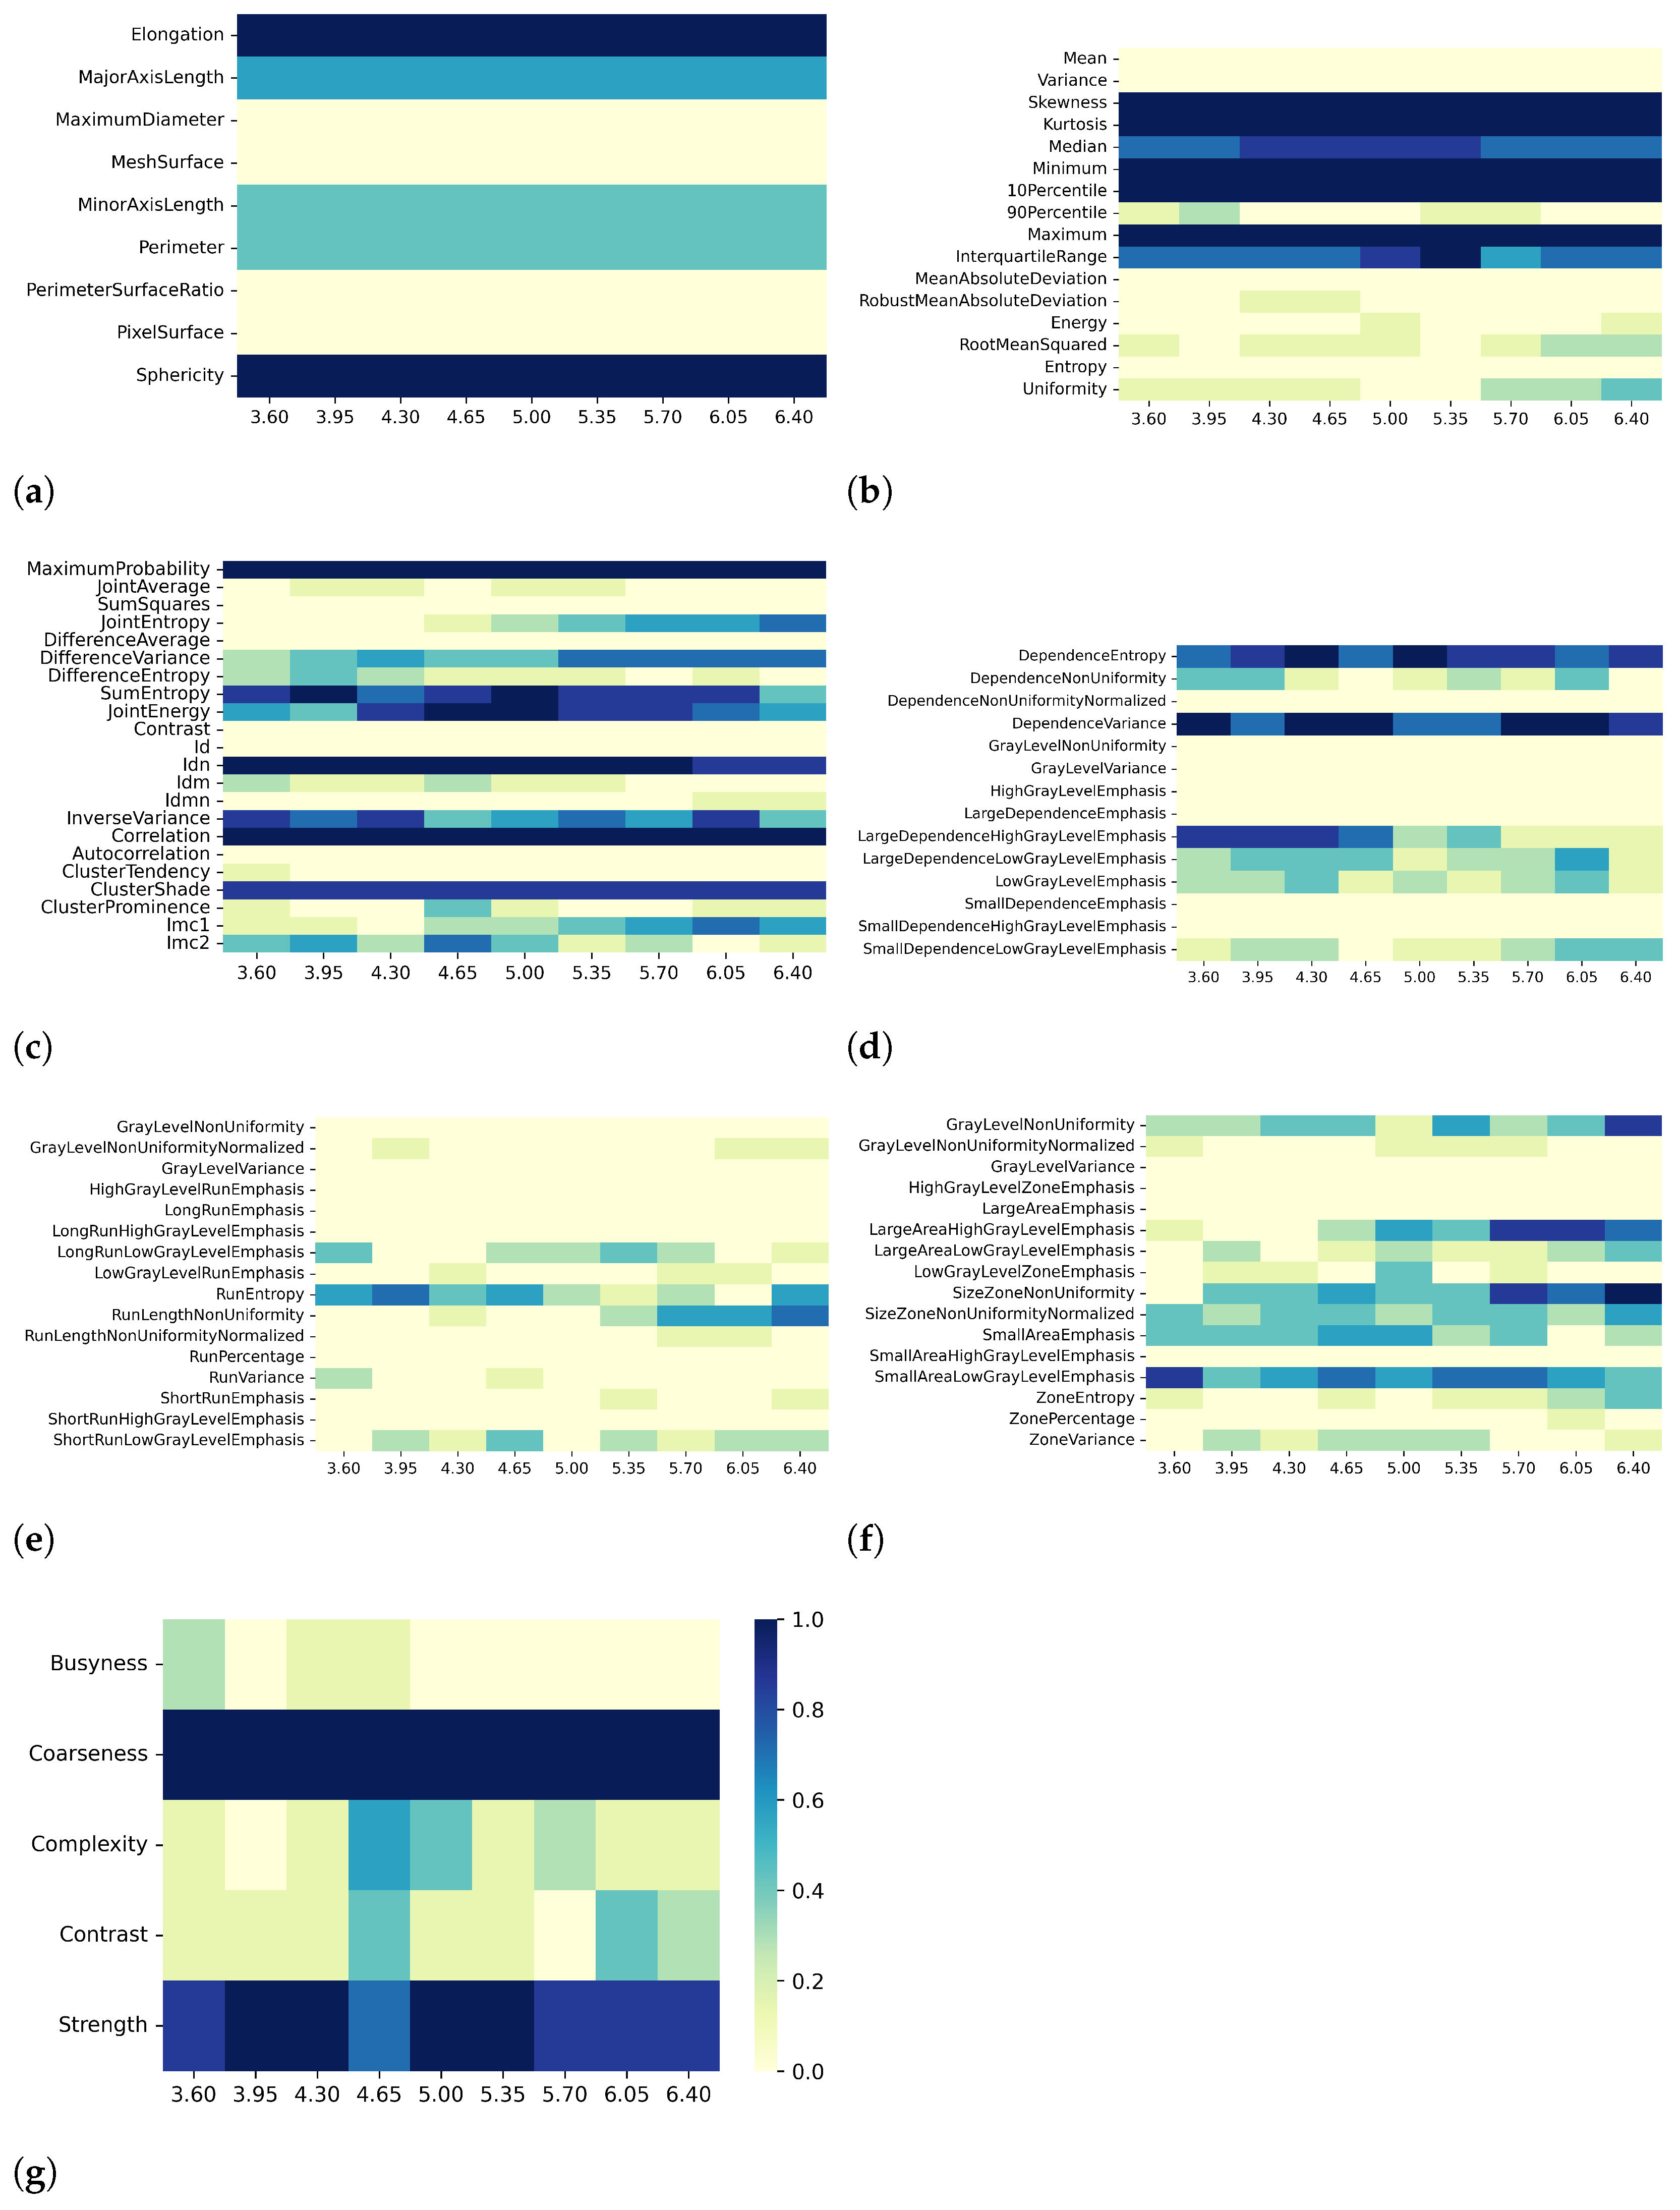
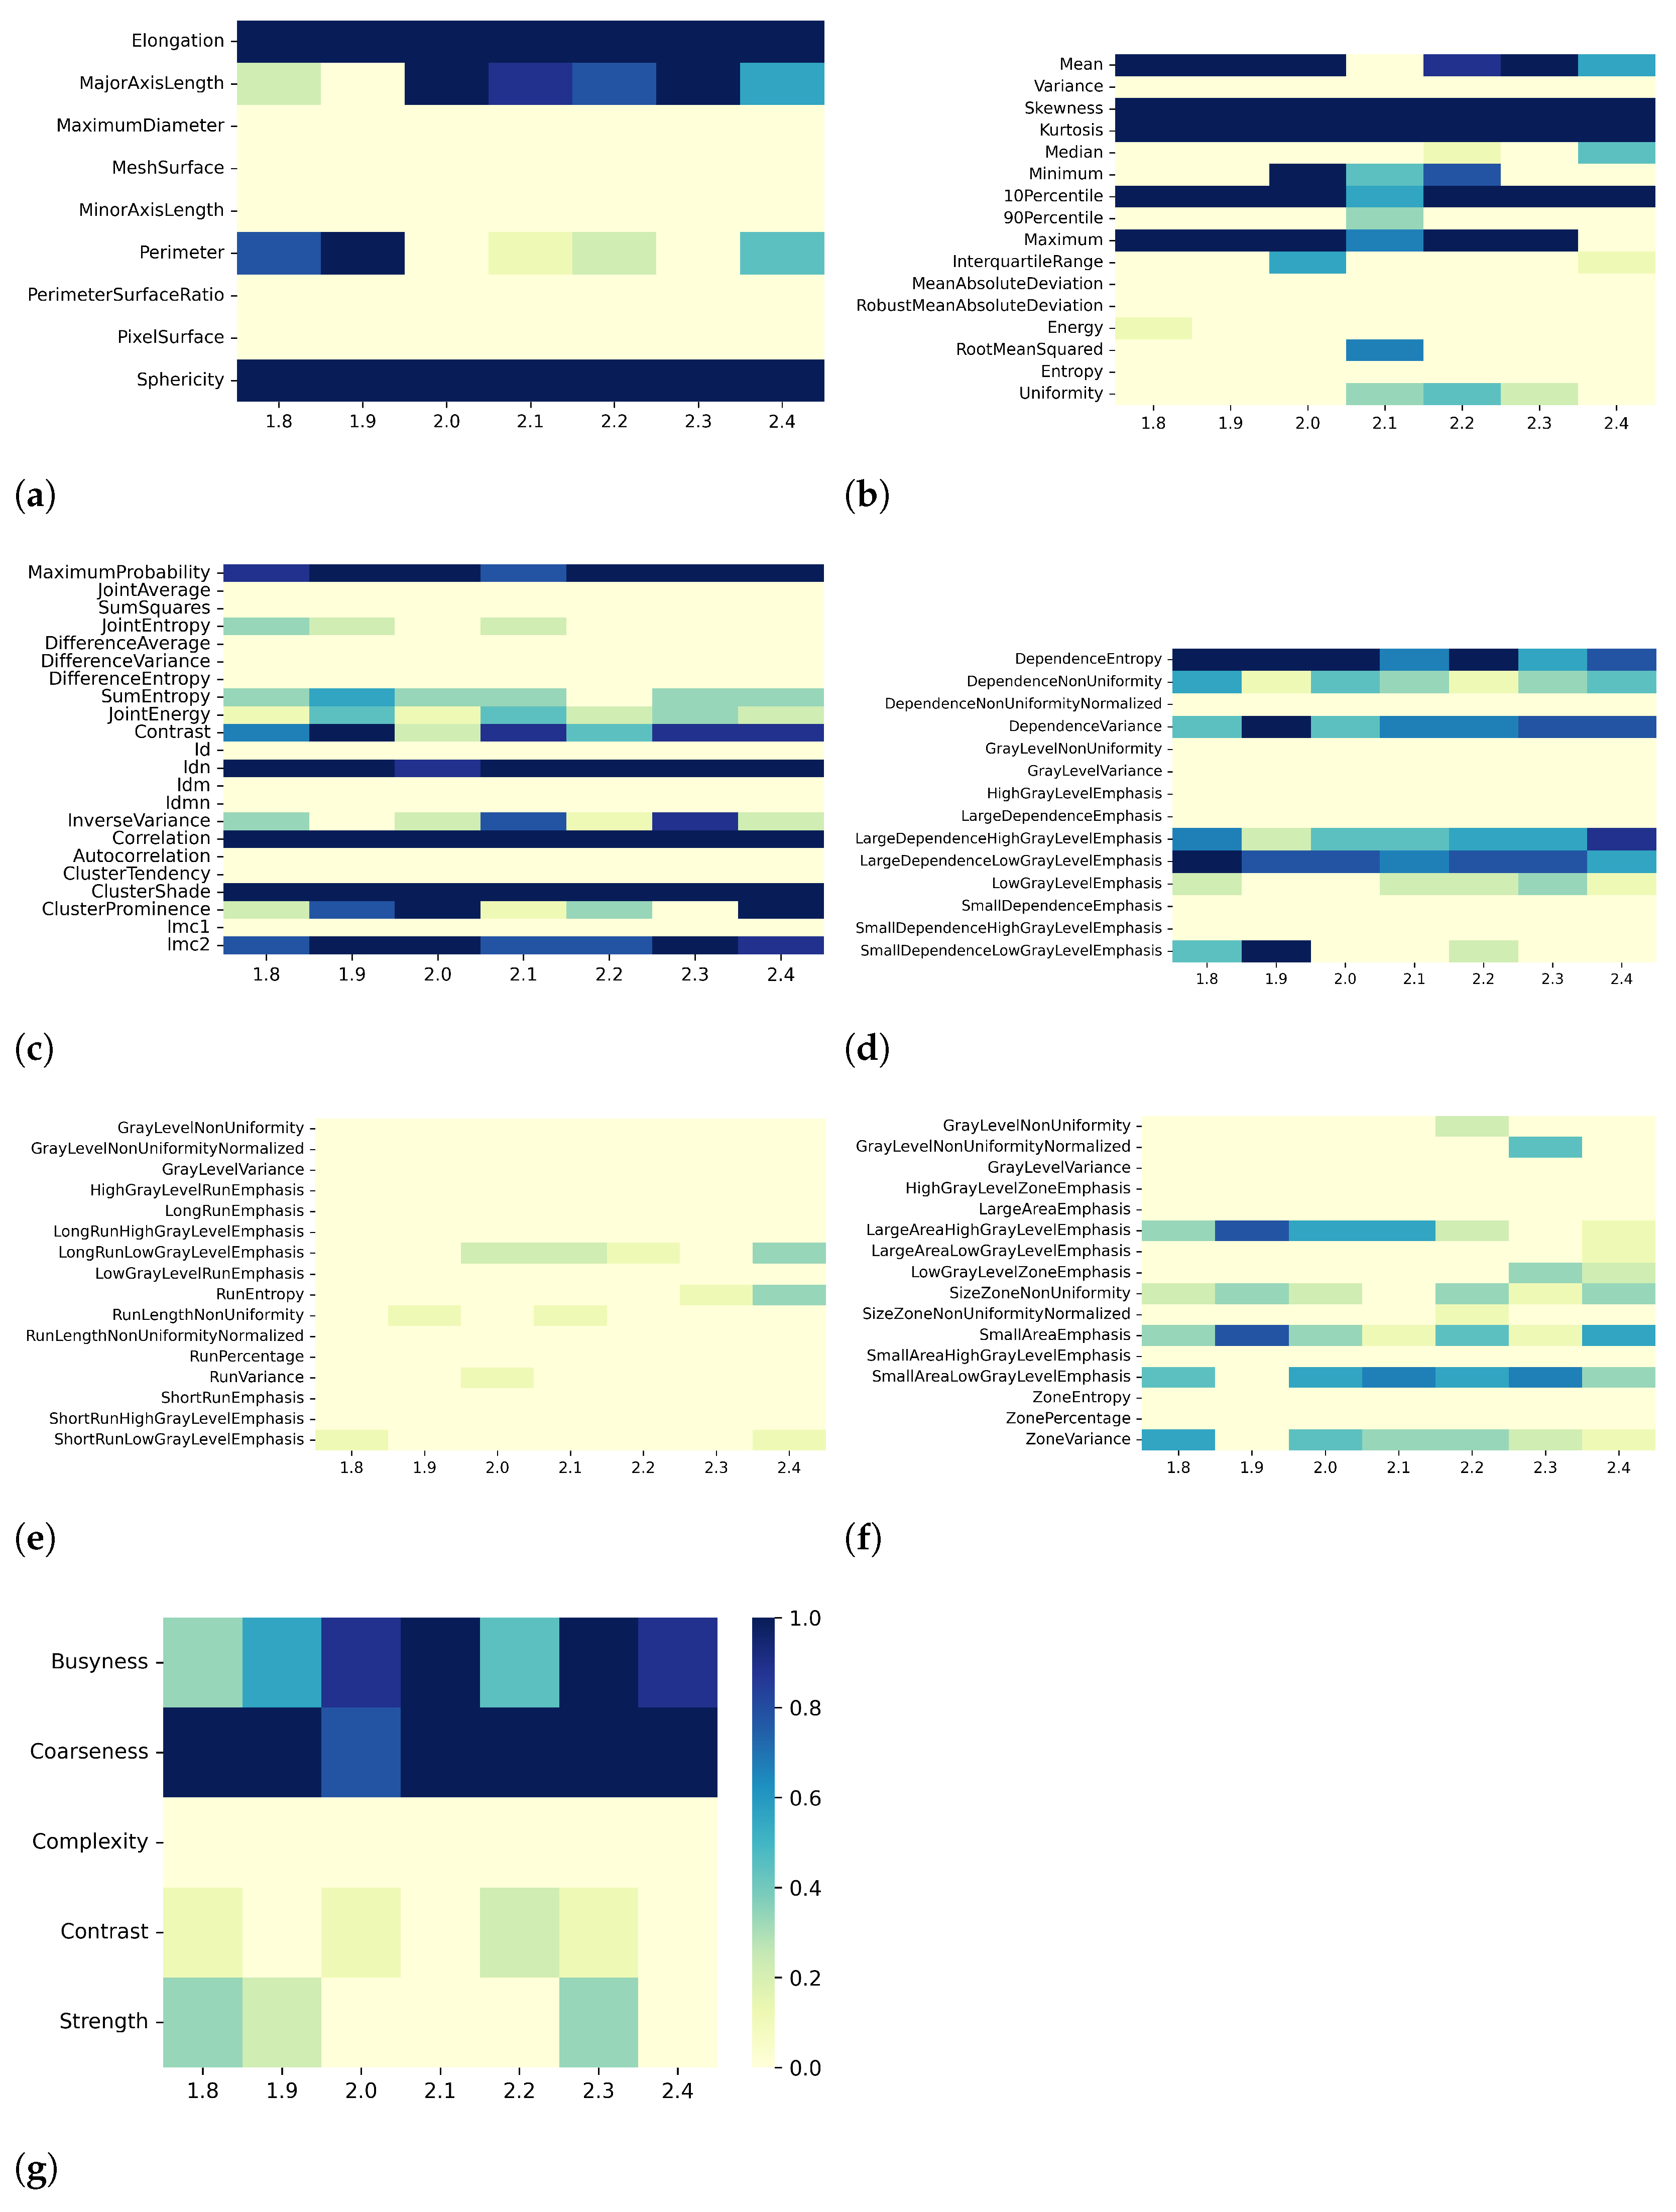
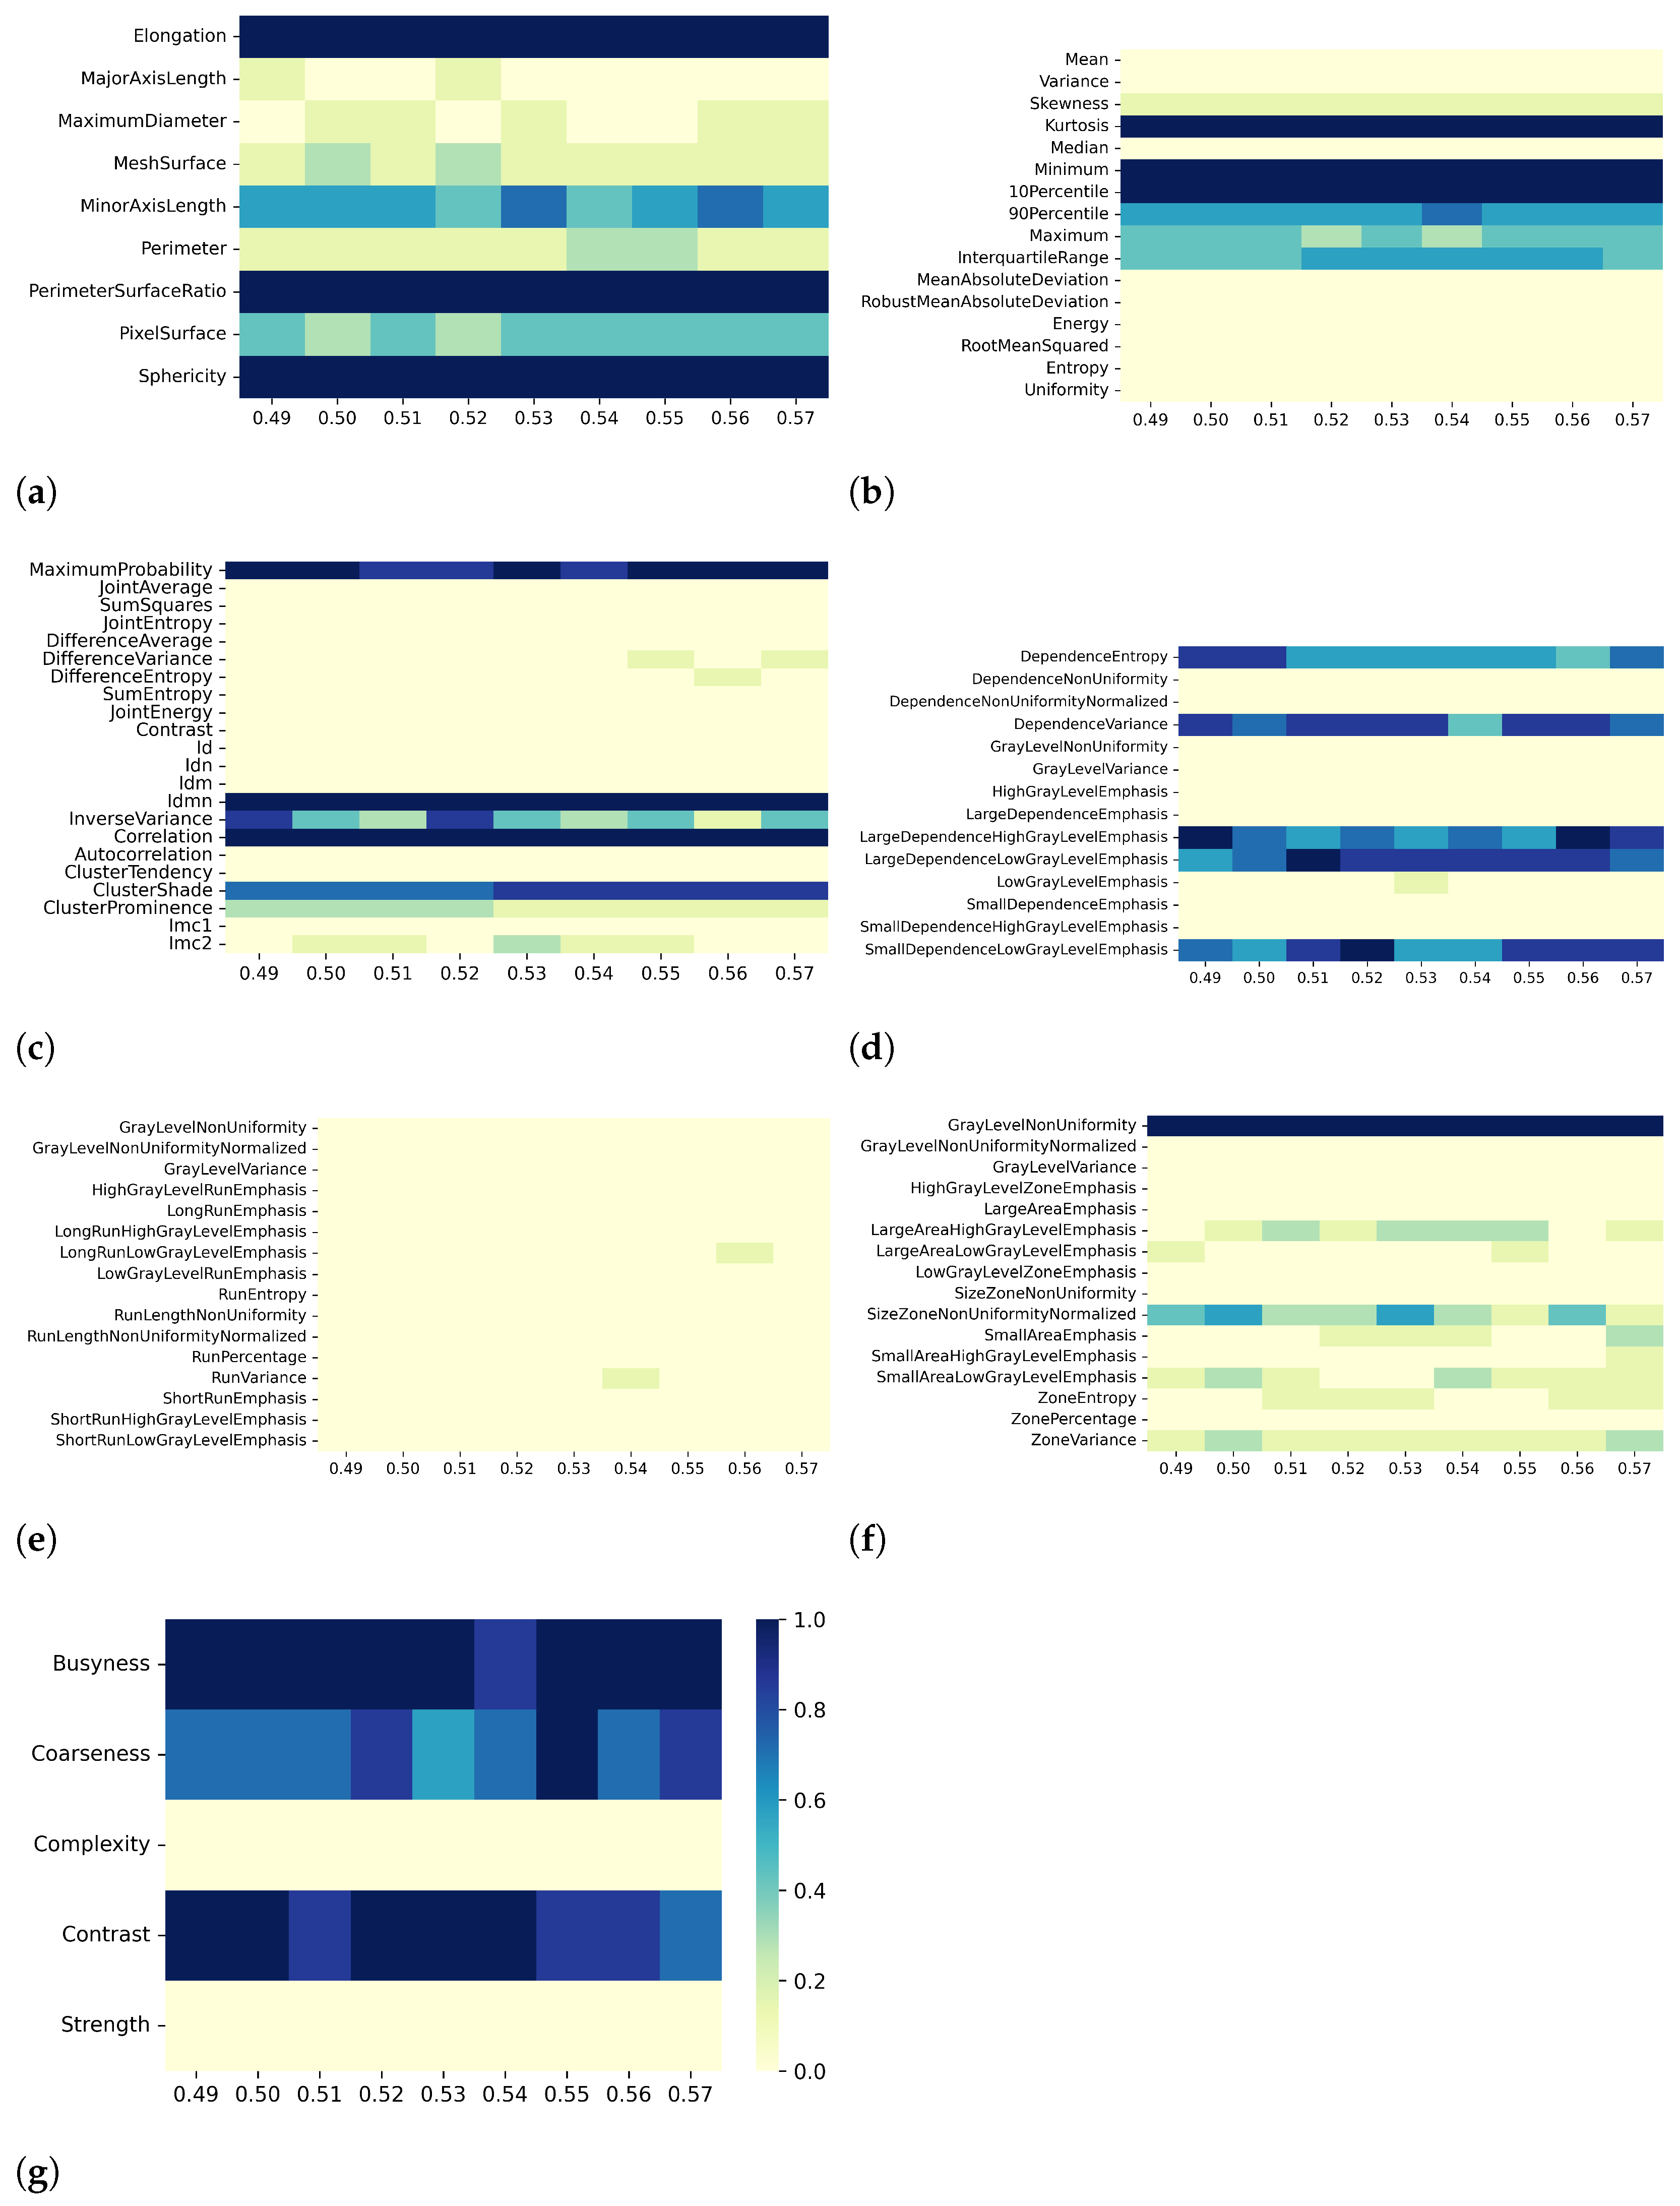
- —for each discretization bin width, the effect of using different resampling voxel sizes;
- Effect B
- —for each resampling voxel size, the effect of using different discretization bin widths;
- Effect C
- —at fixed resampling voxel size and discretization bin width, the effect of using different filters.
3. Results
3.1. T1 Mapping
3.2. T2 Mapping
4. Discussion
5. Conclusions
Supplementary Materials
Author Contributions
Funding
Institutional Review Board Statement
Informed Consent Statement
Data Availability Statement
Conflicts of Interest
References
- Gillies, R.J.; Kinahan, P.E.; Hricak, H. Radiomics: Images are more than pictures, they are data. Radiology 2016, 278, 563. [Google Scholar] [CrossRef] [PubMed]
- Park, J.E.; Kim, H.S. Radiomics as a quantitative imaging biomarker: Practical considerations and the current standpoint in neuro-oncologic studies. Nucl. Med. Mol. Imaging 2018, 52, 99–108. [Google Scholar] [CrossRef] [PubMed]
- Zimek, A.; Schubert, E.; Kriegel, H.P. A survey on unsupervised outlier detection in high-dimensional numerical data. Stat. Anal. Data Min. 2012, 5, 363–387. [Google Scholar] [CrossRef]
- Thorburn, W.M. Occam’s razor. Mind 1915, 24, 287–288. [Google Scholar] [CrossRef]
- Altman, N.; Krzywinski, M. The curse(s) of dimensionality. Nat. Methods 2018, 15, 399–400. [Google Scholar] [CrossRef]
- Papanikolaou, N.; Matos, C.; Koh, D.M. How to develop a meaningful radiomic signature for clinical use in oncologic patients. Cancer Imaging 2020, 20, 1–10. [Google Scholar] [CrossRef]
- Mayerhoefer, M.E.; Materka, A.; Langs, G.; Häggström, I.; Szczypiński, P.; Gibbs, P.; Cook, G. Introduction to radiomics. J. Nucl. Med. 2020, 61, 488–495. [Google Scholar] [CrossRef]
- Van Dijk, L.V.; Brouwer, C.L.; Van Der Schaaf, A.; Burgerhof, J.G.; Beukinga, R.J.; Langendijk, J.A.; Sijtsema, N.M.; Steenbakkers, R.J. CT image biomarkers to improve patient-specific prediction of radiation-induced xerostomia and sticky saliva. Radiother. Oncol. 2017, 122, 185–191. [Google Scholar] [CrossRef]
- Zhai, T.T.; Langendijk, J.A.; van Dijk, L.V.; Halmos, G.B.; Witjes, M.J.; Oosting, S.F.; Noordzij, W.; Sijtsema, N.M.; Steenbakkers, R.J. The prognostic value of CT-based image-biomarkers for head and neck cancer patients treated with definitive (chemo-) radiation. Oral Oncol. 2019, 95, 178–186. [Google Scholar] [CrossRef]
- Lian, C.; Ruan, S.; Denœux, T.; Jardin, F.; Vera, P. Selecting radiomic features from FDG-PET images for cancer treatment outcome prediction. Med. Image Anal. 2016, 32, 257–268. [Google Scholar] [CrossRef]
- Guo, X.F.; Yang, W.Q.; Yang, Q.; Yuan, Z.L.; Liu, Y.L.; Niu, X.H.; Xu, H.B. Feasibility of MRI Radiomics for Predicting KRAS Mutation in Rectal Cancer. Curr. Med. Sci. 2020, 40, 1156–1160. [Google Scholar] [CrossRef]
- Amini, M.; Nazari, M.; Shiri, I.; Hajianfar, G.; Deevband, M.R.; Abdollahi, H.; Arabi, H.; Rahmim, A.; Zaidi, H. Multi-level multi-modality (PET and CT) fusion radiomics: Prognostic modeling for non-small cell lung carcinoma. Phys. Med. Biol. 2021, 66, 205017. [Google Scholar] [CrossRef]
- Pszczolkowski, S.; Manzano-Patrón, J.P.; Law, Z.K.; Krishnan, K.; Ali, A.; Bath, P.M.; Sprigg, N.; Dineen, R.A. Quantitative CT radiomics-based models for prediction of haematoma expansion and poor functional outcome in primary intracerebral haemorrhage. Eur. Radiol. 2021, 31, 7945–7959. [Google Scholar] [CrossRef]
- Chen, C.; Qin, Y.; Cheng, J.; Gao, F.; Zhou, X. Texture Analysis of Fat-Suppressed T2-Weighted Magnetic Resonance Imaging and Use of Machine Learning to Discriminate Nasal and Paranasal Sinus Small Round Malignant Cell Tumors. Front. Oncol. 2021, 11, 701289. [Google Scholar] [CrossRef]
- Wan, Q.; Zhou, J.; Xia, X.; Hu, J.; Wang, P.; Peng, Y.; Zhang, T.; Sun, J.; Song, Y.; Yang, G.; et al. Diagnostic performance of 2D and 3D T2WI-based radiomics features with machine learning algorithms to distinguish solid solitary pulmonary lesion. Front. Oncol. 2021, 11, 683587. [Google Scholar] [CrossRef]
- Nagawa, K.; Suzuki, M.; Yamamoto, Y.; Inoue, K.; Kozawa, E.; Mimura, T.; Nakamura, K.; Nagata, M.; Niitsu, M. Texture analysis of muscle MRI: Machine learning-based classifications in idiopathic inflammatory myopathies. Sci. Rep. 2021, 11, 9821. [Google Scholar] [CrossRef]
- Liu, Q.; Huang, Y.; Chen, H.; Liu, Y.; Liang, R.; Zeng, Q. Computed Tomography–Based Radiomic Features for Diagnosis of Indeterminate Small Pulmonary Nodules. J. Comput. Assist. Tomogr. 2020, 44, 90–94. [Google Scholar] [CrossRef]
- Pfaehler, E.; Beukinga, R.J.; de Jong, J.R.; Slart, R.H.; Slump, C.H.; Dierckx, R.A.; Boellaard, R. Repeatability of 18F-FDG PET radiomic features: A phantom study to explore sensitivity to image reconstruction settings, noise, and delineation method. Med. Phys. 2019, 46, 665–678. [Google Scholar] [CrossRef]
- Schenone, D.; Dominietto, A.; Campi, C.; Frassoni, F.; Cea, M.; Aquino, S.; Angelucci, E.; Rossi, F.; Torri, L.; Bignotti, B.; et al. Radiomics and Artificial Intelligence for Outcome Prediction in Multiple Myeloma Patients Undergoing Autologous Transplantation: A Feasibility Study with CT Data. Diagnostics 2021, 11, 1759. [Google Scholar] [CrossRef]
- Li, S.; Wang, K.; Hou, Z.; Yang, J.; Ren, W.; Gao, S.; Meng, F.; Wu, P.; Liu, B.; Liu, J.; et al. Use of radiomics combined with machine learning method in the recurrence patterns after intensity-modulated radiotherapy for nasopharyngeal carcinoma: A preliminary study. Front. Oncol. 2018, 8, 648. [Google Scholar] [CrossRef]
- Pérez-Morales, J.; Tunali, I.; Stringfield, O.; Eschrich, S.A.; Balagurunathan, Y.; Gillies, R.J.; Schabath, M.B. Peritumoral and intratumoral radiomic features predict survival outcomes among patients diagnosed in lung cancer screening. Sci. Rep. 2020, 10, 10528. [Google Scholar] [CrossRef] [PubMed]
- Baessler, B.; Nestler, T.; Pinto dos Santos, D.; Paffenholz, P.; Zeuch, V.; Pfister, D.; Maintz, D.; Heidenreich, A. Radiomics allows for detection of benign and malignant histopathology in patients with metastatic testicular germ cell tumors prior to post-chemotherapy retroperitoneal lymph node dissection. Eur. Radiol. 2020, 30, 2334–2345. [Google Scholar] [CrossRef] [PubMed]
- Chen, C.; Qin, Y.; Chen, H.; Cheng, J.; He, B.; Wan, Y.; Zhu, D.; Gao, F.; Zhou, X. Machine learning to differentiate small round cell malignant tumors and non-small round cell malignant tumors of the nasal and paranasal sinuses using apparent diffusion coefficient values. Eur. Radiol. 2022, 32, 3819–3829. [Google Scholar] [CrossRef]
- Zhou, H.; Xu, R.; Mei, H.; Zhang, L.; Yu, Q.; Liu, R.; Fan, B. Application of Enhanced T1WI of MRI Radiomics in Glioma Grading. Int. J. Clin. Pract. 2022, 2022, 3252574. [Google Scholar] [CrossRef] [PubMed]
- Vamvakas, A.; Tsivaka, D.; Logothetis, A.; Vassiou, K.; Tsougos, I. Breast Cancer Classification on Multiparametric MRI–Increased Performance of Boosting Ensemble Methods. Technol. Cancer Res. Treat. 2022, 21, 15330338221087828. [Google Scholar] [CrossRef]
- Laukamp, K.R.; Shakirin, G.; Baeßler, B.; Thiele, F.; Zopfs, D.; Hokamp, N.G.; Timmer, M.; Kabbasch, C.; Perkuhn, M.; Borggrefe, J. Accuracy of radiomics-based feature analysis on multiparametric magnetic resonance images for noninvasive meningioma grading. World Neurosurg. 2019, 132, e366–e390. [Google Scholar] [CrossRef]
- Kimura, K.; Yoshida, S.; Tsuchiya, J.; Yamada, I.; Tanaka, H.; Yokoyama, M.; Matsuoka, Y.; Yoshimura, R.; Tateishi, U.; Fujii, Y. Usefulness of texture features of apparent diffusion coefficient maps in predicting chemoradiotherapy response in muscle-invasive bladder cancer. Eur. Radiol. 2022, 32, 671–679. [Google Scholar] [CrossRef]
- Hu, B.; Xu, K.; Zhang, Z.; Chai, R.; Li, S.; Zhang, L. A radiomic nomogram based on an apparent diffusion coefficient map for differential diagnosis of suspicious breast findings. Chin. J. Cancer Res. 2018, 30, 432. [Google Scholar] [CrossRef]
- Castaldo, R.; Garbino, N.; Cavaliere, C.; Incoronato, M.; Basso, L.; Cuocolo, R.; Pace, L.; Salvatore, M.; Franzese, M.; Nicolai, E. A Complex Radiomic Signature in Luminal Breast Cancer from a Weighted Statistical Framework: A Pilot Study. Diagnostics 2022, 12, 499. [Google Scholar] [CrossRef]
- Tharmaseelan, H.; Hertel, A.; Tollens, F.; Rink, J.; Woźnicki, P.; Haselmann, V.; Ayx, I.; Nörenberg, D.; Schoenberg, S.O.; Froelich, M.F. Identification of CT Imaging Phenotypes of Colorectal Liver Metastases from Radiomics Signatures—Towards Assessment of Interlesional Tumor Heterogeneity. Cancers 2022, 14, 1646. [Google Scholar] [CrossRef]
- Zhang, Y.; Yu, S.; Zhang, L.; Kang, L. Radiomics based on CECT in differentiating kimura disease from lymph node metastases in head and neck: A non-invasive and reliable method. Front. Oncol. 2020, 10, 1121. [Google Scholar] [CrossRef]
- Shao, Y.; Chen, Z.; Ming, S.; Ye, Q.; Shu, Z.; Gong, C.; Pang, P.; Gong, X. Predicts development of normal appearing white matter on conventional MR FLAIR images with Radiomics in the aging brain: A longitudinal clinical study. Front. Aging Neurosci. 2018, 10, 393. [Google Scholar] [CrossRef]
- Zwanenburg, A.; Vallières, M.; Abdalah, M.A.; Aerts, H.J.; Andrearczyk, V.; Apte, A.; Ashrafinia, S.; Bakas, S.; Beukinga, R.J.; Boellaard, R.; et al. The image biomarker standardization initiative: Standardized quantitative radiomics for high-throughput image-based phenotyping. Radiology 2020, 295, 328. [Google Scholar] [CrossRef]
- Depeursinge, A.; Andrearczyk, V.; Whybra, P.; van Griethuysen, J.; Müller, H.; Schaer, R.; Vallières, M.; Zwanenburg, A. Standardised convolutional filtering for radiomics. arXiv 2020, arXiv:2006.05470. [Google Scholar]
- Zwanenburg, A. Radiomics in nuclear medicine: Robustness, reproducibility, standardization, and how to avoid data analysis traps and replication crisis. Eur. J. Nucl. Med. Mol. Imaging 2019, 46, 2638–2655. [Google Scholar] [CrossRef]
- Jang, J.; Ngo, L.H.; Mancio, J.; Kucukseymen, S.; Rodriguez, J.; Pierce, P.; Goddu, B.; Nezafat, R. Reproducibility of segmentation-based myocardial radiomic features with cardiac MRI. Radiol. Cardiothorac. Imaging 2020, 2, e190216. [Google Scholar] [CrossRef]
- Marfisi, D.; Tessa, C.; Marzi, C.; Del Meglio, J.; Linsalata, S.; Borgheresi, R.; Lilli, A.; Lazzarini, R.; Salvatori, L.; Vignali, C.; et al. Image resampling and discretization effect on the estimate of myocardial radiomic features from T1 and T2 mapping in hypertrophic cardiomyopathy. Sci. Rep. 2022, 12, 10186. [Google Scholar] [CrossRef]
- Jang, J.; El-Rewaidy, H.; Ngo, L.H.; Mancio, J.; Csecs, I.; Rodriguez, J.; Pierce, P.; Goddu, B.; Neisius, U.; Manning, W.; et al. Sensitivity of myocardial radiomic features to imaging parameters in cardiac MR imaging. J. Magn. Reson. Imaging 2021, 54, 787–794. [Google Scholar] [CrossRef]
- Alis, D.; Yergin, M.; Asmakutlu, O.; Topel, C.; Karaarslan, E. The influence of cardiac motion on radiomics features: Radiomics features of non-enhanced CMR cine images greatly vary through the cardiac cycle. Eur. Radiol. 2021, 31, 2706–2715. [Google Scholar] [CrossRef]
- Linsalata, S.; Borgheresi, R.; Marfisi, D.; Barca, P.; Sainato, A.; Paiar, F.; Neri, E.; Traino, A.C.; Giannelli, M. Radiomics of Patients with Locally Advanced Rectal Cancer: Effect of Preprocessing on Features Estimation from Computed Tomography Imaging. Biomed Res. Int. 2022, 2022, 2003286. [Google Scholar] [CrossRef]
- Traverso, A.; Kazmierski, M.; Welch, M.L.; Weiss, J.; Fiset, S.; Foltz, W.D.; Gladwish, A.; Dekker, A.; Jaffray, D.; Wee, L.; et al. Sensitivity of radiomic features to inter-observer variability and image pre-processing in Apparent Diffusion Coefficient (ADC) maps of cervix cancer patients. Radiother. Oncol. 2020, 143, 88–94. [Google Scholar] [CrossRef]
- Elliott, P.M.; Anastasakis, A.; Borger, M.A.; Borggrefe, M.; Cecchi, F.; Charron, P.; Hagege, A.A.; Lafont, A.; Limongelli, G.; Mahrholdt, H.; et al. 2014 ESC Guidelines on diagnosis and management of hypertrophic cardiomyopathy. Kardiol. Pol. 2014, 72, 1054–1126. [Google Scholar] [CrossRef] [PubMed]
- Baxi, A.J.; Restrepo, C.S.; Vargas, D.; Marmol-Velez, A.; Ocazionez, D.; Murillo, H. Hypertrophic cardiomyopathy from A to Z: Genetics, pathophysiology, imaging, and management. Radiographics 2016, 36, 335–354. [Google Scholar] [CrossRef] [PubMed]
- Baggiano, A.; Del Torto, A.; Guglielmo, M.; Muscogiuri, G.; Fusini, L.; Babbaro, M.; Collevecchio, A.; Mollace, R.; Scafuri, S.; Mushtaq, S.; et al. Role of CMR mapping techniques in cardiac hypertrophic phenotype. Diagnostics 2020, 10, 770. [Google Scholar] [CrossRef] [PubMed]
- Amano, Y.; Yanagisawa, F.; Tachi, M.; Hashimoto, H.; Imai, S.; Kumita, S. Myocardial T2 mapping in patients with hypertrophic cardiomyopathy. J. Comput. Assist. Tomogr. 2017, 41, 344–348. [Google Scholar] [CrossRef]
- Amano, Y.; Yanagisawa, F.; Omori, Y.; Suzuki, Y.; Ando, C.; Yamamoto, H.; Matsumoto, N. Detection of myocardial tissue alterations in hypertrophic cardiomyopathy using texture analysis of T2-weighted short inversion time inversion recovery magnetic resonance imaging. J. Comput. Assist. Tomogr. 2020, 44, 341–345. [Google Scholar] [CrossRef]
- Neisius, U.; El-Rewaidy, H.; Nakamori, S.; Rodriguez, J.; Manning, W.J.; Nezafat, R. Radiomic analysis of myocardial native T1 imaging discriminates between hypertensive heart disease and hypertrophic cardiomyopathy. JACC Cardiovasc. Imaging 2019, 12, 1946–1954. [Google Scholar] [CrossRef]
- Wang, J.; Yang, F.; Liu, W.; Sun, J.; Han, Y.; Li, D.; Gkoutos, G.V.; Zhu, Y.; Chen, Y. Radiomic Analysis of Native T1 Mapping Images Discriminates Between MYH7 and MYBPC3-Related Hypertrophic Cardiomyopathy. J. Magn. Reson. Imaging 2020, 52, 1714–1721. [Google Scholar] [CrossRef]
- Shi, R.Y.; Wu, R.; An, D.A.; Chen, B.H.; Wu, C.W.; Du, L.; Jiang, M.; Xu, J.R.; Wu, L.M. Texture analysis applied in T1 maps and extracellular volume obtained using cardiac MRI in the diagnosis of hypertrophic cardiomyopathy and hypertensive heart disease compared with normal controls. Clin. Radiol. 2021, 76, 236.e9–236.e19. [Google Scholar] [CrossRef]
- Messroghli, D.R.; Plein, S.; Higgins, D.M.; Walters, K.; Jones, T.R.; Ridgway, J.P.; Sivananthan, M.U. Human myocardium: Single-breath-hold MR T1 mapping with high spatial resolution—Reproducibility study. Radiology 2006, 238, 1004–1012. [Google Scholar] [CrossRef]
- Giri, S.; Chung, Y.C.; Merchant, A.; Mihai, G.; Rajagopalan, S.; Raman, S.V.; Simonetti, O.P. T2 quantification for improved detection of myocardial edema. J. Cardiovasc. Magn. Reson. 2009, 11, 1–13. [Google Scholar] [CrossRef]
- Fedorov, A.; Beichel, R.; Kalpathy-Cramer, J.; Finet, J.; Fillion-Robin, J.C.; Pujol, S.; Bauer, C.; Jennings, D.; Fennessy, F.; Sonka, M.; et al. 3D Slicer as an image computing platform for the Quantitative Imaging Network. Magn. Reson. Imaging 2012, 30, 1323–1341. [Google Scholar] [CrossRef]
- Kikinis, R.; Pieper, S.D.; Vosburgh, K.G. 3D Slicer: A platform for subject-specific image analysis, visualization, and clinical support. In Intraoperative Imaging and iMage-Guided Therapy; Springer Science & Business Media: Berlin/Heidelberg, Germany, 2014; pp. 277–289. [Google Scholar]
- Shafiq-ul Hassan, M.; Zhang, G.G.; Latifi, K.; Ullah, G.; Hunt, D.C.; Balagurunathan, Y.; Abdalah, M.A.; Schabath, M.B.; Goldgof, D.G.; Mackin, D.; et al. Intrinsic dependencies of CT radiomic features on voxel size and number of gray levels. Med. Phys. 2017, 44, 1050–1062. [Google Scholar] [CrossRef]
- Shafiq-ul Hassan, M.; Latifi, K.; Zhang, G.; Ullah, G.; Gillies, R.; Moros, E. Voxel size and gray level normalization of CT radiomic features in lung cancer. Sci. Rep. 2018, 8, 10545. [Google Scholar] [CrossRef]
- Brynolfsson, P.; Nilsson, D.; Torheim, T.; Asklund, T.; Karlsson, C.T.; Trygg, J.; Nyholm, T.; Garpebring, A. Haralick texture features from apparent diffusion coefficient (ADC) MRI images depend on imaging and pre-processing parameters. Sci. Rep. 2017, 7, 1–11. [Google Scholar] [CrossRef]
- Leijenaar, R.T.; Nalbantov, G.; Carvalho, S.; Van Elmpt, W.J.; Troost, E.G.; Boellaard, R.; Aerts, H.J.; Gillies, R.J.; Lambin, P. The effect of SUV discretization in quantitative FDG-PET Radiomics: The need for standardized methodology in tumor texture analysis. Sci. Rep. 2015, 5, 1–10. [Google Scholar] [CrossRef]
- Yip, S.S.; Aerts, H.J. Applications and limitations of radiomics. Phys. Med. Biol. 2016, 61, R150. [Google Scholar] [CrossRef]
- Tixier, F.; Le Rest, C.C.; Hatt, M.; Albarghach, N.; Pradier, O.; Metges, J.P.; Corcos, L.; Visvikis, D. Intratumor heterogeneity characterized by textural features on baseline 18F-FDG PET images predicts response to concomitant radiochemotherapy in esophageal cancer. J. Nucl. Med. 2011, 52, 369–378. [Google Scholar] [CrossRef]
- Van Griethuysen, J.J.; Fedorov, A.; Parmar, C.; Hosny, A.; Aucoin, N.; Narayan, V.; Beets-Tan, R.G.; Fillion-Robin, J.C.; Pieper, S.; Aerts, H.J. Computational radiomics system to decode the radiographic phenotype. Cancer Res. 2017, 77, e104–e107. [Google Scholar] [CrossRef]
- Galton, F. Typical Laws of Heredity; William Clowes and Sons: London, UK, 1877. [Google Scholar]
- Spearman, C. The Proof and Measurement of Association between Two Things; Appleton-Century-Crofts: New York, NY, USA, 1961. [Google Scholar]
- Bibault, J.E.; Xing, L.; Giraud, P.; El Ayachy, R.; Giraud, N.; Decazes, P.; Burgun, A. Radiomics: A primer for the radiation oncologist. Cancer/Radiothérapie 2020, 24, 403–410. [Google Scholar] [CrossRef]
- Kuncheva, L.I. A stability index for feature selection. In Proceedings of the Artificial Intelligence and Applications, Innsbruck, Austria, 12–14 February 2007; pp. 421–427. [Google Scholar]
- Nogueira, S.; Brown, G. Measuring the stability of feature selection. In Proceedings of the Joint European Conference on Machine Learning and Knowledge Discovery in Databases, Riva del Garda, Italy, 19–23 September 2016; Springer: Cham, Switzerland, 2016; pp. 442–457. [Google Scholar]
- Nogueira, S.; Sechidis, K.; Brown, G. On the Stability of Feature Selection Algorithms. J. Mach. Learn. Res. 2018, 18, 1–54. [Google Scholar]
- Goh, W.W.B.; Wong, L. Evaluating feature-selection stability in next-generation proteomics. J. Bioinform. Comput. Biol. 2016, 14, 1650029. [Google Scholar] [CrossRef] [PubMed]
- Kalousis, A.; Prados, J.; Hilario, M. Stability of feature selection algorithms. In Proceedings of the Fifth IEEE International Conference on Data Mining (ICDM’05), Houston, TX, USA, 27–30 November 2005; p. 8. [Google Scholar]
- Kalousis, A.; Prados, J.; Hilario, M. Stability of feature selection algorithms: A study on high-dimensional spaces. Knowl. Inf. Syst. 2007, 12, 95–116. [Google Scholar] [CrossRef]
- Khaire, U.M.; Dhanalakshmi, R. Stability of feature selection algorithm: A review. J. King Saud-Univ.-Comput. Inf. Sci. 2019, 34, 1060–1073. [Google Scholar] [CrossRef]
- Mohana Chelvan, P.; Perumal, K. A survey on feature selection stability measures. Int. J. Comput. Inf. Technol. 2016, 5, 98–103. [Google Scholar]
- Neisius, U.; El-Rewaidy, H.; Kucukseymen, S.; Tsao, C.W.; Mancio, J.; Nakamori, S.; Manning, W.J.; Nezafat, R. Texture signatures of native myocardial T1 as novel imaging markers for identification of hypertrophic cardiomyopathy patients without scar. J. Magn. Reson. Imaging 2020, 52, 906–919. [Google Scholar] [CrossRef]
- Amano, Y.; Aita, K.; Yamada, F.; Kitamura, M.; Kumita, S. Distribution and clinical significance of high signal intensity of the myocardium on T2-weighted images in 2 phenotypes of hypertrophic cardiomyopathy. J. Comput. Assist. Tomogr. 2015, 39, 951–955. [Google Scholar] [CrossRef]
- Todiere, G.; Pisciella, L.; Barison, A.; Del Franco, A.; Zachara, E.; Piaggi, P.; Re, F.; Pingitore, A.; Emdin, M.; Lombardi, M.; et al. Abnormal T2-STIR magnetic resonance in hypertrophic cardiomyopathy: A marker of advanced disease and electrical myocardial instability. PLoS ONE 2014, 9, e111366. [Google Scholar] [CrossRef]
- Amano, Y.; Omori, Y.; Ando, C.; Yanagisawa, F.; Suzuki, Y.; Tang, X.; Kobayashi, H.; Takagi, R.; Matsumoto, N. Clinical Importance of Myocardial T2 Mapping and Texture Analysis. Magn. Reson. Med. Sci. 2021, 20, 139. [Google Scholar] [CrossRef]
- Messroghli, D.R.; Moon, J.C.; Ferreira, V.M.; Grosse-Wortmann, L.; He, T.; Kellman, P.; Mascherbauer, J.; Nezafat, R.; Salerno, M.; Schelbert, E.B.; et al. Clinical recommendations for cardiovascular magnetic resonance mapping of T1, T2, T2* and extracellular volume: A consensus statement by the Society for Cardiovascular Magnetic Resonance (SCMR) endorsed by the European Association for Cardiovascular Imaging (EACVI). J. Cardiovasc. Magn. Reson. 2017, 19, 1–24. [Google Scholar]



| Age (years) | 66 (11) | |
| Myocardial thickness (mm) | 19 (3) | |
| LGE | 19/26 | |
| LV | RV | |
| ED volume (mL/m2) | 74 (15) | 61 (13) |
| ES volume (mL/m2) | 23 (14) | 23 (6) |
| Stroke volume (mL/m2) | 51 (13) | 38 (9) |
| Ejection fraction (%) | 70 (15) | 63 (6) |
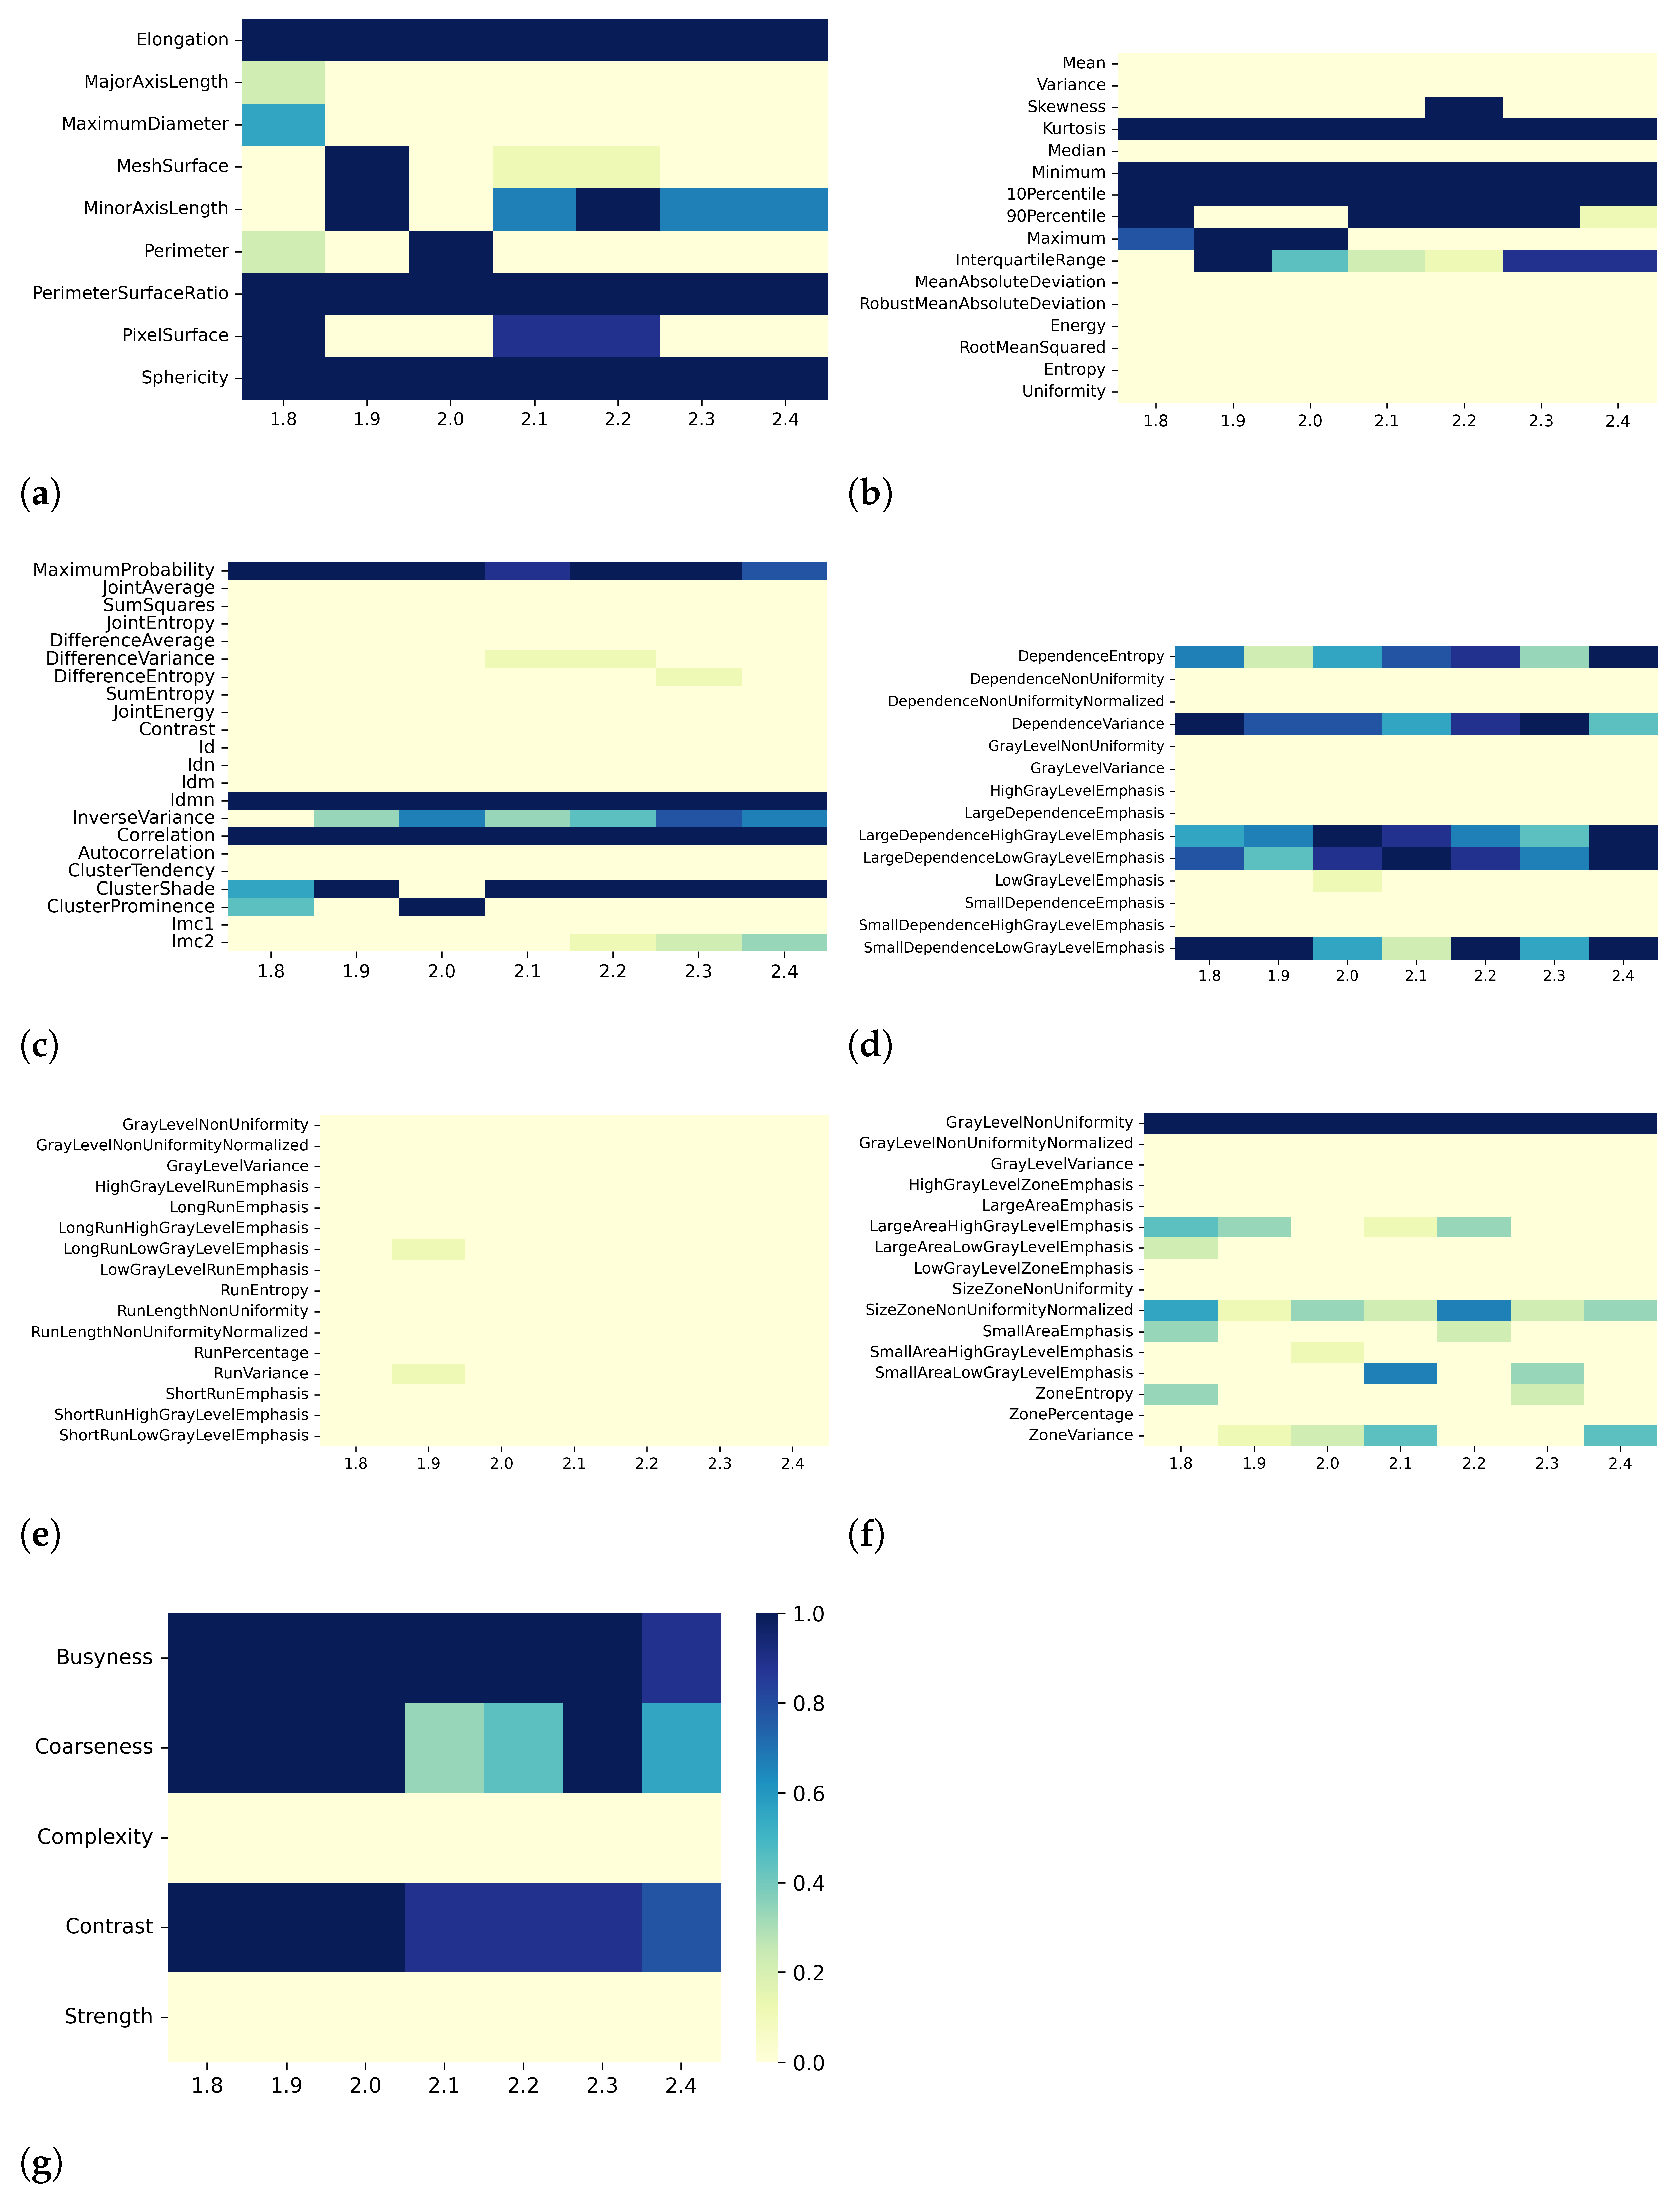
| Effect A—Varying Resampling Voxel Size Values in [1.8, 1.9, 2.0, 2.1, 2.2, 2.3, 2.4] mm, with Fixed Discretization BW | ||||
|---|---|---|---|---|
| Pearson-correlation-based dimensionality reduction | Spearman-correlation-based dimensionality reduction | |||
| Discretization BW (ms) | # of CC | % of remaining features | # of CC | % of remaining features |
| 3.60 | [903 774 660 793 806 778 659] | [21 24 24 22 23 23 23] | [497 447 507 438 491 461 392] | [28 28 29 27 27 33 31] |
| 3.95 | [882 799 676 800 839 851 655] | [21 24 23 23 22 22 24] | [490 489 510 416 466 498 413] | [29 29 26 29 29 31 29] |
| 4.30 | [880 824 680 778 866 825 743] | [23 24 22 23 22 24 22] | [476 499 554 391 490 461 442] | [30 28 29 29 27 31 30] |
| 4.65 | [878 816 682 860 810 831 699] | [22 24 24 20 23 24 23] | [498 477 502 479 443 462 442] | [31 30 30 29 32 33 31] |
| 5.00 | [900 806 707 840 877 824 712] | [23 24 21 22 23 23 23] | [491 444 538 484 499 486 446] | [31 29 27 31 29 30 29] |
| 5.35 | [894 829 712 790 881 878 736] | [23 24 24 22 23 23 23] | [491 492 495 419 426 455 423] | [31 32 29 31 29 30 27] |
| 5.70 | [892 819 739 821 862 824 729] | [26 24 24 24 23 24 23] | [501 475 539 447 442 440 434] | [29 30 31 32 30 31 30] |
| 6.05 | [908 846 702 777 888 841 731] | [24 23 26 23 22 24 20] | [503 483 518 430 464 459 446] | [30 31 31 32 32 33 28] |
| 6.40 | [899 864 714 839 857 843 698] | [24 24 27 22 23 24 23] | [489 463 523 446 474 464 438] | [31 31 31 32 30 32 30] |
| Effect B—Varying Discretization BW Values in [3.60, 3.95, 4.30, 4.65, 5.00, 5.35, 5.70, 6.05, 6.40] ms, with Fixed Resampling Voxel Size | ||||
| Pearson-correlation-based dimensionality reduction | Spearman-correlation-based dimensionality reduction | |||
| Resampling voxel size (mm) | # of CC | % of remaining features | # of CC | % of remaining features |
| 1.8 | [903 882 880 878 900 894 892 908 899] | [21 21 23 22 23 23 26 24 24] | [497 490 476 498 491 491 501 503 489] | [28 29 30 31 31 31 29 30 31] |
| 1.9 | [774 799 824 816 806 829 819 846 864] | [24 24 24 24 24 24 24 23 24] | [447 489 499 477 444 492 475 483 463] | [28 29 28 30 29 32 30 31 31] |
| 2.0 | [660 676 680 682 707 712 739 702 714] | [24 23 22 24 21 24 24 26 27] | [507 510 554 502 538 495 539 518 523] | [29 26 29 30 27 29 31 31 31] |
| 2.1 | [793 800 778 860 840 790 821 777 839] | [22 23 23 20 22 22 24 23 22] | [438 416 391 479 484 419 447 430 446] | [27 29 29 29 31 31 32 32 32] |
| 2.2 | [806 839 866 810 877 881 862 888 857] | [23 22 22 23 23 23 23 22 23] | [491 466 490 443 499 426 442 464 474] | [27 29 27 32 29 29 30 32 30] |
| 2.3 | [778 851 825 831 824 878 824 841 843] | [23 22 24 24 23 23 24 24 24] | [461 498 461 462 486 455 440 459 464] | [33 31 31 33 30 30 31 33 32] |
| 2.4 | [659 655 743 699 712 736 729 731 698] | [23 24 22 23 23 23 23 20 23] | [392 413 442 442 446 423 434 446 438] | [31 29 30 31 29 27 30 28 30] |
| Effect C—Varying Filtering, with Fixed Resampling Voxel Size (2.1 mm) and Discretization BW (6 ms) | ||||
| Pearson-correlation-based dimensionality reduction | Spearman-correlation-based dimensionality reduction | |||
| Filter | # of CC | % of remaining features | # of CC | % of remaining features |
| Original | 744 | 20 | 426 | 29 |
| Gradient | 1244 | 20 | 1116 | 28 |
| Square | 958 | 21 | 462 | 28 |
| SquareRoot | 816 | 20 | 590 | 27 |
| Wavelet-HH | 891 | 18 | 726 | 26 |
| Wavelet-HL | 835 | 21 | 432 | 30 |
| Wavelet-LH | 826 | 22 | 469 | 28 |
| Wavelet-LL | 584 | 24 | 483 | 29 |
| Effect A—Varying Resampling Voxel Size Values in [1.8, 1.9, 2.0, 2.1, 2.2, 2.3, 2.4] mm), with Fixed Discretization BW | ||
|---|---|---|
| Discretization BW (ms) | Pearson-correlation-based dimensionality reduction stability | Spearman-correlation-based dimensionality reduction stability |
| 360 | 0.66 | 0.60 |
| 395 | 0.66 | 0.60 |
| 430 | 0.63 | 0.63 |
| 465 | 0.64 | 0.58 |
| 500 | 0.60 | 0.61 |
| 535 | 0.65 | 0.60 |
| 570 | 0.65 | 0.60 |
| 605 | 0.66 | 0.58 |
| 640 | 0.64 | 0.57 |
| Effect B—Varying Discretization BW Values in [3.60, 3.95, 4.30, 4.65, 5.00, 5.35, 5.70, 6.05, 6.40] ms, with Fixed Resampling Voxel Size | ||
| Resampling voxel size (mm) | Pearson’s correlation-based dimensionality reduction stability | Spearman’s correlation-based dimensionality reduction stability |
| 1.8 | 0.69 | 0.66 |
| 1.9 | 0.85 | 0.68 |
| 2.0 | 0.77 | 0.67 |
| 2.1 | 0.65 | 0.71 |
| 2.2 | 0.69 | 0.71 |
| 2.3 | 0.77 | 0.66 |
| 2.4 | 0.70 | 0.74 |
| Effect C—Varying Filtering, with Fixed Resampling Voxel Size (2.1 mm) and Discretization BW (6 ms) | ||
| Pearson-correlation-based dimensionality reduction stability | Spearman-correlation-based dimensionality reduction stability | |
| Filtering | 0.38 | 0.42 |
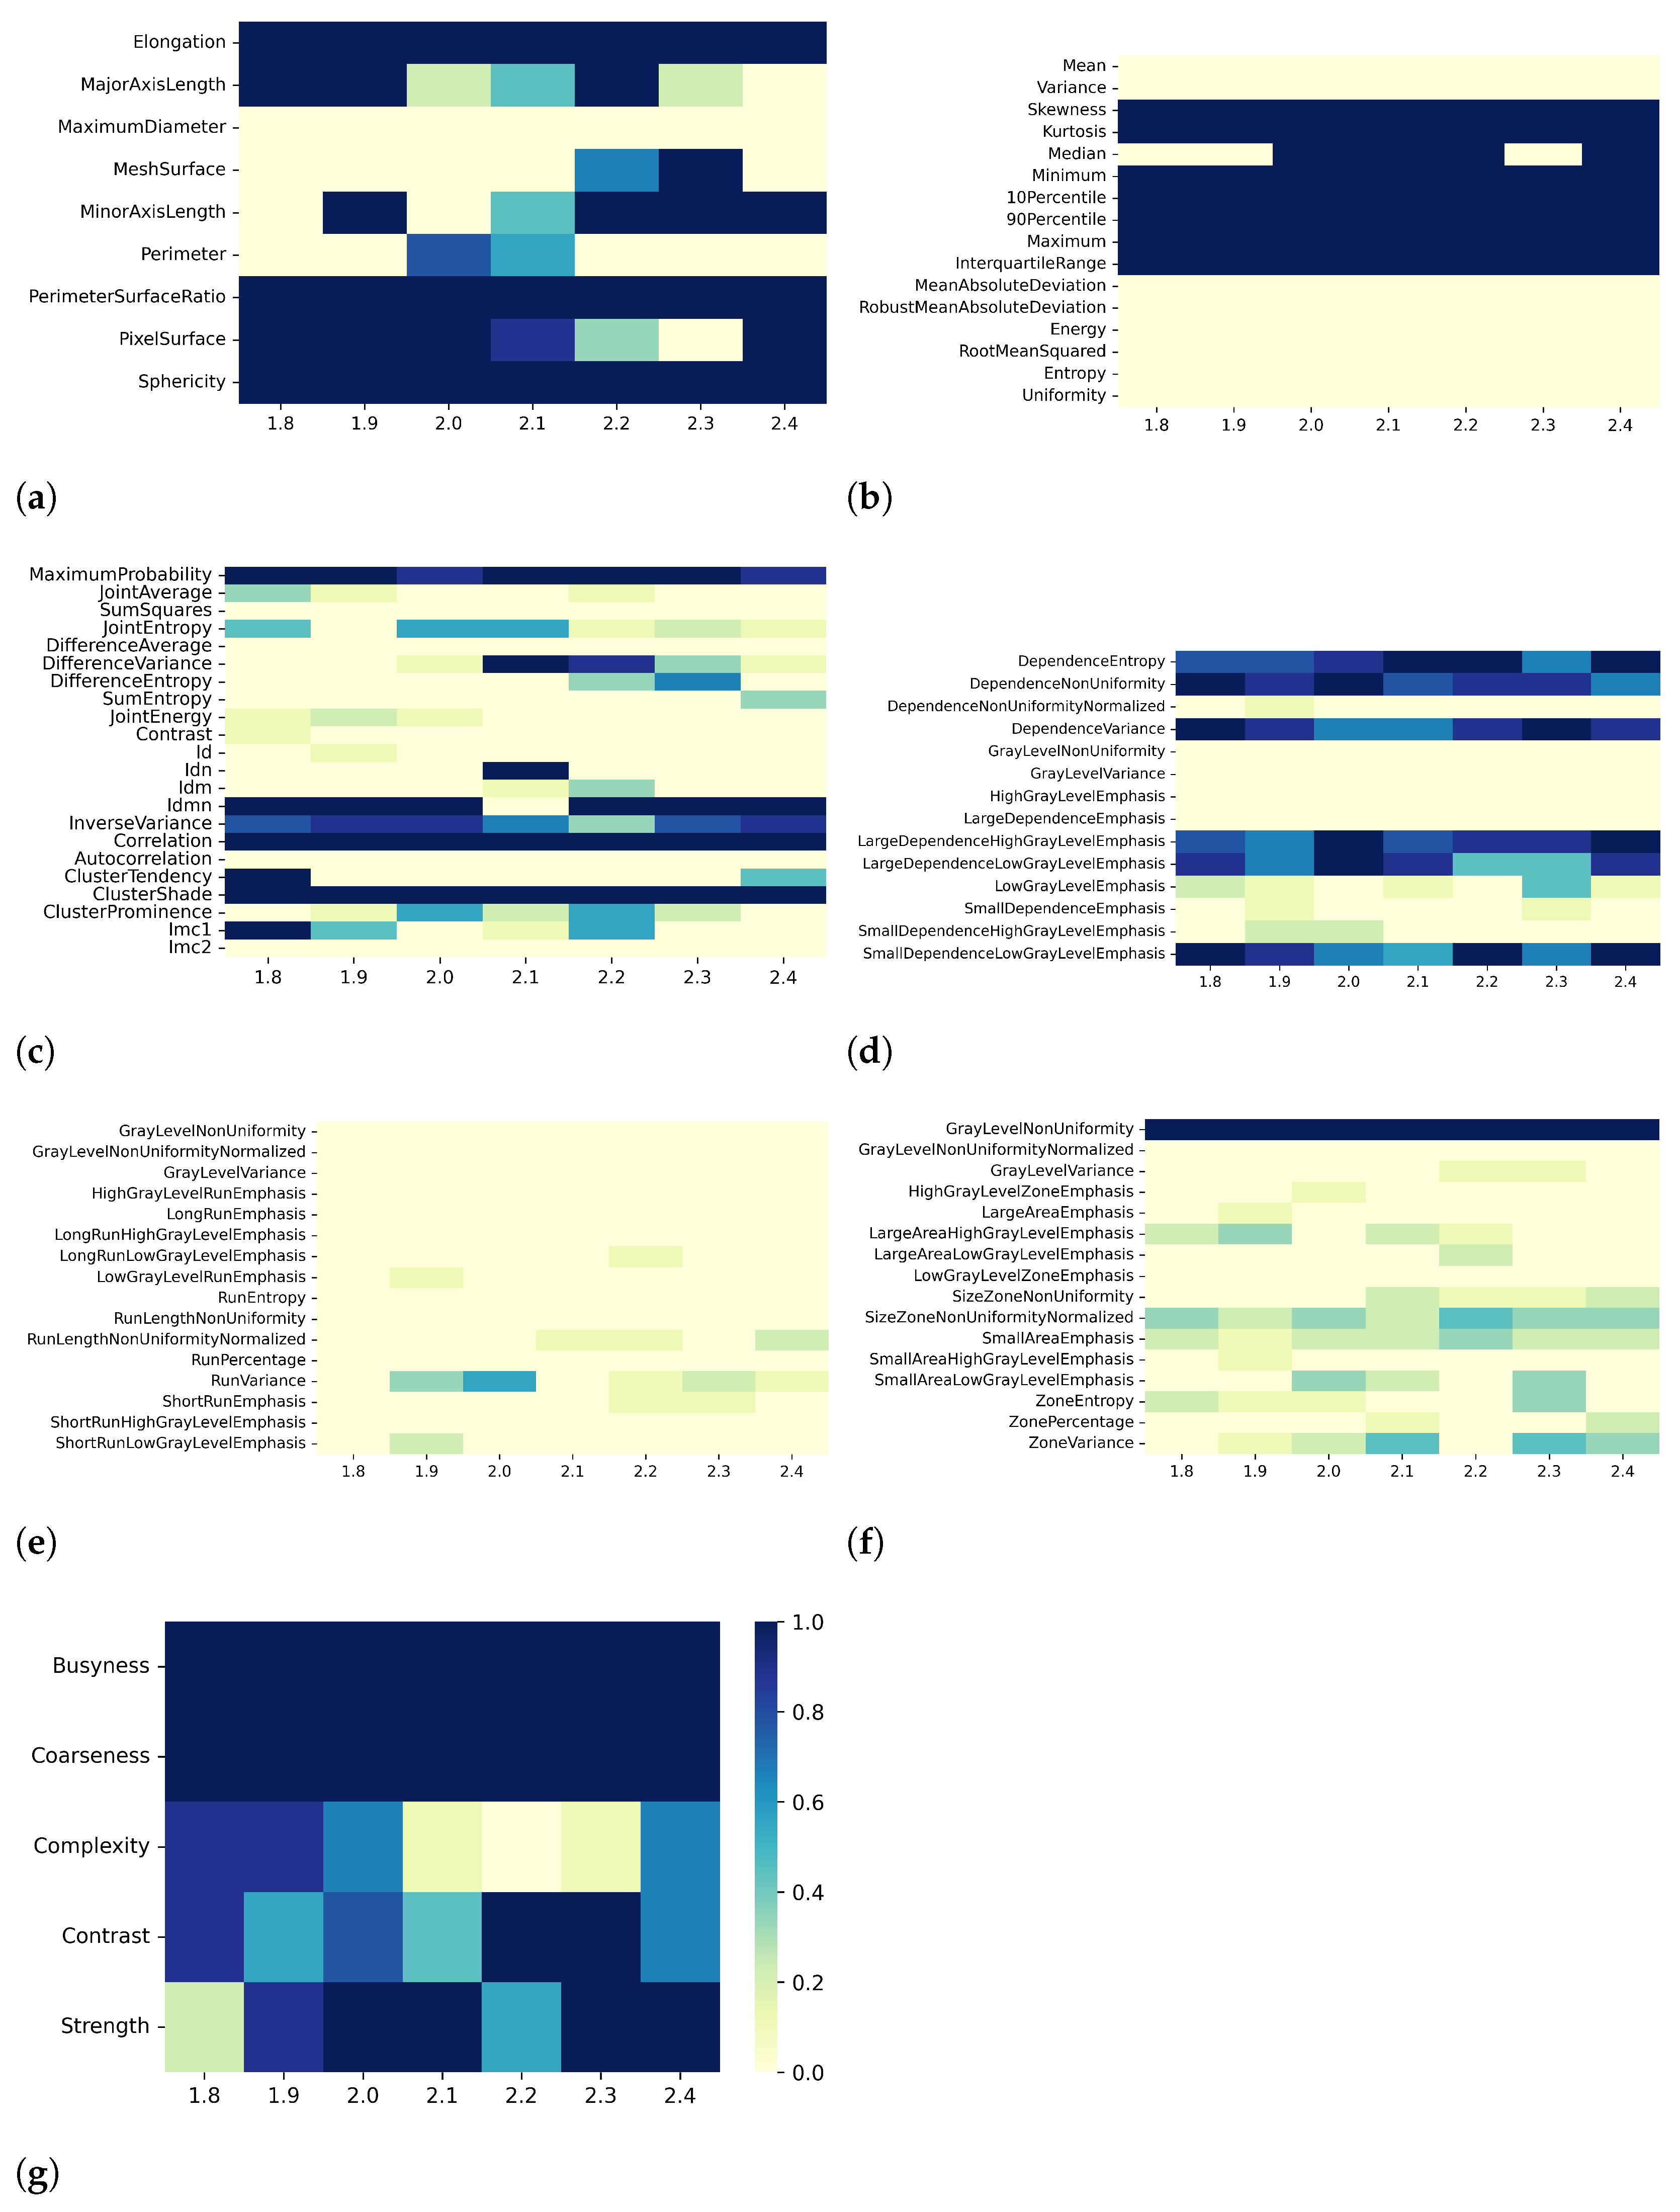
| Effect A—Varying Resampling Voxel Size Values in [1.8, 1.9, 2.0, 2.1, 2.2, 2.3, 2.4] mm, with Fixed Discretization BW | ||||
|---|---|---|---|---|
| Pearson-correlation-based dimensionality reduction | Spearman-correlation-based dimensionality reduction | |||
| Discretization BW (ms) | # of CC | % of remaining features | # of CC | % of remaining features |
| 0.49 | [553 579 546 567 534 546 594] | [24 23 21 22 23 22 22] | [417 445 422 453 443 399 410] | [32 32 34 31 30 34 34] |
| 0.50 | [570 582 564 570 576 538 605] | [24 21 21 22 23 23 21] | [414 432 438 467 431 393 479] | [33 32 34 32 34 31 32] |
| 0.51 | [574 594 547 583 572 544 607] | [24 22 22 20 23 22 19] | [403 460 432 467 444 380 520] | [34 33 33 31 33 32 32] |
| 0.52 | [564 574 540 583 557 550 609] | [23 22 22 22 26 21 21] | [386 431 418 455 406 412 467] | [34 32 33 32 35 30 32] |
| 0.53 | [558 582 562 555 564 567 599] | [24 26 21 21 24 20 22] | [419 439 446 435 418 398 487] | [31 32 33 32 35 32 32] |
| 0.54 | [572 589 570 568 572 554 621] | [23 22 21 21 22 21 19] | [399 442 453 442 430 419 444] | [33 35 31 33 34 31 33] |
| 0.55 | [582 579 564 575 563 555 572] | [23 22 22 21 24 21 23] | [415 426 414 429 435 417 422] | [32 30 32 32 35 31 33] |
| 0.56 | [555 599 559 580 572 558 605] | [24 22 22 22 24 21 20] | [413 467 422 448 426 408 450] | [31 31 35 35 34 32 32] |
| 0.57 | [583 591 562 574 576 526 597] | [24 21 23 21 26 21 21] | [413 426 442 456 435 405 472 ] | [32 34 31 31 33 34 31] |
| Effect B—Varying Discretization BW Values in [0.49, 0.50, 0.51, 0.52, 0.53, 0.54, 0.55, 0.56, 0.57] ms, with Fixed Resampling Voxel Size | ||||
| Pearson-correlation-based dimensionality reduction | Spearman-correlation-based dimensionality reduction | |||
| Resampling voxel size (mm) | # of CC | % of remaining features | # of CC | % of remaining features |
| 1.8 | [553 570 574 564 558 572 582 555 583] | [24 24 24 23 24 23 23 24 24] | [417 414 403 386 419 399 415 413 413] | [32 33 34 34 31 33 32 31 32] |
| 1.9 | [579 582 594 574 582 589 579 599 591] | [23 21 22 22 26 22 22 22 21] | [445 432 460 431 439 442 426 467 426] | [32 32 33 32 32 35 30 31 34] |
| 2.0 | [546 564 547 540 562 570 564 559 562] | [21 21 22 22 21 21 22 22 23] | [422 438 432 418 446 453 414 422 442] | [34 34 33 33 33 31 32 35 31] |
| 2.1 | [567 570 583 583 555 568 575 580 574] | [22 22 20 22 21 21 21 22 21] | [453 467 467 455 435 442 429 448 456] | [31 32 31 32 32 33 32 35 31] |
| 2.2 | [534 576 572 557 564 572 563 572 576] | [23 23 23 26 24 22 24 24 26] | [443 431 444 406 418 430 435 426 435] | [30 34 33 35 35 34 35 34 33] |
| 2.3 | [546 538 544 550 567 554 555 558 526] | [22 23 22 21 20 21 21 21 21] | [399 393 380 412 398 419 417 408 405] | [34 31 32 30 32 31 31 32 34] |
| 2.4 | [594 605 607 609 599 621 572 605 597] | [22 21 19 21 22 19 23 20 21] | [410 479 520 467 487 444 422 450 472] | [34 32 32 32 32 33 33 32 31] |
| Effect C—Varying Filtering, with Fixed Resampling Voxel Size (2.1 mm) and Discretization BW (0.56 ms) | ||||
| Pearson-correlation-based dimensionality reduction | Spearman-correlation-based dimensionality reduction | |||
| Filter | # of CC | % of remaining features | # of CC | % of remaining features |
| Original | 551 | 21 | 429 | 31 |
| Gradient | 1487 | 19 | 1138 | 28 |
| Square | 817 | 20 | 564 | 36 |
| SquareRoot | 552 | 20 | 447 | 25 |
| Wavelet-HH | 841 | 17 | 738 | 24 |
| Wavelet-HL | 753 | 19 | 688 | 24 |
| Wavelet-LH | 870 | 20 | 469 | 22 |
| Wavelet-LL | 563 | 18 | 412 | 29 |
| Effect A—Varying Resampling Voxel Size Values in [1.8, 1.9, 2.0, 2.1, 2.2, 2.3, 2.4] mm, with Fixed Discretization BW | ||
|---|---|---|
| Discretization BW (ms) | Pearson-correlation-based dimensionality reduction stability | Spearman-correlation-based dimensionality reduction stability |
| 0.49 | 0.75 | 0.73 |
| 0.50 | 0.69 | 0.70 |
| 0.51 | 0.70 | 0.68 |
| 0.52 | 0.74 | 0.70 |
| 0.53 | 0.69 | 0.68 |
| 0.54 | 0.67 | 0.70 |
| 0.55 | 0.72 | 0.71 |
| 0.56 | 0.74 | 0.71 |
| 0.57 | 0.69 | 0.65 |
| Effect B—Varying Discretization BW Values in [0.49, 0.50, 0.51, 0.52, 0.53, 0.54, 0.55, 0.56, 0.57] ms, with Fixed Resampling Voxel Size | ||
| Resampling voxel size (mm) | Pearson-correlation-based dimensionality reduction stability | Spearman-correlation-based dimensionality reduction stability |
| 1.8 | 0.81 | 0.86 |
| 1.9 | 0.89 | 0.79 |
| 2.0 | 0.88 | 0.81 |
| 2.1 | 0.81 | 0.77 |
| 2.2 | 0.86 | 0.79 |
| 2.3 | 0.84 | 0.79 |
| 2.4 | 0.84 | 0.84 |
| Effect C—Varying Filtering, with Fixed Resampling Voxel Size (2.1 mm) and Discretization BW (0.56 ms) | ||
| Pearson-correlation-based dimensionality reduction stability | Spearman-correlation-based dimensionality reduction stability | |
| Filtering | 0.40 | 0.43 |
Disclaimer/Publisher’s Note: The statements, opinions and data contained in all publications are solely those of the individual author(s) and contributor(s) and not of MDPI and/or the editor(s). MDPI and/or the editor(s) disclaim responsibility for any injury to people or property resulting from any ideas, methods, instructions or products referred to in the content. |
© 2023 by the authors. Licensee MDPI, Basel, Switzerland. This article is an open access article distributed under the terms and conditions of the Creative Commons Attribution (CC BY) license (https://creativecommons.org/licenses/by/4.0/).
Share and Cite
Marzi, C.; Marfisi, D.; Barucci, A.; Del Meglio, J.; Lilli, A.; Vignali, C.; Mascalchi, M.; Casolo, G.; Diciotti, S.; Traino, A.C.; et al. Collinearity and Dimensionality Reduction in Radiomics: Effect of Preprocessing Parameters in Hypertrophic Cardiomyopathy Magnetic Resonance T1 and T2 Mapping. Bioengineering 2023, 10, 80. https://doi.org/10.3390/bioengineering10010080
Marzi C, Marfisi D, Barucci A, Del Meglio J, Lilli A, Vignali C, Mascalchi M, Casolo G, Diciotti S, Traino AC, et al. Collinearity and Dimensionality Reduction in Radiomics: Effect of Preprocessing Parameters in Hypertrophic Cardiomyopathy Magnetic Resonance T1 and T2 Mapping. Bioengineering. 2023; 10(1):80. https://doi.org/10.3390/bioengineering10010080
Chicago/Turabian StyleMarzi, Chiara, Daniela Marfisi, Andrea Barucci, Jacopo Del Meglio, Alessio Lilli, Claudio Vignali, Mario Mascalchi, Giancarlo Casolo, Stefano Diciotti, Antonio Claudio Traino, and et al. 2023. "Collinearity and Dimensionality Reduction in Radiomics: Effect of Preprocessing Parameters in Hypertrophic Cardiomyopathy Magnetic Resonance T1 and T2 Mapping" Bioengineering 10, no. 1: 80. https://doi.org/10.3390/bioengineering10010080
APA StyleMarzi, C., Marfisi, D., Barucci, A., Del Meglio, J., Lilli, A., Vignali, C., Mascalchi, M., Casolo, G., Diciotti, S., Traino, A. C., Tessa, C., & Giannelli, M. (2023). Collinearity and Dimensionality Reduction in Radiomics: Effect of Preprocessing Parameters in Hypertrophic Cardiomyopathy Magnetic Resonance T1 and T2 Mapping. Bioengineering, 10(1), 80. https://doi.org/10.3390/bioengineering10010080


