Article

The Assessment of Climate Change Impacts and Land-use Changes on Flood Characteristics: The Case Study of the Kelani River Basin, Sri Lanka

by
Jayanga T. Samarasinghe
1,
Randika K. Makumbura
2,
Charuni Wickramarachchi
3,
Jeewanthi Sirisena
4,
Miyuru B. Gunathilake
5,6,
Nitin Muttil
7,8,*,
Fang Yenn Teo
9 and
Upaka Rathnayake
2,*
1
Department of Earth Environmental and Resource Sciences, University of Texas, El Paso, TX 79968, USA
2
Department of Civil Engineering, Faculty of Engineering, Sri Lanka Institute of Information Technology, Malabe 10115, Sri Lanka
3
IHE Delft for Water Education, 2601 DA Delft, The Netherlands
4
Department of Water Engineering and Management, University of Twente, 7522 NB Enschede, The Netherlands
5
Hydrology and Aquatic Environment, Environment and Natural Resources, Norwegian Institute of Bioeconomy and Research, 1433 Ås, Norway
6
Water, Energy and Environmental Engineering Research Unit, Faculty of Technology, University of Oulu, P.O. Box 8000, FI-90014 Oulu, Finland
7
Institute for Sustainable Industries & Liveable Cities, Victoria University, P.O. Box 14428, Melbourne, VIC 8001, Australia
8
College of Engineering and Science, Victoria University, P.O. Box 14428, Melbourne, VIC 8001, Australia
9
Department of Civil Engineering, University of Nottingham, Semenyih 43500, Malaysia
*
Authors to whom correspondence should be addressed.
Hydrology 2022, 9(10), 177; https://doi.org/10.3390/hydrology9100177
Submission received: 4 September 2022 / Revised: 26 September 2022 / Accepted: 3 October 2022 / Published: 9 October 2022
(This article belongs to the Section Water Resources and Risk Management)

Abstract

:
Understanding the changes in climate and land use/land cover (LULC) over time is important for developing policies for minimizing the socio-economic impacts of riverine floods. The present study evaluates the influence of hydro-climatic factors and anthropogenic practices related to LULC on floods in the Kelani River Basin (KRB) in Sri Lanka. The gauge-based daily precipitation, monthly mean temperature, daily discharges, and water levels at sub-basin/basin outlets, and both surveyed and remotely sensed inundation areas were used for this analysis. Flood characteristics in terms of mean, maximum, and number of peaks were estimated by applying the peak over threshold (POT) method. Nonparametric tests were also used to identify the climatic trends. In addition, LULC maps were generated over the years 1988–2017 using Landsat images. It is observed that the flood intensities and frequencies in the KRB have increased over the years. However, Deraniyagala and Norwood sub-basins have converted to dry due to the decrease in precipitation, whereas Kithulgala, Holombuwa, Glencourse, and Hanwella showed an increase in precipitation. A significant variation in atmospheric temperature was not observed. Furthermore, the LULC has mostly changed from vegetation/barren land to built-up in many parts of the basin. Simple correlation and partial correlation analysis showed that flood frequency and inundation areas have a significant correlation with LULC and hydro-climatic factors, especially precipitation over time. The results of this research will therefore be useful for policy makers and environmental specialists to understand the relationship of flood frequencies with the anthropogenic influences on LULC and climatic factors.

1. Introduction

Floods are one of the most frequent and devasting natural disasters around the world [1,2]. They affect more people than other natural disasters: 55% of the world population was affected by floods, which were 43% of all disaster events during 1994–2013 [2]. Furthermore, floods enormously impact socioeconomic status, the environment, infrastructure, and development [3,4,5,6,7]. Floods occur under different environmental conditions/parameters such as meteorological, hydrological, geographical, and geological. Furthermore, anthropogenic activities can intensify it. Because of the heavy precipitation and storm surges, a large volume of runoff is generated that occupies and inundates land masses near waterways. Floods became more frequent, and disasters were intensified over the last few decades [2,8,9], closely linked to changes in the earth’s climate and increased human interventions [10]. For example, flash floods have increased in the Hengduan Mountain region of China over the last decade [8]. Flash floods in Chamoli, Uttarakhand region were analyzed by Verma et al. [11], and they found that the flood intensities have significantly increased. Many other examples of increasing flood risk can be found in literature [12].
The global climate is changing, and its adverse impacts are inevitable. According to the recently released IPCC’s sixth assessment report [13], climate impacts are at the high end of previous estimates, affecting all parts of the world. This report also mentions that about 40% of the world population (approximately 3.5 billion people) may be affected by the most severe category of “high vulnerability” related climatic impacts. The land has warmed by more than 0.5 °C compared with the global mean temperature after 1990 [14,15]. Increasing earth temperatures are attributable to greenhouse gas emissions and resultant responses in the earth system [9,16]. It was evident that this warming has affected changes in extreme weather and extreme events globally, i.e., heatwaves, high-intensity precipitation, sea-level rise, and snow and glacier melting [17].
Rapeli and Mussalo-Rauhamaa [18] stated that the heatwaves have intensified due to global warming. Substantial literature can be found to verify this scenario and Wang et al. [19] have researched it in Eurasia. Many researchers have showcased and modelled the relationship between global warming and sea level rise [20,21,22]. In addition, most of these researchers have pointed out the adverse impacts of sea level rise in countries like Bangladesh [23,24], Maldives [25,26], Fiji Islands [27,28], and Sri Lanka [29]. Similar relationships can be found in the literature highlighting the impacts of global warming on various other extreme weather conditions. However, extreme precipitation is one of the most evident impacts of global warming.
Precipitation changes have not been uniform across the world. Particularly, in mid-latitudes and tropical regions, more frequent and extreme precipitation is expected due to a rise in surface temperature [17,30]. Shared socioeconomic pathways from IPCC’s AR6 report [13] indicate that temperature may reach the warming limits around the middle of the 21st century and will cause unavoidable increases in multiple climate hazards such as floods, droughts, storms, cyclones, and landslides.
On the other hand, demands for natural resources and services increase predominantly due to population growth, urbanization, and climate change. Therefore, changes in land use and land cover (LULC) are predominant among many other changes in the land mass. This physical factor ultimately promotes flooding and its severity [9,31]. Any changes in LULC cause differences in weather patterns (i.e., temperature and precipitation) and resultant hydrological responses (i.e., soil moisture, runoff, peaks, and erosion). Furthermore, LULC can change the levels of exposure, risk, and vulnerability to flooding as well. Recent studies have emphasized that rapid urbanization and deforestation reduce infiltration, increase runoff and flooding time, and disrupt ecosystems [32,33,34]. Due to such effects of land-use change, it is concluded that hydrologically significant changes will continuously take place in the next decades due to the loss of agricultural and forest lands [35].
Owing to the combined effect of the changing climate and human activities, many nations are highly vulnerable to flood hazards that lead to myriad socioeconomic issues. Asian and African countries are the most severely hit by floods [2,31]. Many countries spend millions of dollars every year to recover from the aftermath of such disasters and disaster prevention, mitigation, and adaptation [36]. Miner and Alipour [37] identified the types of damage that occur during floods in the transportation sector in Iowa, USA. They paid significant attention to bridges and their recovery stages after inland floods. Similar research work can be found in recent literature, and many studies have assessed the recovery cost of transportation networks [38], agriculture [39], other properties [40,41], etc. However, flood damages were not analyzed extensively in the context of Sri Lanka.
However, a recent analysis of the Global Climate Risk Index (GCRI) [42] stated that Sri Lanka was one of the top 10 countries that were severely affected by climate change in 2018. Sri Lanka is a tropical country that receives intense rainfall due to four main monsoons: the first inter-monsoon (March and April), southwest monsoon (May to September), second inter-monsoon (October and November), and northeast monsoon (December to February) [43]. During these monsoons, the intense rainfall often results in heavy storms that cause severe flood events. Recurring floods are very common in Sri Lanka and cause significant economic and social damage [44,45,46]. The Kelani River basin is one of the most vulnerable basins in Sri Lanka that gets subjected to annual flooding [44]. It experiences large-scale flooding every two to three years on average that affects approximately 200,000 people [47]. Over the last two decades, the main drivers of major floods have been climate change and land-use change. It has been concluded in many studies that the risk of flooding could increase due to changing climate worldwide over the years to come [48,49], and thus, Sri Lanka would be facing many flood-related issues.
Therefore, the KRB would be an ideal river basin to analyze its floods based on LULC changes. When long-term behaviour and trends of the climate extremes (temperature and precipitation) of the Kelani River basin are analysed, it can be concluded that the temperature and precipitation extremes are rising while the annual average precipitation in the basin is declining [50]. Rapid urbanization took place over the last three decades in many parts of Sri Lanka. For example, a study by Maheng et al. [51] analyzed LULC in the Colombo urban and suburb areas (the capital of Sri Lanka and located in the lower part of the Kelani River basin, Figure 1) in 1997 and 2015 and stated that urban areas have increased by approximately 51% and suburban areas have decreased by 15% over 19 years. Therefore, it is essential to understand the effects of climate change and LULC on flooding conditions in any part of the country.
The overall aim of this study is to assess the impacts of climate change and land-use cover on flooding in the Kelani River basin by analysing relevant observed and remote sensed climatic and land-use and land-cover data. The specific objectives of the current study are (1) to identify historical floods using hydrological time series; (2) to further analyse the selected historical floods with respect to their intensity and frequency; and (3) to statistically assess the impacts of climate change and land-cover change on flood characteristics. Results from this study will be useful to plan and initiate adaptation and mitigation strategies that can be implemented to effectively reduce flood risks caused by continuing climate and land-use land cover changes.
This paper is structured as follows. Section 2 discusses the materials and methods that were used in this study. The study area and data used are presented in detail in Section 1. In addition, the methodology followed is clearly presented. Section 3 then presents the results of the analysis. The temporal variation of LULC and climatic trends are presented in Section 1. The correlation of LULC variation to climatic trends is also presented in Section 1. Section 4 finally presents the summary and the conclusions of the study. Section 1 will also help the local planning authorities and the government to orient the solution framework towards identifying sustainable countermeasures for the problem of frequent floods in the Kelani River Basin.

2. Material and Methods
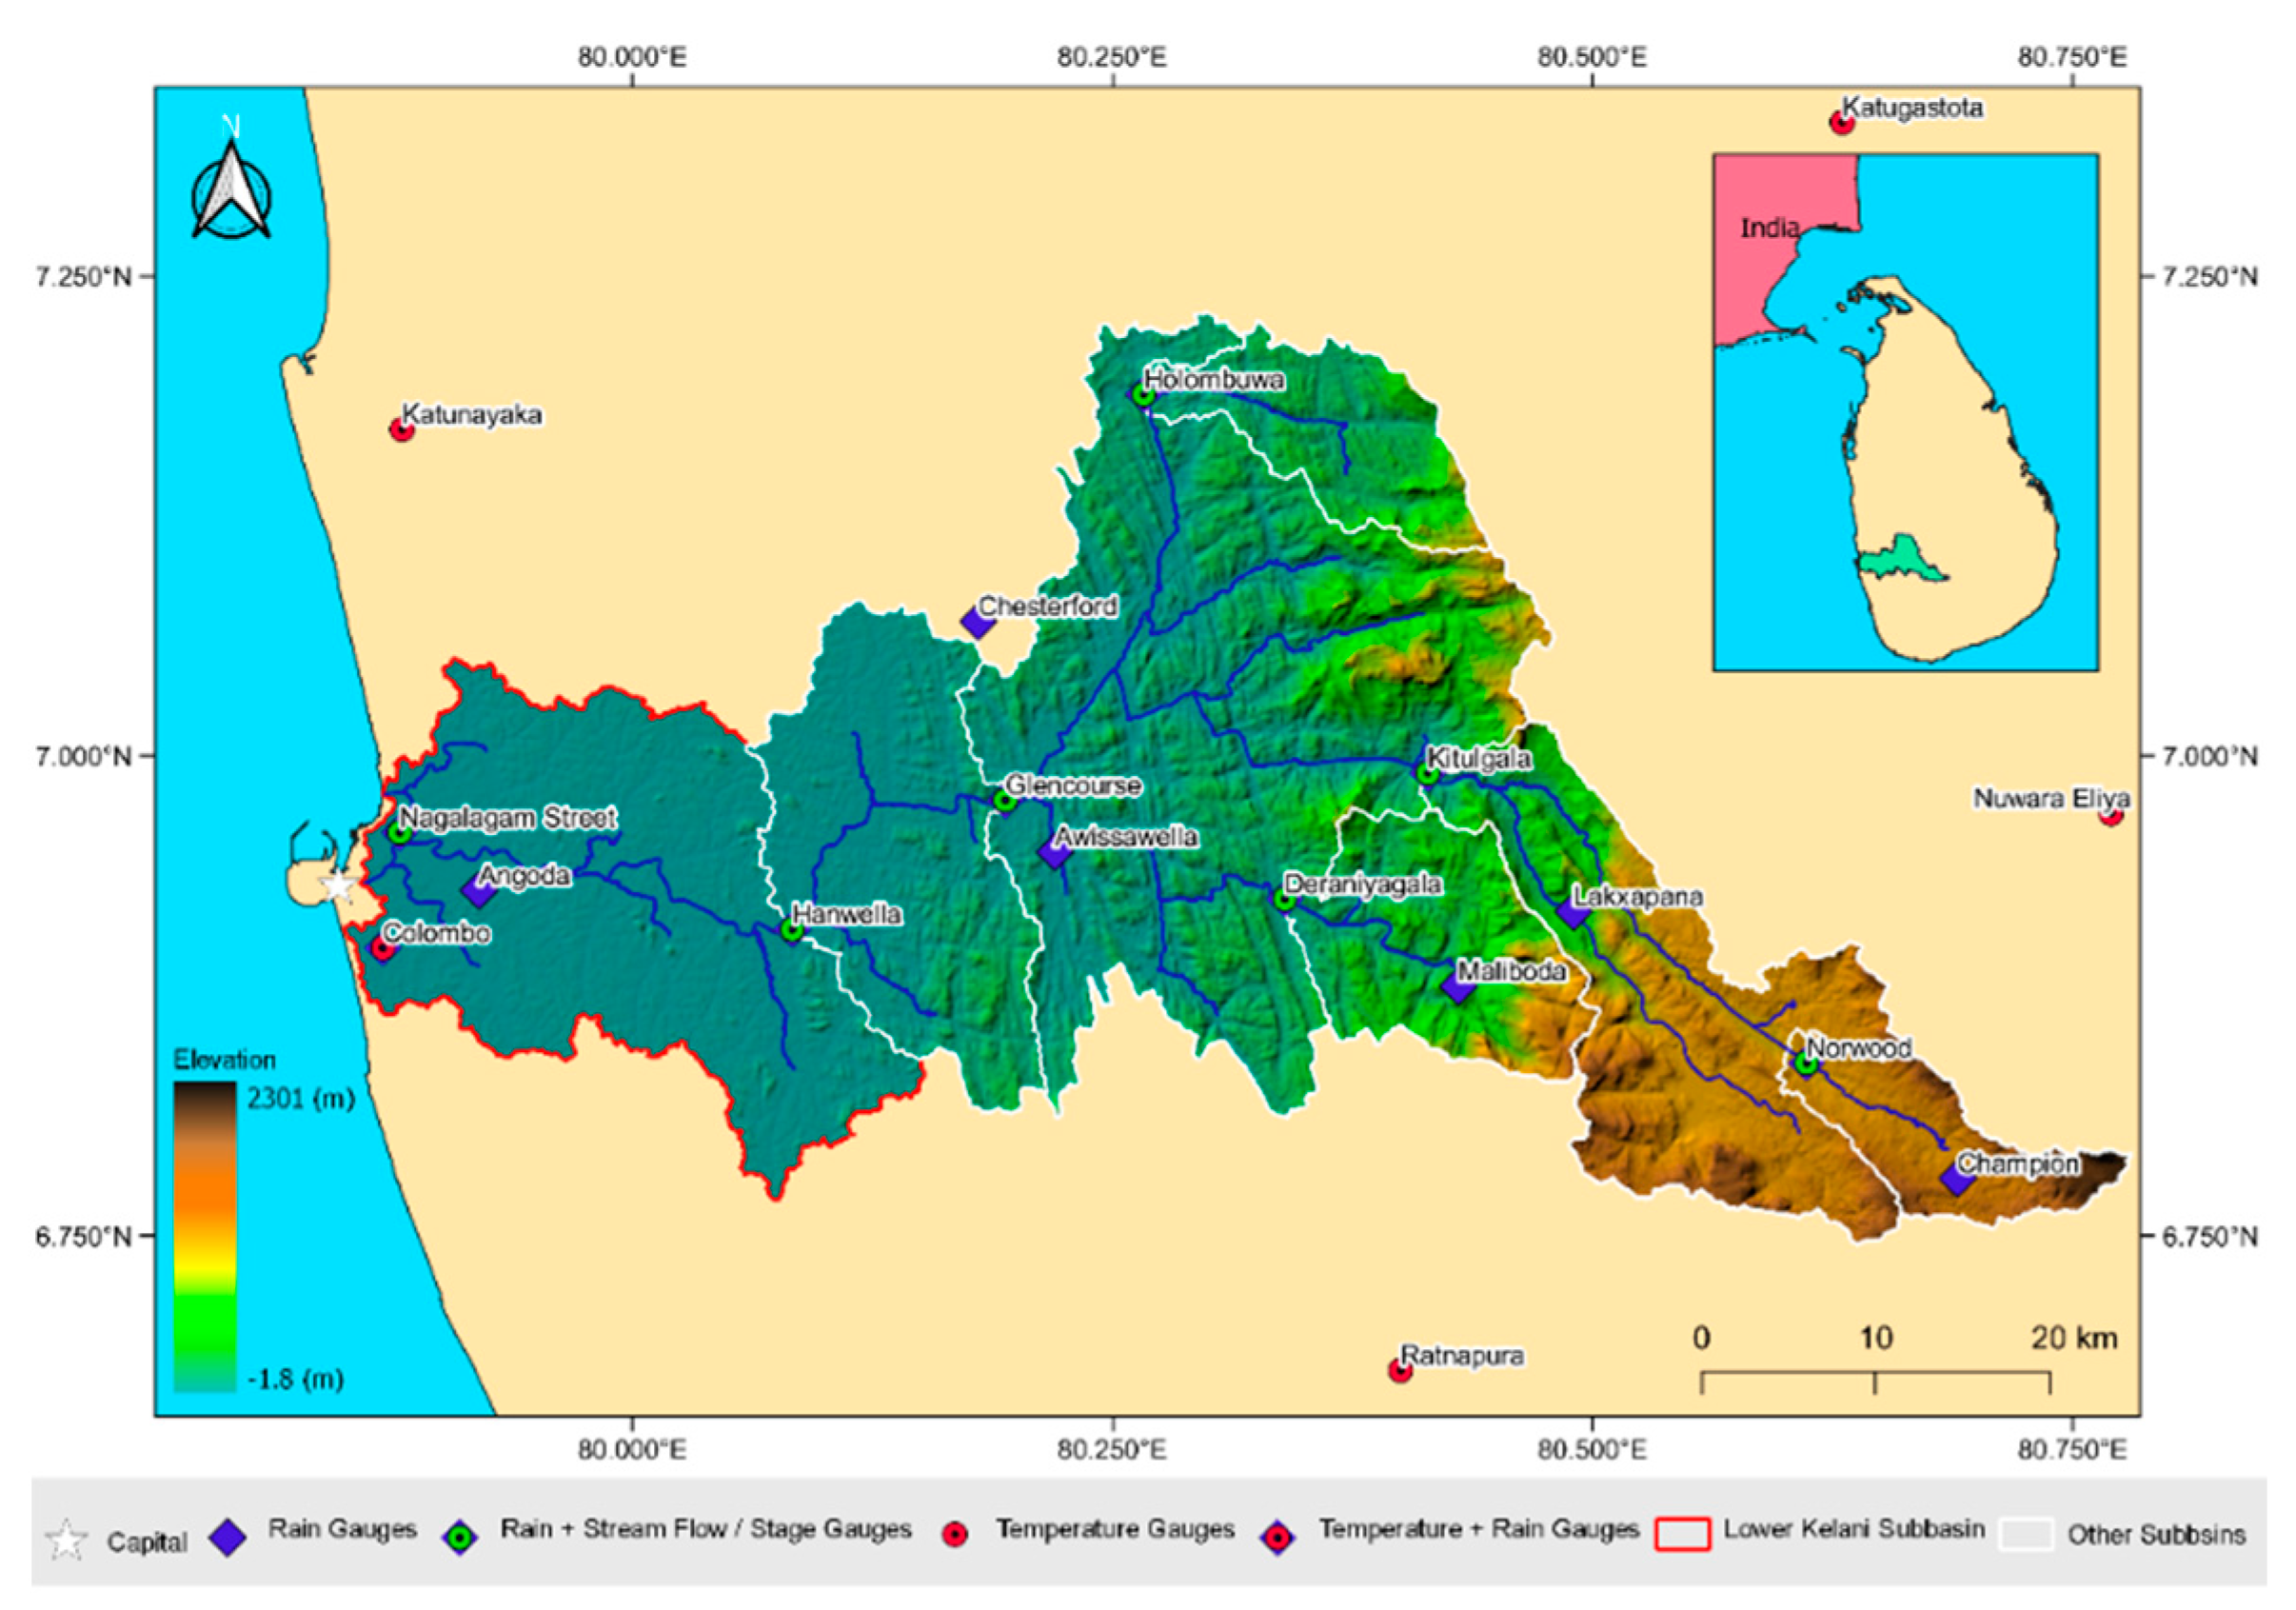
2.1. Study Area

Sri Lanka is situated on the southern tip of India, between the latitudes of 6°–10° and east longitudes 80°–82° with an area extent of 65,610 km2, and it experiences high rainfall due to extreme low-pressure conditions in the Bay of Bengal and high seasonal precipitation due to the La Niña phenomenon [52]. As was stated above, the KRB is one of the most important river basins in Sri Lanka. The Kelani River basin is located between northern latitude 6° 47′ to 7° 05′ and eastern longitudes 79° 52′ to 80° 13′, covering a basin area of 2230 km2, with altitudes from −1.8 m to 2300 m above mean sea level as shown in Figure 1. The river basin is broadly categorized into upper and lower basins (Upper basin—above Hanwella Gauge, Lower basin – below Hanwella basin). The upper Kelani River basin is predominantly with vegetation, whereas the lower basin is heavily urbanized. The river basin receives a total annual rainfall of nearly 6000 mm and carries a peak discharge of 800–1500 m3/s during the monsoonal periods to the Indian Ocean (i.e., especially in the South-West monsoon period from May to September).
The Kelani River is the fourth largest river in Sri Lanka, and it drains to the Indian Ocean through the capital, economic and commercial city of Colombo. The lower Kelani River basin (approximately 500 km2) lies in the Colombo district, which is the most densely populated city in Sri Lanka. Therefore, the Kelani River basin is a vulnerable river basin during flooding [47,50,52]. Thus, flood risk minimization is very important for reducing economic and social damage.

2.2. Hydro-Climatic and Remote Sensed Data

The present study used the daily data of 13 precipitation stations, monthly data from 5 temperature stations, and daily data from 7 flow measuring stations as indicated in Table 1. The above data were obtained from the department of metrology and the department of irrigation. The mean rainfall calculations were conducted using the Thiessen polygon method, and the gaps were filled for the data sets that had less than 10% missing data. Furthermore, satellite images of Landsat 5 Thematic mapper (for the years 1988, 1998, and 2008) and Landsat 8 Operational Land Imager (for the year 2018) were downloaded from USGS Earth Explorer at https://earthexplorer.usgs.gov/ (accessed on 1 August 2022). Additionally surveyed flood inundation maps were obtained from the irrigation department of Sri Lanka and the Survey Department of Sri Lanka for the years 1989 and 2016 respectively. Moreover, satellite images of the 2016 flood were obtained from Sentinel—1 A satellite mission at https://scihub.copernicus.eu/ (accessed on 1 August 2022).

2.3. Land-use and Land Cover Analysis

The land use and land cover (LULC) maps were produced based on satellite images from Landsat missions and cross-validated by high-resolution satellite images from Google Earth. The classification was conducted for six land-use classes, namely, forests, cultivations, built-up areas, water bodies, bare land, and clouds using the semi-automated classification plugin in QGIS 3.16 long-term release. The semi-automated classification plugin is a supervised classification tool, and it trains areas in pixel-based image classification. More information on this open-source toolbox can be found in Congedo [53]. Here to increase the accuracy, a prior pixel section was conducted with a high-resolution satellite imaginary with google earth. A minimum number of 50 samples of each class was defined, and kappa analysis was conducted with a discrete multivariate technique. Further details of the accuracy assessment of LULC can be found in Makumbura et al. [54], which is a parallel research work conducted by the same research group as the authors of this study. The LULC classifications were conducted for the base years 1988, 1998, 2008, and 2018. To calculate annual values linear regression model was employed to generating values for 1988–2018 [55].

2.4. Analysing Flood Characteristics

The historical floods for the Kelani River basin were detected based on peak–over–threshold (POT) method using the water engineering time series processing (WETSPRO) tool by Willems [56] with flood classification levels and respective discharges according to the severity. Before applying the POT method, the specific discharge (discharge/area) was obtained for each outlet. The specific discharge removes the effect of the size of subbasins. Kithulgala subbasin shares its outlet with the Norwood subbasin. Furthermore, the Glencourse subbasin shares its outlet with Norwood, Kithulgala, Deraniyagala, and Holombuwa. Similarly, the Hanwella subbasin shares its outlet with all the subbasins including Glencourse. Therefore, the subbasin area is obtained by adding the areas of subbasins that share the same outlet. Subsequently, once the specific discharges were calculated, the POT method was applied to obtain historical flooding events [57]. Flood peaks and maximum and mean peaks were determined for three decal segments (1988–1997, 1998–2007, and 2008–2017) for comparison.

2.5. Precipitation Trend Analysis

Precipitation trend analyses were carried out to identify the trends using historical precipitation data in each subbasin. The precipitation gauges used for the present study are shown in Figure 1, and coordinates and periods are denoted in Table 1. The Kelani River basin has a well-distributed precipitation gauge network (refer to Figure 1). Thus, it can be assumed that the precipitation gauges around the river basin represent the rainfall patterns in the basin. The present analysis employed the monthly rainfall data derived from the daily data. Further, the missing data were filled with the inverse distance method as it is one of the better-suited methods to fill the missing data in the regions of low country wet zone areas [58,59,60] than the other methods [61]. Subsequently, Pettitt’s test, SNHT, Buishand’s test, and von Neumann’s test were carried out to check the homogeneity of the rainfall data series [58,59,60]. Afterward, the Mann–Kendall test [62] and Sen’s slope estimator test [63] were carried out to identify the trends in the precipitation data. The Mann–Kendall test is one of the most widely used nonparametric tests in the world to test climatic trends [64,65,66]. The Mann–Kendall test can be formulated as follows in Equation (1):
S = i = 1 n 1 j = i + 1 n s g n ( x j x i )
s g n ( x i x j ) = { 1 i f   x j x i > 0 0 i f   x j x i = 0 1 i f   x j x i < 0
where x j and x i are climate data in months/years j and i here j > i . The Mann–Kendall test is a qualitative measurement of the trend. Therefore, in order to quantify the trends, Sen’s slope method [63] was coupled with the Mann–Kendall method. More details about the procedure can be found in Khaniya et al. [65]. The mathematical explanation of Sen’s slope ( T i ) method is given in Equation (2). Depending on the sign of the Q i , the trend can be identified as an increasing or decreasing trend.
T i = x j x i j i   f o r   i = 1 , . . ,   N  
Q i = { T N + 1 2                             i f   N   i s   o d d T N 2 + T N + 2 2 2         i f   N   i s   e v e n

3. Results and Discussion

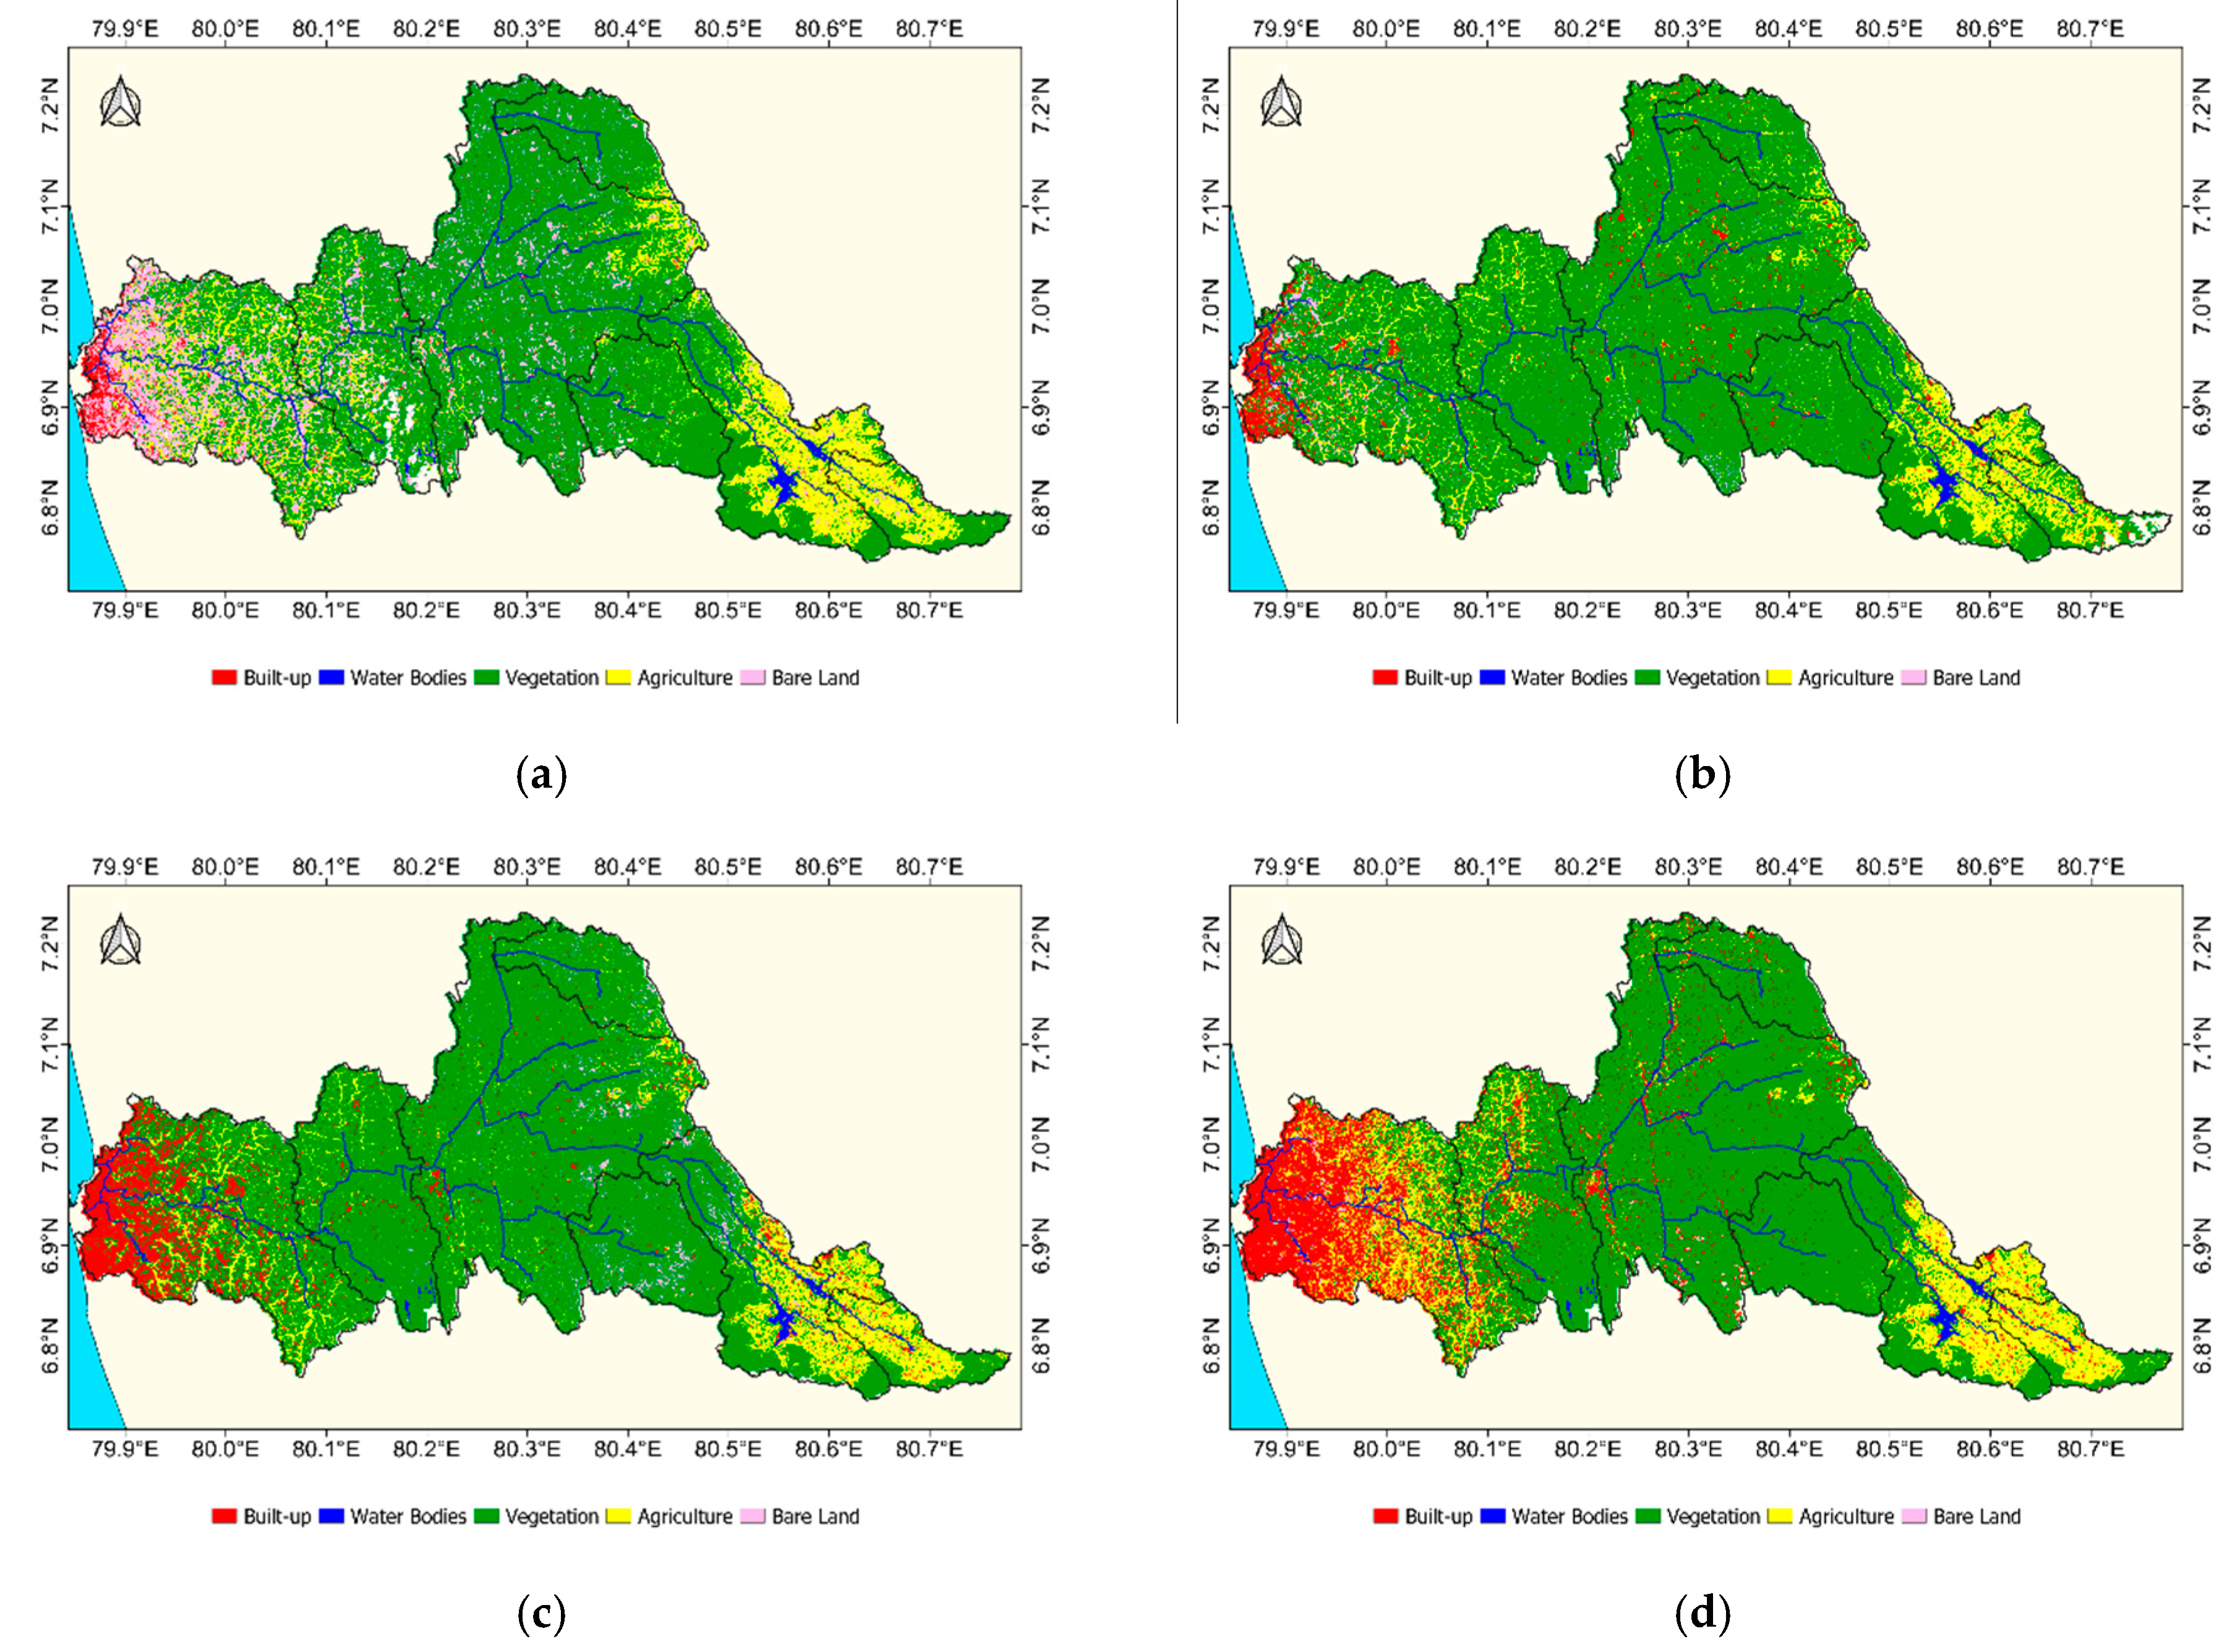
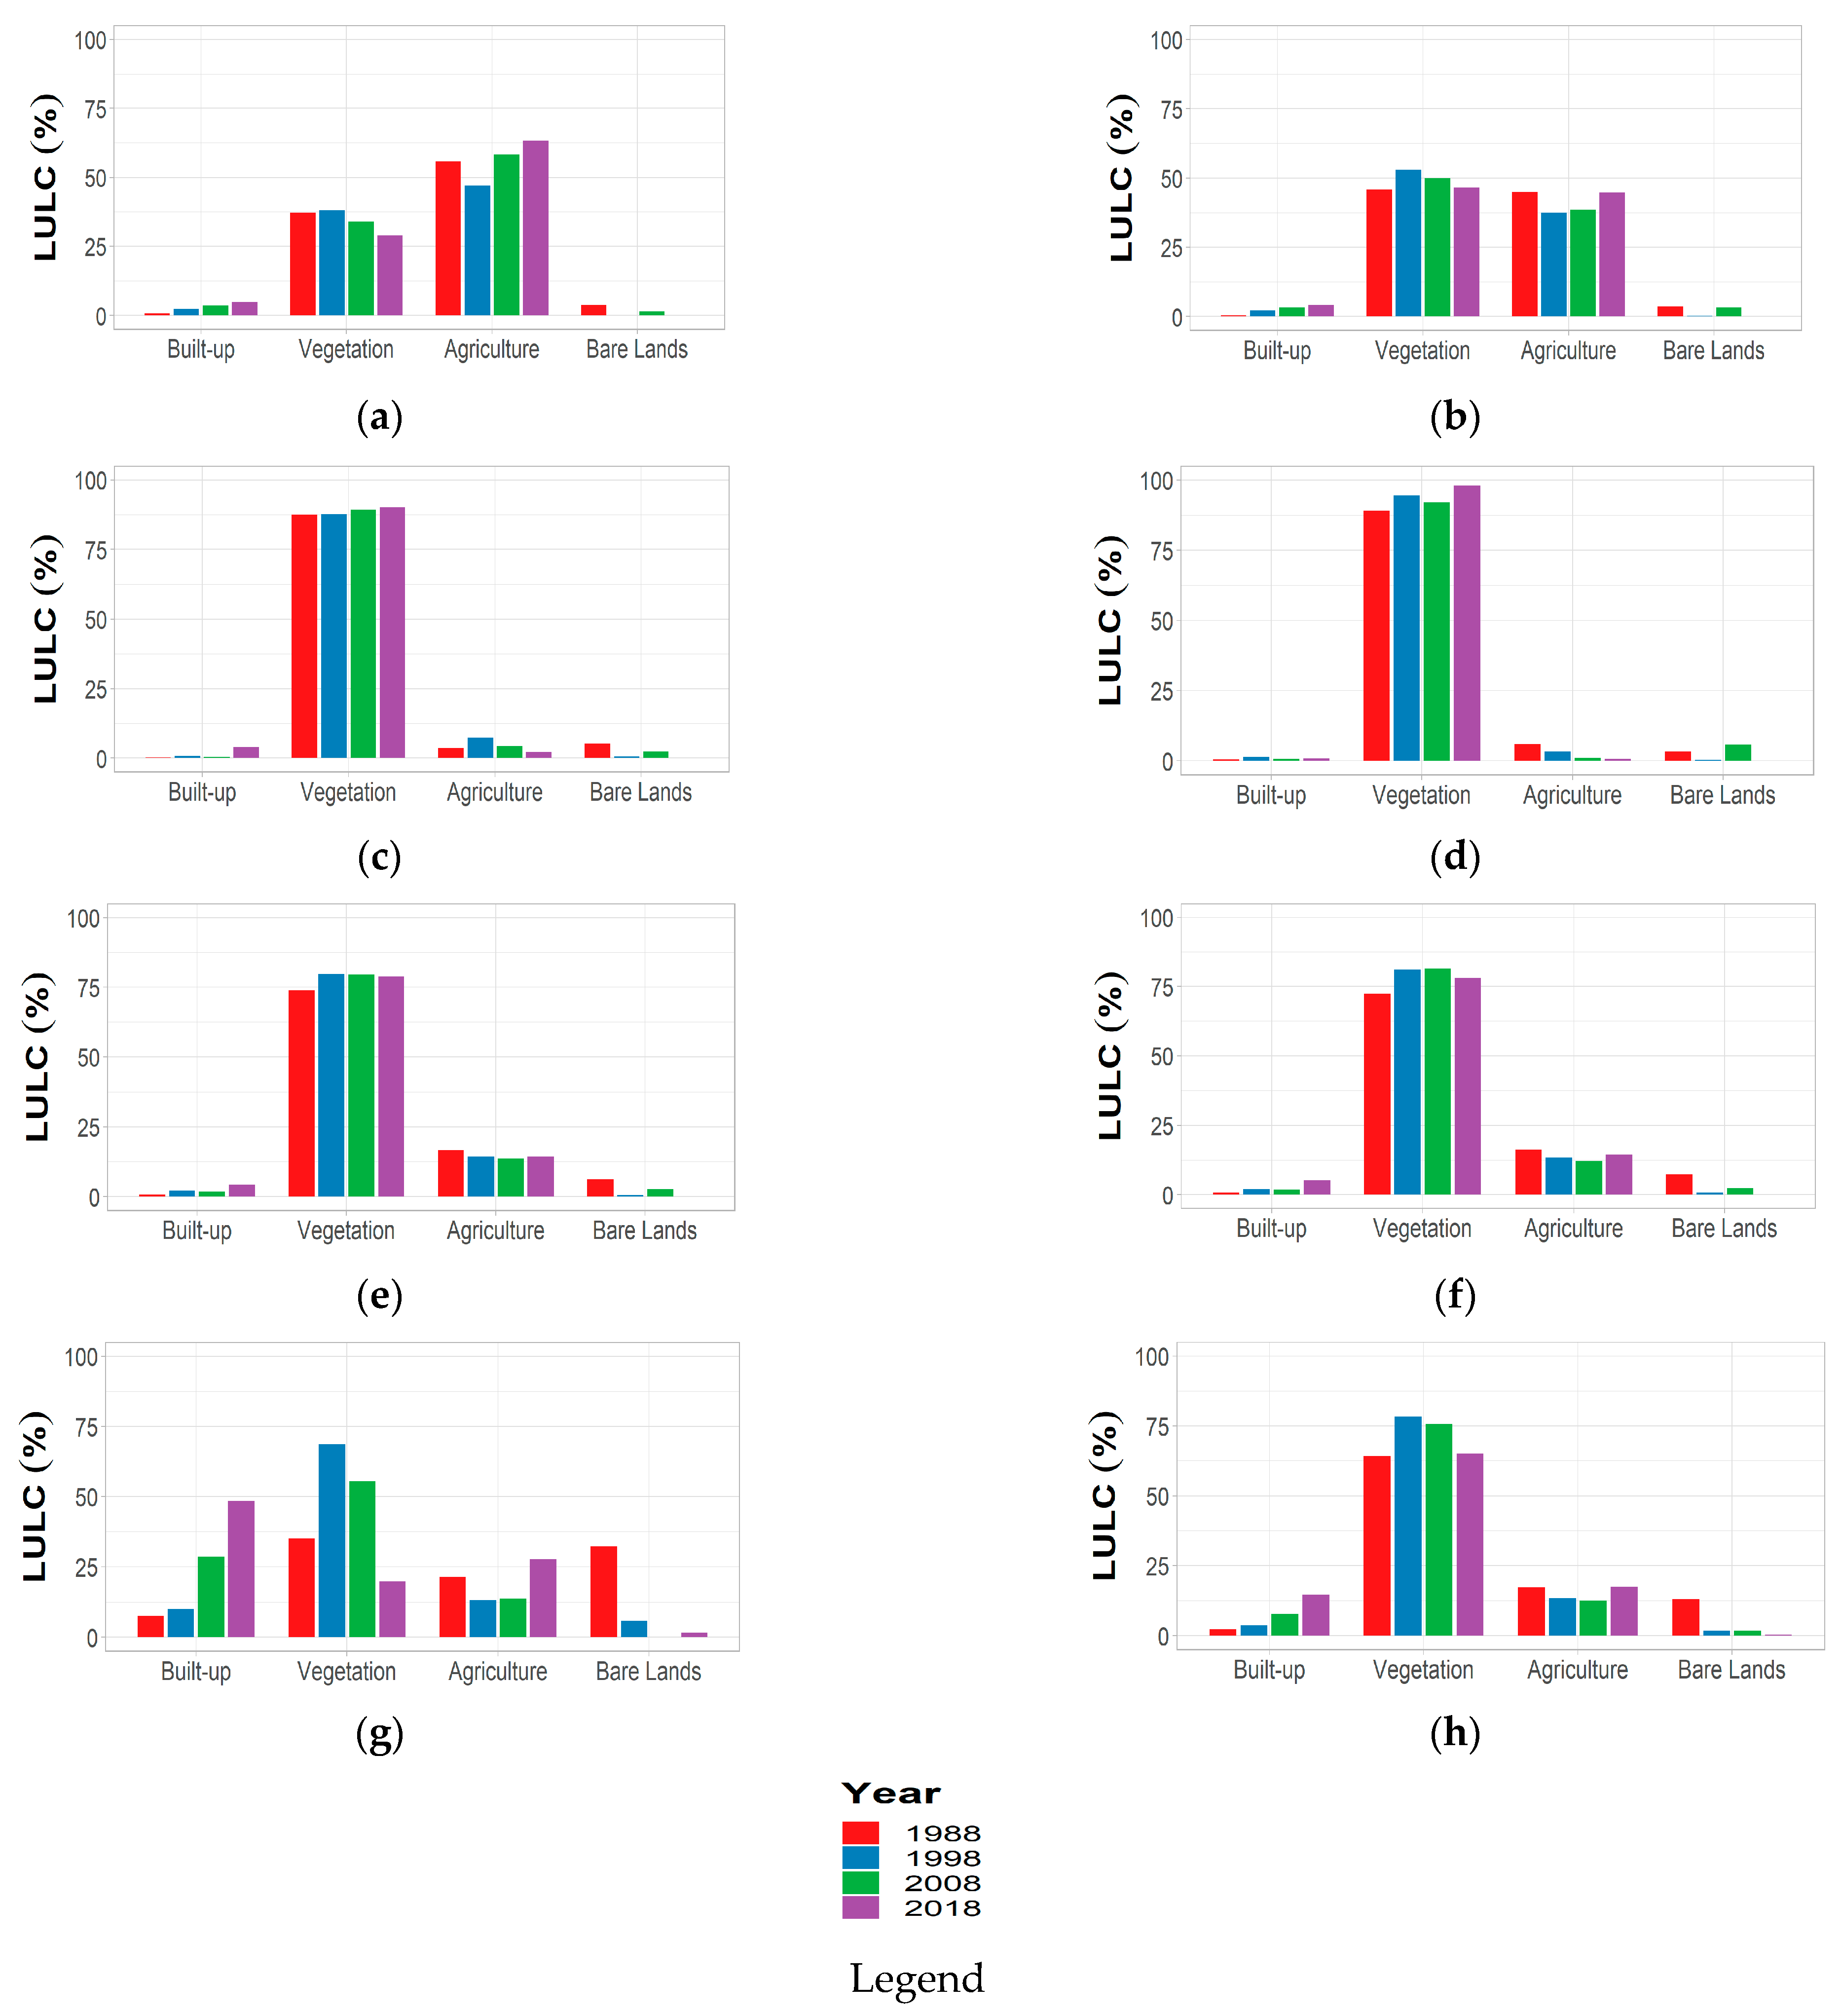
3.1. Land-use Land Cover Variation of the Kelani River Basin

The classified LULC classes from multiband Landsat images are shown in Figure 2 for the years 1988, 1998, 2008, and 2018. The expansion of built-up areas and rapid urbanization can be clearly visible in the lower Kelani River basin where a drastic development has occurred over the last three decades. The reddish patches verify these changes. In addition, the temporal variation clearly showcases the migration of built-up areas towards the upstream areas. The urbanization reached almost 1/5th to 1/4th of the catchment area (approximately). In addition, the booming of small reddish patches can be seen all over the catchment. Population increases and migrations to the capital of the country may have resulted the significant increase of built-up areas downstream.
Furthermore, the most upstream of the basin (Norwood) also shows an increase in agricultural areas in addition to the slight increase of built-up areas. Population increase over the years might have impacted more agricultural lands in the fertile soil upstream.
Figure 3 shows the variations in percentages of area for each LULC class in each year considered. Notably, vegetation areas, bare lands, and agricultural areas have been reduced over time in most of the subbasins, except vegetation areas in Holombuwa and Deraniyagala subbasins show some increase in areas (refer to Figure 3c,d). The main explanation of the depletion of vegetation, bare land, and cultivated areas is the expansion of built-up areas; this expansion in the lower Kelani subbasin is significant. A study by Subasinghe et al. [56] revealed that the population of Colombo suburbs (lower Kelani basin) has drastically increased over time, and it could be the main reason for the expansion of built-up areas. Moreover, the end of 30 years of civil war also might have contributed to the expansion of built-up areas.
Table 2 presents the above variations numerically with respect to the baseline years of 1988, 1998, and 2008. Built-up areas of all the subbasins increased over time. Overall consideration of LULC change in the Kelani River basin reveals that the vegetation layer depleted over the last three decades and the rate of depletion from 1998 to 2008 was 0.178%/year. However, this rate significantly increased to 0.74%/year from 2008 to 2018. Similarly, bare lands in the river basin have also drastically reduced or occupied by other land-use classes. Interestingly, the built-up areas increased from 1988 to 2018, and the rate of increase remains steady (2.9%/year). Additionally, a fluctuation in vegetation is also observed. Most of the upper subbasins receive more precipitation than the lower basin, but it was also observed that some areas faced a reduction in rainfall. The main cause of the depletion of the canopy cover was the cutting down of artificial Pinus forests for timber. However, this was not applicable to the lower Kelani subbasin, as it was heavily urbanized over the years.

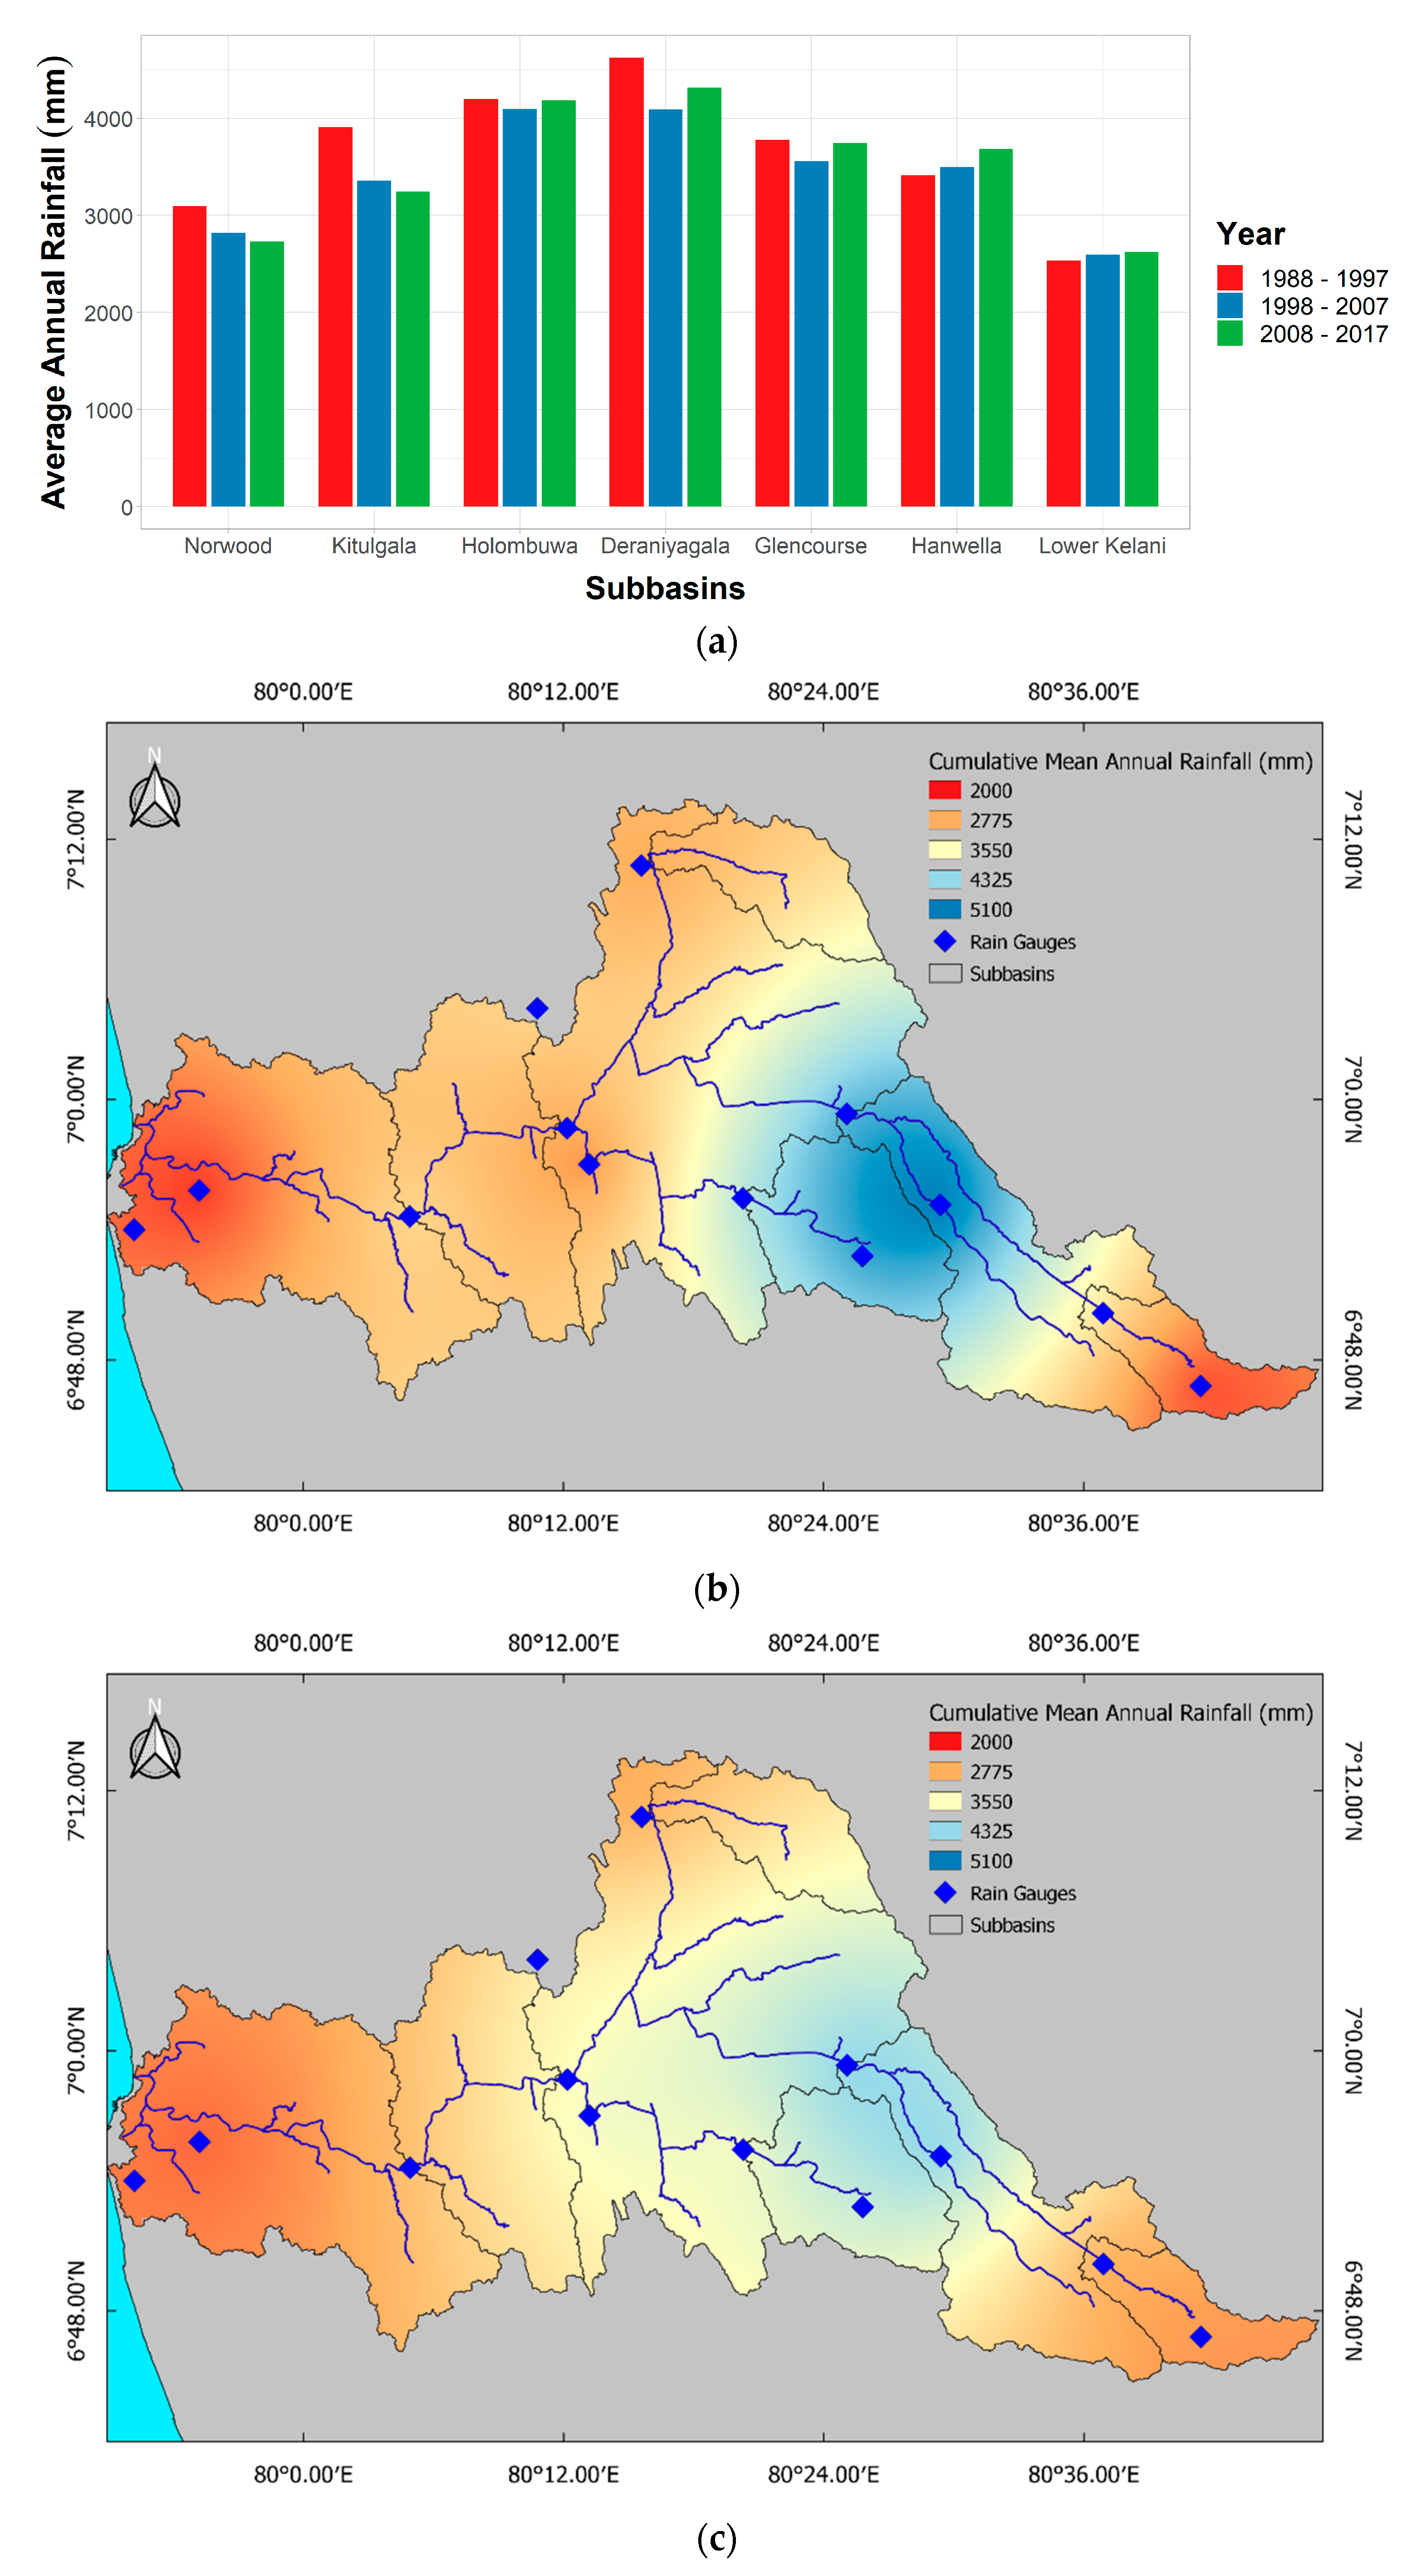
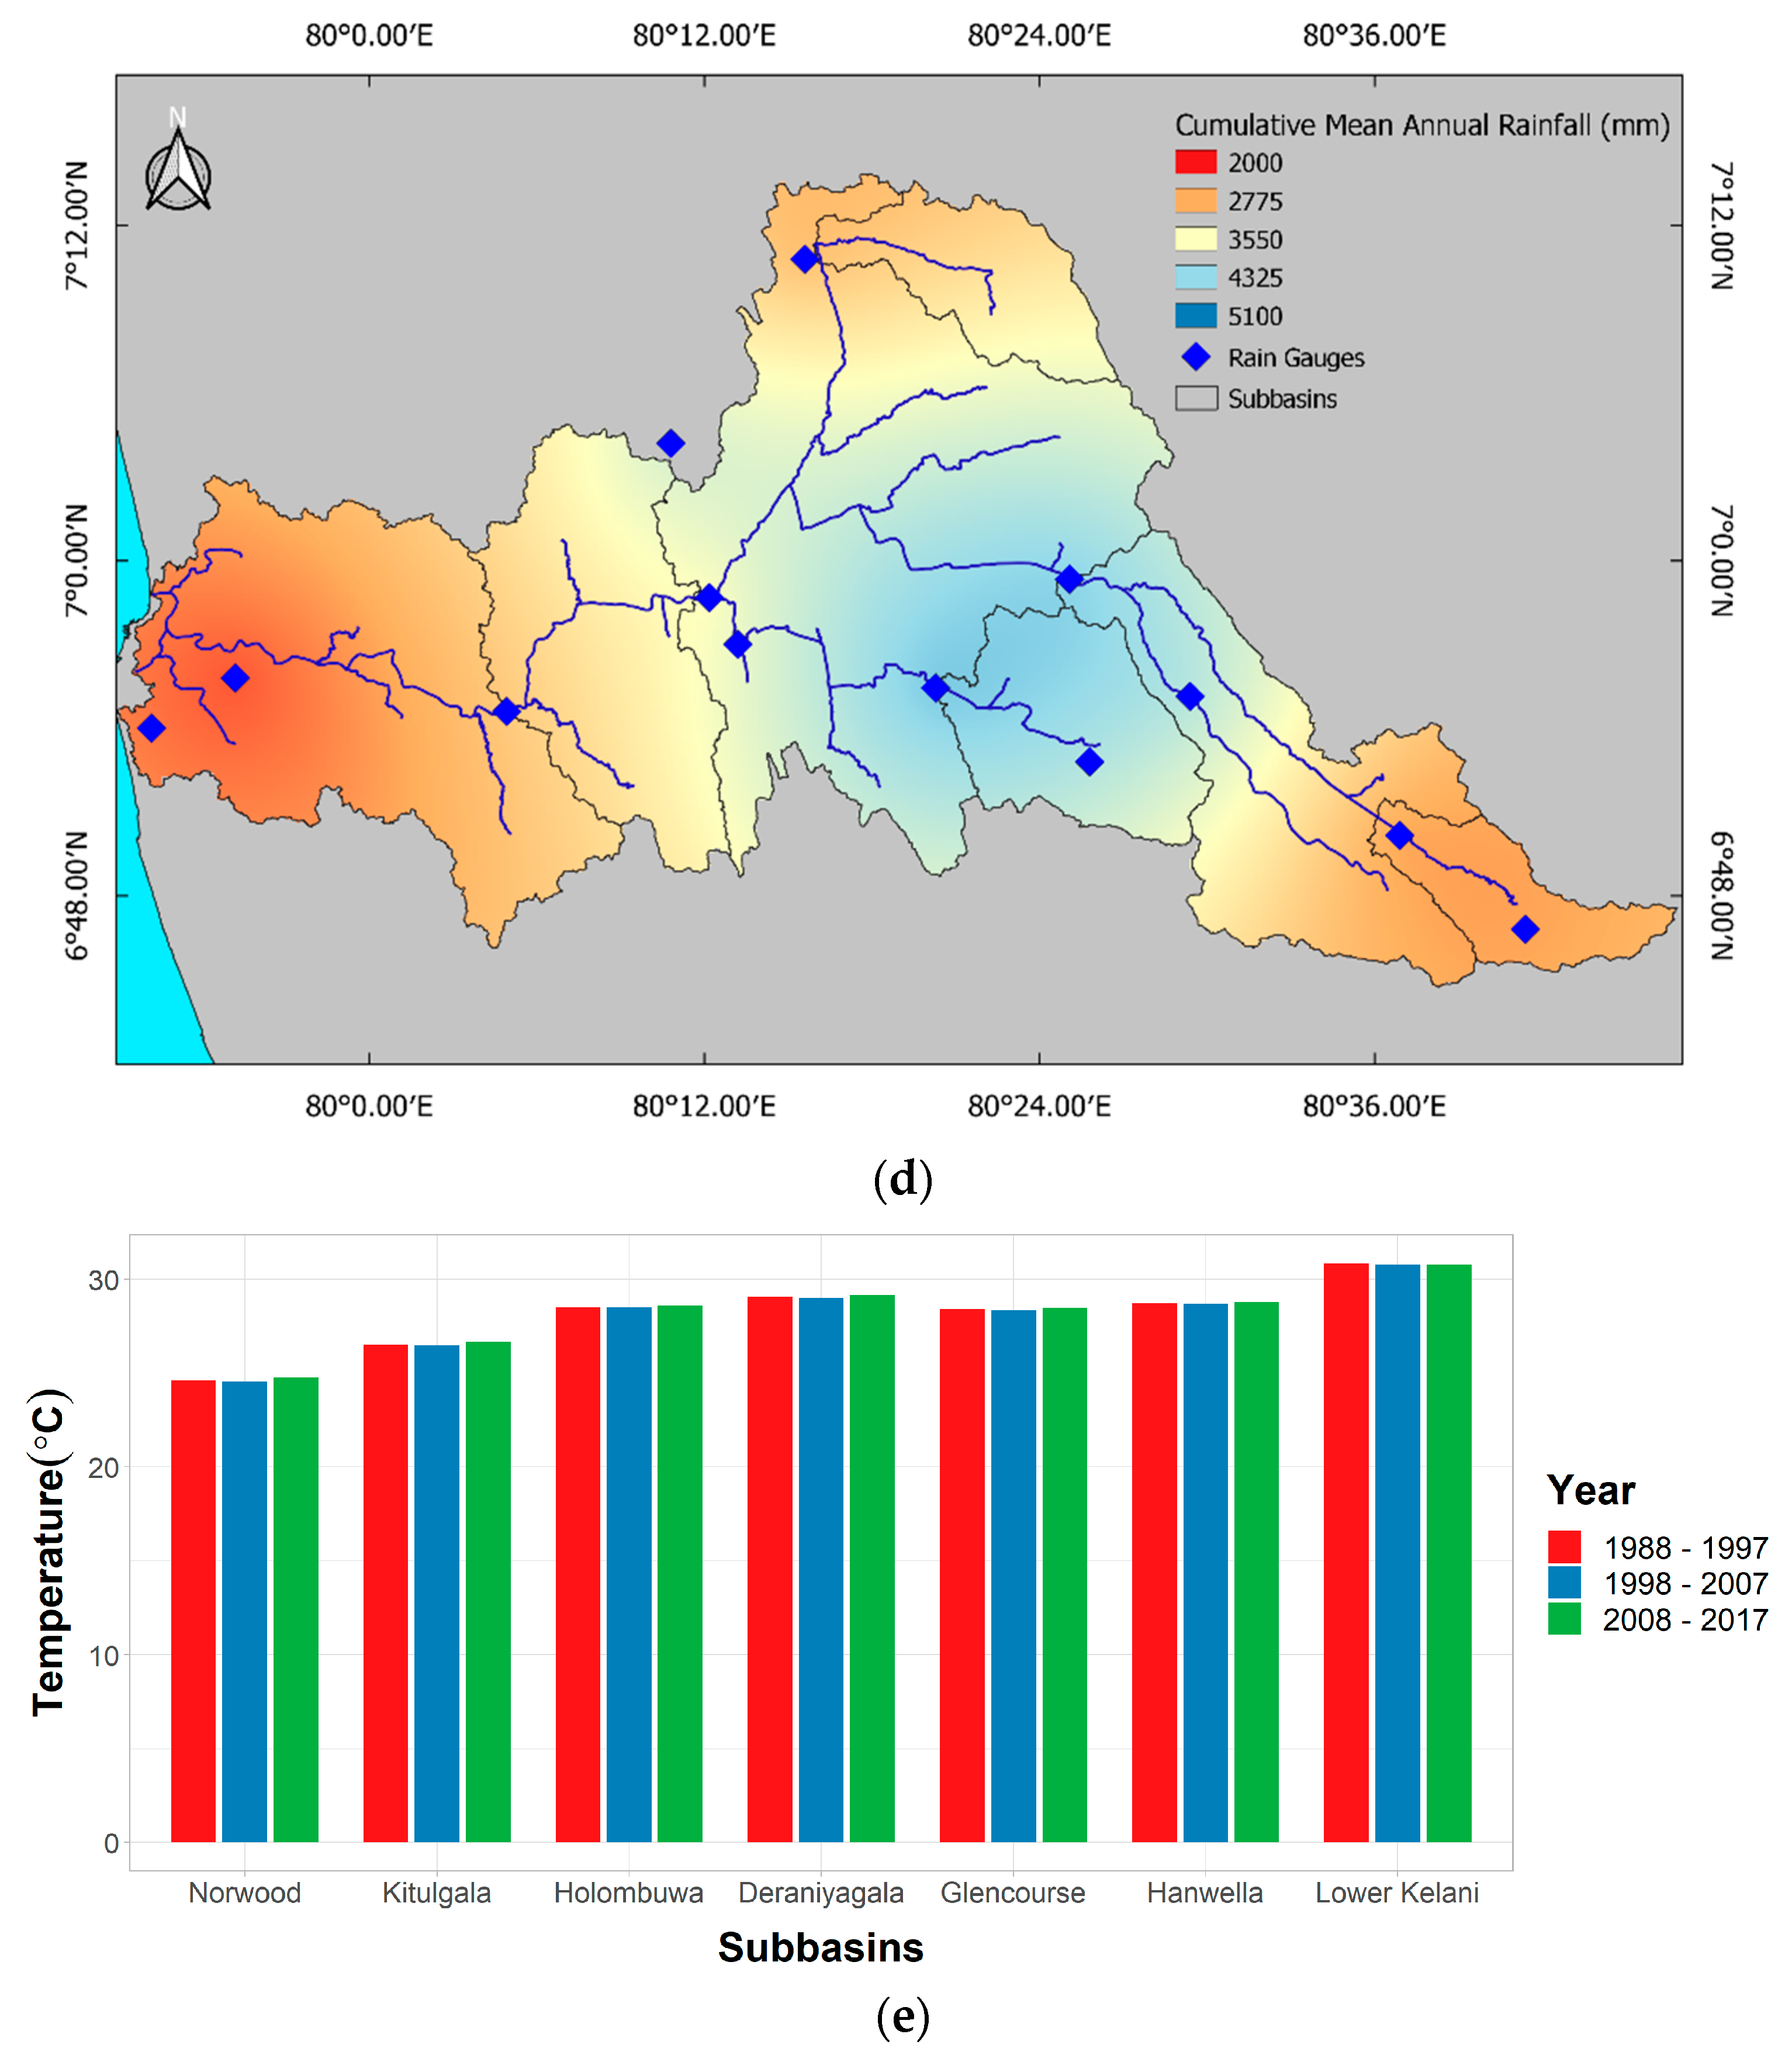
3.2. Hydro–Climatic Characteristics

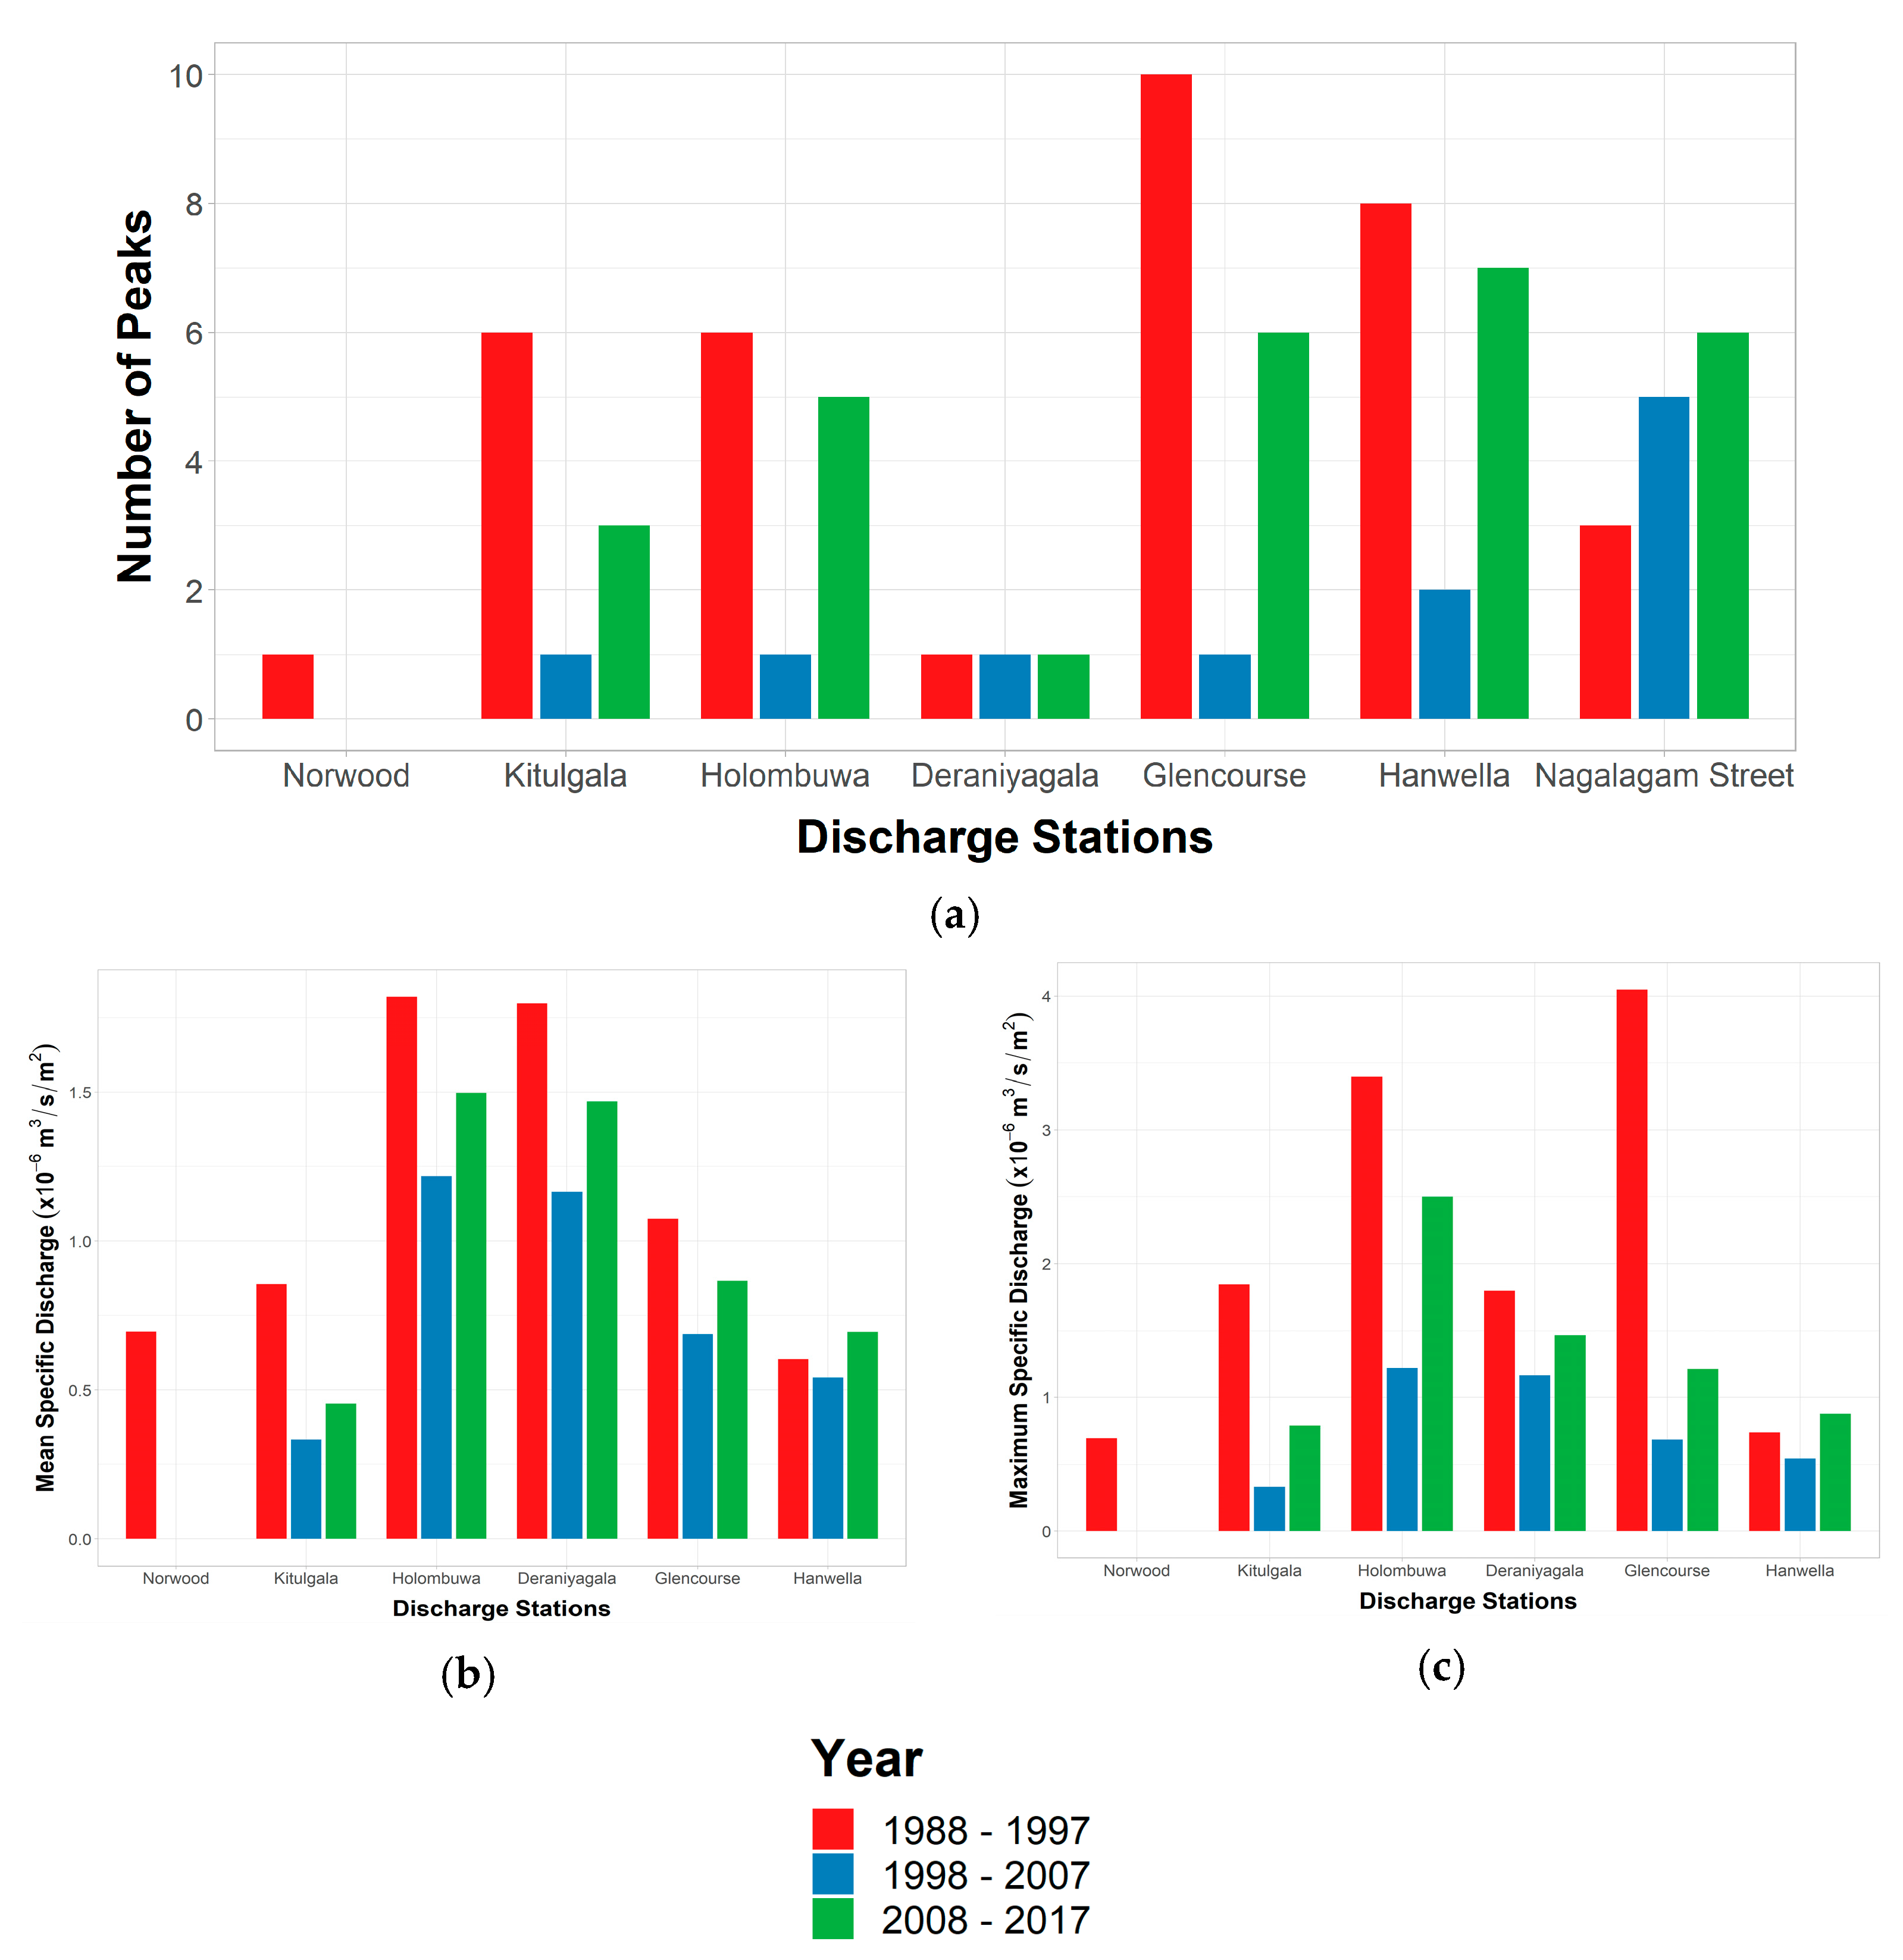
3.2.1. POT Analysis of Flood Characteristics

Figure 4 presents the results of the POT analysis. Based on POT analysis, the Norwood subbasin has faced the fewest floods over time (Figure 4a). The main cause for the above is its high elevation. Considering all the subbasins, the period from 1998 to 2007 can be considered the decade in which minimum floods occurred and the maximum occurrences were recorded from 1988–1998. Additionally, in the past two decades (1988–1997 and 2008–2017), the number of floods reduced in all the subbasins except the Lower Kelani subbasin (Figure 4a Nagalagam Street gauge), where flood occurrences were continuously increasing over last three decades. The possible reasons could be the recent development in the lower basin resulting in higher peaks and volume. The mean and maximum specific discharges of all the subbasins reduced over time except for the Hanwella subbasin. In other words, the magnitude of the floods from the other subbasins except Hanwella reduced over time. Thus, it indicates the amount of water coming from the floods is comparatively reduced.

3.2.2. Precipitation and Temperature Trend Analysis

The average annual decadal precipitation trends (refer to Figure 5a) show the precipitation of Norwood, Kithulgala, and Deraniyagala decreases over time. Additionally, Hanwella and Lower Kelani River basins show an increasing trend over the decades. Furthermore, the precipitation of Glencourse and Holombuwa remains almost unchanged. But the long-term precipitation trend analysis was conducted using Mann–Kendall and Sen’s slope estimator tests for each defined subbasin. None of the subbasins show positive or negative precipitation trends (p = 0.05) over the last 30 years except for the Kithulgala subbasin (−33.4 mm/year) (refer to Table 3). That further justifies the Kithulgala subbasin experience of a decrease in precipitation (refer to Figure 5a). Norwood also showcases a similar trend; however, it is not significant. Similarly, the spatial distribution of intensity of cumulative mean annual precipitation of Kelani River Basin decreased over time (see Figure 5b–d) and shifted to the centre. That further justified the statement of the Kithulgala subbasin has faced a reduction in rainfall. Norwood also showcases a similar trend; however, it is not significant.
Sri Lanka has a very limited number of temperature gauges. Therefore, the following comparison and estimations were conducted based on the temperature gauges located within and nearest to the KRB given in Figure 1. The results depicted in Figure 5e show that there were no significant changes in the temperature of each subbasin over the decades and remains unchanged. The average annual temperature varies from 24 °C in the upstream to 31 °C in the downstream of the basin.

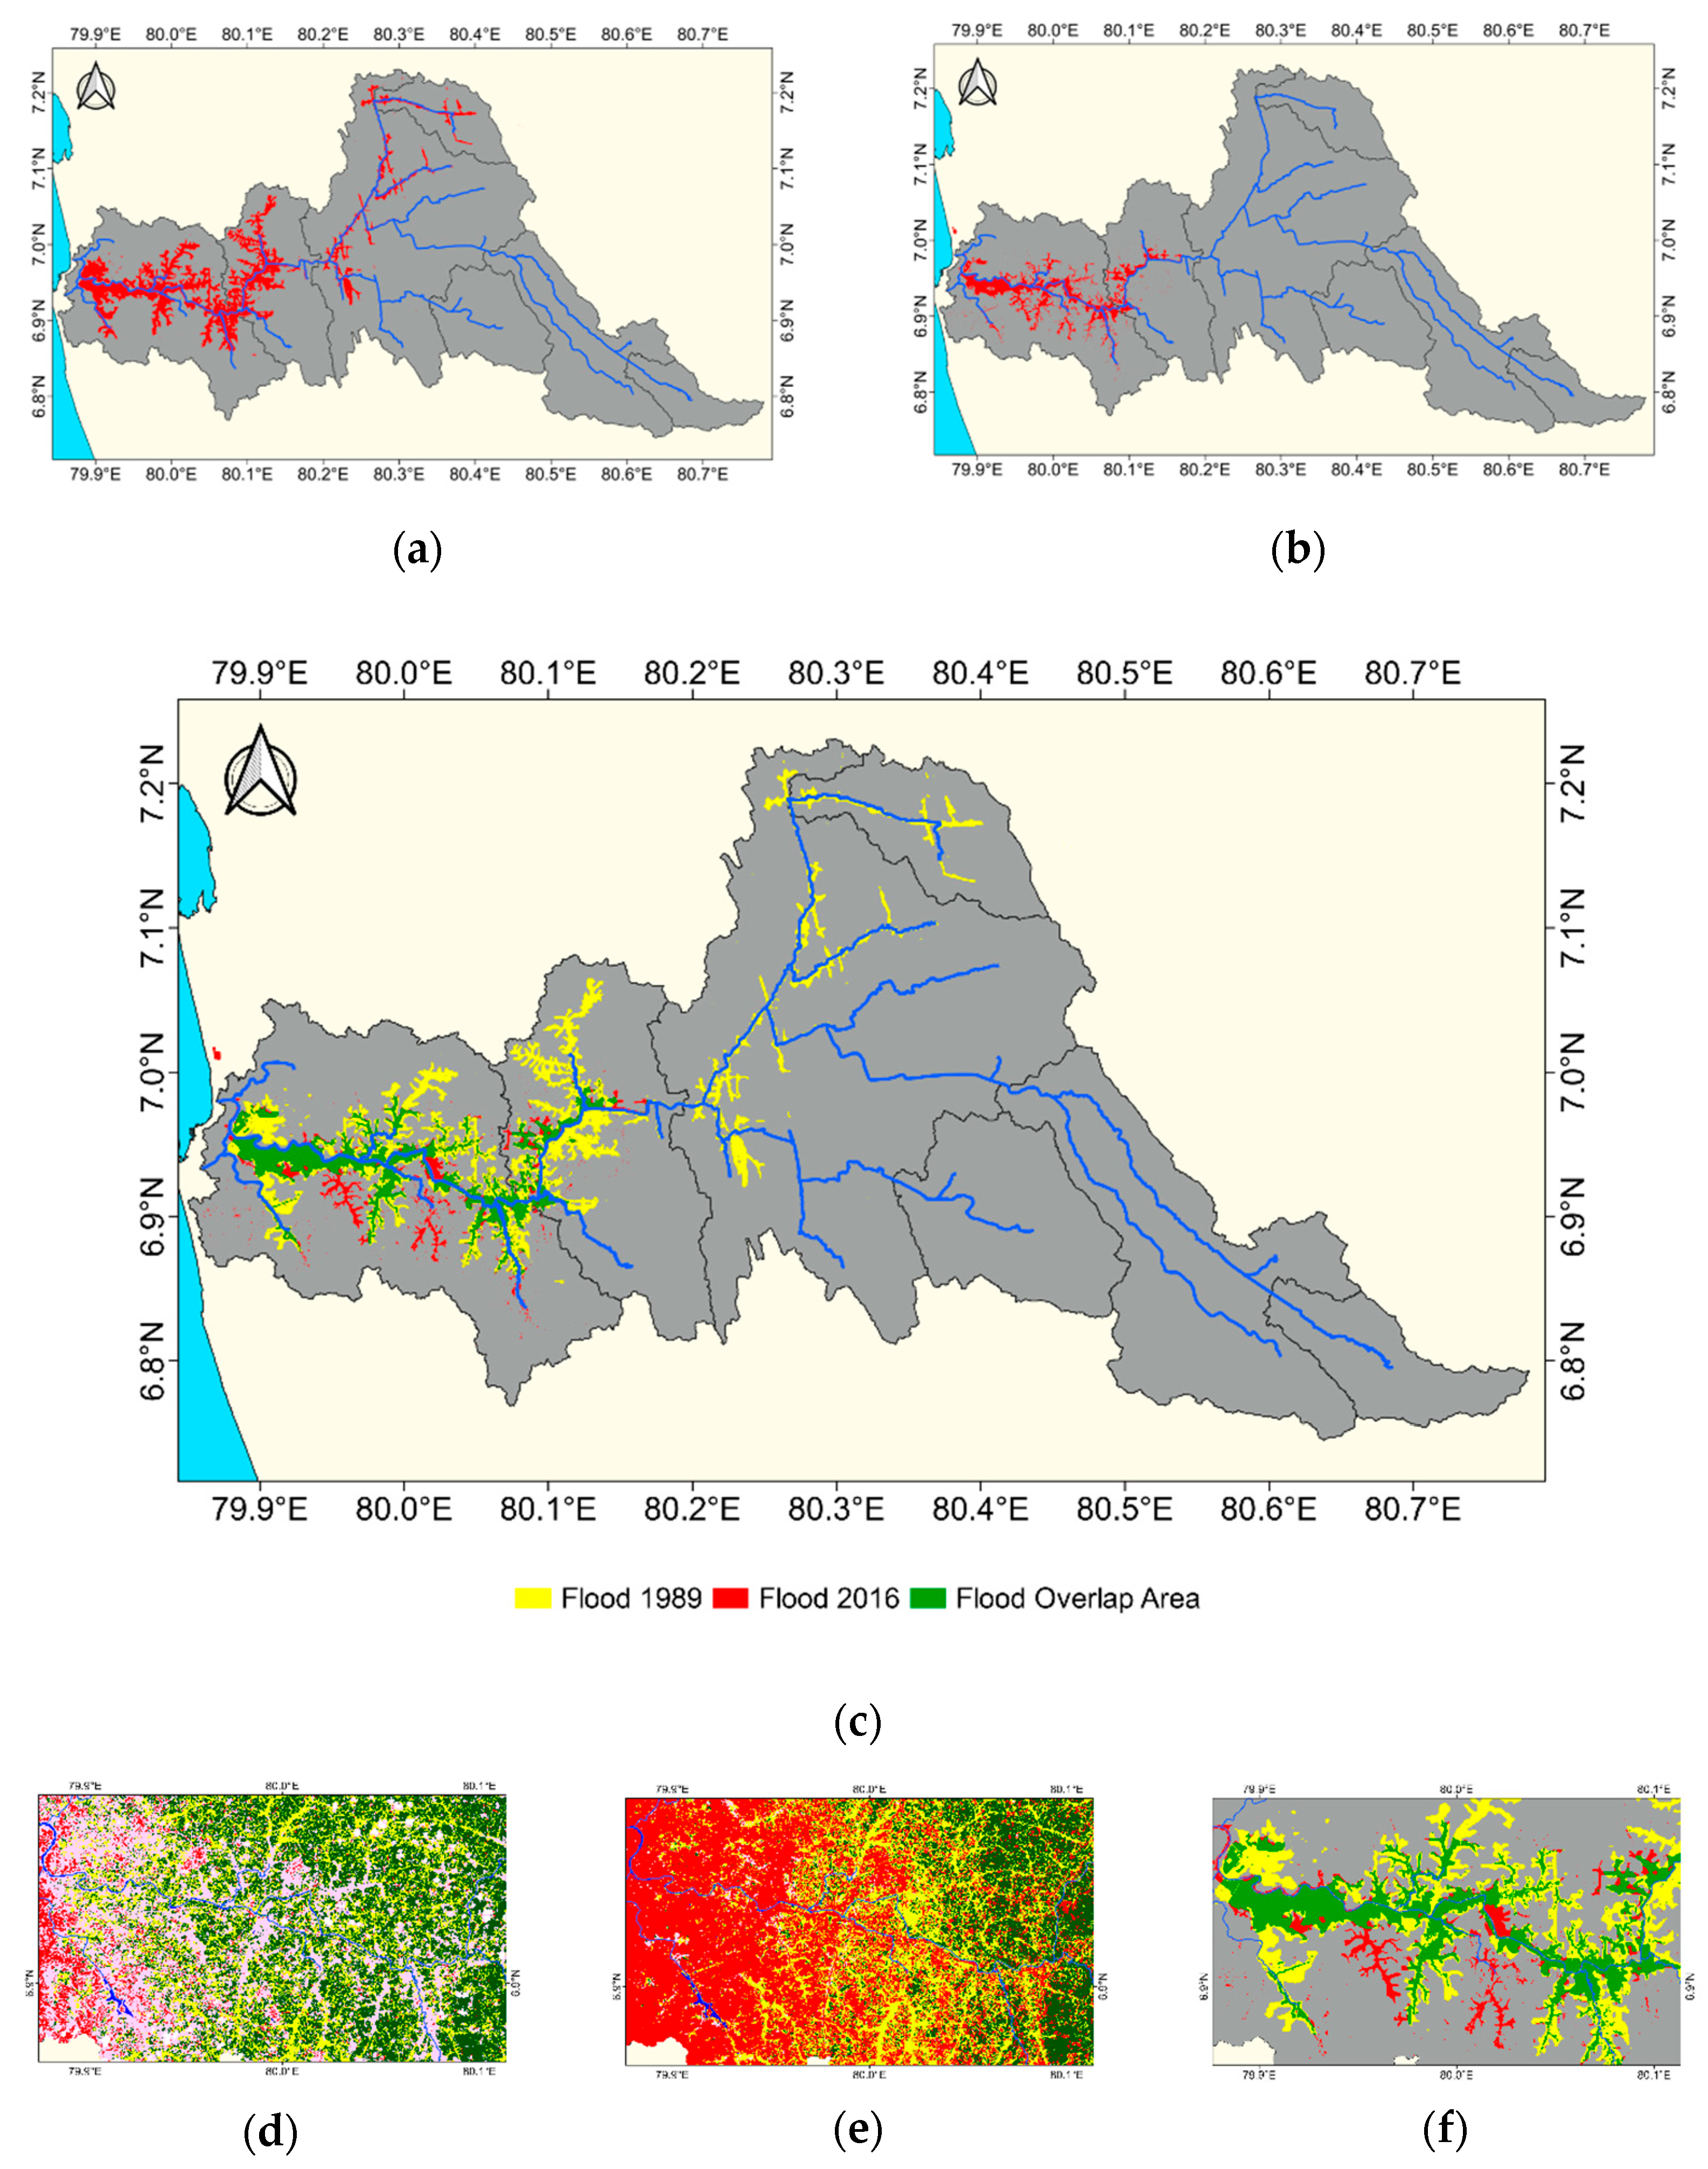
3.3. Comparison of Flood Inundation Areas Based on Historical Flood Events

According to written evidence, the Kelani River basin has faced severe floods since 1837. Floods that happened in the years 1947, 1989, and 2016 are considered the most destructive floods [47]. Therefore, comparisons for inundation areas of the lower Kelani Basin were conducted only for two historical flood events in 1989 and 2016 as they are within the study period. The flood magnitude comparison indicates that the two flood events are different from each other and the 1989 flood was more extreme than the 2016 flood (water levels of 2.74 m in 1989 and 2.27 m in 2016 at high flood levels).
Figure 6a,b clearly show the inundation areas for the 1989 and 2016 flood events. The reddish patches are for the inundation areas from the floods. It can be clearly observed that the 1989 flood had higher inundated areas compared to the flood in 2016. Approximately, 102.9 km2 and 69.7 km2 area were inundated during the flood events in 1989 and 2016, respectively. The overlaps of floods and the comparisons can be seen in Figure 6c.
However, the zoomed-in views in Figure 6d–f showcase the newly inundated areas in the flood event of 2016: the newly flooded areas in 2016 were barren lands in 1989. This can be understood from the LULC maps. Even though the 2016 flood had a smaller magnitude, it impacted many built-up areas. Therefore, the relationship between LULC changes to floods can be clearly understood. Dammalage and Jayasinghe [67] also stated that precipitation in the year 2016 was less than in 1989, which demonstrates that urbanization has a significant impact on floods.

3.4. Relationship between Flooding and Hydro-Climatic Characteristics and LULC in the Basin

The impacts of climatic characteristics and LULC on the flood characteristics (i.e., mean peak, maximum peak, and flood frequency (number of peaks)) were evaluated with a statistical approach that included determining the partial correlation coefficient ( ρ ) (refer to Table 4 and Figure 7). The partial correlation coefficient is useful for determining the relationship between two variables affected by the third variable [36]. In other words, if the third variable is removed, the relationship between the other two variables changes. Analysis reveals the precipitation has a moderate positive correlation ( ρ > 0.45 ) with the mean and maximum peaks of the Kithulgala and Deraniyagala subbasins. However, the flood frequency only shows a moderate positive correlation with the Kithulgala subbasins. That implies the increase in precipitation in Kithulgala and Deraniyagala subbasins can result in floods. Other than that, the correlations with the rest of the subbasins are minimal. The temperature and the flood characteristics do not have a defined relationship (low correlation coefficients, i.e., ρ < ± 0.25 ). Table 3 showcases the comprehensive list of partial correlation coefficients from the analysis.
As was earlier stated, precipitation has a high impact on floods. However, there is no significant contribution from the temperature of the subbasins (refer to Figure 7). Hollis [68] and Zhou et al. [33] stated that floods are enhanced with rapid urbanization. Therefore, LULC change was evaluated with changes in built-up areas over time. LULC and the flood characteristics of all the subbasins have a significant relationship (in terms of values). Except for the changes of LULC in Glencourse and Hanwella subbasins, all the other subbasins have a moderate to high negative correlation with mean and maximum peaks. Similarly, flood frequency and LULC change have a moderate to high negative correlation with Norwood, Kithulgala, Glencourse, and Hanwella subbasins. However, the lower Kelani subbasin shows a strong positive correlation for the flood frequency against LULC change. That implies the changes to the land use increased the floods in the Lower Kelani River basin from 1988 to 2017.

4. Summary and Conclusions

The current study evaluates the impact of climate change and changes in land use/land cover (LULC) on flood characteristics in the Kelani River basin, Sri Lanka. The peak over threshold (POT) method was employed for identifying the mean, maximum, and number of peaks in subbasins of the Kelani River basin. Additionally, the specific discharge was used for identifying the above flood characteristics as it removes the effect of the subbasin size. The long-term hydro-meteorological and climatic trends were assessed with non-parametric tests. The LULC maps were derived from Landsat satellite missions and classified under different land use classes, for the years 1988, 1998, 2008, and 2018. The conclusions of the present study can be summarized as follows:
  • LULC of the Kelani River basin reveals that the vegetation and bare land have depleted over time, and the built-up areas have grown rapidly.
  • The flood frequency of all the subbasins except the lower Kelani basin was reduced. Similarly, the mean and maximum flood peaks were also reduced in all the subbasins except for the Hanwella subbasin.
  • The long-term precipitation trend analysis reveals that the Kithulgala subbasin is undergoing a reduction in rainfall that is significant compared with other subbasins, but Norwood and Deraniyagala subbasins also showed a decreasing trend. However, Hanwella and lower Kelani basins are experiencing an increasing trend but are not significant.
  • The temperature does not have a significant increase or decrease over the decades in any of the subbasins.
  • The inundation comparisons for two extreme flood events with different magnitudes showed newly inundated areas in the Lower Kelani basin. That was a result of urban developments.
  • The meteorological characteristics and LULC of all subbasins with flood characteristics showed significant correlations.
The lower Kelani River Basin is frequently flooded during the southwestern monsoon (from May to September) of the year. The government of Sri Lanka has proposed a framework for identifying solutions for these floods as they cause severe socioeconomic losses. The conclusions of this research have clearly identified the reasons for these frequent floods, and therefore, the solution framework can be oriented on the basis of the findings of this research work. For instance, the conversion of barren land to built-up areas in the lower Kelani River Basin is significant. Some of these barren lands were temporary flood retention areas decades ago but are now converted into urban or built-up areas. Therefore, the flood water is expected to do more damage in these converted areas. These conclusions can be considered by the local authorities and the government in seeking a sustainable solution to the problem of floods in the lower Kelani River Basin.

Author Contributions

Conceptualization, J.T.S. and J.S.; methodology, J.T.S., R.K.M. and C.W.; software, J.T.S. and R.K.M.; validation, J.T.S. and J.S.; formal analysis, J.T.S., R.K.M. and C.W.; resources, M.B.G. and U.R.; data curation, J.T.S.; writing—original draft preparation, J.T.S.; writing—review and editing, J.S., F.Y.T., N.M. and U.R.; supervision, J.S. and U.R.; project administration, U.R.; funding acquisition, N.M. and U.R. All authors have read and agreed to the published version of the manuscript.

Funding

This research received no external funding.

Institutional Review Board Statement

Not applicable.

Informed Consent Statement

Not applicable.

Data Availability Statement

Data used in this research can be requested from the corresponding author for research purposes.

Acknowledgments

The authors would like to acknowledge the support received from the Sri Lanka Institute of Information Technology (SLIIT) to carry out this research work.

Conflicts of Interest

The authors declare no conflict of interest.

References

  1. Shen, G.; Hwang, S.N. Spatial–Temporal snapshots of global natural disaster impacts Revealed from EM-DAT for 1900–2015. Geomat. Nat. Hazards Risk 2019, 10, 912–934. [Google Scholar] [CrossRef] [Green Version]
  2. CRED. The Human Costs of Natural Disasters: A Global Perspective, Center for Research on the Epidemiology of Disasters; Université catholique de Louvain: Brussels, Belgium, 2015. [Google Scholar]
  3. Chowdhuri, I.; Pal, S.C.; Chakrabortty, R. Flood susceptibility mapping by ensemble evidential belief function and binomial logistic regression model on river basin of eastern India. Adv. Space Res. 2020, 65, 1466–1489. [Google Scholar] [CrossRef]
  4. Nofal, O.; van de Lindt, J. Understanding flood risk in the context of community resilience modeling for the built environment: Research needs and trends. Sustain. Resilient Infrastruct. 2020, 7, 171–187. [Google Scholar] [CrossRef]
  5. Shuka, K.; Ke, W.; Sohail Nazar, M.; Abubakar, G.; Shahtahamssebi, A. Impact of Hydrological Infrastructure Projects on Land Use/Cover and Socioeconomic Development in Arid Regions—Evidence from the Upper Atbara and Setit Dam Complex, Kassala, Eastern Sudan. Sustainability 2022, 14, 3422. [Google Scholar] [CrossRef]
  6. Ingle, K.; Chattopadhyay, S. A Place-based Approach to Assess the Vulnerability of Communities to Urban Floods: Case of Nagpur, India. Int. J. Disaster Risk Reduct. 2022, 75, 1–25. [Google Scholar] [CrossRef]
  7. Hemmati, M.; Kornhuber, K.; Kruczkiewicz, A. Enhanced urban adaptation efforts needed to counter rising extreme rainfall risks. NPJ Urban Sustain. 2022, 2, 1–5. [Google Scholar] [CrossRef]
  8. Sun, X.; Zhang, G.; Wang, J.; Li, C.; Wu, S.; Li, Y. Spatiotemporal variation of flash floods in the Hengduan Mountains region affected by rainfall properties and land use. Nat. Hazards 2021, 111, 465–488. [Google Scholar] [CrossRef]
  9. Janizadeh, S.; Pal, S.C.; Saha, A.; Chowdhuri, I.; Ahmadi, K.; Mirzaei, S.; Mosavi, A.H.; Tiefenbacher, J.P. Mapping the spatial and temporal variability of flood hazard affected by climate and land-use changes in the future. J. Environ. Manag. 2021, 298, 113551. [Google Scholar] [CrossRef]
  10. Costache, R.; Hong, H.; Wang, Y. Identification of torrential valleys using GIS and a novel hybrid integration of artificial intelligence, machine learning and bivariate statistics. Catena 2019, 183, 104179. [Google Scholar] [CrossRef]
  11. Verma, S.; Sharma, A.; Yadava, P.; Gupta, P.; Singh, J.; Payra, S. Rapid flash flood calamity in Chamoli, Uttarakhand region during Feb 2021: An analysis based on satellite data. Nat. Hazards 2022, 112, 1379–1393. [Google Scholar] [CrossRef]
  12. Zhang, Q.; Wang, Y. Distribution of hazard and risk caused by agricultural drought and flood and their correlations in summer monsoon–affected areas of China. Theor. Appl. Climatol. 2022, 149, 965–981. [Google Scholar] [CrossRef]
  13. Pörtner, H.-O.; Roberts, D.C.; Tignor, M.; Poloczanska, E.S.; Mintenbeck, K.; Alegría, A.; Craig, M.; Langsdorf, S.; Löschke, S.; Möller, V.; et al. (Eds.) IPCC, 2022: Climate Change 2022: Impacts, Adaptation, and Vulnerability; Contribution of Working Group II to the Sixth Assessment Report of the Intergovernmental Panel on Climate Change; Cambridge University Press: Cambridge, UK, 2022; in press. [Google Scholar]
  14. Shukla, P.R.; Skea, J.; Buendia, E.C.; Masson-Delmotte, V.; Pörtner, H.-O.; Roberts, D.C.; Zhai, P.; Slade, R.; Connors, S.; van Diemen, R. (Eds.) IPCC Summary for Policymakers. In Climate Change and Land: An IPCC Special Report on Climate Change, Desertification, Land Degradation, Sustainable Land Management, Food Security, and Greenhouse Gas Fluxes in Terrestrial Ecosystems; IPCC: Geneva, Switzerland, 2019. [Google Scholar]
  15. Takeshima, A.; Kim, H.; Shiogama, H.; Lierhammer, L.; Scinocca, J.F.; Seland, Ø.; Mitchell, D. Projected climate over the Greater Horn of Africa under 1.5 °C and 2 °C global warming. Environ. Res. Lett. 2018, 13, 1–11. [Google Scholar] [CrossRef]
  16. Wang, H.; Yang, T.; Chen, J.; Bell, S.M.; Wu, S.; Jiang, Y.; Huang, S. Effects of free-air temperature increase on grain yield and greenhouse gas emissions in a double rice cropping system. Field Crops Res. 2022, 281, 1–9. [Google Scholar] [CrossRef]
  17. IPCC Climate Change 2014: Synthesis Report. Contribution of Working Groups I, II and III to the Fifth Assessment Report of the In-tergovernmental Panel on Climate Change; Core Writing Team; Pachauri, R.K.; Meyer, L.A. (Eds.) IPCC: Geneva, Switzerland, 2014; p. 151. ISBN 9789291691432. [Google Scholar]
  18. Rapeli, M.; Mussalo-Rauhamaa, H. Intensive and residential elderly care services responding to heat wave–case Finland. Nord. Soc. Work Res. 2022, 1–12. [Google Scholar] [CrossRef]
  19. Wang, G.; Zhang, Q.; Luo, M.; Singh, V.; Xu, C. Fractional contribution of global warming and regional urbanization to intensifying regional heatwaves across Eurasia. Clim. Dyn. 2022, 59, 1521–1537. [Google Scholar] [CrossRef]
  20. Shukla, J.; Verma, M.; Misra, A. Effect of global warming on sea level rise: A modeling study. Ecol. Complex. 2017, 32, 99–110. [Google Scholar] [CrossRef]
  21. Galbraith, H.; Jones, R.; Park, R.; Clough, J.; Herrod-Julius, S.; Harrington, B.; Page, G. Global Climate Change and Sea Level Rise: Potential Losses of Intertidal Habitat for Shorebirds. Waterbirds 2002, 25, 173–183. [Google Scholar] [CrossRef]
  22. Meehl, G.A.; Washington, W.M.; Collins, W.D.; Arblaster, J.M.; Hu, A.; Buja, L.E.; Teng, H. How Much More Global Warming and Sea Level Rise? Science 2005, 307, 1769–1772. [Google Scholar] [CrossRef] [Green Version]
  23. Choudhury, A.; Haque, M.; Quadir, D. Consequences of global warming and sea level rise in Bangladesh. Mar. Geod. 1997, 20, 13–31. [Google Scholar] [CrossRef]
  24. Ashrafuzzaman, M.; Santos, F.; Dias, J.; Cerdà, A. Dynamics and Causes of Sea Level Rise in the Coastal Region of Southwest Bangladesh at Global, Regional, and Local Levels. J. Mar. Sci. Eng. 2022, 10, 779. [Google Scholar] [CrossRef]
  25. Khan, T.; Quadir, D.; Murty, T.; Kabir, A.; Aktar, F.; Sarker, M. Relative Sea Level Changes in Maldives and Vulnerability of Land Due to Abnormal Coastal Inundation. Mar. Geod. 2002, 25, 133–143. [Google Scholar] [CrossRef]
  26. Sakamoto, A.; Nishiya, K.; Guo, X.; Sugimoto, A.; Nagasaki, W.; Doi, K. Mitigating Impacts of Climate Change Induced Sea Level Rise by Infrastructure Development: Case of the Maldives. J. Disaster Res. 2022, 17, 327–334. [Google Scholar] [CrossRef]
  27. Merschroth, S.; Miatto, A.; Weyand, S.; Tanikawa, H.; Schebek, L. Lost Material Stock in Buildings due to Sea Level Rise from Global Warming: The Case of Fiji Islands. Sustainability 2020, 12, 834. [Google Scholar] [CrossRef] [Green Version]
  28. Igbal, M. The Economic Impact of Climate Change on the Agricultural System in Fiji. J. Agric. Sci. 2022, 14, 144–157. [Google Scholar] [CrossRef]
  29. Gopalakrishnan, T.; Kumar, L. Potential Impacts of Sea-Level Rise upon the Jaffna Peninsula, Sri Lanka: How Climate Change Can Adversely Affect the Coastal Zone. J. Coast. Res. 2020, 36, 951–960. [Google Scholar] [CrossRef]
  30. Yang, Y.; Park, J.; An, S.; Wang, B.; Luo, X. Mean sea surface temperature changes influence ENSO-related precipitation changes in the mid-latitudes. Nat. Commun. 2021, 12, 1–9. [Google Scholar] [CrossRef]
  31. Abhishek Kinouchi, T.; Sayama, T. A comprehensive assessment of water storage dynamics and hydroclimatic extremes in the Chao Phraya River Basin during 2002–2020. J. Hydrol. 2021, 603, 1–13. [Google Scholar] [CrossRef]
  32. Feng, B.; Zhang, Y.; Bourke, R. Urbanization impacts on flood risks based on urban growth data and coupled flood models. Nat. Hazards 2021, 106, 613–627. [Google Scholar] [CrossRef]
  33. Zhou, Q.; Leng, G.; Su, J.; Ren, Y. Comparison of urbanization and climate change impacts on urban flood volumes: Importance of urban planning and drainage adaptation. Sci. Total Environ. 2019, 658, 24–33. [Google Scholar] [CrossRef]
  34. Barros, D.F.; Petrere, M., Jr.; Lecours, V.; Butturi-Gomes, D.; Castello, L.; JudithIsa, V. Effects of deforestation and other environmental variables on floodplain fish catch in the Amazon. Fish. Res. 2020, 230, 105643. [Google Scholar] [CrossRef]
  35. Rogger, M.; Agnoletti, M.; Alaoui, A.; Bathurst, J.; Bodner, G.; Borga, M.; Chaplot, V.; Gallart, F.; Glatzel, G.; Hall, J.; et al. Land use change impacts on floods at the catchment scale: Challenges and opportunities for future research. Water Resour. Res. 2017, 53, 5209–5219. [Google Scholar] [CrossRef] [PubMed] [Green Version]
  36. Maleki, M.; Eslamian, S.; Mustafa, F.; Madadi, M. Flood Handbook, 1st ed.; CRC Press: Boca Raton, FL, USA, 2022. [Google Scholar]
  37. Miner, N.; Alipour, A. Bridge Damage, Repair Costs, and Fragilities for Inland Flood Events. J. Bridge Eng. 2022, 27, 1–13. [Google Scholar] [CrossRef]
  38. Zhang, N.; Alipour, A. Flood risk assessment and application of risk curves for design of mitigation strategies. Int. J. Crit. Infrastruct. Prot. 2022, 36, 1–11. [Google Scholar] [CrossRef]
  39. Li, M.; Zhang, T.; Tu, Y.; Ren, Z.; Xu, B. Monitoring Post-Flood Recovery of Croplands Using the Integrated Sentinel-1/2 Imagery in the Yangtze-Huai River Basin. Remote Sens. 2022, 14, 690. [Google Scholar] [CrossRef]
  40. Gourevitch, J.; Diehl, R.; Wemple, B.; Ricketts, T. Inequities in the distribution of flood risk under floodplain restoration and climate change scenarios. People Nat. 2022, 4, 415–427. [Google Scholar] [CrossRef]
  41. Maiwald, H.; Schwarz, J. Simulative flood damage modelling taking into account inundation level and flow velocity: Uncertainties and strategies for further refinement. WIT Trans. Built Environ. 2022, 208, 27–40. [Google Scholar] [CrossRef]
  42. Eckstein, D.; Künzel, V.; Schäfer, L.; Winges, M. Who Suffers Most from Extreme Weather Events? Weather-Related Loss Events in 2018 and 1999 to 2018; Germanwatch e.V.: Bonn, Germany, 2020; pp. 1–43. [Google Scholar]
  43. Herath, S.; Ratnayake, U. Monitoring rainfall trends to predict adverse impacts—A case study from Sri Lanka (1964–1993). Glob. Environ. Chang. 2004, 14, 71–79. [Google Scholar] [CrossRef]
  44. Randil, C.; Siriwardana, C.; Sandaruwan Rathnayaka, B. A statistical method for pre-estimating impacts from a disaster: A case study of floods in Kaduwela, Sri Lanka. Int. J. Disaster Risk Reduct. 2022, 76, 1–20. [Google Scholar] [CrossRef]
  45. Perera, C.; Nakamura, S. Improvement of socio-hydrological model to capture the dynamics of combined river and urban floods: A case study in Lower Kelani River Basin, Sri Lanka. Hydrol. Res. Lett. 2022, 16, 40–46. [Google Scholar] [CrossRef]
  46. De Silva, M.; Kawasaki, A. Modeling the association between socioeconomic features and risk of flood damage: A local-scale case study in Sri Lanka. Risk Anal. 2022, 1–13. [Google Scholar] [CrossRef]
  47. Manawadu, L.; Wijeratne, V. Anthropogenic drivers and impacts of urban flooding-A case study in Lower Kelani River Basin, Colombo Sri Lanka. Int. J. Disaster Risk Reduct. 2021, 57, 102076. [Google Scholar] [CrossRef]
  48. Milly, P.C.D.; Wetherald, R.T.; Dunne, K.; Delworth, T.L. Increasing risk of great floods in a changing climate. Nature 2002, 415, 514–517. [Google Scholar] [CrossRef] [PubMed]
  49. Van Aalst, M.K. The impacts of climate change on the risk of natural disasters. Disasters 2006, 30, 5–18. [Google Scholar] [CrossRef] [PubMed]
  50. Dissanayaka, K.D.C.R. Climate Extremes and Precipitation Trends in Kelani River Basin, Sri Lanka and Impact on Streamflow Variability under Climate Change (Master of Science); University of Moratuwa: Moratuwa, Sri Lanka, 2017. [Google Scholar]
  51. Maheng, D.; Ducton, I.; Lauwaet, D.; Zevenbergen, C.; Pathirana, A. The Sensitivity of Urban Heat Island to Urban Green Space—A Model-Based Study of City of Colombo, Sri Lanka. Atmosphere 2019, 10, 151. [Google Scholar] [CrossRef] [Green Version]
  52. De Silva, G.; Weerakoon, S.; Herath, S. Event Based Flood Inundation Mapping Under the Impact of Climate Change: A Case Study in Lower Kelani River Basin, Sri Lanka. Hydrol. Curr. Res. 2016, 7, 1–4. [Google Scholar] [CrossRef] [Green Version]
  53. Congedo, L. Semi-Automatic Classification Plugin: A Python tool for the download and processing of remote sensing images in QGIS. J. Open Source Softw. 2021, 6, 3172. [Google Scholar] [CrossRef]
  54. Makumbura, R.; Samarasinghe, J.; Rathnayake, U. Multidecadal Land Use Patterns and Land Surface Temperature Variation in Sri Lanka. Appl. Environ. Soil Sci. 2022, 2022, 1–11. [Google Scholar] [CrossRef]
  55. Irannezhad, M.; Minaei, M.; Ahmadian, S.; Chen, D. Impacts of changes in climate and land cover-land use on flood characteristics in Gorganrood Watershed (Northeastern Iran) during recent decades. Geogr. Ann. Ser. A Phys. Geogr. 2018, 100, 340–350. [Google Scholar] [CrossRef]
  56. Subasinghe, S.; Estoque, R.; Murayama, Y. Spatiotemporal Analysis of Urban Growth Using GIS and Remote Sensing: A Case Study of the Colombo Metropolitan Area, Sri Lanka. ISPRS Int. J. Geo-Inf. 2016, 5, 197. [Google Scholar] [CrossRef] [Green Version]
  57. Willems, P. A time series tool to support the multi-criteria performance evaluation of rainfall-runoff models. Environ. Model. Softw. 2009, 24, 311–321. [Google Scholar] [CrossRef]
  58. Samarasinghe, J.T.; Gunathilake, M.B.; Makubura, R.K.; Arachchi, S.M.; Rathnayake, U. Impact of Climate Change and Variability on Spatiotemporal Variation of Forest Cover; World Heritage Sinharaja Rainforest, Sri Lanka. For. Soc. 2022, 6, 355–377. [Google Scholar] [CrossRef]
  59. Sirisena, D.; Suriyagoda, L.D. Toward sustainable phosphorus management in Sri Lankan rice and vegetable-based cropping systems: A review. Agric. Nat. Resour. 2018, 52, 9–15. [Google Scholar] [CrossRef]
  60. De Silva, R.; Dayawansa, N.; Ratnasiri, M. A comparison of methods used in estimating missing rainfall data. J. Agric. Sci. 2007, 3, 101–108. [Google Scholar] [CrossRef]
  61. Haylock, M.; Hofstra, N.; Klein Tank, A.; Klok, E.; Jones, P.; New, M. A European daily high-resolution gridded data set of surface temperature and precipitation for 1950–2006. J. Geophys. Res. 2008, 113, 1–12. [Google Scholar] [CrossRef] [Green Version]
  62. Mann, H. Nonparametric Tests Against Trend. Econometrica 1945, 13, 245. [Google Scholar] [CrossRef]
  63. Sen, P. Estimates of the Regression Coefficient Based on Kendall’s Tau. J. Am. Stat. Assoc. 1968, 63, 1379–1389. [Google Scholar] [CrossRef]
  64. Hirsch, R.; Slack, J. A Nonparametric Trend Test for Seasonal Data With Serial Dependence. Water Resour. Res. 1984, 20, 727–732. [Google Scholar] [CrossRef] [Green Version]
  65. Khaniya, B.; Jayanayaka, I.; Jayasanka, P.; Rathnayake, U. Rainfall Trend Analysis in Uma Oya Basin, Sri Lanka, and Future Water Scarcity Problems in Perspective of Climate Variability. Adv. Meteorol. 2019, 2019, 1–10. [Google Scholar] [CrossRef] [Green Version]
  66. Rathnayake, U. Comparison of Statistical Methods to Graphical Methods in Rainfall Trend Analysis: Case Studies from Tropical Catchments. Adv. Meteorol. 2019, 2019, 1–10. [Google Scholar] [CrossRef] [Green Version]
  67. Dammalage, T.; Jayasinghe, N. Land-use change and its impact on urban flooding: A case study on Colombo district flood on May 2016. Eng. Technol. Appl. Sci. Res. 2019, 9, 3887–3891. [Google Scholar] [CrossRef]
  68. Hollis, G. The effect of urbanization on floods of different recurrence interval. Water Resour. Res. 1975, 11, 431–435. [Google Scholar] [CrossRef]
Figure 1. Catchment map of Kelani River Basin (KRB) and the locations of Hydro-Metrological stations.
Hydrology 09 00177 g001
Figure 2. Land-use land cover maps of Kelani River Basin: (a) for 1988; (b) for 1998; (c) for 2008; (d) for 2018.
Hydrology 09 00177 g002
Figure 3. Percentage area of each LULC: (a) Norwood subbasin; (b) Kithulgala subbasin; (c) Holombuwa subbasin; (d) Deraniyagala subbasin; (e) Glencourse subbasin; (f) Hanwella subbasin; (g) Lower Kelani subbasin; (h) entire Kelani basin.
Hydrology 09 00177 g003
Figure 4. Results of the POT analysis: (a) Number of peaks recorded in each subbasin; (b) Mean specific discharge; (c) Maximum specific discharge.
Hydrology 09 00177 g004
Figure 5. Average annual climatic variables of subbasins: (a) rainfall; (b) spatial distribution of rainfall 1988–1997; (c) spatial distribution of rainfall 1998–2007; (d) spatial distribution of rainfall 2008–2017; (e) temperature.
Hydrology 09 00177 g005aHydrology 09 00177 g005b
Figure 6. Historical flood inundations of Kelani River Basin: (a) For 1989 flood; (b) for 2016 flood; (c) comparison of inundated areas from two floods; (d) 1989 LULC; (e) 2016 LULC; (f) flooded area comparison.
Hydrology 09 00177 g006
Figure 7. Hydro-Metrological and LULC correlation with each subbasin.
Hydrology 09 00177 g007
Table 1. Details of Hydro-Metrological stations.
Station NameLatitude (Degree)Longitude
(Degree)
Data Period Precipitation Data
Availability
Temperature Data
Availability
Discharge/Stage Data Availability
Champion6.7880.691988–1989YesNoNo
Norwood6.83680.6151988–2017YesNoYes
Laxapana6.91980.491988–2017YesNoYes
Maliboda6.8880.431988–2017YesNoNo
Deraniyagala6.92480.3381988–2017YesNoYes
Kithulgala6.98980.4181988–2017YesNoYes
Holombuwa7.1880.261988–2017YesNoYes
Chesterford7.0780.181994–2015YesNoNo
Avissawella6.9580.221988–2011YesNoNo
Glencourse6.97880.2031988–2017YesNoYes
Hanwella6.9180.0821988–2017YesNoYes
Angoda6.9379.921994–2011YesNoNo
Colombo6.9179.881988–2017YesYesNo
Nagalagam Street6.9679.881988–2017NoNoYes
Katunayake7.1779.881990–2017NoYesNo
Katugastota7.3380.631990–2017NoYesNo
Nuwara Eliya6.9780.771990–2017NoYesNo
Ratnapura6.6880.41990–2017 NoYesNo
Table 2. LULC changes in each subbasin with respect to the base year 1988, 1998 and 2008.
SubbasinPeriodBuilt-Up
(Δ%)
Vegetation (Δ%)Agriculture (Δ%)Bare Lands (Δ%)
Norwood1988–199858.61.2−8.3−97.5
1998–200818.6−5.710.693.5
2008–201815.8−8.04.1−100.0
Kithulgala1988–199858.17.2−9.1−85.9
1998–200821.4−3.01.484.2
2008–20189.2−3.57.5−100.0
Holombuwa1988–199860.10.133.7−76.4
1998–2008−27.10.9−25.455.6
2008–201877.70.5−29.5−100.0
Deraniyagala1988–199840.33.0−29.5−83.0
1998–2008−34.9−1.4−50.489.9
2008–201816.33.1−23.8−99.9
Glencourse1988–199852.43.8−7.4−83.2
1998–2008−8.1−0.2−2.865.4
2008–201838.8−0.42.9−98.9
Hanwella1988–199843.95.7−10.0−84.5
1998–2008−3.30.1−4.256.6
2008–201846.7−2.18.6−98.4
Lower Kelani1988–199813.332.3−24.1−69.2
1998–200848.3−10.61.7−99.9
2008–201825.6−47.234.299.8
Entire Kelani River Basin1988–199824.210.0−13.5−75.7
1998–200834.9−1.8−2.9−0.6
2008–201830.7−7.416.4−64.5
Note: (−) loss, (+) gain
Table 3. Precipitation trends.
SubbasinAnnual ScaleSignificant (S)/Insignificant (IS)Monthly (Summary)Significant (S)/Insignificant (IS)
Norwood−15.8IS−0.1IS
Kithulgala−33.4S−0.2IS
Holombuwa−4.9IS0.0IS
Deraniayagala−12.1IS−0.1IS
Glencourse0IS0.0IS
Hanwella8.4IS0.1IS
N Street5.4IS0.0IS
Table 4. Correlation coefficients of climatic factors and LULC for subbasins.
Subbasin NamePrecipitation and Mean PeakPrecipitation and Maximum PeakPrecipitation and FrequencyTemperature and Maximum PeakTemperature and Mean PeakTemperature and FrequencyLULC and Mean PeakLULC and Maximum PeakLULC and Frequency
Norwood0.270.270.27−0.05−0.05−0.05−0.82−0.82−0.82
Kithulgala0.510.50.470.160.140.19−0.6−0.55−0.46
Holombuwa0.080.090.1−0.13−0.15−0.11−0.53−0.42−0.22
Deraniyagala0.450.45−0.140.190.19−0.1−0.45−0.450.29
Glencourse0.170.160.240.20.20.110.620.66−0.44
Hanwella0.180.14−0.10.180.190.060.50.33−0.63
Lower Kelani−0.04−0.040.070.250.25−0.27−0.55−0.540.93
Publisher’s Note: MDPI stays neutral with regard to jurisdictional claims in published maps and institutional affiliations.

