
Urban WEF Nexus: An Approach for the Use of Internal Resources under Climate Change

 ,
, 
Abstract
1. Introduction
2. Materials and Methods
2.1. WEF Nexus
2.1.1. The Relations among Water, Energy and Food Security
- In the millennium development goals, water security is defined as access to healthy and fresh water, both of which have recently become a human right while access to water for the other human uses and ecosystems, is highly significant from view point of communications, despite the fact that a major part of the conceptualization of water security is unavailable [26].
- Energy security is defined as access to clean, reliable and economical services for making food, heating, illumination, communications and production purposes. It is also meant as physical access, with respect to economical environmental concerns [27].
- Based on the FAOʹs definition, food supply is defined as access to sufficient and healthy food for the fulfillment of food needs and the regulation of food for an active and healthy life. Furthermore, proper food is defined as a human right [28].
2.1.2. The Interactions between Water, Energy and Food Security
2.2. Climate Change
Downscaling with the LARS-WG Model
2.3. NETWAT Software
2.4. CROPWAT Software
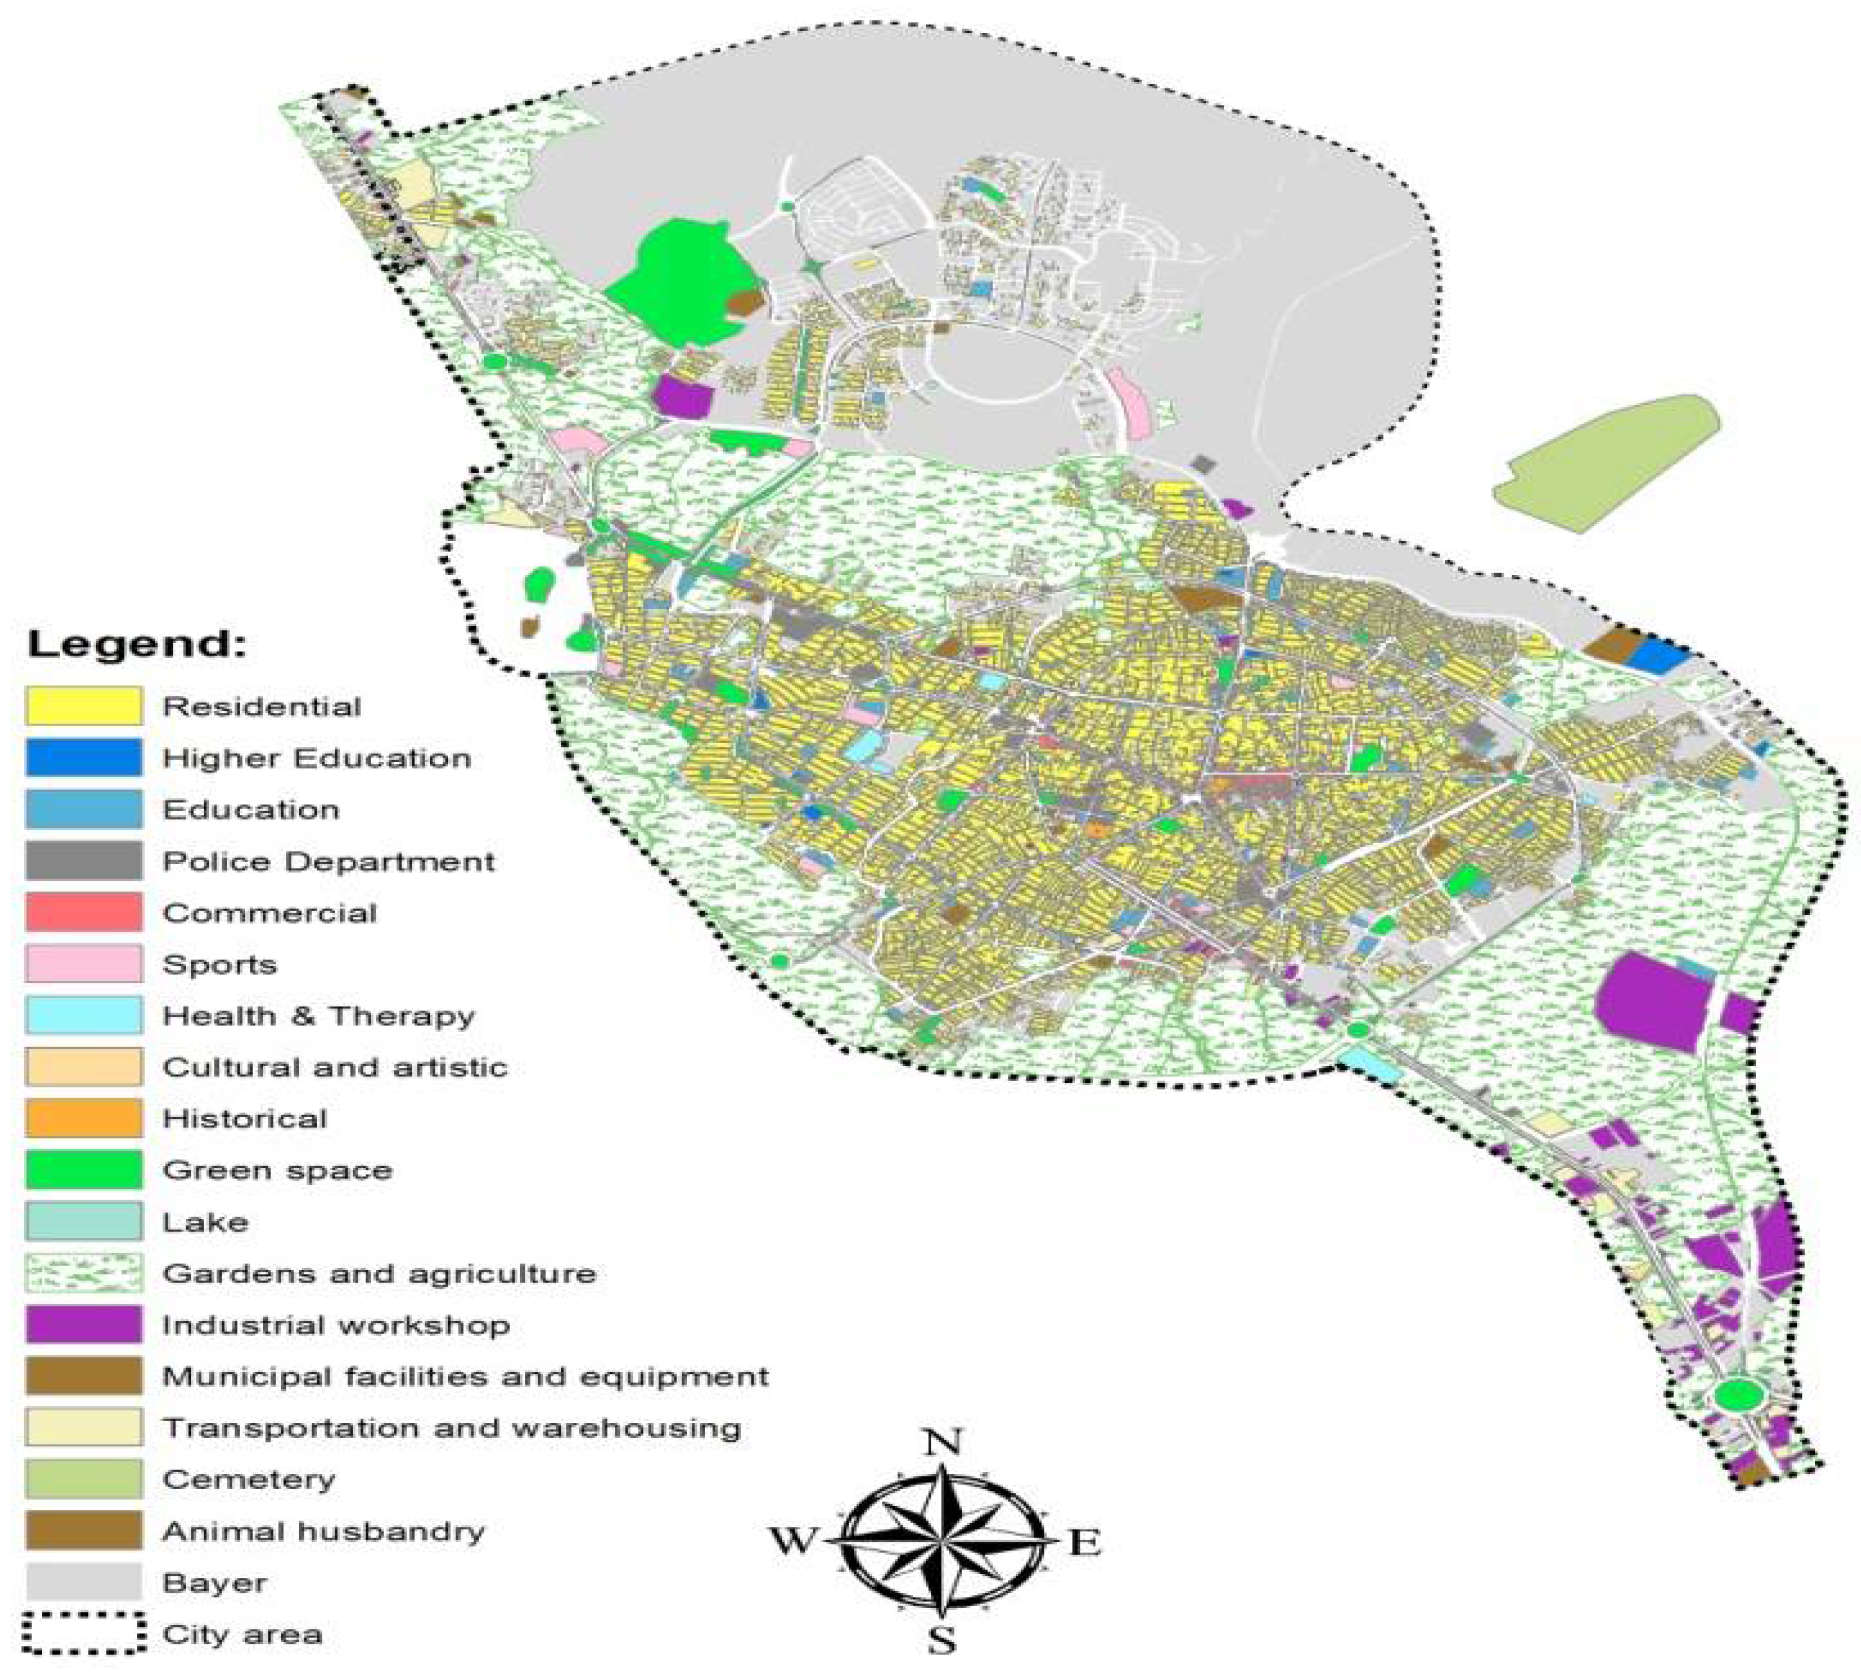
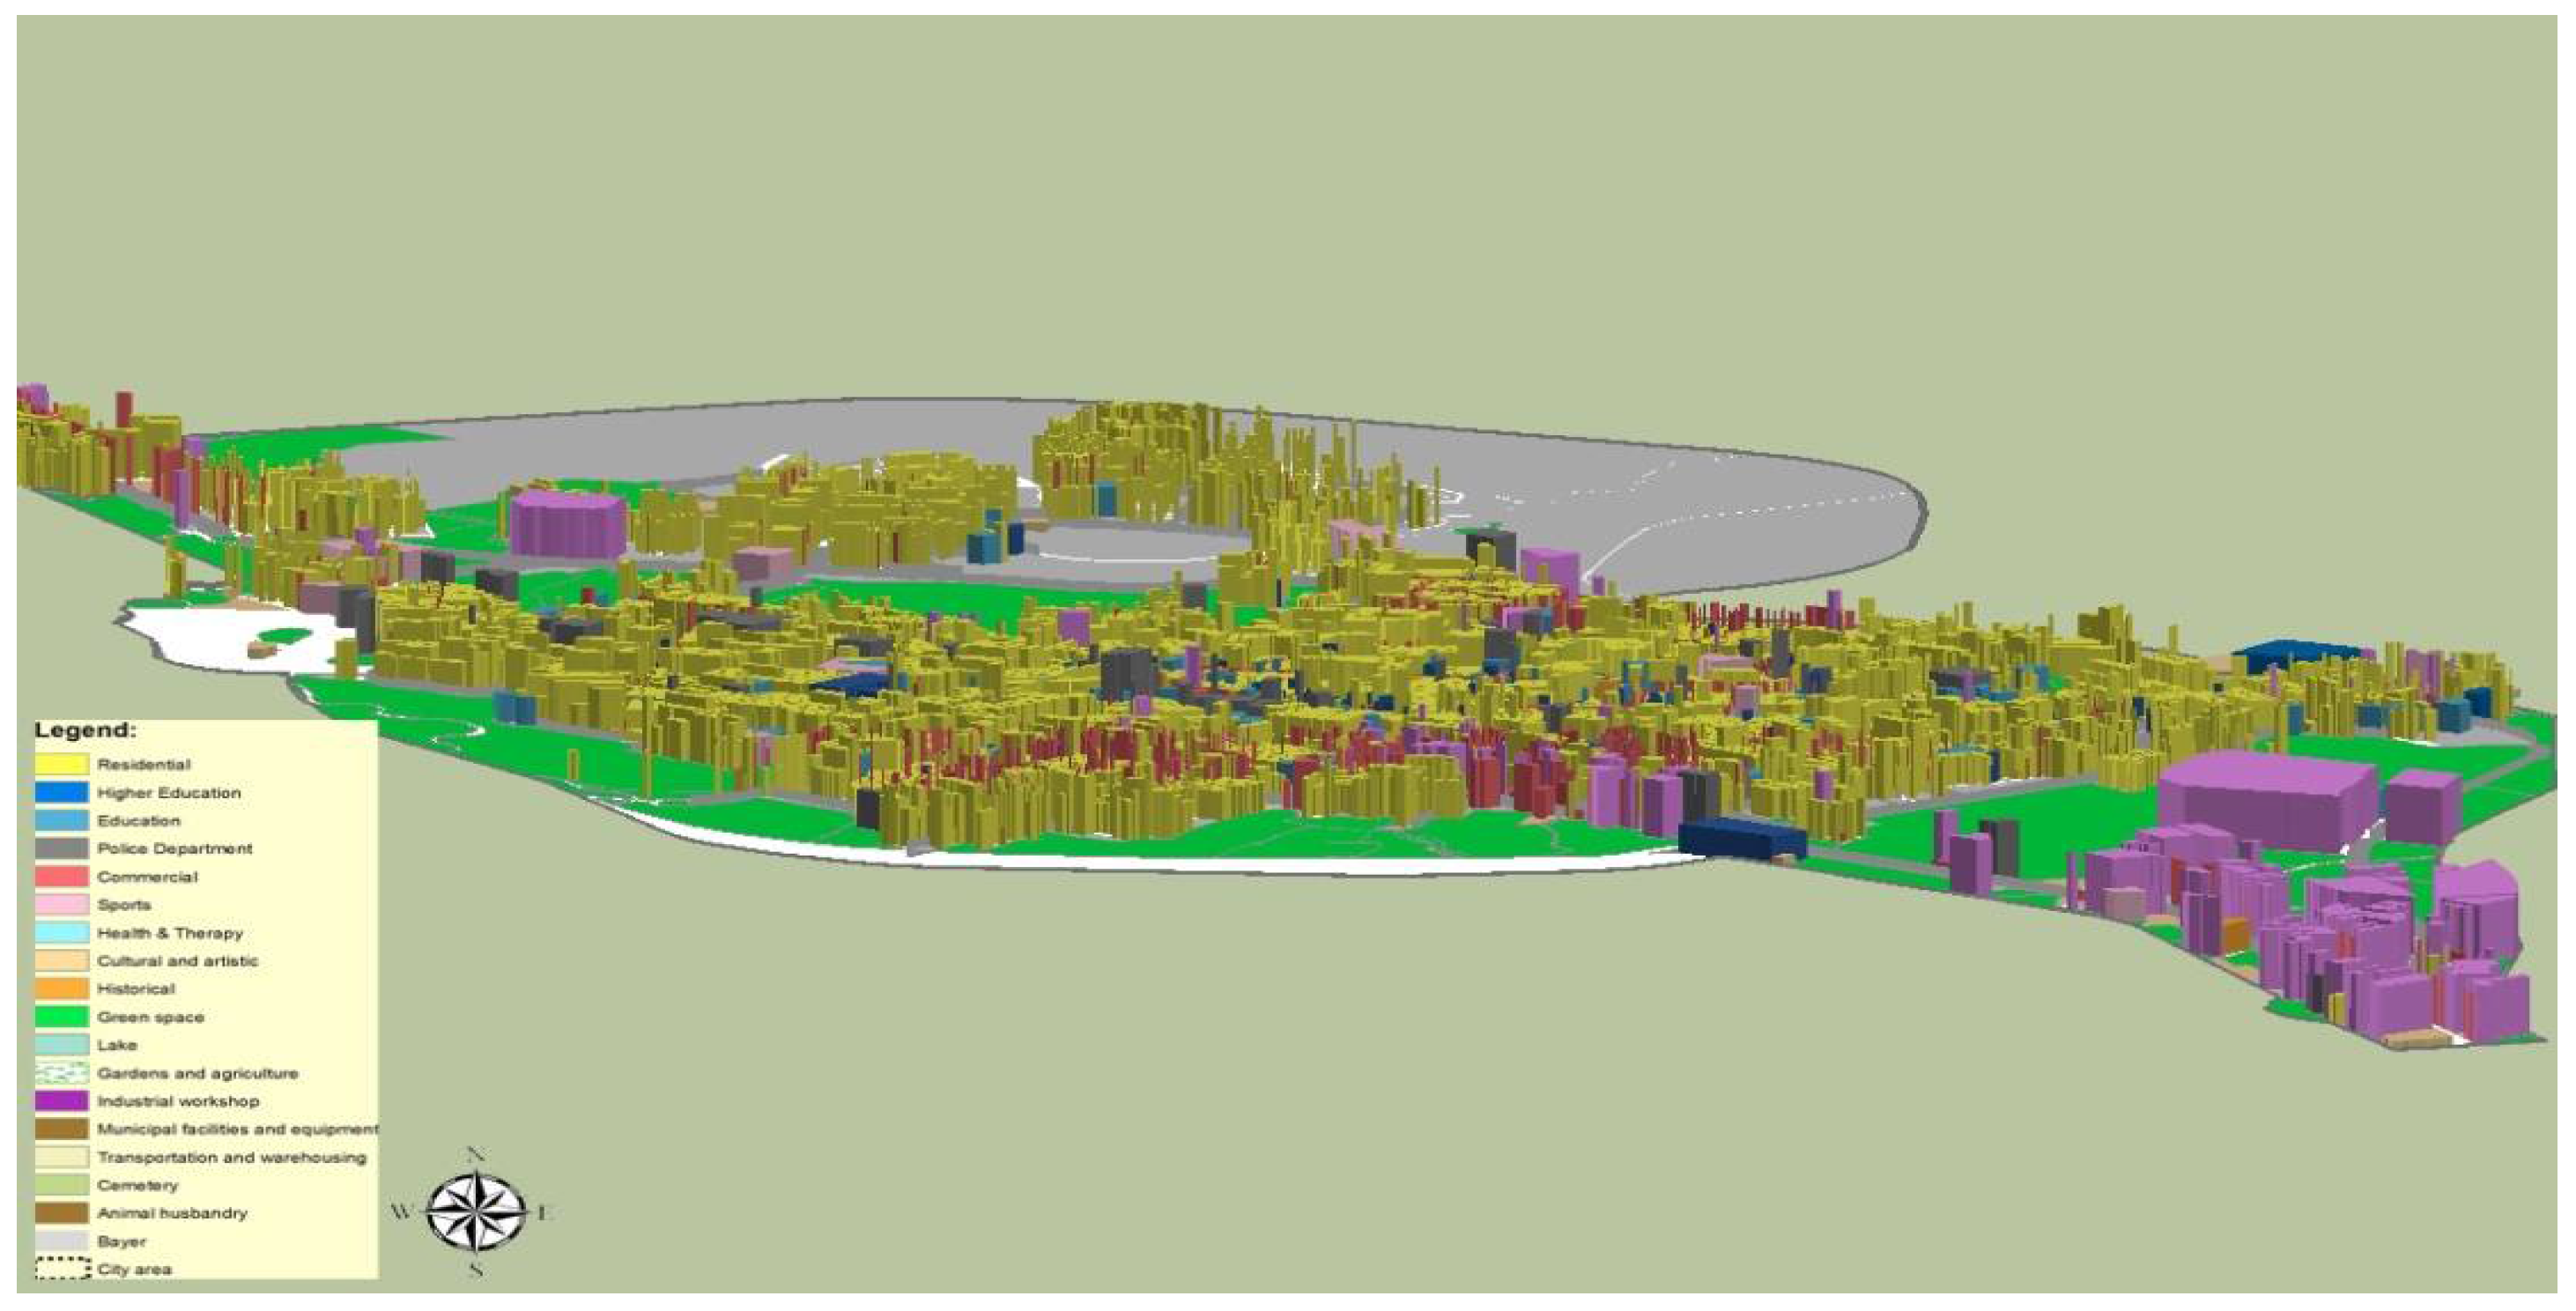
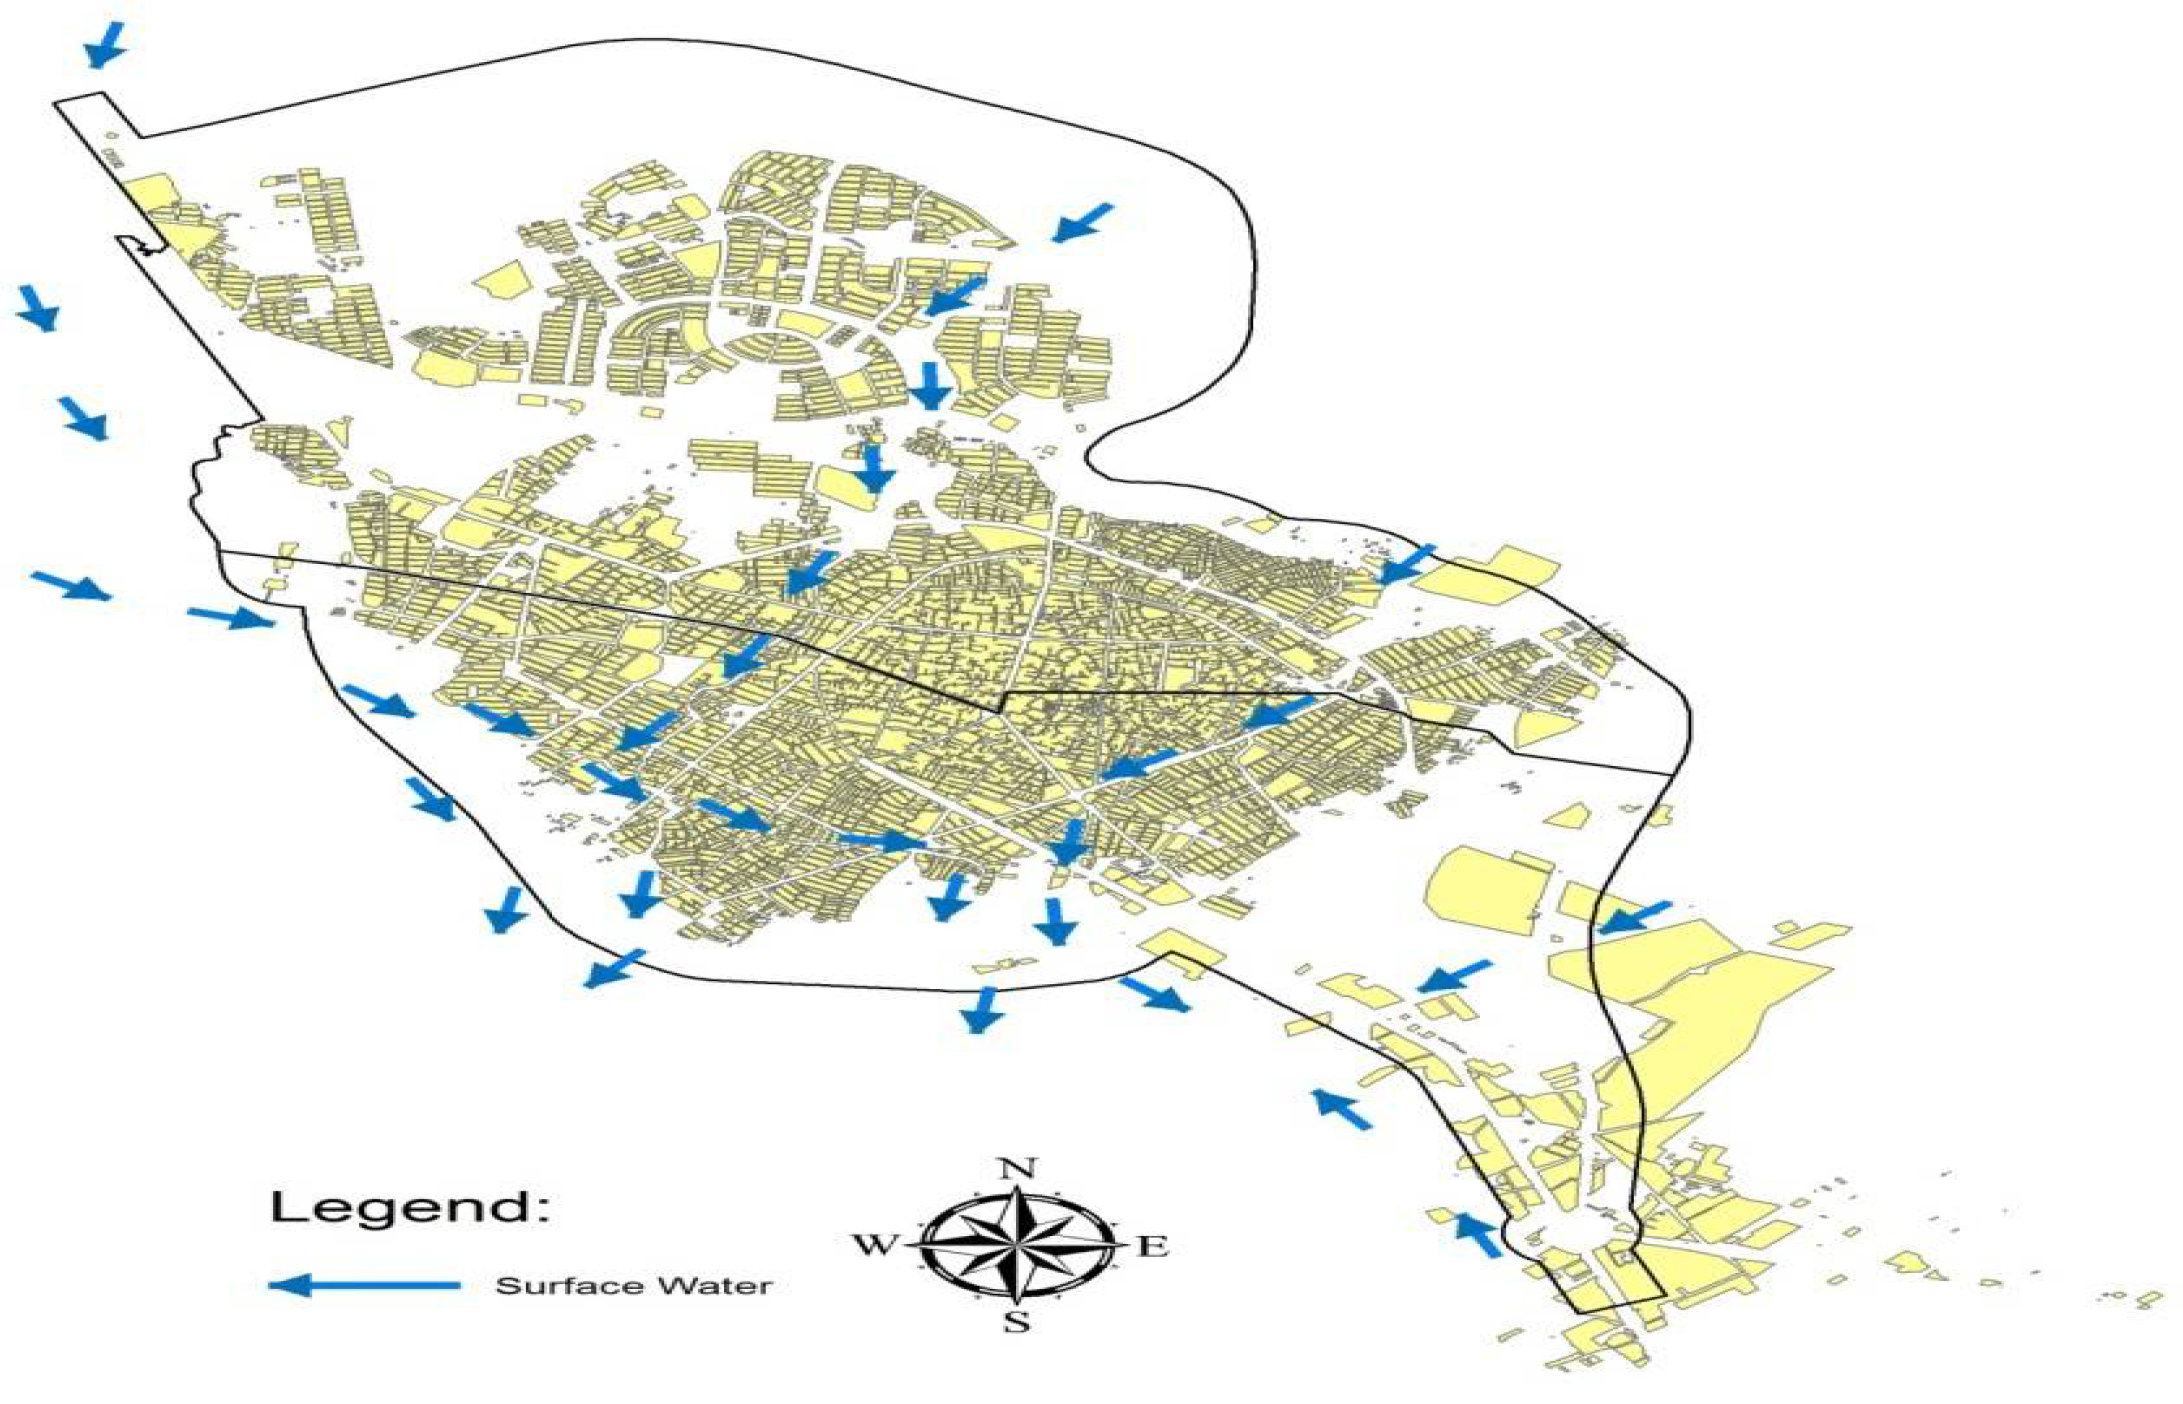
2.5. Study Area
3. Results
3.1. Results of the Climate Models
3.2. Results of the GIS Model
- Three-storied buildings were taken as residential.
- Most of the enclosed surfaces inside the blocks are parting lots that might be the aerobically used if their personal ownership is reduced.
- Smooth roofs and those with a 15-degree gradient are suited to agricultural purposes with no particular reformation.
- Roofs with a more than 15-degree gradient are suitable for rain harvesting and fifteen percent of the roofs were estimated as gable roofs.
- Facades, except the front part of the buildings, are suitable for vertical urban agriculture.
- Around 30% of the urban buildings with parking spaces are 2.5 m high and the dimensions of the garages are ten meters.
- As far as the constructions are allowed, the increase in green infrastructure is allowed as well.
3.3. Implementation of the WEF Nexus Approach
3.3.1. Water
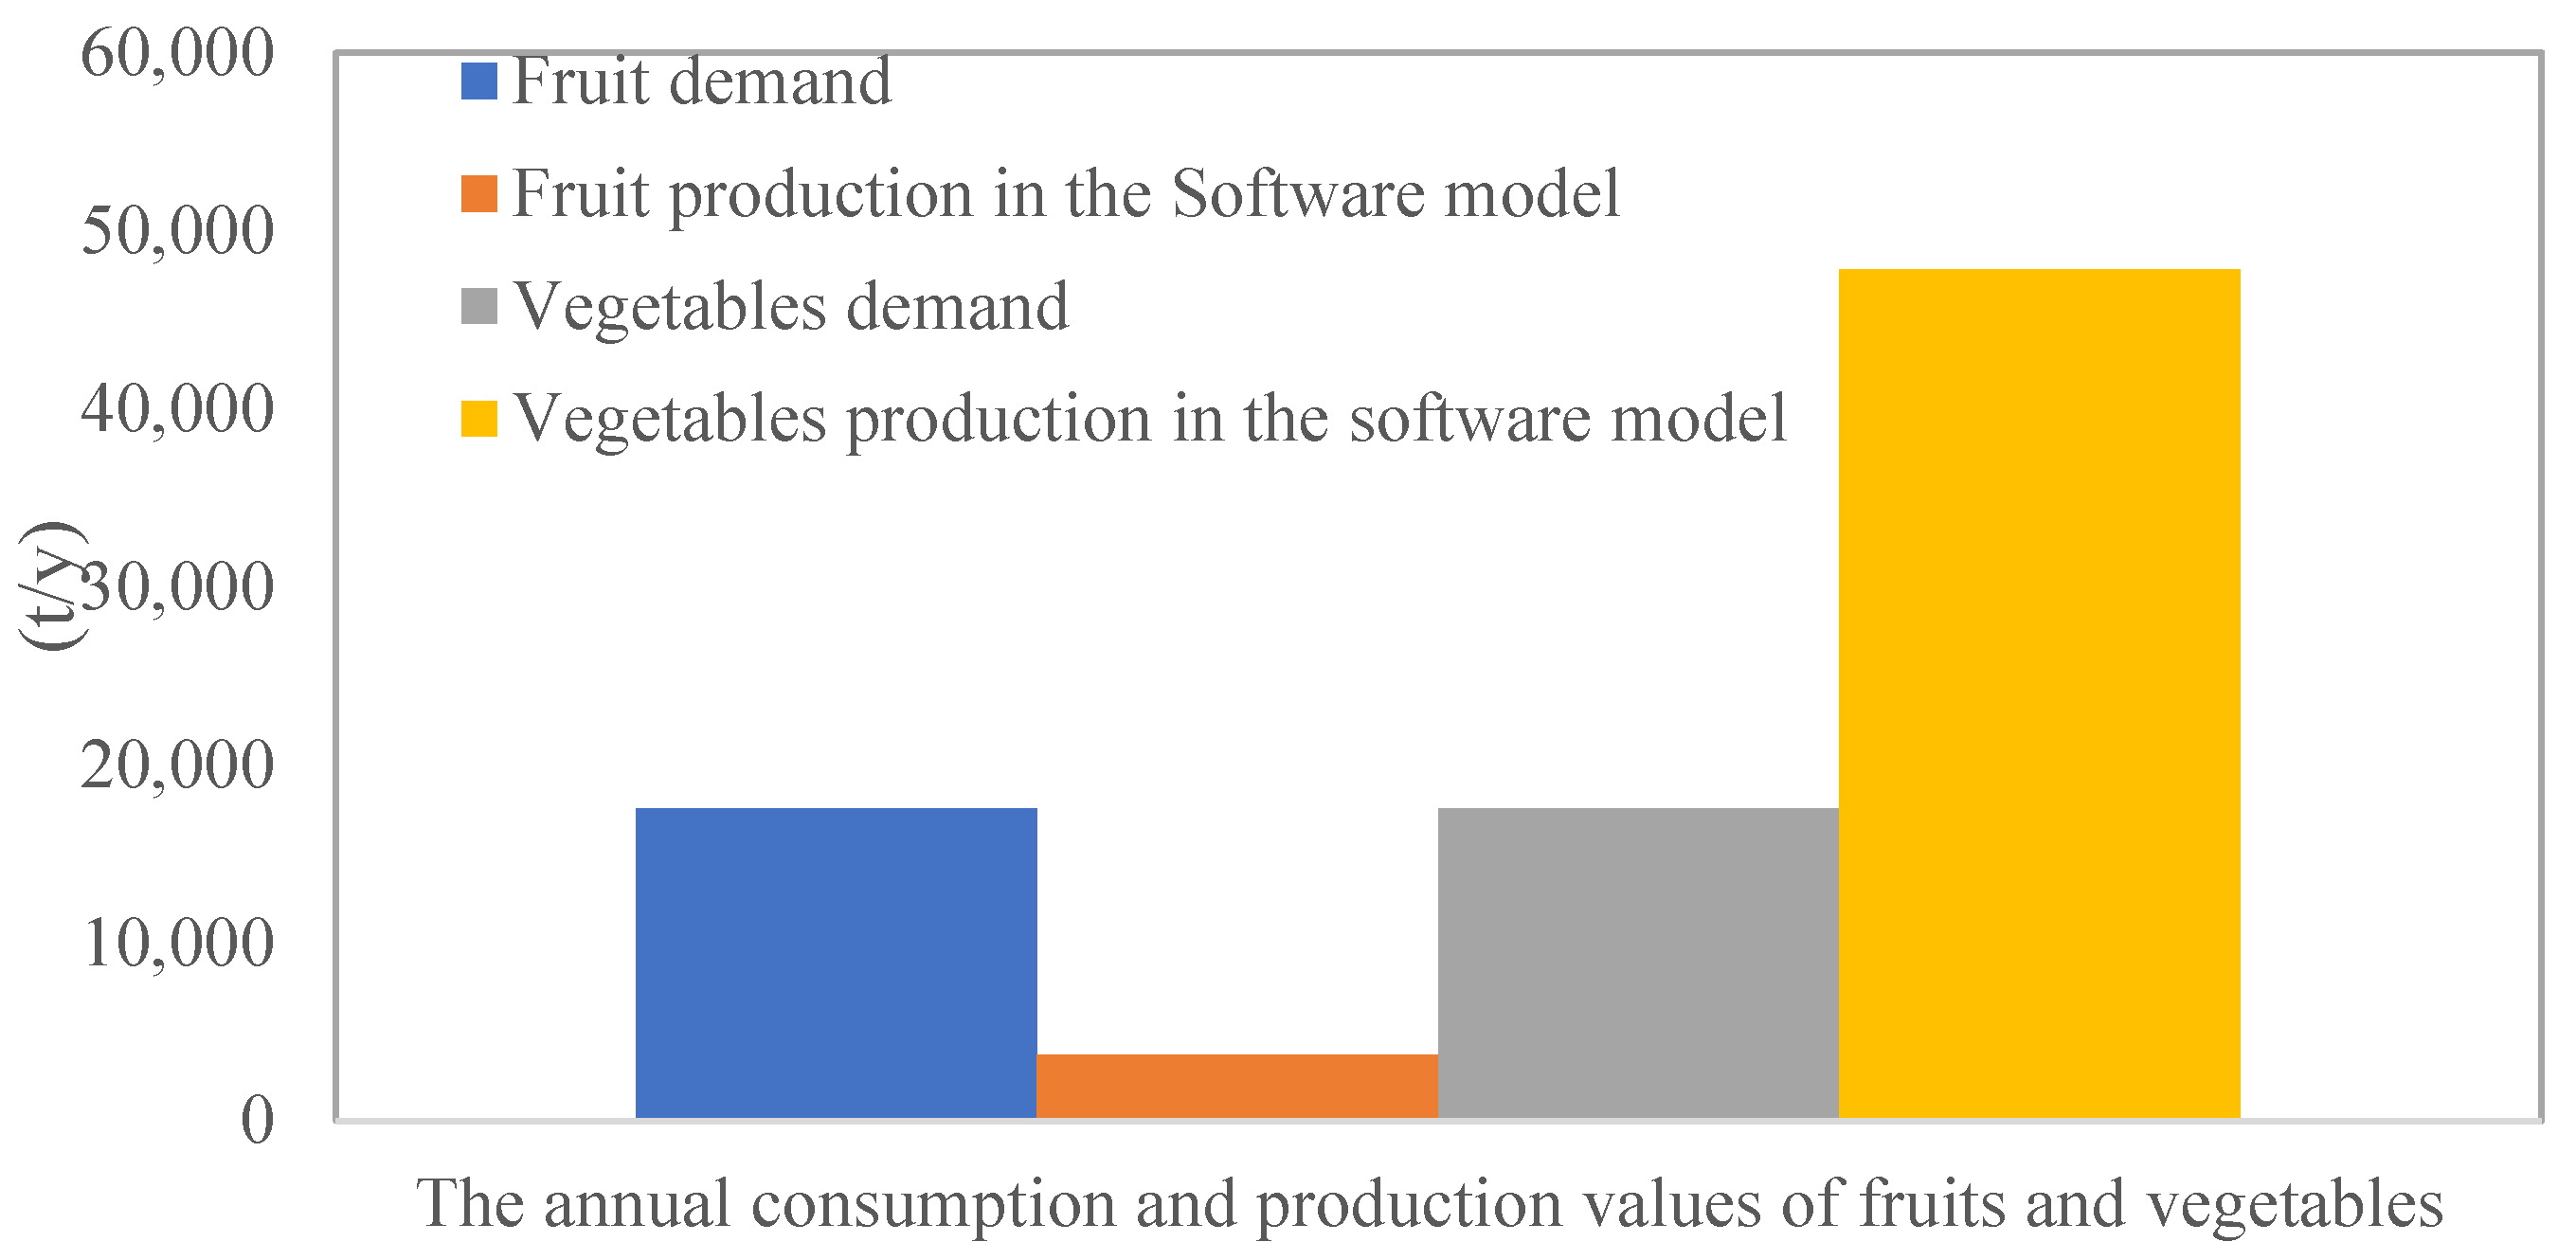
3.3.2. Food
3.3.3. Energy
4. Discussion
5. Conclusions
Author Contributions
Funding
Data Availability Statement
Conflicts of Interest
References
- Goodarzi, M.R.; Vagheei, H.; Mohtar, R.H. The impact of climate change on water and energy security. Water Supply 2020, 20, 2530–2546. [Google Scholar] [CrossRef]
- IEA. World Energy Outlook 2009; International Energy Agency: Paris, France, 2009; 698p. [Google Scholar]
- Fukase, E.; Martin, W. Economic growth, convergence, and world food demand and supply. World Dev. 2020, 132, 104954. [Google Scholar] [CrossRef]
- Rees, W.; Wackernagel, M. Urban ecological footprints: Why cities cannot be sustainable—And why they are the key to sustainability. Environ. Impact Assess 1996, 16, 223–248. [Google Scholar] [CrossRef]
- UN. United Nations. 2018. Available online: https://www.un.org/development/desa/en/news/population/2018-revision-of-world-urbanization-prospects.html (accessed on 1 January 2022).
- IPCC. Climate Change 2014: Synthesis Report; Intergovernmental Panel on Climate Change; IPCC: Geneva, Switzerland, 2014; 80p, Available online: https://epic.awi.de/id/eprint/37530/ (accessed on 1 January 2022).
- EEA. The European Environment—State and Outlook 2015: Synthesis Report; European Environment Agency: Copenhagen, Denmark, 2015; 212p. [Google Scholar]
- Hırca, T.; Eryılmaz Türkkan, G.; Niazkar, M. Applications of innovative polygonal trend analyses to precipitation series of Eastern Black Sea Basin, Turkey. Theor. Appl. Climatol. 2022, 147, 651–667. [Google Scholar] [CrossRef]
- Head, P.; Lam, D. How cities can enter the ecological age. In Eco-City Planning: Policies, Practice and Design; Wong, T.C., Yuen, B., Eds.; Springer: New York, NY, USA, 2011; Volume 295, pp. 17–30. [Google Scholar]
- Klein, R.J.T.; Huq, S.; Denton, F.; Downing, T.E.; Richels, R.G.; Robinson, J.B.; Toth, F.L. Inter-relationships between adaptation and mitigation. In Climate Change 2007: Impacts, Adaptation and Vulnerability; Contribution of Working Group II to the Fourth Assessment Report of the Intergovernmental Panel on Climate Change; Parry, M.L., Canziani, O.F., Palutikof, J.P., van der Linden, J.P., Hanson, C.E., Eds.; Cambridge University Press: Cambridge, UK, 2007; pp. 745–777. [Google Scholar]
- Terrapon-Pfaff, J.; Ortiz, W.; Dienst, C.; Gröne, M.C. Energising the WEF nexus to enhance sustainable development at local level. J. Environ. Manag. 2018, 223, 409–416. [Google Scholar] [CrossRef] [PubMed]
- Saringer-Bory, B.; Mollay, U.; Neugebauer, W.; Pol, O. SmartCitiesNet: Evaluierung Von Forschungsthemen und Ausarbeitung Von Handlungsempfehlungen für “Smart Cities” (Evaluation of Research Topics and Development of Recommendations for “Smart Cities”); Austrian Ministry for Transport, Innovation and Technology: Vienna, Austria, 2012; 136p. (In German) [Google Scholar]
- Hoff, H. Understanding the Nexus; Background Paper for the Bonn2011 Conference: The Water, Energy and Food Security Nexus; Stockholm Environment Institute: Stockholm, Sweden, 2011; 52p. [Google Scholar]
- ADB. Thinking about Water Differently Managing the Water–Food–Energy Nexus; Asian Development Bank (ADB): Mandaluyong City, Philippines, 2013; 47p. [Google Scholar]
- GWSP. Call to Action: For Implementing the Water-Energy-Food Nexus. May 20th 2014; Global Water System Project (GWSP): Bonn, Germany, 2014; 4p. [Google Scholar]
- Rasul, G.; Sharma, B. The nexus approach to water–energy–food security: An option for adaptation to climate change. Clim. Policy 2016, 16, 682–702. [Google Scholar] [CrossRef]
- Kuttler, W. Urbanes Klima (Urban climate). Umweltmeteorologie 2010, 70, 378–382. (In German) [Google Scholar]
- EEA (European Environmental Agency). Climate Change, Impacts and Vulnerability in Europe 2012: An Indicator-Based Report; Report 12; European Environment Agency: Copenhagen, Denmark, 2012; 304p. [Google Scholar]
- Gill, S.E.; Handley, J.F.; Ennos, A.R.; Pauleit, S. Adapting cities for climate change: The role of the green infrastructure. Built Environ. 2007, 22, 113–133. [Google Scholar] [CrossRef]
- Foden, M.; Browne, A.; Evans, D.; Sharp, L.; Watson, M. The water-energy-food nexus at home: New opportunities for policy interventions in household sustainability. Geogr. J. 2019, 185, 406–418. [Google Scholar] [CrossRef]
- Howartha, C.; Monasterolo, I. Opportunities for knowledge co-production across the energy-food-water nexus: Making interdisciplinary approaches work for better climate decision making. Environ. Sci. Policy 2017, 75, 103–110. [Google Scholar] [CrossRef]
- Gondhalekar, D.; Ramsauer, T. Nexus City: Operationalizing the urban Water-Energy-Food Nexus for climate change adaptation in Munich, Germany. Urban Clim. 2017, 19, 28–40. [Google Scholar] [CrossRef]
- Wa’el, A.H.; Memon, F.A.; Savic, D.A. A risk-based assessment of the household water-energy-food nexus under the impact of seasonal variability. J. Clean. Prod. 2018, 171, 1275–1289. [Google Scholar]
- Singh, S.; Tayal, S. Managing food at urban level through water–energy–food nexus in India: A way towards holistic sustainable development. Environ. Dev. Sustain. 2021, 24, 3640–3658. [Google Scholar] [CrossRef]
- Rivotti, P.; Karatayev, M.; Mourâo, Z.S.; Shah, N.; Clarke, M.L.; Konadu, D.D. Impact of future energy policy on water resources in Kazakhstan. Energy Strategy Rev. 2019, 24, 261–267. [Google Scholar] [CrossRef]
- Sohel, M.S.I.; Salam, M.A.; Herbohn, J. An assessment of woody plant water source studies from across the globe: What do we know after 30 years of research, and where do we go from here? Hydrology 2019, 6, 40. [Google Scholar] [CrossRef]
- Karatayev, M.; Hall, S. Establishing and comparing energy security trends in resource-rich exporting nations (Russia and the Caspian Sea region). Resour. Policy 2020, 68, 101746. [Google Scholar] [CrossRef]
- FAO. Rome Declaration on World Food Security and World Food Summit Plan of Action. In Proceedings of the World Food Summit, Rome, Italy, 13–17 November 1996. Available online: https://www.fao.org/3/w3613e/w3613e00.htm (accessed on 1 January 2022).
- Lampert, D.J.; Hao, C.; Elgowainy, A. Wells to wheels: Water consumption for transportation fuels in the United States. Energy Environ. Sci. 2016, 9, 787–802. [Google Scholar] [CrossRef]
- Wilby, R.L.; Harris, I. A framework for assessing uncertainties in climate change impacts: Low-flow scenarios for the river Thames UK. Water Resour. Res. 2006, 42, wo2419. [Google Scholar] [CrossRef]
- Fatehifar, A.; Goodarzi, M.R.; Montazeri Hedesh, S.S.; Siahvashi Dastjerdi, P. Assessing watershed hydrological response to climate change based on signature indices. J. Water Clim. Change 2021, 12, 2579–2593. [Google Scholar] [CrossRef]
- Racsko, P.; Szeidl, L.; Semenov, M. A serial approach to local stochastic weather models. Ecol. Model. 1991, 57, 27–41. [Google Scholar] [CrossRef]
- Semenov, M.A.; Brooks, R.J. Spatial interpolation of the LARS-WG stochastic weather generator in Great Britain. Clim. Res. 1999, 11, 137–148. [Google Scholar] [CrossRef]
- Semenov, M.A.; Barrow, E.M. LARS-WG: A stochastic weather Generation for use in climate impact studies. User Man Herts 2002, 35, 392–444. [Google Scholar]
- Foladmand, H. Estimation of Mean and Critical Irrigation Requirements for the Important Agricultural Crops of Fars Province. Water Soil Sci. 2014, 20, 187–196. [Google Scholar]
- Burman, R.; Pochop, L.O. Evaporation, Evapotranspiration and Climatic Data; Elsevier Science B.V.: Amsterdam, The Netherlands, 1994; 278p. [Google Scholar]
- Penman, H.L. The dependence of transpiration on weather and soil conditions. J. Soil Sci. 1950, 1, 74–89. [Google Scholar] [CrossRef]
- Allen, R.G.; Pereira, L.S.; Rase, D.; Smith, M. Crop Evapotranspiration. FAO Irrig. Drain. Pap. 1998, 56, 60–64. [Google Scholar]
- Smith, M. Climate for Cropwat, Climatic Database for Irrigation Planning and Management; FAO Irrigation and Drainage page 49; FAO: Rome, Italy, 1993; 113p. [Google Scholar]
- WHO. Diet, Nutrition and the Prevention of Chronic Diseases: Report of a Joint WHO/FAO Expert Consultation; WHO Technical Report Series, No. 916; World Health Organization: Geneva, Switzerland, 2003. [Google Scholar]
- Tracey, D. Urban Agriculture: Ideas and Designs for the New Food Revolution; New Society Publishers: Gabriola Island, BC, Canada, 2011; 245p. [Google Scholar]
- Garnett, T. Urban agriculture in London: Rethinking our food economy. In Growing Cities, Growing Food: Urban Agriculture on the Policy Agenda. A Reader on Urban Agriculture; Deutsche Stiftung fur Internationale Entwicklung: Feldafing, Germany, 2000; pp. 477–500. [Google Scholar]


| Land Use | Area (m2) | Share of Area | Number | Population Per Capita |
|---|---|---|---|---|
| Residential | 6,253,069 | 17.36 | 3533 | 25.98365 |
| Higher education | 83,178 | 0.23 | 15 | 0.345633 |
| Educational | 319,420 | 0.89 | 158 | 1.3273 |
| Office-military | 207,340 | 0.58 | 67 | 0.861569 |
| Commercial | 432,411 | 1.20 | 5048 | 1.796816 |
| Sports | 184,251 | 0.51 | 35 | 0.765626 |
| Health care | 125,373 | 0.35 | 92 | 0.520968 |
| Cultural art | 20,484 | 0.06 | 17 | 0.085118 |
| Historical | 38,441 | 0.11 | 51 | 0.159736 |
| Green held | 1,048,415 | 2.91 | 143 | 4.356524 |
| Farming and gardening | 9,001,664 | 25.00 | 134 | 37.405 |
| Industrial workshops | 793,063 | 2.20 | 115 | 3.295449 |
| Urban machineries | 218,784 | 0.61 | 44 | 0.909123 |
| Warehouse and transportation | 286,748 | 0.80 | 62 | 1.191536 |
| Cemetery | 507,031 | 1.41 | 1 | 2.106888 |
| Ranching and husbandry | 35,880 | 0.10 | 9 | 0.149094 |
| Barren landscape | 10,398,987 | 28.88 | 2330 | - |
| Pathway | 6,059,002 | 16.82 | - | - |
| Number of Floors | The Total Number of Buildings | The Number of Residential Blocks | The Number of Other Buildings | The Vertical Area Other Than the Fabric (m2) | The Number of Buildings with Garage |
|---|---|---|---|---|---|
| One-storied | 12,110.25 | 274 | 1836 | 350,720 | - |
| Two-storied | 9569 | 385 | 2184 | 985,600 | - |
| Three-storied | 10,559.75 | 1200 | 360 | 4,608,000 | - |
| Four-storied | 6592.75 | 720 | 472 | 3,686,400 | 483 |
| Five-storied | 3009.25 | 520 | 490 | 3,328,000 | 879 |
| Six-storied and more | 1734 | 434 | 300 | 3,333,120 | 1512 |
| Total | 43,573 | 3533 | 5642 | 16,291,840 | 2874 |
| The Number of Residential Blocks with a Gable Roof | The Total Area of Gable Roofs (m2) (s < 15°) | The Total Area of Non-Gable Roofs (s > 15°) | The Total Volume of Garages (m2) |
|---|---|---|---|
| 530 | 1,361,361 | 7,314,453 | 718,500 |
| Crop | Area (ha) | Water Requirements per Hectare (m3) (NETWAT) | The Urban Software Model Requirements (m3) | Water Requirements in Each Phase (mm/dec) (CROPWAT) | The Length of Growth Period (Day) |
|---|---|---|---|---|---|
| Grapes | 88 | 9270 | 815,760 | 412 | 165 |
| Apples | 104 | 11,350 | 1,180,400 | 460 | 175 |
| Vegetables with leaves | 331 | 7300 | 2,416,300 | 142.5 | 103 |
| Lettuce | 400 | 7200 | 2,880,000 | 142.7 | 107 |
| Crop | Area (ha) | Yield (t/ha) | Potential Yield (t/Year) | |
|---|---|---|---|---|
| Vegetables | Vegetables with leaves | 331 | 30 | 29,790 |
| lettuce | 400 | 45 | 18,000 | |
| Fruits | grapes | 45 | 12 | 540 |
| apples | 80 | 40 | 3200 | |
Publisher’s Note: MDPI stays neutral with regard to jurisdictional claims in published maps and institutional affiliations. |
© 2022 by the authors. Licensee MDPI, Basel, Switzerland. This article is an open access article distributed under the terms and conditions of the Creative Commons Attribution (CC BY) license (https://creativecommons.org/licenses/by/4.0/).
Share and Cite
Goodarzi, M.R.; Mohtar, R.H.; Piryaei, R.; Fatehifar, A.; Niazkar, M. Urban WEF Nexus: An Approach for the Use of Internal Resources under Climate Change. Hydrology 2022, 9, 176. https://doi.org/10.3390/hydrology9100176
Goodarzi MR, Mohtar RH, Piryaei R, Fatehifar A, Niazkar M. Urban WEF Nexus: An Approach for the Use of Internal Resources under Climate Change. Hydrology. 2022; 9(10):176. https://doi.org/10.3390/hydrology9100176
Chicago/Turabian StyleGoodarzi, Mohammad Reza, Rabi H. Mohtar, Reza Piryaei, Atiyeh Fatehifar, and Majid Niazkar. 2022. "Urban WEF Nexus: An Approach for the Use of Internal Resources under Climate Change" Hydrology 9, no. 10: 176. https://doi.org/10.3390/hydrology9100176
APA StyleGoodarzi, M. R., Mohtar, R. H., Piryaei, R., Fatehifar, A., & Niazkar, M. (2022). Urban WEF Nexus: An Approach for the Use of Internal Resources under Climate Change. Hydrology, 9(10), 176. https://doi.org/10.3390/hydrology9100176