Brief Report

Higher Water Yield but No Evidence of Higher Flashiness in Tropical Montane Cloud Forest (TMCF) Headwater Streams

1
Faculty of Tropical Forestry, Universiti Malaysia Sabah, Kota Kinabalu 88450, Sabah, Malaysia
2
Institute for Tropical Biology and Conservation, Universiti Malaysia Sabah, Kota Kinabalu 88450, Sabah, Malaysia
3
Sabah Parks, Kota Kinabalu 88450, Sabah, Malaysia
4
Faculty of Science and Natural Resources, Universiti Malaysia Sabah, Kota Kinabalu 88450, Sabah, Malaysia
5
Executive Office, The University of Tokyo Forests, Graduate School of Agricultural and Life Sciences, The University of Tokyo, Tokyo 113-8654, Japan
*
Authors to whom correspondence should be addressed.
Hydrology 2022, 9(10), 162; https://doi.org/10.3390/hydrology9100162
Submission received: 3 August 2022 / Revised: 1 September 2022 / Accepted: 10 September 2022 / Published: 20 September 2022
(This article belongs to the Section Water Resources and Risk Management)

Abstract

:
There have been conflicting findings on hydrological dynamics in tropical montane cloud forests (TMCFs)—attributed to differences in climate, altitude, topography, and vegetation. We contribute another observation-based comparison between a TMCF (8.53 ha; 1906 m.a.s.l.) and a tropical lowland rainforest (TLRF) (5.33 ha; 484 m.a.s.l.) catchment in equatorial Sabah, Malaysian Borneo. In each catchment, a 90° v-notch weir was established at the stream’s outlet and instrumented with a water-level datalogger that records data at 10-min intervals (converted to discharge). A nearby meteorological station records rainfall at the same 10-min intervals via a tipping bucket rain gauge connected to a datalogger. Over five years, 91 and 73 storm hydrographs from a TMCF and a TLRF, respectively, were extracted and compared. Various hydrograph metrices relating to discharge and flashiness were compared between the TMCF and TLRF while controlling for event rainfall, rainfall intensity, and antecedent moisture. Compared to the TLRF, storm-event runoff in the TMCF was up to 169% higher, reflecting the saturated conditions and tendency for direct runoff. Instantaneous peak discharge was also higher (up to 6.6x higher) in the TMCF. However, despite high moisture and steep topography, stream responsiveness towards rainfall input was lower in the TMCF, which we hypothesise was due to its wide and short catchment dimensions. Baseflow was significantly correlated with API20, API10, and API7. Overall, we found that the TMCF had higher runoff, but higher moisture condition alone may not be sufficient to govern flashiness.

1. Introduction

Mountainous tropical rainforests are known to be flashy and to respond to even few millimetres of rain [1,2,3,4]. Detailed hydrograph analyses in these catchments have, however, been limited in number due to challenges in expecting storm occurrences and in the collection of storm-event stream water samples [5]. With advancements in sensor technology and automatic datalogging, detailed investigations on the rise and fall of stream water levels have been made possible [6,7,8,9,10,11]. At the storm-event scale, Shamsuddin et al. [12] found higher stream flashiness in a young forest plantation compared to that in a mature tropical forest. Nainar et al. [13] found high flashiness in tropical rainforest streams, as did past studies [1,2]; and that post-logging regeneration may restore water resource and flood attenuation capabilities of tropical forests.
While knowledge of tropical forest hydrology (including detailed hydrograph analyses) has been established over the past three decades, knowledge of the hydrological characteristics of tropical montane cloud forests (TMCFs) still trails behind that of tropical lowland rainforests (TLRFs). Compared to TLRFs, TMCFs possess unique hydrological dynamics. Due to high altitudes and mountainous terrain, rainfall is higher and more frequent [14,15,16,17]. At the vegetation level, frequent horizontal precipitation could mean that there is reduced effective interception. Frequent fog and cloud result in condensation on surfaces (leaves, stems, soils, rocks, etc.) and reduced solar radiation. This translates to lower vapour-pressure deficit, lower leaf-water potential, lower evapotranspiration, and constant saturated conditions when compared to lowland rainforest [18,19,20]. For these reasons, the primary mechanism for runoff generation is expected to be saturation-excess instead of Hortonian overland flow. The soil layer may be thinner and poorly developed with abundant parent material, which is characteristic of high-altitude mountainous terrain. These characteristics typically translate to higher stream flashiness and runoff compared to in lowland terrains.
Although such characteristics are generally true for TMCFs, they are broad generalisations. Hydrological dynamics are known to vary depending on altitude, topography, and climatic zones. For example, East Andean TMCFs show wetter conditions and less seasonal variation with altitude [15]. With regards streamflow, although land cover governed streamflow dynamics especially at downstream areas, forest streams in higher elevation were subjected to greater seasonality [15]. In other studies, the authors found it impossible to balance the water budget, resulting in higher output than input [15,21,22]. Bruijnzeel et al. [23] suggested that the high moisture input and low water loss may result in unusually high rainfall-runoff ratios. Although such wet conditions typically point to saturation-excess overland flow, others found that streamflow in TMCFs was primarily sustained by shallower soil water [14,24,25].
Considering the diverse findings from sporadic studies, there is still a need to document hydrological observations in TMCFs from various regions covering differing elevations, vegetation, climate, and geology. In this article, we offer another rainfall and runoff observation in TMCFs. Five years of rainfall and streamflow data from two headwater catchments—A TMCF and a TLRF located along the Crocker Range of Sabah, Malaysian Borneo—Were compared. Due to challenges in obtaining continuous streamflow data in these remote locations, the overall water yield and runoff coefficient were not calculated. Instead, the emphasis was placed on storm-event hydrological dynamics. We compared hydrograph characteristics between the TMCF and the TLRF to determine water yield, peak discharge, flashiness, and catchment moisture, as well as the role of rainfall and antecedent wetness in governing these hydrograph characteristics. Specific questions were as follows: (i) How does storm-event water yield differ between a TMCF and a TLRF catchment? (ii) How do peak discharge and flashiness compare between a TMCF and a TLRF? (iii) How different is the influence of antecedent moisture on streamflow dynamics (water yield, peak discharge, and flashiness) between a TMCF and a TLRF?

2. Study Area

Both catchments are nested within the Crocker Range which is located slightly inland along the west coast of Sabah state (TMCF, ~39 km from the coast; TLRF, ~13 km from the coast) and are mountainous (TMCF, 1906 m.a.s.l.; TLRF, 484 m.a.s.l.). The TMCF catchment is located in the Gunung Alab Substation, Tambunan district; while the TLRF catchment, in the Inobong Substation, Penampang district (Figure 1). Both catchments are on the leeward side, but the TMCF catchment is closer (<1 km away) to the ridge/peak of Mount Alab. Infrastructures (offices, accommodation, an education centre, forest trails, and sheds) and access roads are present at the Gunung Alab Substation, but the TMCF catchment itself is an undisturbed montane forest catchment. Similarly, part of the area near the TLRF (Inobong Substation) had been cleared to build basic facilities and an access road, but the TLRF catchment itself remain undisturbed. It is one of the few remaining undisturbed hill dipterocarp forests in the area with emergent trees still present. The catchments and their surrounding forest reserves, as well as other substations along the Crocker Range Park, are administered by Sabah Parks—a governing body that oversees recreational and research activities in selected nature parks in Sabah. The reader is referred to Sabah Parks [26] for more information.
The general lithology of Mount Alab (TMCF) is sandstone and mudstone of the Trusmadi association. Its main soil units consist of Gleyic and Orthic Acrisols, Gleyic Podzol, humic Gleysol, Dystric Histosol, and Lithosol. In Inobong (TLRF), the lithology comprises sandstones and mudstones of the Crocker association with Orthic Acrisol, Chromic and Dystric Cambisols, and Lithosol, as main soil units [27]. Soils in the TMCF are of the silty clay, silty clay loam, and silt loam texture, with an average bulk density of 0.840 g cm−3 and average unsaturated hydraulic conductivity, k, of 2.22 × 10⁻⁵ cm s−1. In the TLRF, the soil texture is loam and sandy loam, with an average bulk density of 0.748 g cm−3 and k of 9.62 × 10⁻⁵ cm s−1. Although both catchments are mountainous, the TMCF has a higher proportion of steeper slopes (Table 1).
The state of Sabah has a tropical equatorial climate where it is hot and humid throughout the year (annual mean temperature of 26–28 °C; annual rainfall of 2400 mm) without a distinct wet and dry season [28,29]. However, the west coast (location of the study catchments) receives higher and more frequent rainfall in May and October-November following the Northeast and Southwest monsoons, respectively. Due to the mountainous topography and elevation, the catchments were also subjected to localised weather systems and receive higher rainfall compared to coastal areas. The TMCF catchment has a mean annual rainfall of 3527 mm (recorded 2007–2018) and daily temperature ranges of 13–25 °C [16]. Daily relative humidity ranges between 87 and 99.8% (recorded August 2010–October 2011). In the TLRF, mean annual rainfall is 4189 mm with a daily temperature range of 20–32 °C. Daily relative humidity is 70–98% (recorded October 2010–October 2011).
Vegetation comprises common species that can be found in southeast Asia’s tropical forests. The TMCF is characterised by tropical montane species with the occurrence of stunted trees in the higher reaches. Based on vegetation (trees of up to 20 m are still present; stunted trees only at higher reaches) and climate (frequency of fog and cloud), the TMCF catchment can be classified as a middle-upper TMCF. The TLRF is characterised by a mixture of successional and climax species. Emergent canopy trees are still present. A list of major species is in Table 2. Additional information on the studied catchments is in Nainar et al. [30,31]

3. Methodology

In each catchment, a 90-degree v-notch weir was constructed at the outlet of the stream. A protective stilling well (15 cm diameter PVC pipe) was installed just behind the weir and a “Hobo U20” pressure datalogger was installed inside. Another similar datalogger was affixed above the water. The sensors were synchronised to record water pressure and ambient air pressure, respectively, at 10-min intervals. Water pressure in relation to ambient air pressure was converted to water level via the HOBOware Pro software. Water level was converted to discharge via a series of calibration experiments using a large measuring cylinder and stopwatch. Rainfall was measured at a nearby weather station (550 m away in the TMCF; 500 m away in the TLRF) at the same 10-min intervals. Other meteorological data (temperature, relative humidity, and solar irradiance) were occasionally measured whenever possible.
Data collection was carried out from January 2015 to December 2020. Periods of equipment malfunction and other data gaps were removed from the dataset. From the available data, storm-event hydrographs were identified and extracted via the software GFORTRAN 4.9.3 based on the following criteria: three consecutive increases in stream discharge marks the start of a storm event; an event ends when discharge drops to within 20% of its initial value [35]. In the event where another hydrograph was initiated before the present ended, it was considered a new event only if it started at least six hours after the initiation of the first hydrograph. A straight line connecting the initial discharge (Qinitial) to the final discharge value of the hydrograph arbitrarily separated the stormflow (Qstorm) from baseflow (Qbase) following the method of Nainar et al. [35]. All hydrographs were then individually inspected to exclude erroneous data and false events. A total of 91 events from the TMCF and 73 events from the TLRF were qualified for further analysis.
From each storm-event hydrograph, the following hydrograph metrices were extracted: Qtot (total discharge), Qstorm (total stormflow), Qbase (total baseflow), Qinitial (initial discharge, i.e., discharge just before hydrograph initiation), Qpeak (peak discharge), Qpeakadj (adjusted peak discharge, i.e., Qpeak-Qinitial), Tres (response time, i.e., time taken from first recorded rain to hydrograph initiation), and Tpeak (time-to-peak, i.e., time taken from Qinitial to Qpeak). In addition to discharge components, rainfall-related information were also extracted and processed [17,35]. Total event rainfall (P) was defined by the cumulative rain prior to hydrograph initiation up to the end of a hydrograph. Average rain intensity (Pi) was P divided by precipitation timespan. A range of antecedent precipitation indices (API3, API5, API7, API10, API15, and API20) were also computed. A straightforward comparison was done on these hydrograph metrices between the TMCF and the TLRF—this was the first comparison. The reader is referred to Nainar et al. [35] for a detailed explanation of hydrograph processing and extraction of metrices.
Using the software R v.4.1.2, generalised linear models (GLMs) were fitted via the ‘glm’ command for the response variables (Qtot, Qstorm, Qbase, Qpeak, Qpeakadj, Tres, and Tpeak), main covariate (P), secondary covariates comprising either average rain intensity (Pi) or a range of antecedent moisture indices (Qinitial, API3, API5, API7, API10, API15, and API20), and forest type (TMCF and TLRF) as factors. Predictors were qualified only when the relationships were statistically significant (α = 0.05). Addition/exclusion of regression terms was performed stepwise forward. The Akaike information criterion (AIC) and generated pseudo R-squared were used to determine parsimony of predictors as well as the GLM family (Gaussian, gamma, or Poisson) and link functions (identity, inverse, binomial, or log). The multivariate regression coefficients were then used to compute response variables (hydrograph metrices) for comparison between the TMCF and the TLRF—this was the second comparison [36].

4. Results

4.1. General Statistics from Data

From observed data, all hydrograph metrices were higher in the TMCF (Table 3). Compared to the TLRF, Qtot and Qstorm in the TMCF were 169% and 382% higher, respectively. Catchment moisture- and baseflow-related metrices, Qinitial and Qbase, were 27% and 37% higher, respectively, in the TMCF. Indicators for flashiness however, showed mixed results. Qpeak in the TMCF was 657% higher (higher flashiness) than in the TLRF; whereas Tres and Tpeak in the TMCF were 247% and 92% longer (indicating lower flashiness). Duration of stormflow (Tstorm) was 21% longer in the TMCF compared to the TLRF. Descriptive statistics can be found in the appendix (Appendix A).

4.2. Comparison with GLMs

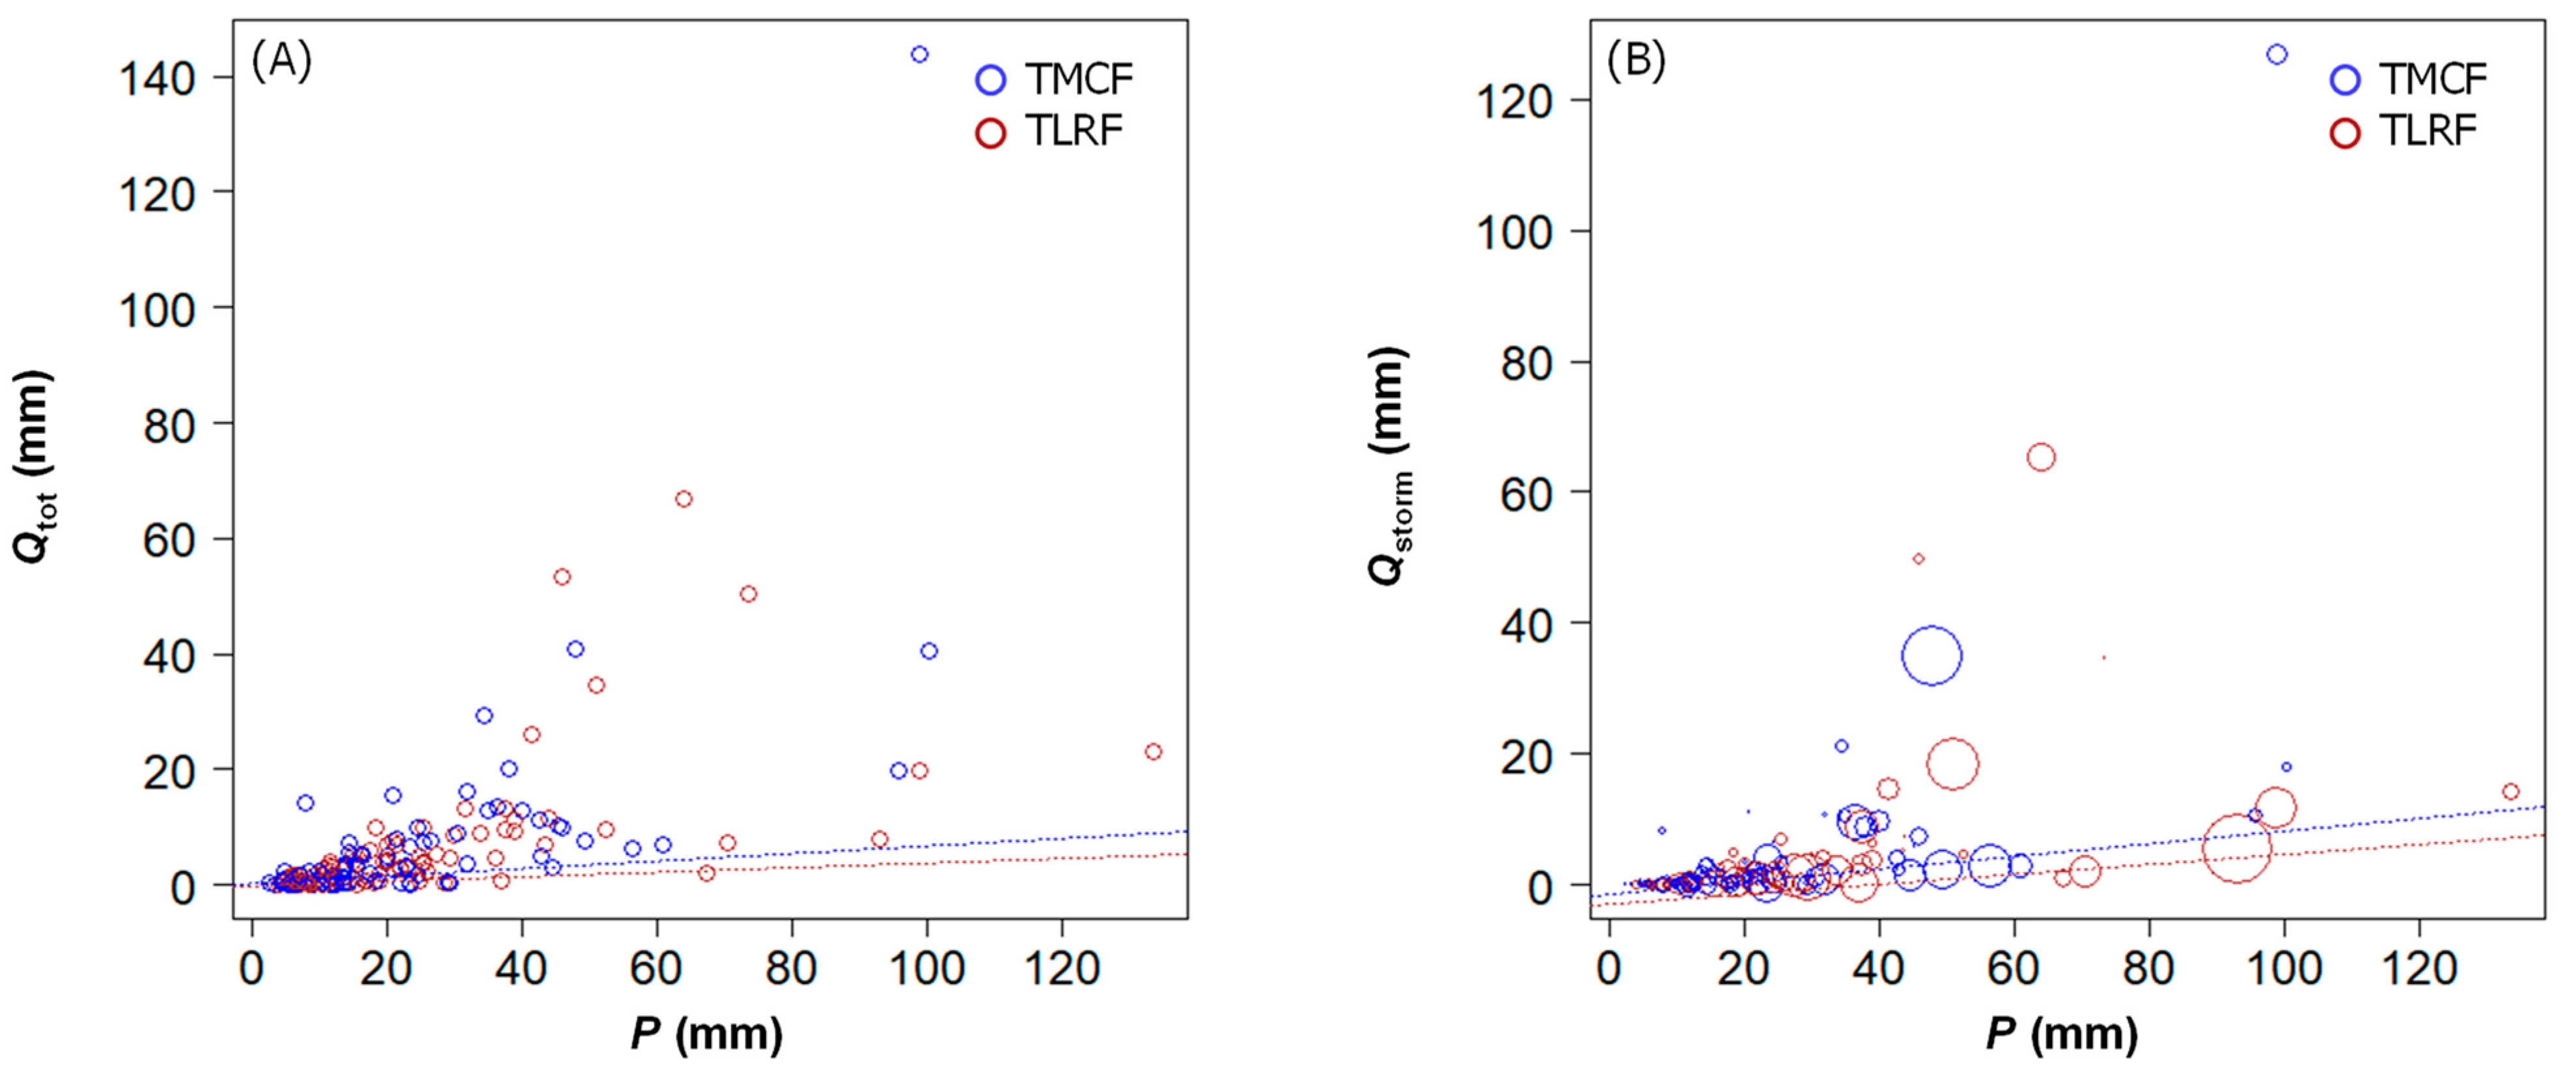
4.2.1. Storm-Event Runoff
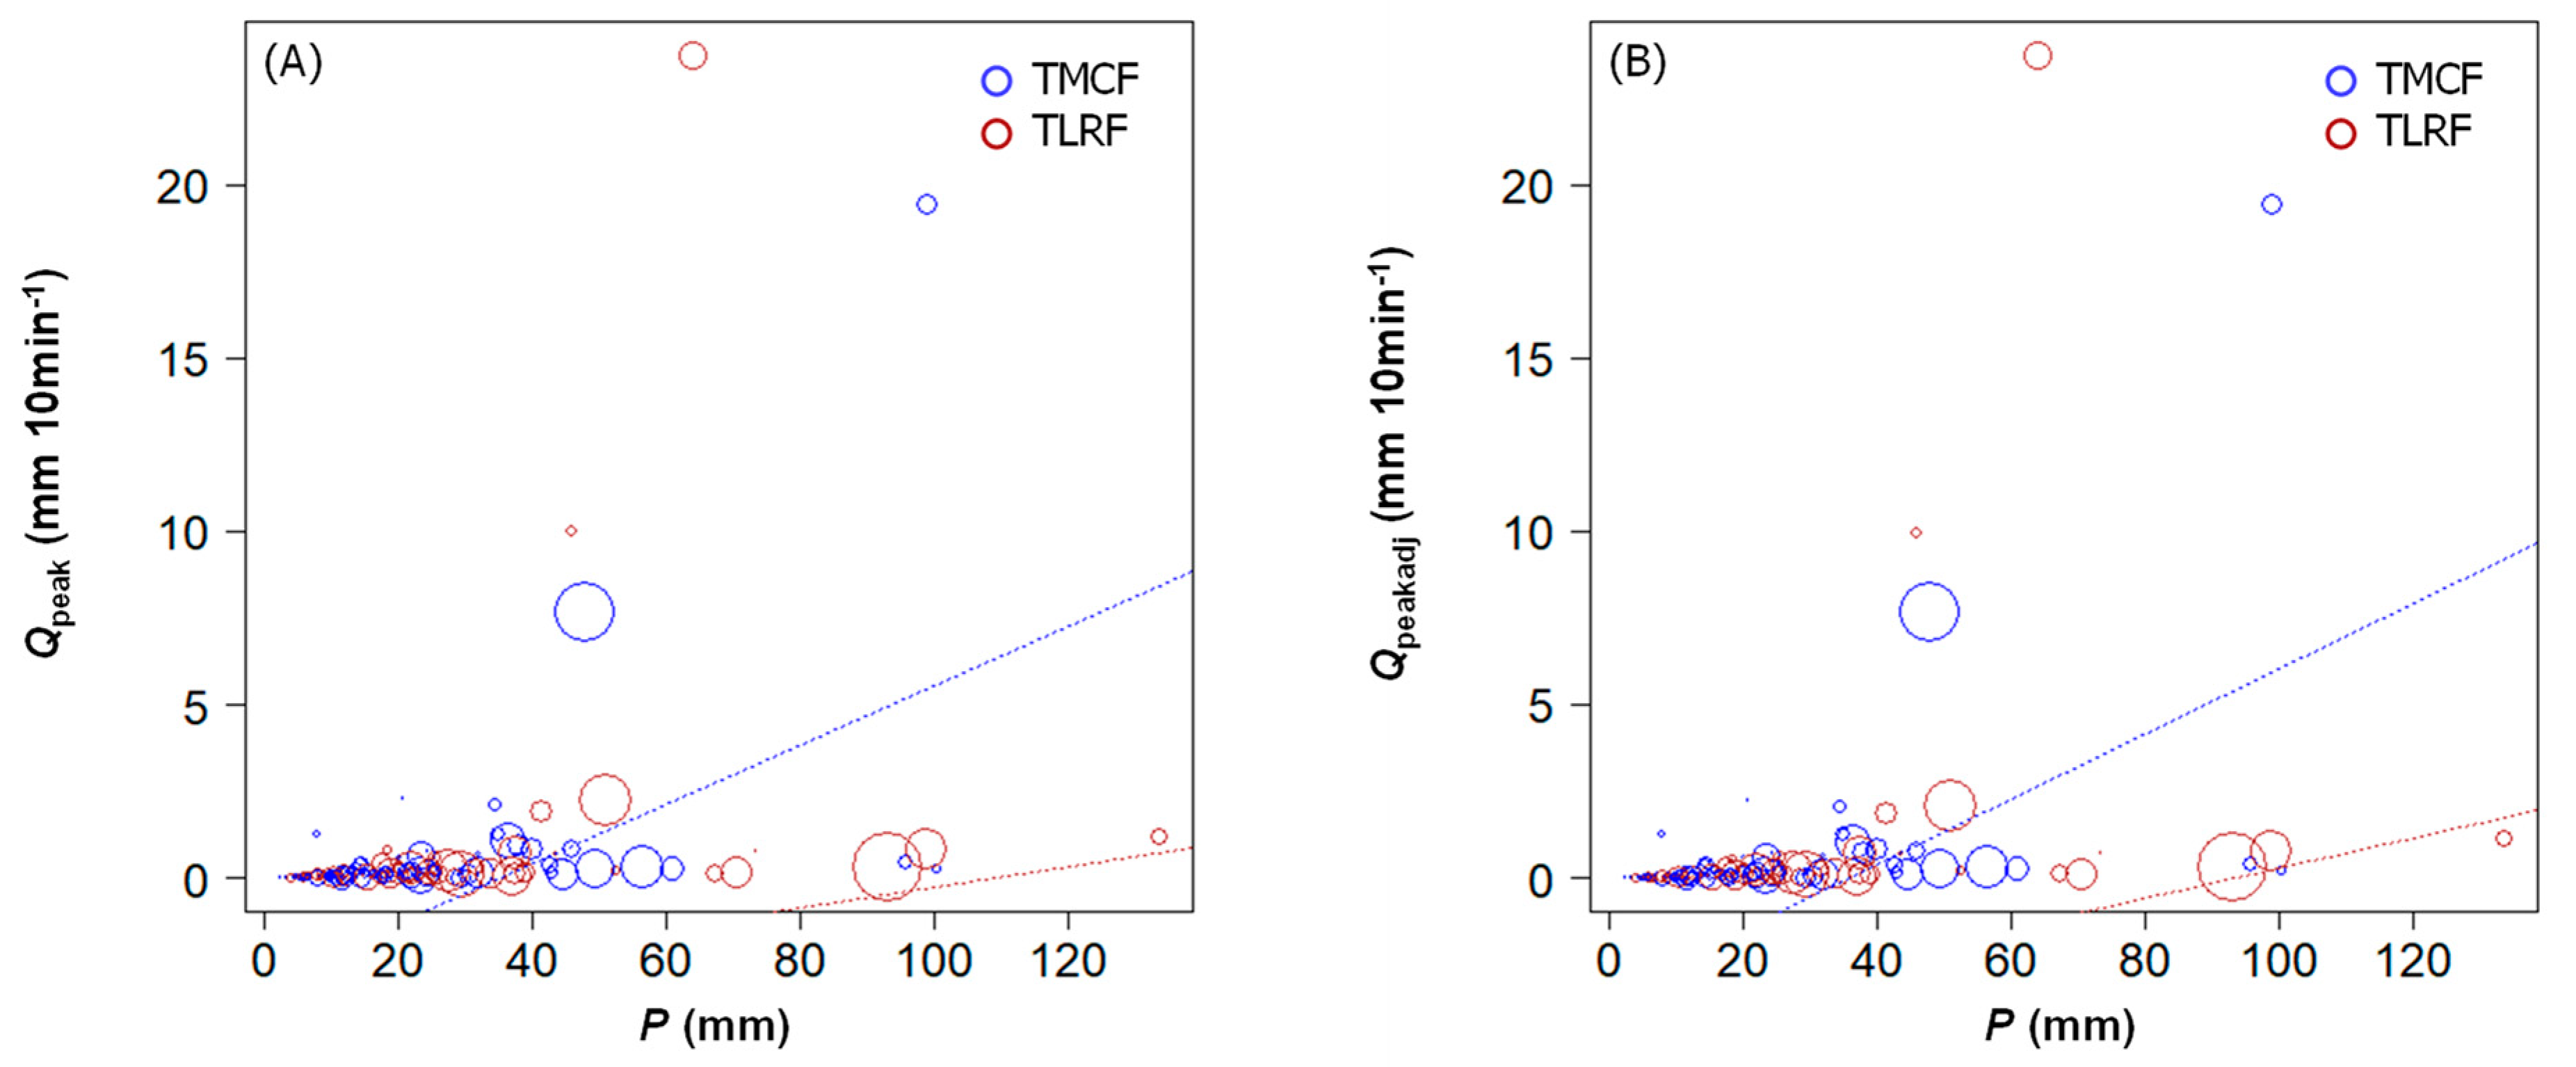
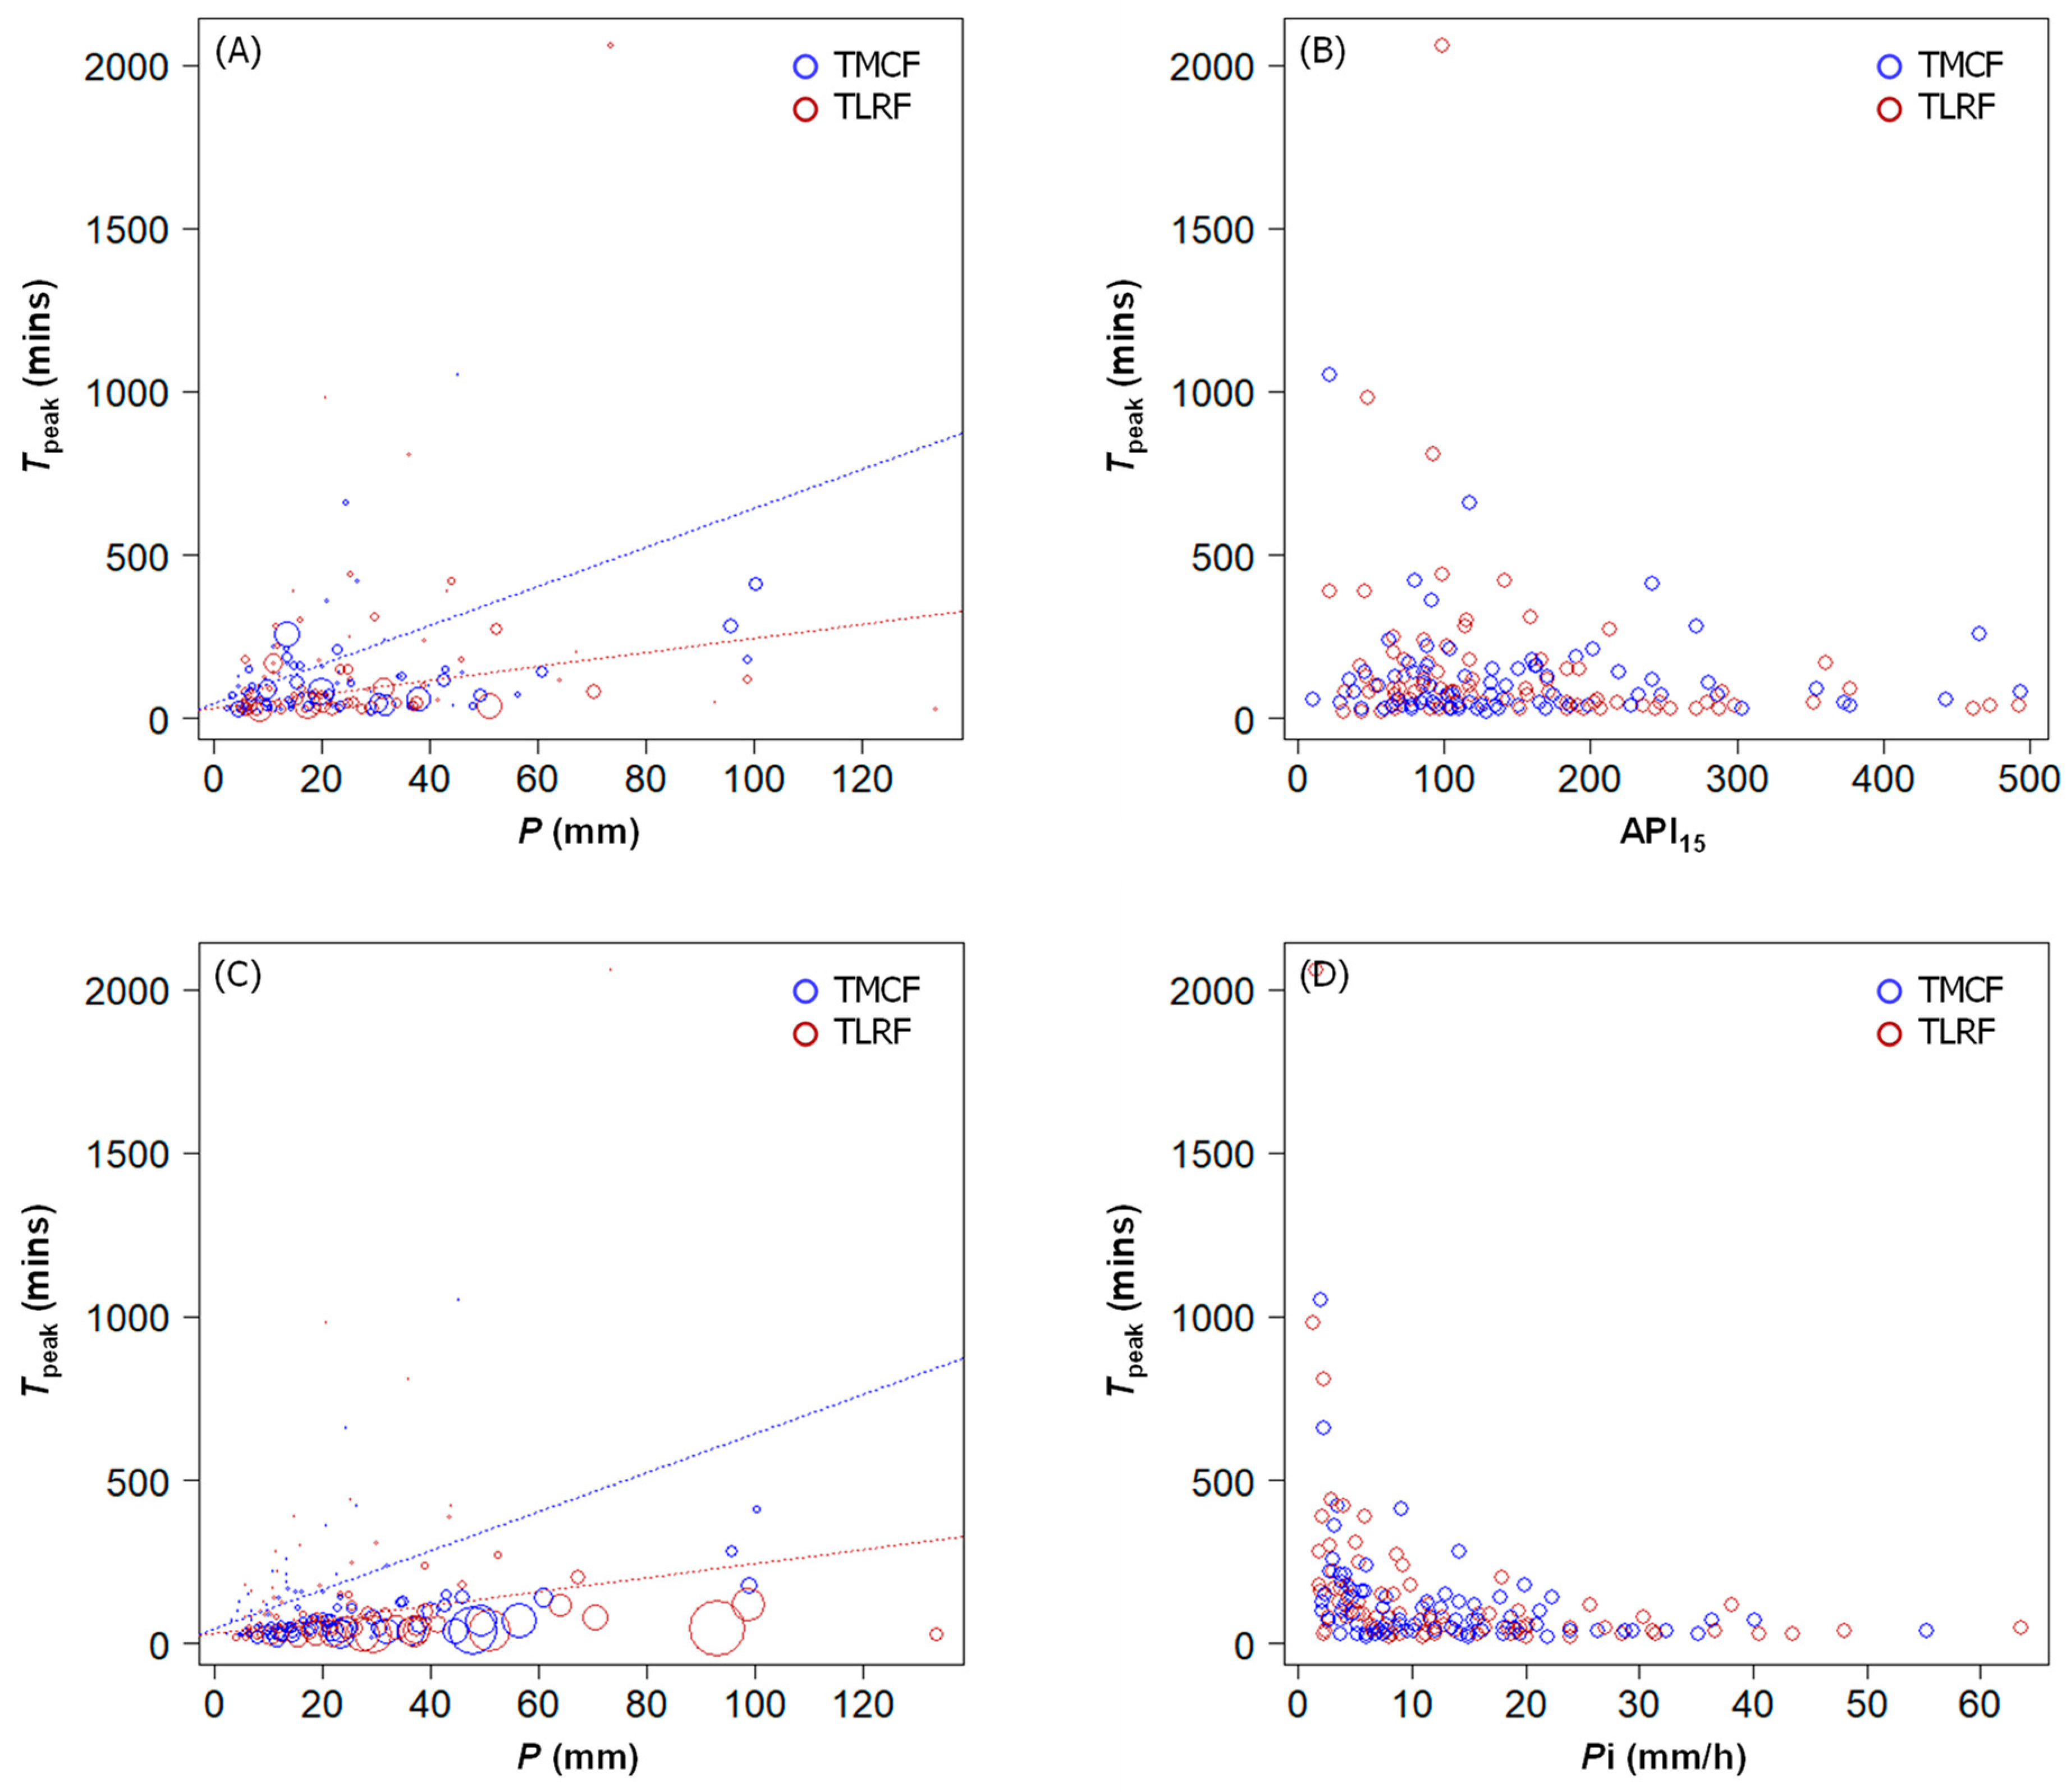
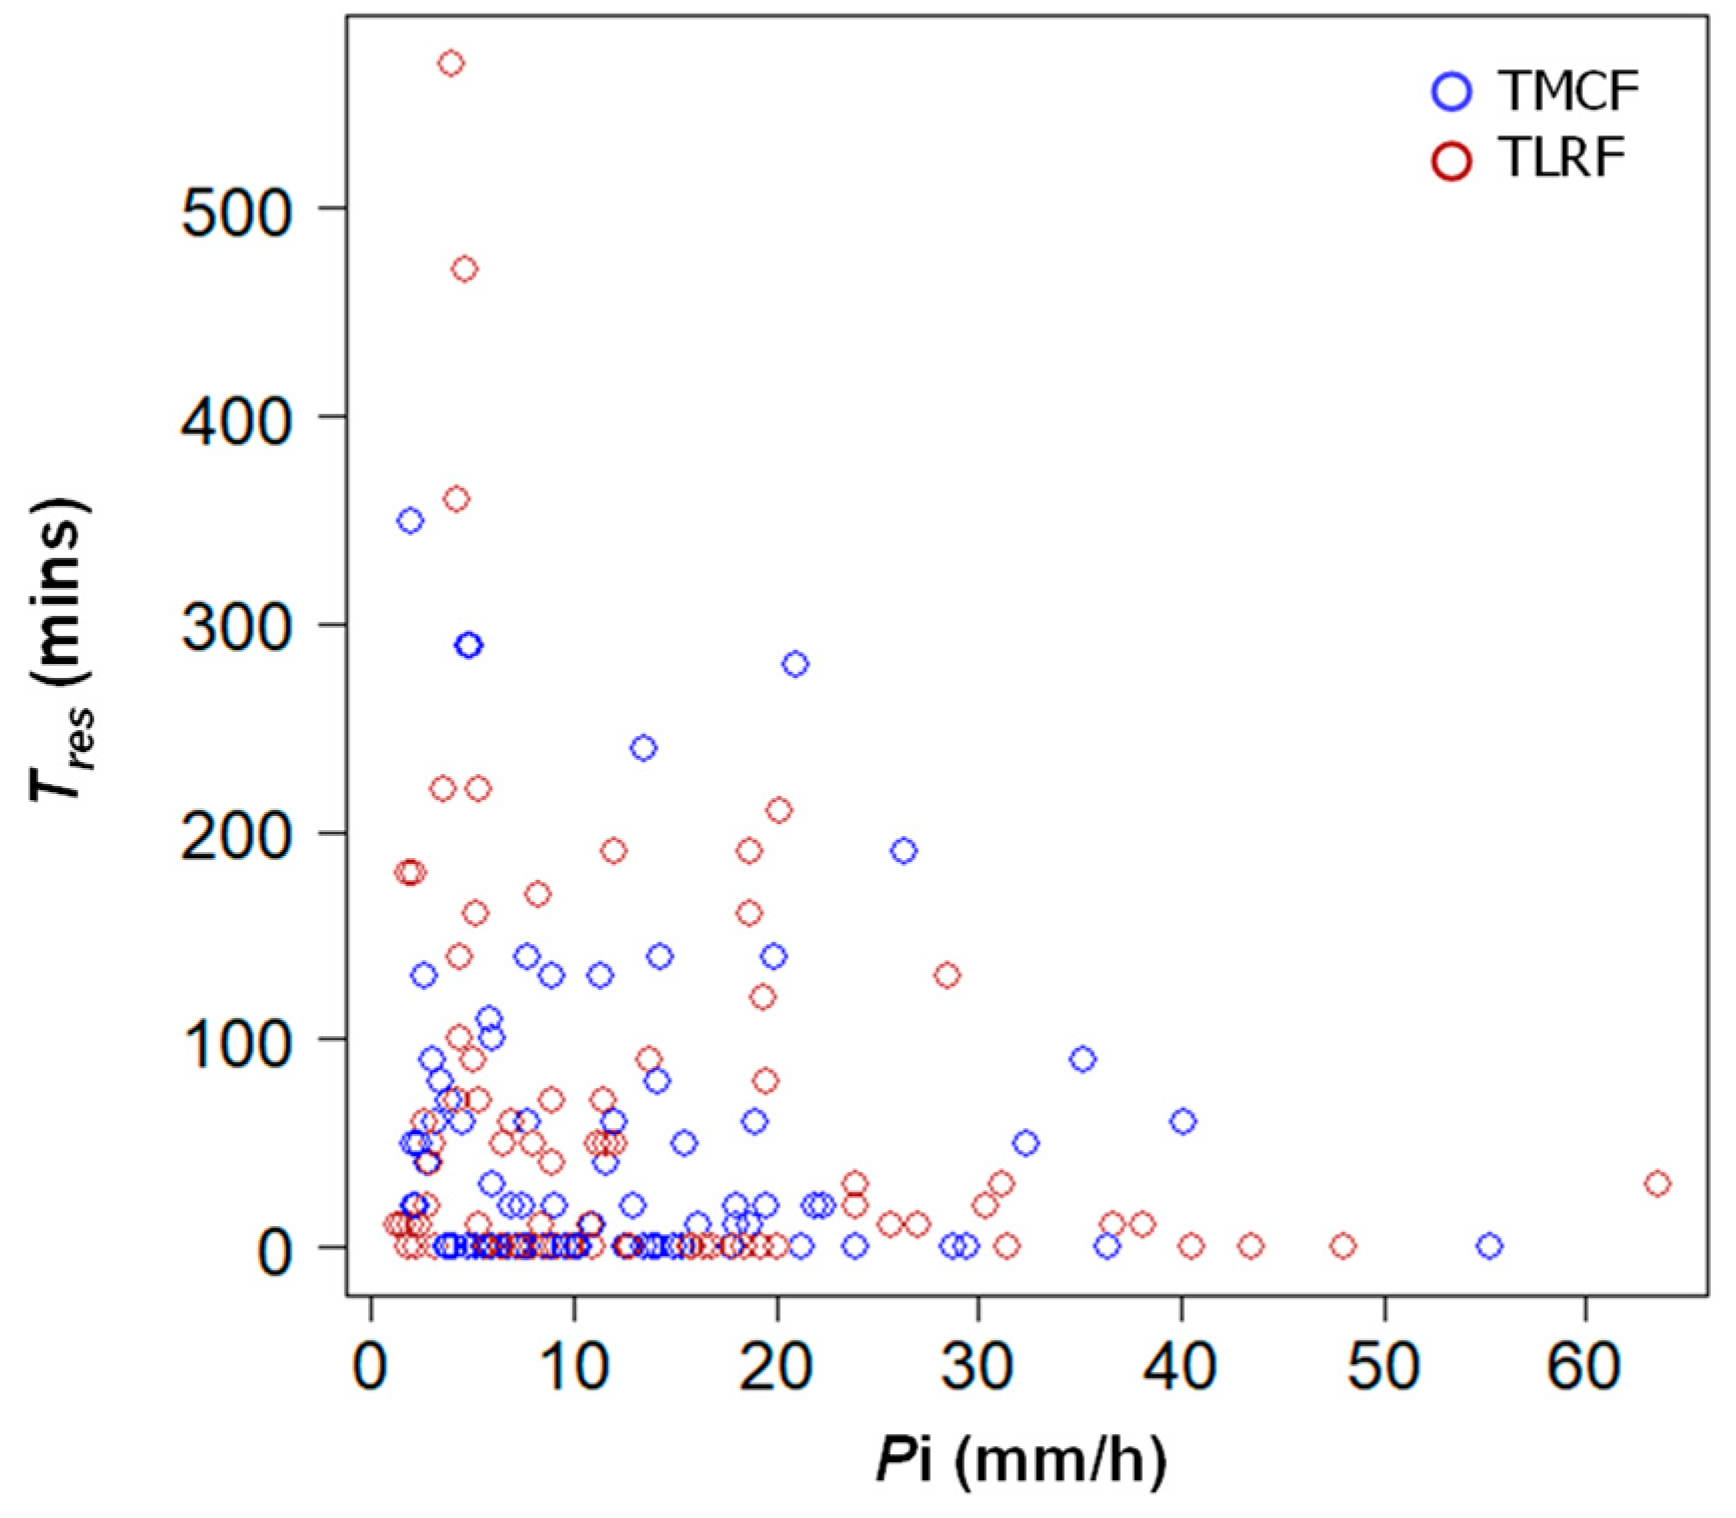
Qtot in the TMCF was 97% higher than that in the TLRF (Figure 2; p < 0.05). After subtracting Qbase from Qtot, the resulting net stormflow (Qstorm) in the TMCF was 422% higher than in the TLRF (p < 0.05). Addition of the term Pi significantly improved the model’s performance (Table 4).
Basic regression with event rainfall (P) as predictor:
Y = (a + a2F) + (b + b2F) ∙ P
For multivariate regressions with secondary predictor, rainfall intensity (Pi):
Y = (a + a2F) + (b + b2F) ∙ P + (c + c2F) ∙ Pi
Y = (a + a2F) + (b + b2F) ∙ P + (c + c2F) ∙ Pi + (d + d2F) ∙ PPi
For multivariate regressions with secondary predictor, antecedent moisture (Qinitial, API3, API5, API7, API10, API15, API20):
Y = (a + a2F) + (b + b2F) ∙ P + (e + e2F) ∙ ante
Y = (a + a2F) + (b + b2F) ∙ P + (e + e2F) ∙ ante + (f + f2F) ∙ Pante

4.2.2. Flashiness

Qpeak and Qpeakadj in the TMCF were 48% and 50% higher, respectively, than in the TLRF (p < 0.05). The net peak discharge (Qpeakadj) model performed better especially when including Pi as a secondary predictor (Figure 3, Table 4).
Depending on the secondary predictor used, Tpeak was found to be between 11.28 and 36.38% longer in the TMCF compared to the TLRF (p < 0.05)—11.28% when using Pi; 36.38% when using API15 (Figure 4, Table 4). Pi was a better secondary predictor than API15 (Figure 4B,D; Table 4).
Tres was not explained by the primary predictor, P, but had a significant relationship with Pi (Figure 5; p < 0.05). Tres in the TMCF was 1.7x longer than in the TLRF (p < 0.05).

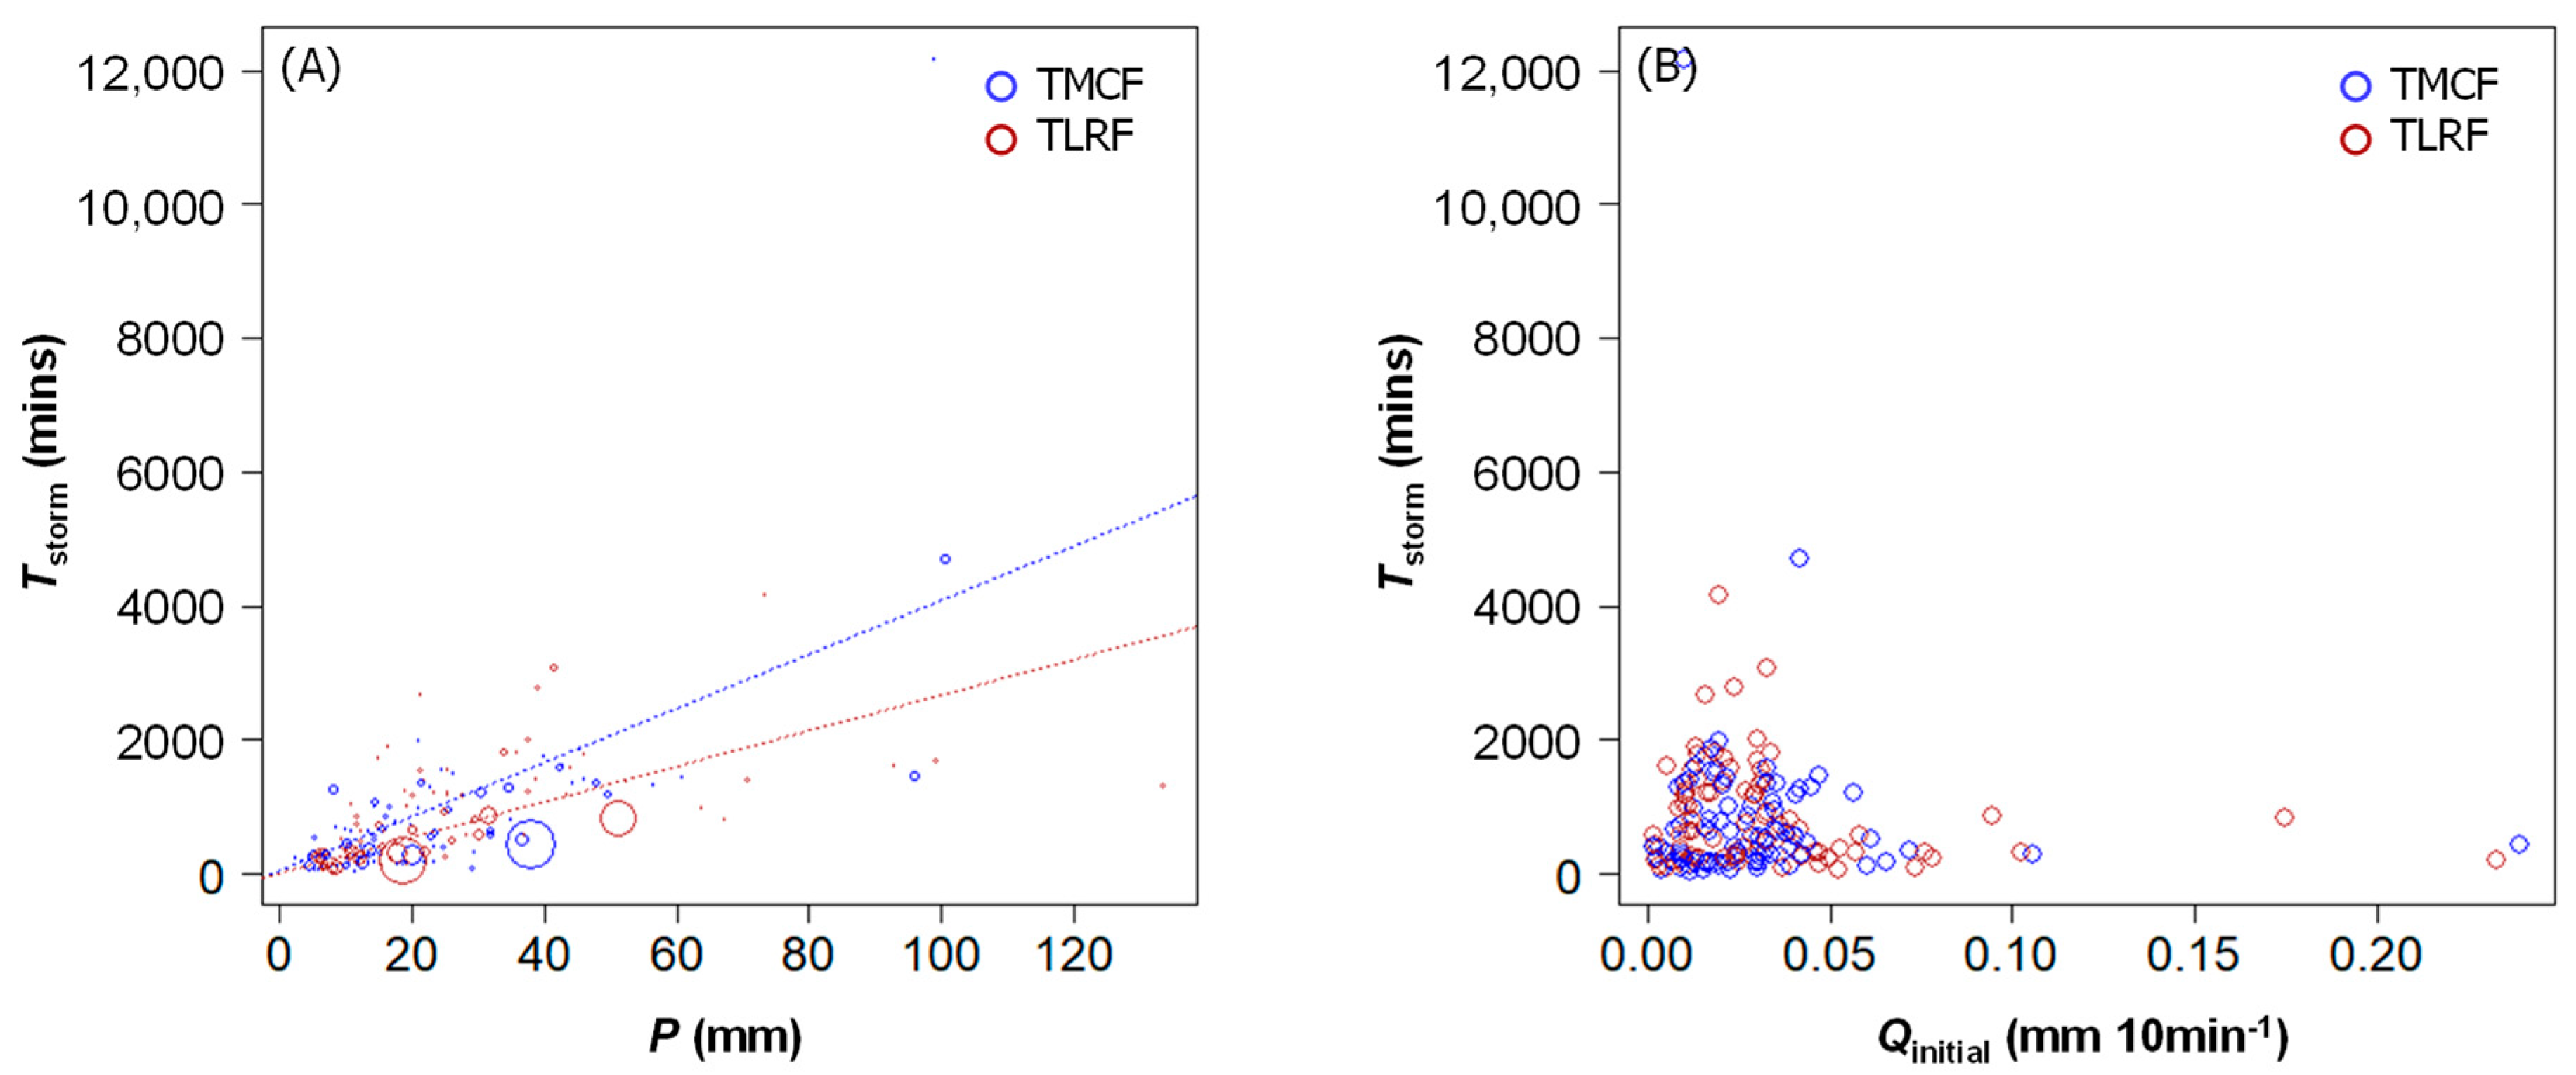
4.2.3. Duration of Stormflow

Tstorm in the TMCF was 11.34% longer than in the TLRF (p < 0.05; Figure 6). Tstorm had a weak relationship with Qinitial, but its inclusion improved model performance significantly (Table 4).

4.2.4. Baseflow

Both Qinitial and Qbase can be surrogates for baseflow in different aspects. Qinitial represents baseflow in general while Qbase is the theoretically-defined baseflow during a storm event. The GLM for Qbase was improved by including Qinitial as a secondary predictor (Table 4, Figure 7). Naturally, Qinitial had no relationship with event rainfall. Instead, the antecedent precipitation indices especially API20, API10, and API7 (in decreasing order) had strong predictive ability over Qinitial (p < 0.05, Table 4). Qbase was not statistically significantly different between the TMCF and the TLRF.
Based on the multivariate regression coefficients in Table 4, response variables/hydrograph metrices were computed (Table 5). Differences between computed hydrograph metrices in Table 5 and observed hydrograph metrices in Table 3 are discussed in later sections.

5. Discussion

Storm-event discharge in the TMCF was higher than in the TLRF. Total storm-event discharge (Qtot) had a higher coefficient of determination than Qstorm and was more parsimonious (requiring only precipitation as input) and therefore, should be the preferred parameter for comparison of runoff (Table 4). The 97% higher Qtot in the TMCF is in-line with other studies [15,21,22,37], and is attributed to high moisture and saturated conditions. Qstorm, an arbitrarily defined stormflow had slightly lower, but nevertheless strong, coefficient of determination (R2 = 0.820) when including rainfall intensity as a secondary predictor. Qstorm was 422% greater in the TMCF compared to the TLRF. The jump from 97% to 422% upon removal of theoretical baseflow (Qbase) may indicate that baseflow constituted a larger proportion of runoff in the TMCF than in the TLRF. Following this, an auxiliary investigation was performed to ascertain the effects of Pi on Qstorm in the TMCF and the TLRF, individually. Results show that Qstorm was significantly correlated to Pi in the TMCF (p < 0.05) but not in the TLRF (p < 0.05). This may reflect the sensitive nature of saturated conditions and high baseflow towards changes in rainfall intensity in the TMCF [38,39,40,41]. Considering that the GLM was used to control for the influence of rainfall, differences between observed data (Qtot in TMCF = 169.3% higher, Qstorm in TMCF = 381.75% higher) and GLM-computed hydrograph metrices (Qtot in TMCF = 97.19% higher, Qstorm in TMCF = 422.04% higher) can be considered to be caused by rainfall.
Tpeak and Tres were longer in the TMCF despite its steeper terrain and saturated conditions. Drivers of flashiness include meteorological, topographical, soil, and vegetation properties; thus, it is difficult to attribute flashiness to any single factor. It may be hypothesised that the TMCF had a longer response time because of its relatively wide and short catchment dimension compared to the TLRF that is narrow and long [42]. For first-order headwater catchments (present study), we postulate the following mechanism: in a wide and short catchment (in this case, the TMCF), rainwater takes longer to reach the stream because of longer travel paths along the slopes, and it may infiltrate and become slower-moving subsurface flow when flowing down a long slope. In a narrow and long catchment (in this case, the TLRF) however, rainwater arrives at the stream much faster as it travels a shorter distance. In addition, a higher proportion of rainwater falls directly into the stream and onto banksides where it ends up as direct runoff—contrasting with wide catchments where rain falls further upslope, undergoes infiltration, and ends up as slow-moving subsurface flow. If proven true, this mechanism seems to have overridden other drivers of flashiness in the TMCF, namely steeper catchment gradient, saturated conditions, clayey soils, and low hydraulic conductance [42]. Subsequently, this mechanism may also explain the longer persistence of stormflow in the TMCF (Tstorm), whereby in a wider catchment, longer time is required for the cessation of surface runoff into the stream [43,44]. Although the proposed mechanism is yet to be substantiated, what is certain is that differences in moisture, alone, may not be enough to overrule topographical factors in governing streamflow flashiness [45]. Compared to the GLM-computed hydrograph metrices (Table 5), observed data were higher (Table 3), which may be attributed to differences in rainfall, rainfall intensity, and antecedent moisture.
These arguments seem to differ from existing theories on the relationship between flashiness and catchment dimensions [42,46]. Following some past studies, a broad-fan watershed results in a flashier hydrograph (high peak discharge) because the entire catchment channels runoff water to the main stream almost simultaneously [42,46]. Streams in a narrow, long-fan watershed receive runoff input at different times over a prolonged period, resulting in a gentle rising limb. These theories were based on morphologies in higher-order catchments that nest several contributing tributaries, rendering them questionable in our single-stream, flashy headwater catchments. In addition, the default indicator for flashiness in such scenarios is often peak discharge alone. In this study, we have assessed not only peak discharge but also considered the response time (Tres) and time-to-peak (Tpeak) in first-order headwater catchments.
More common flashiness metrices, namely peak discharge (Qpeak and Qpeakadj), were also assessed in this study. Qpeak and Qpeakadj in the TMCF were higher than in the TLRF despite average rain intensity (Pi) being 40% lower. Although the response time and time-to-peak may be long due to the wide catchment dimensions, higher Qpeak and Qpeakadj may be explained by runoff water being fed into a shorter stream. Catchment dimensions aside, the saturated conditions in the TMCF may have exacerbated direct runoff and reduced infiltration into the subsurface [15,37]. Comparison of Qpeak between the data (TMCF 657% higher than TLRF) and GLM results (TMCF 48% higher than TLRF) show that rainfall and rainfall intensity may explain up to 6x the differences in peak discharge between the TMCF and the TLRF (Table 3).
By controlling for the effects of rainfall and Qinitial, no significant differences were found in Qbase between the TMCF and the TLRF. However, when referring to the data itself (without GLMs), Qbase in the TMCF was 36.69% higher, which can be attributed to higher rainfall input and catchment moisture. Qbase in both catchments was strongly influenced by event rainfall and Qinitial. The fact that event rainfall significantly affected baseflow in the hydrograph shows that rainfall input still contributes to infiltration and baseflow even when stormflow is being generated [47,48]. Although this method of hydrograph-partitioning is arbitrary and may not be appropriate for exact quantification of flow components (baseflow and stormflow), it is straightforward and efficient for the purpose of comparison between catchments, as demonstrated in past studies [13,17,35]. By applying a common line-partitioning rule, the shape of the hydrograph (peaky with short duration or gradual with long duration, and the proportion of hydrograph above and below the separation line) are governed by collective catchment characteristics, i.e., more direct runoff and high catchment gradient will result in a peaky hydrograph; more infiltration will result in a gradual-slope hydrograph. The higher Qinitial in the TMCF reflects its wetter environment and Qinitial in both catchments depended strongly on antecedent precipitation.

6. Conclusions

By comparing rainfall and stream discharge data between a tropical montane cloud forest (TMCF) and a tropical lowland rainforest (TLRF) catchment, we found differences in the following hydrological characteristics:
  • Storm-event water yield was up to 169% higher in the TMCF compared to the TLRF. This is attributed to higher moisture in the TMCF.
  • The TMCF had 6.6x higher peak discharge than the TLRF, but it took up to 77% longer to reach peak discharge. Additionally, it took 55% longer for the stream in the TMCF to respond to rainfall input. Time-to-peak was significantly influenced by rainfall intensity and antecedent rainfall (API15); stream response time towards rainfall was significantly influenced by rainfall intensity. Catchment dimensions and topography may overrule the influence of rainfall, moisture, gradient, and soil type.
  • Antecedent precipitation (API20, API 10, and API 7) directly correlated to baseflow and affected catchment moisture conditions, which in-turn governed the duration of stormflow—storms in the TMCF lasted 11% longer than in the TLRF. The only hydrograph characteristic that was directly controlled by antecedent precipitation was the time-to-peak, but there was no significant difference in time-to-peak between the TMCF and the TLRF.
This has led to the conclusion that headwater catchments in TMCFs have higher water yield but may not be necessarily flashier compared TLRF catchments. Flashiness may be governed by topographical factors and catchment dimensions. Stormflow duration also lasted longer in the TMCF and was strongly correlated to antecedent precipitation. Although water yield was higher in the TMCF, comparing flashiness proved to be a challenge due to natural differences in catchment dimensions. Additionally, we were unable to compute runoff coefficients due to data-gap logistical challenges. Plans for future investigations include measurements of solar irradiance, sapflux, soil moisture, and the water table to ascertain differences in aboveground and belowground hydrological dynamics in the TMCF.

Author Contributions

Conceptualization, A.N., M.M. and K.K.; methodology, A.N., M.M. and K.K.; software, A.N., M.M. and K.K.; validation, A.N., M.M., K.B. and K.K.; formal analysis, A.N. and M.M.; investigation, A.N., M.M., K.U.K., N.A.B., L.M., V.T.J., F.C., K.B. and K.K.; resources, M.M. and K.K.; data curation, A.N., M.M. and K.K.; writing—original draft preparation, A.N.; writing—review and editing, A.N.; visualization, A.N.; supervision, M.M. and K.K.; project administration, M.M. and A.N.; funding acquisition, M.M. and K.K. All authors have read and agreed to the published version of the manuscript.

Funding

This project was funded by the Universiti Malaysia Sabah internal grant (UMS SBK0373) and the Japan International Cooperation Agency—Bornean Biodiversity and Ecosystems Conservation II (JICA-BBEC II). Cost of publication was borne by the Research Management Centre, Universiti Malaysia Sabah.

Data Availability Statement

Available upon request.

Acknowledgments

The authors thank the Crocker Range Park Permanent Research Plot Committee, rangers, and research assistants of Sabah Parks for establishing and maintaining the research area. A special mention for Rozaidi Hassan from the Universiti Malaysia Sabah for establishing and maintaining the data collection systems and Nermala for support in laboratory equipment.

Conflicts of Interest

The authors declare no conflict of interest. The funders had no role in the design of the study; in the collection, analyses, or interpretation of data; in the writing of the manuscript, or in the decision to publish the results.

Appendix A

Hydro.
Component
Metric.Descrip.
Stats.
From Data
TLRFTMCF
RunoffQtotSum306.71825.99
(mm)Mean4.29.08
Max40.63143.93
Min0.030.1
QstormSum117.99568.43
(mm)Mean1.626.25
Max18.14126.97
Min00.01
ResponsivenessQpeakSum9.690.64
(mm 10min−1)Mean0.131
Max1.1823.74
Min00.01
TresSum17007350
(mins)Mean2381
Max470570
Min00
TpeakSum658015,710
(mins)Mean90173
Max8102060
Min2030
BaseflowQinitialSum1.9213.039
(mm 10min−1)Mean0.0260.033
Max0.0950.239
Min0.0020.007
QbaseSum190.64260.59
(mm)Mean2.612.86
Max22.5316.97
Min0.030.1
Storm durationTstormSum56,09084,370
(mins)Mean768927
Max470012,160
Min4050

References

  1. Bidin, K.; Douglas, I.; Greer, T. Dynamic response of subsurface water levels in a zero- order tropical rainforest basin, Sabah, Malaysia. In Hydrology of Warm Humid Regions: Proceedings of an International Symposium Held at Yokohama, Japan, 13–15 July 1993; IAHS Publication: Wallingford, UK, 1993; pp. 491–496. [Google Scholar]
  2. Chappell, N.A.; Tych, W.; Chotai, A.; Bidin, K.; Sinun, W.; Chiew, T.H. BARUMODEL: Combined data based mechanistic models of runoff response in a managed rainforest catchment. For. Ecol. Manag. 2006, 224, 58–80. [Google Scholar] [CrossRef]
  3. Mohamad, N.A.; Annammala, K.V.; Jamal, M.H.; Yusop, Z.; Sugumaran, D.; Nainar, A. Accelerated soil erosion in cultivated highlands in Tropics: In situ measurement using laser erosion bridge method. J. Water Clim. Chang. 2019; in press. [Google Scholar]
  4. Annammala, K.V.; Mohamad, N.A.; Sugumaran, D.; Masilamani, L.S.; Liang, Y.Q.; Jamal, M.H.; Yusop, Z.; Yusoff, A.R.M.; Nainar, A. Sediment clues in flood mitigation: The key to determining the origin, transport, and degree of heavy metal contamination. Hydrol. Res. 2021, 52, 91–106. [Google Scholar] [CrossRef]
  5. Douglas, I.; Spencer, T.; Greer, T.; Bidin, K.; Sinun, W.; Meng, W.W. The impact of selective commercial logging on stream hydrology, chemistry and sediment loads in the Ulu Segama rain forest, Sabah, Malaysia. Philos. Trans. R. Soc. B 1992, 335, 397–406. [Google Scholar]
  6. Sammori, T.; Yusop, Z.; Kasran, B.; Noguchi, S.; Tani, M. Suspended solids discharge from a small forested basin in the humid tropics. Hydrol. Process. 2004, 18, 721–738. [Google Scholar] [CrossRef]
  7. Zuecco, G.; Penna, D.; Borga, M.; van Meerveld, H.J. A versatile index to characterize hysteresis between hydrological variables at the runoff event timescale. Hydrol. Process. 2016, 30, 1449–1466. [Google Scholar] [CrossRef]
  8. Ziegler, A.D.; Benner, S.G.; Tantasirin, C.; Wood, S.H.; Sutherland, R.A.; Sidle, R.C.; Jachowski, N.; Nullet, M.A.; Xi, L.X.; Snidvongs, A.; et al. Turbidity-based sediment monitoring in northern Thailand: Hysteresis, variability, and uncertainty. J. Hydrol. 2014, 519, 2020–2039. [Google Scholar] [CrossRef]
  9. Aich, V.; Zimmermann, A.; Elsenbeer, H. Quantification and interpretation of suspended-sediment discharge hysteresis patterns: How much data do we need? Catena 2014, 122, 120–129. [Google Scholar] [CrossRef]
  10. Nainar, A.; Bidin, K.; Walsh, R.P.D.; Ewers, R.M.; Reynolds, G. Variations in suspended sediment yield and dynamics in catchments of differing land-use in Sabah. Trans. Sci. Technol. 2015, 2, 1–19. [Google Scholar]
  11. Nainar, A.; Bidin, K.; Walsh, R.P.D.; Ewers, R.M.; Reynolds, G. Effects of different land-use on suspended sediment dynamics in Sabah (Malaysian Borneo)—A view at the event and annual timescales. Hydrol. Res. Lett. 2017, 11, 79–84. [Google Scholar] [CrossRef]
  12. Shamsuddin, S.A.; Yusop, Z.; Noguchi, S. Influence of plantation establishment on discharge characteristics in a small catchment of tropical forest. Int. J. For. Res. 2014, 2014, 408409. [Google Scholar] [CrossRef]
  13. Nainar, A.; Tanaka, N.; Bidin, K.; Annammala, K.V.; Ewers, R.M.; Reynolds, G.; Walsh, R.P.D. Hydrological dynamics of tropical streams on a gradient of land-use disturbance and recovery: A multi-catchment experiment. J. Hydrol. 2018, 566, 581–594. [Google Scholar] [CrossRef]
  14. Muñoz-Villers, L.E.; McDonnell, J.J. Runoff generation in a steep, tropical montane cloud forest catchment on permeable volcanic substrate. Water Resour. Res. 2012, 48, 1–17. [Google Scholar] [CrossRef] [Green Version]
  15. Ramírez, B.H.; Teuling, A.J.; Ganzeveld, L.; Hegger, Z.; Leemans, R. Tropical Montane Cloud Forests: Hydrometeorological variability in three neighbouring catchments with different forest cover. J. Hydrol. 2017, 552, 151–167. [Google Scholar] [CrossRef]
  16. Mahali, M.; Kuraji, K.; Kamlun, K.U.; Bidin, K.; Nainar, A.; Repin, R.; Gunsalam, G.; Cleophas, F. Rainfall Characteristics in a Tropical Montane Cloud Forest, Gunung Alab, Crocker Range Park, Sabah, Malaysia. Trans. Sci. Technol. 2020, 7, 80–89. [Google Scholar]
  17. López-Ramírez, S.M.; Sáenz, L.; Mayer, A.; Muñoz-Villers, L.E.; Asbjornsen, H.; Berry, Z.C.; Looker, N.; Manson, R.; Gómez-Aguilar, L.R. Land use change effects on catchment streamflow response in a humid tropical montane cloud forest region, central Veracruz, Mexico. Hydrol. Process. 2020, 34, 3555–3570. [Google Scholar] [CrossRef]
  18. Tanaka, N.; Nainar, A.; Sato, T.; Kuraji, K. Decline in catchment evapotranspiration due to forest maturity: Another evidence from a Japanese catchment. In Geophysical Research Abstracts; Copernicus Publications: Vienna, Austria, 2019. [Google Scholar]
  19. Noz-Villers, L.E.M.; Mcdonnell, J.J. Land use change effects on runoff generation in a humid tropical montane cloud forest region. Hydrol. Earth Syst. Sci.-Discuss. 2013, 10, 5269–5314. [Google Scholar] [CrossRef]
  20. Jarvis, A.; Mulligan, M. The climate of cloud forests. Trop. Mont. Cloud For. Sci. Conserv. Manag. 2011, 343, 39–56. [Google Scholar] [CrossRef]
  21. Clark, K.E.; Torres, M.A.; West, A.J.; Hilton, R.G.; New, M.; Horwath, A.B.; Fisher, J.B.; Rapp, J.M.; Robles Caceres, A.; Malhi, Y. The hydrological regime of a forested tropical Andean catchment. Hydrol. Earth Syst. Sci. 2014, 18, 5377–5397. [Google Scholar] [CrossRef]
  22. Zadroga, F. The hidrological importance of a montane cloud forest area of Costa Rica. In Tropical Agricultural Hydrology. Watershed Management and Land Use; Lal, R., Ed.; Wiley: Hoboken, NJ, USA, 1981; pp. 59–73. ISBN 0471279315. [Google Scholar]
  23. Bruijnzeel, L.A.; Mulligan, M.; Scatena, F.N. Hydrometeorology of tropical montane cloud forests: Emerging patterns. Hydrol. Process. 2011, 25, 465–498. [Google Scholar] [CrossRef]
  24. Muñoz-Villers, L.E.; Mcdonnell, J.J. Interactive comment on “Land use change effects on runoff generation in a humid tropical montane cloud forest region”. Hydrol. Earth Syst. Sci. 2013, 10, 2369–2371. [Google Scholar]
  25. Muñoz-Villers, L.E.; McDonnell, J.J. Land use change effects on runoff generation in a humid tropical montane cloud forest region. Hydrol. Earth Syst. Sci. 2013, 17, 3543–3560. [Google Scholar] [CrossRef]
  26. Sabah Parks The Official Sabah Parks Website—Crocker Range Park. Available online: https://www.sabahparks.org.my/crocker-range-park (accessed on 31 August 2022).
  27. Directorate of Overseas Survey The Soils of Sabah, Kota Kinabalu, Soils Sheet (NB 50-10). Ordnance Survey. 2010. Available online: https://esdac.jrc.ec.europa.eu/images/Eudasm/Asia/images/maps/download/MY3007_5SO.jpg (accessed on 16 September 2022).
  28. Mojiol, A.R.I. Ecological Landuse Planning and Sustainable Management of Urban and Sub-Urban Green Areas in Kota Kinabalu, Malaysia; Cuvillier Verlag: Göttingen, Germany, 2006. [Google Scholar]
  29. Town and Regional Planning Department, S. Sabah Coastal Zone Profile 1998—3 CLIMATE (Part I). Available online: http://www.townplanning.sabah.gov.my/iczm/reports/Coastal (accessed on 7 November 2021).
  30. Nainar, A.; Majuakim, L.; Kuraji, K.; Justine, V.T.; Repin, R.; Lakim, M.; Hassan, R.; Mahali, M. Inobong Experimental Catchment (IEC). In Experimental Watershed and Weather Stations in Asian University Forests Consortium; Tanaka, N., Im, S., Lai, Y.-J., Tantasirin, C., Mahali, M., Zhang, H., Suryatmojo, H., Chandrathilake, T., Eds.; The University of Tokyo Forests Press: Tokyo, Japan, 2022; ISBN 4903321290. [Google Scholar]
  31. Nainar, A.; Majuakim, L.; Kuraji, K.; Justine, V.T.; Repin, R.; Lakim, M.; Hassan, R.; Mahali, M. Gunung Alab Experimental Catchment (GAEC). In Experimental Watershed and Weather Stations in Asian University Forests Consortium; Tanaka, N., Im, S., Lai, Y.-J., Tantasirin, C., Mahali, M., Zhang, H., Suryatmojo, H., Chandrathilake, T., Eds.; The University of Tokyo Forests Press: Tokyo, Japan, 2022; ISBN 4903321290. [Google Scholar]
  32. Permanent Research Plot Committee. Inobong Vegetation Survey; Unpublished data.
  33. Permanent Research Plot Committee. Vegetation Survey (Alab); Unpublished data; 2010. [Google Scholar]
  34. Repin, R.; Majuakim, L.; Suleiman, M.; Nilus, R.; Mujih, H.; Gunsalam, G. Checklist of trees in Crocker Range Park Permanent Research Plot, Sabah, Malaysia. J. Trop. Biol. Conserv. 2012, 9, 127–141. [Google Scholar]
  35. Nainar, A.; Tanaka, N.; Sato, T.; Mizuuchi, Y.; Kuraji, K. A comparison of hydrological characteristics between a cypress and mixed-broadleaf forest: Implication on water resource and floods. J. Hydrol. 2021, 595, 125679. [Google Scholar] [CrossRef]
  36. Nainar, A.; Kishimoto, K.; Takahashi, K.; Gomyo, M.; Kuraji, K. How Do Ground Litter and Canopy Regulate Surface Runoff?—A Paired-Plot Investigation after 80 Years of Broadleaf Forest Regeneration. Water 2021, 13, 1205. [Google Scholar] [CrossRef]
  37. Salinas, N.; Cosio, E.G.; Silman, M.; Meir, P.; Nottingham, A.T.; Roman-Cuesta, R.M.; Malhi, Y. Tropical Montane Forests in a Changing Environment. Front. Plant Sci. 2021, 12, 712748. [Google Scholar] [CrossRef]
  38. Tobón, C.; Bruijnzeel, L.A. Near-surface water fluxes and their controls in a sloping heterogeneously layered volcanic soil beneath a supra-wet tropical montane cloud forest (NW Costa Rica). Hydrol. Process. 2021, 35, e14426. [Google Scholar] [CrossRef]
  39. Fahey, T.J.; Sherman, R.E.; Tanner, E.V.J. Tropical montane cloud forest: Environmental drivers of vegetation structure and ecosystem function. J. Trop. Ecol. 2016, 32, 355–367. [Google Scholar] [CrossRef]
  40. Singh, N.K.; Emanuel, R.E.; McGlynn, B.L.; Miniat, C.F. Soil Moisture Responses to Rainfall: Implications for Runoff Generation. Water Resour. Res. 2021, 57, e2020WR028827. [Google Scholar] [CrossRef]
  41. Tao, Z.; Li, M.; Si, B.; Pratt, D. Rainfall intensity affects runoff responses in a semi-arid catchment. Hydrol. Process. 2021, 35, e14100. [Google Scholar] [CrossRef]
  42. Shaban, A.; Khawlie, M.; Abdallah, C.; Awad, M. Hydrological and watershed characteristics of the El-Kabir River, North Lebanon. Lakes Reserv. Res. Manag. 2005, 10, 93–101. [Google Scholar] [CrossRef]
  43. Nainar, A.; Tanaka, N.; Sato, T.; Kishimoto, K.; Kuraji, K. A comparison of the baseflow recession constant (K) between a Japanese cypress and mixed-broadleaf forest via six estimation methods. Sustain. Water Resour. Manag. 2021, 7, 1–13. [Google Scholar] [CrossRef]
  44. Nainar, A.; Tanaka, N.; Sato, T.; Kuraji, K. Comparing Runoff Characteristics between an Evergreen Cypress Forest and a Mixed-Broadleaf Forest during Different Phenological Periods in Central Japan; Copernicus Publications: Vienna, Austria, 2019; Volume 21, pp. 2019–4671. [Google Scholar]
  45. Zhang, X.; Hu, M.; Guo, X.; Yang, H.; Zhang, Z.; Zhang, K. Effects of topographic factors on runoff and soil loss in Southwest China. CATENA 2018, 160, 394–402. [Google Scholar] [CrossRef]
  46. Bonhomme, V.; Frelat, R.; Gaucherel, C. Application of elliptical Fourier analysis to watershed boundaries: A case study in Haiti. Géomorphologie Relief Processus Environ. 2013, 19, 17–26. [Google Scholar] [CrossRef]
  47. Guo, Y.; Liu, S.; Baetz, B.W. Probabilistic rainfall-runoff transformation considering both infiltration and saturation excess runoff generation processes. Water Resour. Res. 2012, 48, 1–17. [Google Scholar] [CrossRef]
  48. Stewart, R.D.; Bhaskar, A.S.; Parolari, A.J.; Herrmann, D.L.; Jian, J.; Schifman, L.A.; Shuster, W.D. An analytical approach to ascertain saturation-excess versus infiltration-excess overland flow in urban and reference landscapes. Hydrol. Process. 2019, 33, 3349–3363. [Google Scholar] [CrossRef]
Figure 1. Study area.
Hydrology 09 00162 g001
Figure 2. (A) Qtot and (B) Qstorm versus event rainfall. Increasing point size in (B) corresponds to increasing Pi.
Hydrology 09 00162 g002
Figure 3. (A) Qpeak and (B) Qpeakadj versus event rainfall. Increasing point size corresponds to increasing Pi.
Hydrology 09 00162 g003
Figure 4. (A) Tpeak versus event rainfall, increasing point size corresponds to increasing API15; (B) Tpeak versus secondary predictor (API15); (C) Tpeak versus rainfall, increasing point size corresponds to increasing Pi; and (D) Tpeak versus secondary predictor (Pi).
Hydrology 09 00162 g004
Figure 5. Tres versus Pi.
Hydrology 09 00162 g005
Figure 6. (A) Tstorm versus P. Increasing point size corresponds to increasing Qinitial and (B) Tstorm versus Qinitial.
Hydrology 09 00162 g006
Figure 7. (A) Qbase versus event rainfall; increasing point size corresponds to increasing Qinitial. (BD) Qinitial versus API20, API10, and API7, respectively.
Hydrology 09 00162 g007
Table 1. Proportion of slopes in the TMCF and the TLRF.
Slope(°)InobongAlab
Area (ha)Area (%)Area (ha)Area (%)
≤100.112.560.475.52
11–200.8620.001.3515.84
21–302.5459.073.8545.18
31–400.7116.512.7532.27
41–500.081.860.11.17
≥5000.000.0020.02
Table 2. Major species in the TMCF (Mount Alab) and the TLRF (Inobong).
Species
(TMCF, Mt. Alab)
Count
(Stem ha−1)
Total BA
(m2 ha−1)
Rel. Tree Density (%)Rel. BA
(%)
Rel. Dominance (%)
Dacrydium xanthandrum12011.030.4735.0017.73
Leptospermum flavescens808.580.3127.2213.77
Adinandra acuminata402.640.168.364.26
Lithocarpus bullatus401.520.164.832.49
Litsea cylindrocarpa2801.331.104.232.66
Myrsine sp. 2401.150.943.652.30
Tristaniopsis cf.obovata9600.663.762.082.92
Adinandra sp. 800.300.310.950.63
Magnolia carsonii2400.270.940.850.90
Melastoma sabahense2000.220.780.690.74
Species
(TLRF, Inobong)
Count
(Stem ha−1)
Total BA
(m2 ha−1)
Rel. Tree Density(%)Rel. BA
(%)
Rel. Dominance (%)
Crypteronia paniculata84.540.4917.448.97
Mallotus paniculatus2082.4912.789.5611.17
Ixonanthes reticulata41.830.257.043.64
Eugenia napiformis121.390.745.343.04
Macaranga triloba1721.3110.575.047.80
Macaranga gigantea881.295.414.955.18
Sandoricum koetjape41.240.254.752.50
Macaranga pearsonii840.925.163.544.35
Litsea sp.240.871.473.332.40
Metadina trichotoma40.610.252.331.29
Relative dominance was calculated by adding up relative tree density and relative BA, then dividing by 2. Source: [32,33,34].
Table 3. Comparison of hydrograph metrices between the TMCF and the TLRF.
Hydro. ComponentMetricFrom DataDifference
(%)
TLRFTMCF
Storm runoff
RunoffQtot (mm)306.714825.986169.30
Qstorm (mm)117.995568.434381.75
ResponsivenessQpeak (mm 10 min−1)0.1320.996657.11
Tres (mins)23.28880.769246.83
Tpeak (mins)90.137172.63791.53
BaseflowQinitial (mm 10 min−1)0.0260.03326.96
Qbase (mm)190.640260.59236.69
Stormflow durationTstorm (mins)768.356927.14320.67
Rainfall
RainfallP (mm)2083.5001893.000−9.14
Mean rain intensityPi (mm min−1)16.60410.008−39.73
Antecedent precipitationAPI112.5419.846−21.49
API335.25327.725−21.35
API556.59642.577−24.77
API783.43258.258−30.17
API10117.61082.769−29.62
API15175.349127.396−27.35
API20228.705163.016−28.72
Blue and red indicate higher and lower values in the TMCF, respectively, with reference to the TLRF.
Table 4. GLM Coefficients for various response variable (Y) against the main predictor (P), secondary predictors (Pi and ante), and forest type (1 for TMCF, 0 for TLRF) in their multivariate interaction.
YTLRF (Inobong)TMCF (Alab)GLM
Type
AICR2 adj.p
PPiP·PianteP·ante PPiP·PianteP·ante
abcdefa + a2b + b2c + c2d + d2e + e2f + f2
Qtot−0.1770.040 0.1530.066 Gam-log752.880.907<0.05
Qstorm−3.2530.0880.062−0.001 1.3160.087 Gam-log407.510.820<0.05
Qbase0.0440.069 2.647 i1.279 Gaus-iden709.470.624<0.05
Qinitial−5.235 0.006 20 4.159 0.004 Gam-log−940.970.935<0.05
Qpeak−3.3760.0260.015 3.0470.0790.016 Gam-log−235.940.751<0.05
Qpeakadj−4.4290.0360.032 3.4120.0880.015 Gam-log−333.410.714>0.05
Tstorm50.02722.008 −971.53 i182.24641.76346.231 −236.605 i151.82Gam-iden2394.80.579<0.05
Tpeak−11.8936.109 0.205 150.01747.344 Gam-iden1869.10.341<0.05
Tres0.018 Gam-inv578.49-<0.05
Qinitial−4.510 0.00610 4.017 Gam-log−920.230.926>0.05
Qinitial−4.409 0.0087 3.983 Gam-log−914.480.924>0.05
Tpeak4.3800.026−0.0520.00003 4.9740.0350.1220.001 Gam-log1734.60.999<0.05
Tres26.049 −0.170 100.741 1.825 Gam-iden571.530.023<0.05
Coefficients that are statistically significant (p < 0.05) are in bold. Non-significant variables were excluded in the stepwise-forward selection. ‘ante’ represents the various indices for antecedent moisture: superscripted i for Qinitial; superscripted numbers 7, 10, 15, 20 for API7, API10, API15, API20, respectively. Second part of the table show notable coefficients with predictive powers next to that of the main ones.
Table 5. GLM-computed hydrograph metrices in the TMCF and the TLRF.
Hydro. ComponentMetricComputed from GLMDifference
(%)
TLRFTMCF
Storm runoff
RunoffQtot (mm)70.419138.86197.19
Qstorm (mm)−23.62776.086422.04
ResponsivenessQpeak (mm 10 min−1)−2.385−1.24447.86
Tres (mins)23.22662.777170.28
Tpeak (mins)112.649153.62936.38
BaseflowQinitial (mm 10 min−1)−3.863−3.5079.21
Qbase (mm)224.247228.5821.93
Stormflow durationTstorm (mins)793.509883.50011.34
Tres did not have any significant relationship with P and thus regressed with the second covariate, Pi (significant relationship, p < 0.05).
Publisher’s Note: MDPI stays neutral with regard to jurisdictional claims in published maps and institutional affiliations.

