
Quo Vadis Lakes Azuei and Enriquillo: A Future Outlook for Two of the Caribbean Basin’s Largest Lakes


Abstract
1. Introduction
2. Materials and Methods
2.1. Simulation Scenarios
- A2 climate change scenario and no change in North Atlantic cyclones;
- A2 climate change scenario and change in North Atlantic cyclones;
- B2 climate change scenario and no change in North Atlantic cyclones;
- B2 climate change scenario and change in North Atlantic cyclones.
- B2 scenario without a change in cyclones;
- B2 scenario and +50% increase in cyclone frequency;
- B2 scenario and +20% increase in cyclone frequency;
- B2 scenario and −50% decrease in cyclone frequency;
- B2 scenario and −20% decrease in cyclone frequency;
- A2 scenario without change in cyclones;
- A2 scenario and +50% increase in cyclone frequency;
- A2 scenario and +20% increase in cyclone frequency;
- A2 scenario and −50% decrease in cyclone frequency;
- A2 scenario and −20% decrease in cyclone frequency;
- No climate change in future.
2.2. Model Setup
3. Results
4. Discussion
5. Future Outlook
Author Contributions
Funding
Institutional Review Board Statement
Informed Consent Statement
Data Availability Statement
Acknowledgments
Conflicts of Interest
References
- Kushner, J. The relentless rise of two Caribbean lakes baffles scientists. 2016. Available online: www.Nationalgeographic.com (accessed on 16 March 2016).
- Piasecki, M.; Moknatian, M.; Moshary, F.; Cleto, J.; Leon, Y.; Gonzalez, J.; Comarazamy, D. Bathymetric Survey for Lakes Azuei and Enriquillo, Hispaniola; CUNY Academic Works: New York, NY, USA, 2016. [Google Scholar]
- Sheller, M.; León, Y.M. Uneven socio-ecologies of Hispaniola: Asymmetric capabilities for climate adaptation in Haiti and the Dominican Republic. Geoforum 2016, 73, 32–46. [Google Scholar] [CrossRef]
- Angeles, M.E.; Gonzalez, J.E.; Erickson, D.J.; Hernández, J. An assessment of future Caribbean climate changes using the BAU scenario by coupling a global circulation model with a regional model. In Proceedings of the XVIII Conference on Climate Variability and Change, Atlanta, Georgia, 28 January 2006; p. 17. [Google Scholar]
- Comarazamy, D.E.; González, J.E. On the validation of the simulation of early season precipitation on the Island of Puerto Rico using a mesoscale atmospheric model. J. Hydrometeorol. 2008, 9, 507–520. [Google Scholar] [CrossRef]
- Singh, B. Climate-related global changes in the southern Caribbean: Trinidad and Tobago. Glob. Planet. Change 1997, 15, 93–111. [Google Scholar] [CrossRef]
- Peterson, T.C. Recent changes in climate extremes in the Caribbean region. J. Geophys. Res. 2002, 107, 4601. [Google Scholar] [CrossRef]
- Taylor, M.; Centella, A.; Charlery, J.; Borrajero, I.; Bezanilla, A.; Campbell, J.; Rivero, R.; Stephenson, T.S.; Whyte, F.; Watson, R. Glimpses of the future: A Briefing from the PRECIS Caribbean Climate Change Project; Climate Studies Group, Mona: Belmopan, Belize, 2007; ISBN 978-976-41-0212-0. [Google Scholar]
- Pulwarty, R.S.; Nurse, L.A.; Trotz, U.O. Caribbean islands in a changing climate. Environ. Sci. Policy Sustain. Dev. 2010, 52, 16–27. [Google Scholar] [CrossRef]
- Kerr, K.A. Capturing Recent Climate Variations in the Extreme Southern Caribbean with Projections for the Near and Medium Terms: A Downscaling Approach for Trinidad and Tobago. Master’s Thesis, Department of Meteorology, University of Reading, Reading, UK, 2012. [Google Scholar]
- Vinukollu, R.K.; Meynadier, R.; Sheffield, J.; Wood, E.F. Multi-model, multi-sensor estimates of global evapotranspiration: Climatology, uncertainties and trends. Hydrol. Process. 2011, 25, 3993–4010. [Google Scholar] [CrossRef]
- IPCC. Climate Change 2001: The Scientific Basis; Contribution of Working Group I to the Third Assessment Report of the Intergovernmental Panel on Climate Change; Houghton, J.T., Ding, Y., Griggs, D.J., Noguer, M., van der Linden, P.J., Dai, X., Maskell, K., Eds.; Cambridge University Press: Cambridge, UK; New York, NY, USA, 2001; ISBN 0521-01495-6. [Google Scholar]
- Mimura, N.; Nurs, L.; McLean, R.; Agard, J.; Briguglio, L.; Lefale, P.; Payet, R.; Sem, G. Small Islands; Climate Change 2007: Impacts, Adaptation and Vulnerability. Contribution of Working Group II to the Fourth Assessment Report of the Intergovernmental Panel on Climate Change; Parry, M.L., Canziani, O.F., Palutikof, J.P., van der Linden, P.J., Hanson, C.E., Eds.; Cambridge University Press: Cambridge, UK, 2007. [Google Scholar]
- United States Agency for International Development (USAID). Dominican Republic Climate Change Vulnerability Assessment: Executive Summary; USAID’ African and Latin American Resilience to Climate Change (ARCC) Project Report; USAID: Washington, DC, USA, 2013. [Google Scholar]
- Campbell, J.D.; Taylor, M.A.; Stephenson, T.S.; Watson, R.A.; Whyte, F.S. Future climate of the Caribbean from a regional climate model. Int. J. Climatol. 2011, 31, 1866–1878. [Google Scholar] [CrossRef]
- Moberg, A.; Jones, P.D. Regional climate model simulations of daily maximum and minimum near-surface temperatures across Europe compared with observed station data 1961–1990. Clim. Dyn. 2004, 23, 695–715. [Google Scholar] [CrossRef]
- Toggweiler, J.; Key, R. Ocean circulation: Thermohaline circulation. Encycl. Atmos. Sci. 2001, 4, 1549–1555. [Google Scholar]
- Tadross, M.; Jack, C.; Hewitson, B. On RCM-based projections of change in southern African summer climate. Geophys. Res. Lett. 2005, 32, L23713. [Google Scholar] [CrossRef]
- Moknatian, M.; Piasecki, M. Development of Predictive Models for Lakes Azuei and Enriquillo on the Island of Hispaniola. Hydrology 2021, in press. [Google Scholar]
- Knutson, T.R.; McBride, J.L.; Chan, J.; Emanuel, K.; Holland, G.; Landsea, C.; Held, I.; Kossin, J.P.; Srivastava, A.K.; Sugi, M. Tropical cyclones and climate change. Nat. Geosci. 2010, 3, 157–163. [Google Scholar] [CrossRef]
- Zappa, G.; Shaffrey, L.C.; Hodges, K.I.; Sansom, P.G.; Stephenson, D.B. A multimodel assessment of future projections of north atlantic and european extratropical cyclones in the CMIP5 climate models. J. Clim. 2013, 26, 5846–5862. [Google Scholar] [CrossRef]
- Knutson, T.R.; Sirutis, J.J.; Zhao, M.; Tuleya, R.E.; Bender, M.; Vecchi, G.A.; Villarini, G.; Chavas, D. Global projections of intense tropical cyclone activity for the late twenty-first century from dynamical downscaling of CMIP5/RCP4.5 scenarios. J. Clim. 2015, 28, 7203–7224. [Google Scholar] [CrossRef]
- Seitz, C. Estimatting the Effect of Clomate Change on Tropical Cyclone Activity. Master’s Thesis, Department of Earth, Ocean, and Atmospheric Sciences, Florida State University, College of Art and Science, Tallahassee, FL, USA, 2014. [Google Scholar]
- Christensen, J.H.; Kanikicharla, K.K.; Aldrian, E.; An, S.-I.; Cavalcanti, I.F.A.; de Castro, M.; Dong, W.; Goswami, P.; Hall, A.; Kanyanga, J.K.; et al. Climate Phenomena and their Relevance for Future Regional Climate Change; Climate Change 2013: The Physical Science Basis. Contribution of Working Group I to the Fifth Assessment Report of the Intergovernmental Panel on Climate Change; Stocker, T.F., Qin, D., Plattner, G.-K., Tignor, M., Allen, S.K., Boschung, J., Nauels, A., Xia, Y., Bex, V., Midgley, P.M., Eds.; Cambridge University Press: Cambridge, UK; New York, NY, USA, 2013. [Google Scholar]
- Walsh, K.J.E.; McBride, J.L.; Klotzbach, P.J.; Balachandran, S.; Camargo, S.J.; Holland, G.; Knutson, T.R.; Kossin, J.P.; Lee, T.; Sobel, A.; et al. Tropical cyclones and climate change. WIREs Clim. Chang. 2016, 7, 65–89. [Google Scholar] [CrossRef]
- Knutson, T.R.; Sirutis, J.J.; Vecchi, G.A.; Garner, S.; Zhao, M.; Kim, H.S.; Bender, M.; Tuleya, R.E.; Held, I.M.; Villarini, G. Dynamical downscaling projections of twenty-first-century atlantic hurricane activity: CMIP3 and CMIP5 model-based scenarios. J. Clim. 2013, 26, 6591–6617. [Google Scholar] [CrossRef]
- Karl, T.R.; Melillo, J.M.; Peterson, T.C. (Eds.) Global Climate Change Impacts in the United States; Cambridge University Press: Cambridge, UK; New York, NY, USA, 2009; ISBN 978-0-521-14407-0. [Google Scholar]
- Benjamin, L. Climate change and Caribbean small island states: The state of play. Int. J. Bahamian Stud. 2010, 16, 78–91. [Google Scholar] [CrossRef][Green Version]
- Kim, H.S.; Vecchi, G.A.; Knutson, T.R.; Anderson, W.G.; Delworth, T.L.; Rosati, A.; Zeng, F.; Zhao, M. Tropical cyclone simulation and response to CO2 doubling in the GFDL CM2.5 high-resolution coupled climate model. J. Clim. 2014, 27, 8034–8054. [Google Scholar] [CrossRef]
- Villarini, G.; Lavers, D.A.; Scoccimarro, E.; Zhao, M.; Wehner, M.F.; Vecchi, G.A.; Knutson, T.R.; Reed, K.A. Sensitivity of tropical cyclone rainfall to idealized global-scale forcings. J. Clim. 2014, 27, 4622–4641. [Google Scholar] [CrossRef]
- Scoccimarro, E.; Gualdi, S.; Villarini, G.; Vecchi, G.A.; Zhao, M.; Walsh, K.; Navarra, A. Intense precipitation events associated with landfalling tropical cyclones in response to a warmer climate and increased CO2. J. Clim. 2014, 27, 4642–4654. [Google Scholar] [CrossRef]
- IPCC. Summary for Policymakers. In Climate Change 2013: The Physical Science Basis; Contribution of Working Group I to the Fifth Assessment Report of the Intergovernmental Panel on Climate Change; Stocker, T.F., Qin, D., Plattner, G.-K., Tignor, M., Allen, S.K., Boschung, J., Nauels, A., Xia, Y., Bex, V., Midgley, P.M., Eds.; Cambridge University Press: Cambridge, UK; New York, NY, USA, 2013. [Google Scholar]
- IPCC. Summary for Policymakers. In A Special Report of IPCC Working Group III: Emissions Scenarios; Intergovernmental Panel on Climate Change: Geneva, Switzerland, 2000; ISBN 92-9169-113-5. [Google Scholar]
- Sood, A.; Muthuwatta, L.; McCartney, M. A SWAT evaluation of the effect of climate change on the hydrology of the Volta River basin. Water Int. 2013, 38, 297–311. [Google Scholar] [CrossRef]
- Pradhanang, S.M.; Mukundan, R.; Schneiderman, E.M.; Zion, M.S.; Anandhi, A.; Pierson, D.C.; Frei, A.; Easton, Z.M.; Fuka, D.; Steenhuis, T.S. Streamflow responses to climate change: Analysis of hydrologic indicators in a New York City water supply watershed. JAWRA J. Am. Water Resour. Assoc. 2013, 49, 1308–1326. [Google Scholar] [CrossRef]
- Abbaspour, K.C.; Faramarzi, M.; Ghasemi, S.S.; Yang, H. Assessing the impact of climate change on water resources in Iran. Water Resour. Res. 2009, 45, W10434. [Google Scholar] [CrossRef]
- Zahabiyoun, B.; Goodarzi, M.R.; Massah Bavani, A.R.; Azamathulla, H.M. Assessment of climate change impact on the Gharesou river basin using SWAT hydrological model. Clean Soil, Air Water 2013, 41, 601–609. [Google Scholar] [CrossRef]
- Luna, B.; Lacombe, G.; Gurung, P.; Jayakody, P.; Hoanh, C.T.; Smakhtin, V. The Impact of Water Infrastructure and Climate Change on the Hydrology of the Upper Ganges River Basin; IWMI Research Report 142; International Water Management Institute: Colombo, Sri Lanka, 2011; ISBN 978-92-9090-744-2. [Google Scholar]
- Liu, L.; Liu, Z.; Ren, X.; Fischer, T.; Xu, Y. Hydrological impacts of climate change in the Yellow River Basin for the 21st century using hydrological model and statistical downscaling model. Quat. Int. 2011, 244, 211–220. [Google Scholar] [CrossRef]
- Marshall, E.; Randhir, T. Effect of climate change on watershed system: A regional analysis. Clim. Change 2008, 89, 263–280. [Google Scholar] [CrossRef]
- Chen, H.; Xu, C.-Y.; Guo, S. Comparison and evaluation of multiple GCMs, statistical downscaling and hydrological models in the study of climate change impacts on runoff. J. Hydrol. 2012, 434–435, 36–45. [Google Scholar] [CrossRef]
- Xu, Z.X.; Zhao, F.F.; Li, J.Y. Response of streamflow to climate change in the headwater catchment of the Yellow River basin. Quat. Int. 2009, 208, 62–75. [Google Scholar] [CrossRef]
- Economic Commission for Latin America and the Caribbean (ECLAC). Project Document: An Assessment of the Economic and Social Impacts of Climate Change on the Water Sector in the Caribbean; United Nations: New York City, NY, USA, 2013. [Google Scholar]
- Moknatian, M.; Piasecki, M.; Gonzalez, J. Development of geospatial and temporal characteristics for Hispaniola’s Lake Azuei and Enriquillo using Landsat imagery. Remote Sens. 2017, 9, 510. [Google Scholar] [CrossRef]
- Moknatian, M.; Piasecki, M. Lake Volume Data Analyses: A Deep Look into the Shrinking and Expansion Patterns of Lakes Azuei and Enriquillo, Hispaniola. Hydrology 2019, 7, 1. [Google Scholar] [CrossRef]


| Simulation Scenarios | Lake Enriquillo | Lake Azuei | |||
|---|---|---|---|---|---|
| IPCC SRES | Change in TC Frequency | 2050 | 2100 | 2050 | 2100 |
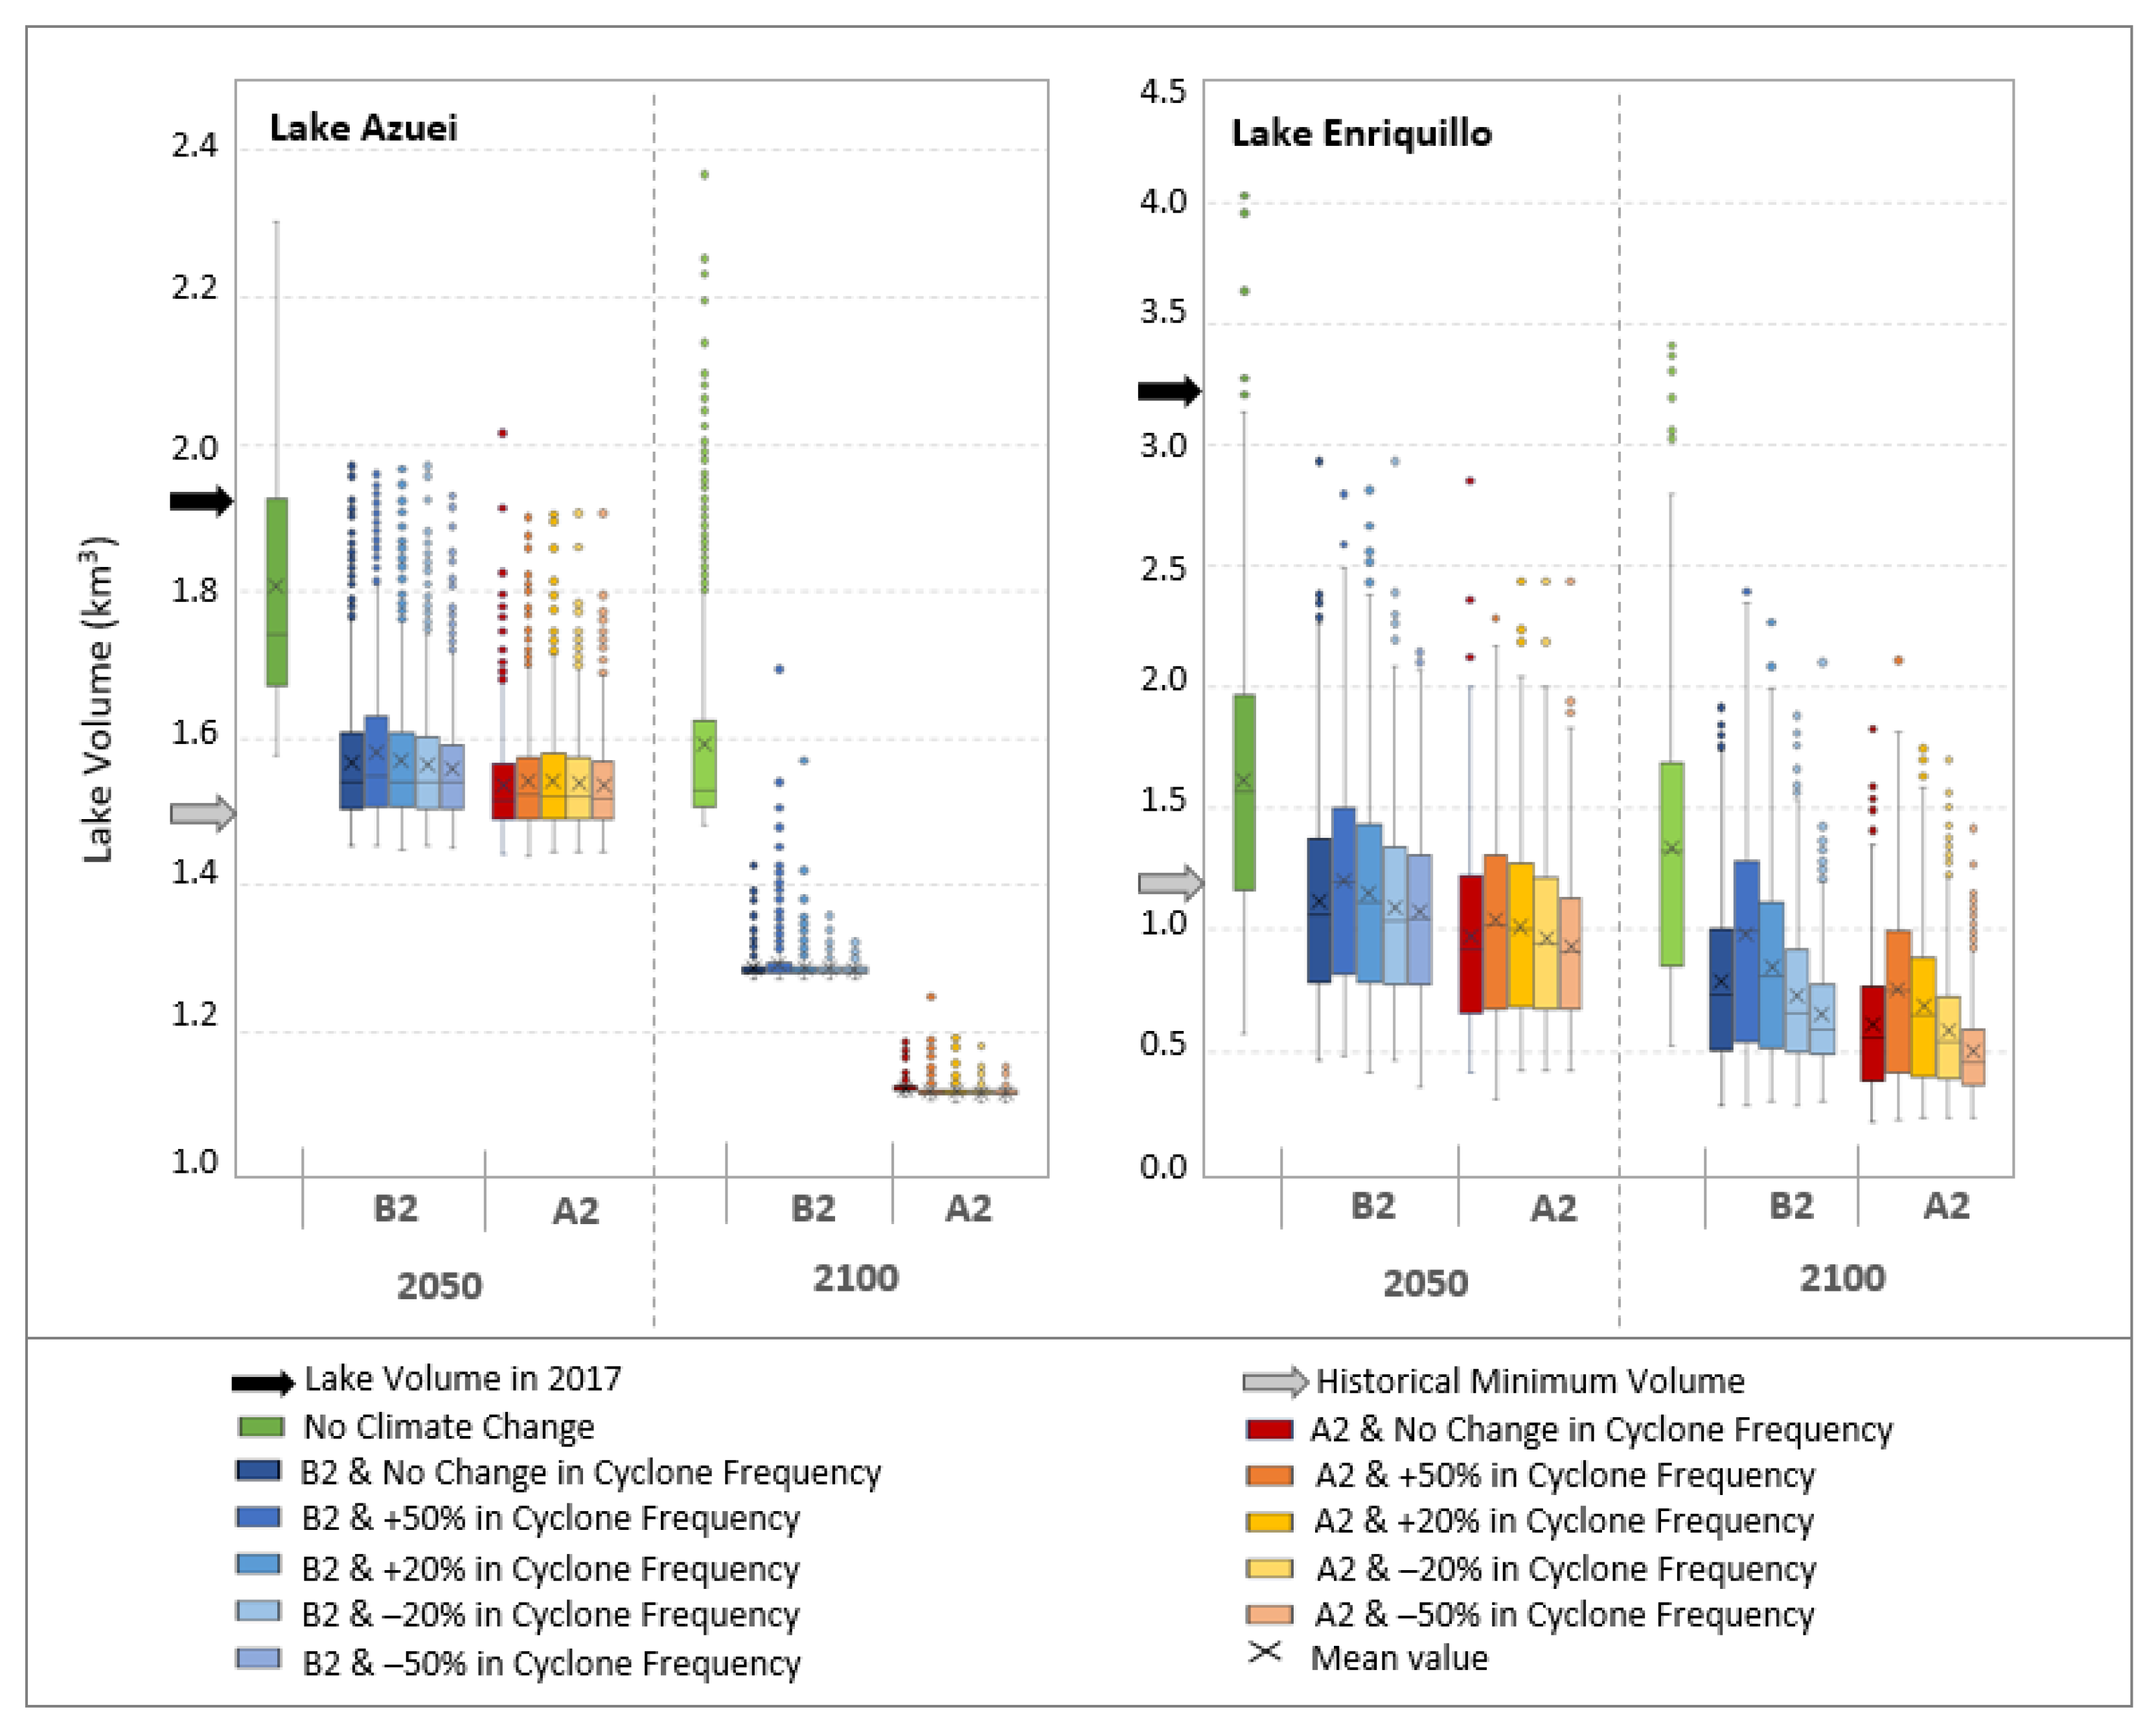
| None | None | 1.614 * [0.6 4.0] ** | 1.339 [0.5 3.4] | 1.807 [1.6 2.3] | 1.592 [1.5 2.4] |
| B2 | None | 1.120 [0.5 2.9] | 0.788 [0.3 1.9] | 1.568 [1.5 2.0] | 1.288 [1.3 1.4] |
| B2 | +50% | 1.203 [0.5 2.8] | 0.980 [0.3 2.4] | 1.581 [1.5 2.0] | 1.294 [1.3 1.7] |
| B2 | +20% | 1.150 [0.4 2.8] | 0.845 [0.3 2.3] | 1.569 [1.4 2.0] | 1.289 [1.3 1.6] |
| B2 | −20% | 1.095 [0.5 2.9] | 0.732 [0.3 1.9] | 1.564 [1.5 2.0] | 1.287 [1.3 1.4] |
| B2 | −50% | 1.072 [0.4 2.1] | 0.651 [0.3 2.1] | 1.560 [1.5 1.9] | 1.286 [1.3 1.3] |
| A2 | None | 0.970 [0.4 2.9] | 0.607 [0.2 1.8] | 1.536 [1.4 2.0] | 1.125 [1.1 1.2] |
| A2 | +50% | 1.037 [0.3 2.3] | 0.757 [0.2 2.1] | 1.543 [1.4 1.9] | 1.120 [1.1 1.2] |
| A2 | +20% | 1.011 [0.3 2.4] | 0.683 [0.2 1.7] | 1.543 [1.4 1.9] | 1.119 [1.1 1.2] |
| A2 | −20% | 0.968 [0.3 2.4] | 0.581 [0.2 1.7] | 1.539 [1.4 1.9] | 1.119 [1.1 1.2] |
| A2 | −50% | 0.933 [0.3 2.4] | 0.503 [0.2 1.4] | 1.536 [1.4 1.9] | 1.118 [1.1 1.2] |
| Lake Enriquillo | Lake Azuei | ||||||
|---|---|---|---|---|---|---|---|
| Scenarios | Average | Min | Max | Average | Min | Max | |
| 2050 | No Climate Change | −39.20 ↓ | −46.19 ↓ | −30.95 ↑ | 21.51 ↓ | 19.64 ↓ | 25.08 ↑ |
| IPCC B2 SRES | −39.42 ↓ | −49.06 ↓ | −34.25 ↓ | 19.55 ↓ | 18.50 ↓ | 22.77 ↓ | |
| IPCC A2 SRES | −39.56 ↓ | −49.88 ↓ | −34.51 ↓ | 19.30 ↓ | 18.43 ↓ | 23.08 ↓ | |
| 2100 | No Climate Change | −40.60 ↓ | −46.82 ↓ | −32.74 ↑ | 19.75 ↓ | 18.80 ↓ | 25.53 ↑ |
| IPCC B2 SRES | −40.88 ↓ | −50.45 ↓ | −36.07 ↓ | 17.00 ↓ | 16.85 ↓ | 20.61 ↓ | |
| IPCC A2 SRES | −41.88 ↓ | −51.91 ↓ | −37.02 ↓ | 15.30 ↓ | 15.16 ↓ | 16.62 ↓ | |
Publisher’s Note: MDPI stays neutral with regard to jurisdictional claims in published maps and institutional affiliations. |
© 2021 by the authors. Licensee MDPI, Basel, Switzerland. This article is an open access article distributed under the terms and conditions of the Creative Commons Attribution (CC BY) license (https://creativecommons.org/licenses/by/4.0/).
Share and Cite
Moknatian, M.; Piasecki, M. Quo Vadis Lakes Azuei and Enriquillo: A Future Outlook for Two of the Caribbean Basin’s Largest Lakes. Hydrology 2021, 8, 107. https://doi.org/10.3390/hydrology8030107
Moknatian M, Piasecki M. Quo Vadis Lakes Azuei and Enriquillo: A Future Outlook for Two of the Caribbean Basin’s Largest Lakes. Hydrology. 2021; 8(3):107. https://doi.org/10.3390/hydrology8030107
Chicago/Turabian StyleMoknatian, Mahrokh, and Michael Piasecki. 2021. "Quo Vadis Lakes Azuei and Enriquillo: A Future Outlook for Two of the Caribbean Basin’s Largest Lakes" Hydrology 8, no. 3: 107. https://doi.org/10.3390/hydrology8030107
APA StyleMoknatian, M., & Piasecki, M. (2021). Quo Vadis Lakes Azuei and Enriquillo: A Future Outlook for Two of the Caribbean Basin’s Largest Lakes. Hydrology, 8(3), 107. https://doi.org/10.3390/hydrology8030107