
Groundwater Origin and Dynamics on the Eastern Flank of the Colorado River Delta, Mexico


Abstract
1. Introduction
2. Materials and Methods
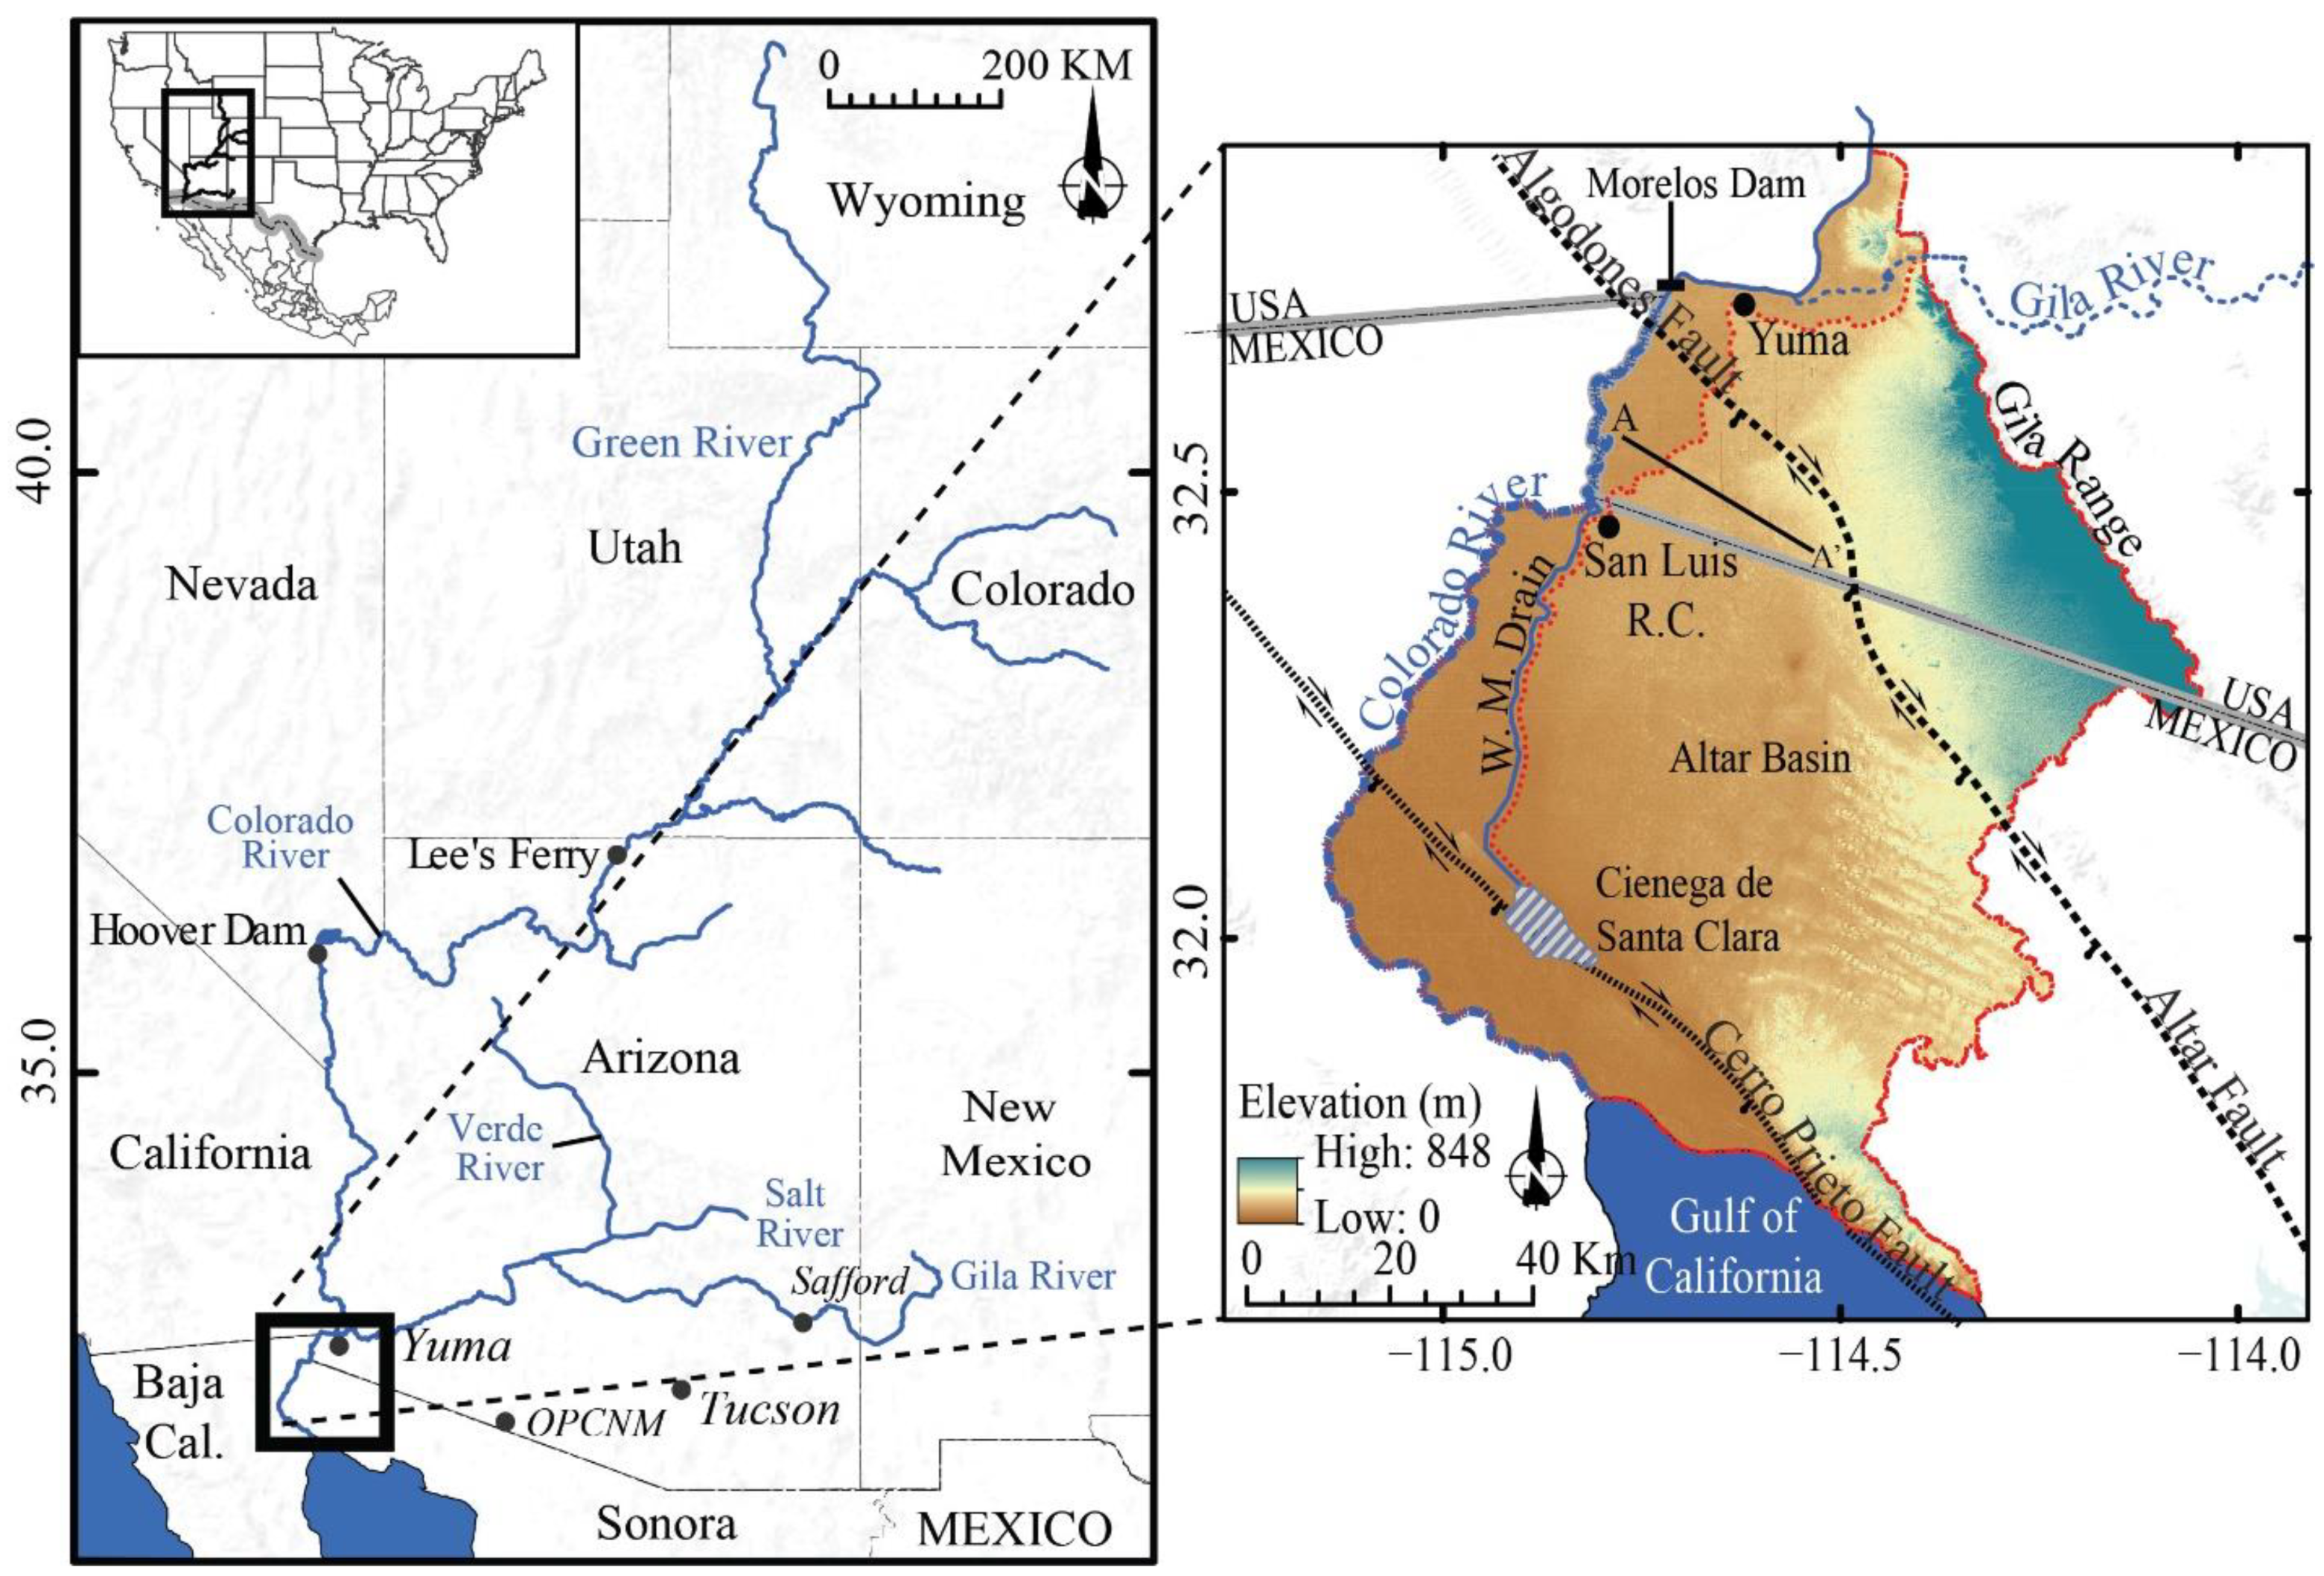
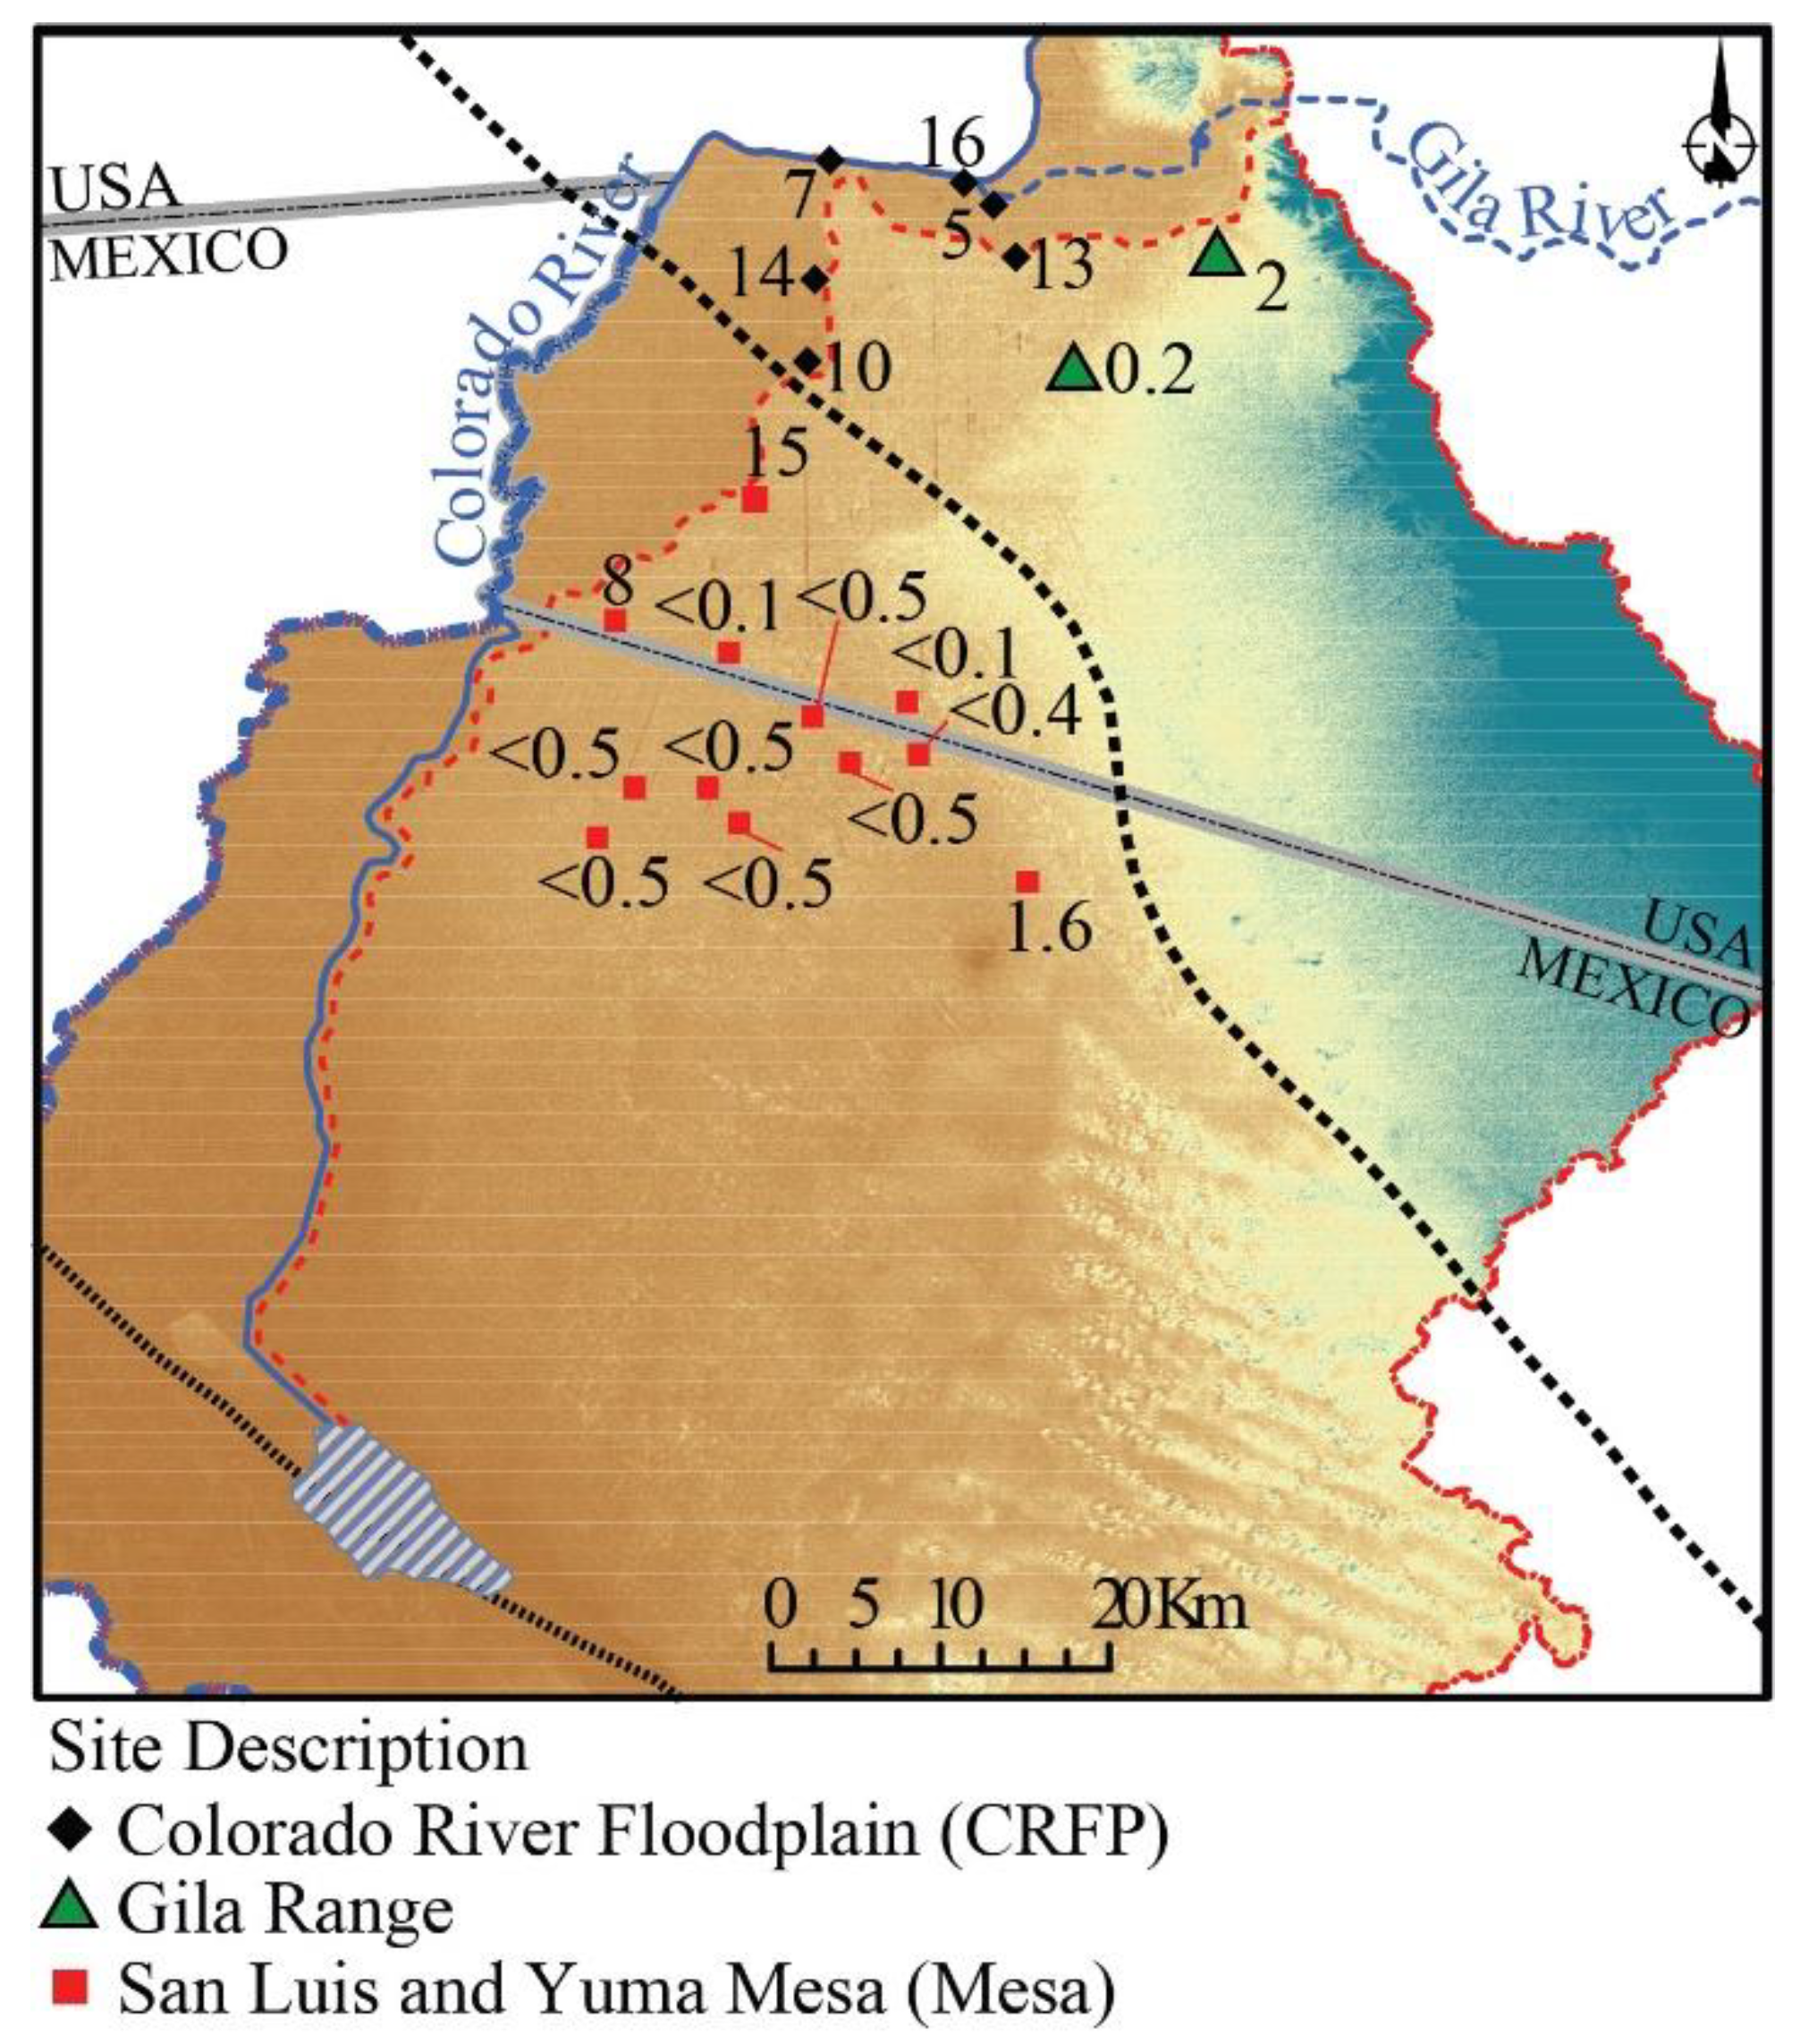
2.1. Study Area
2.1.1. Geography
2.1.2. Climate
2.1.3. Geology
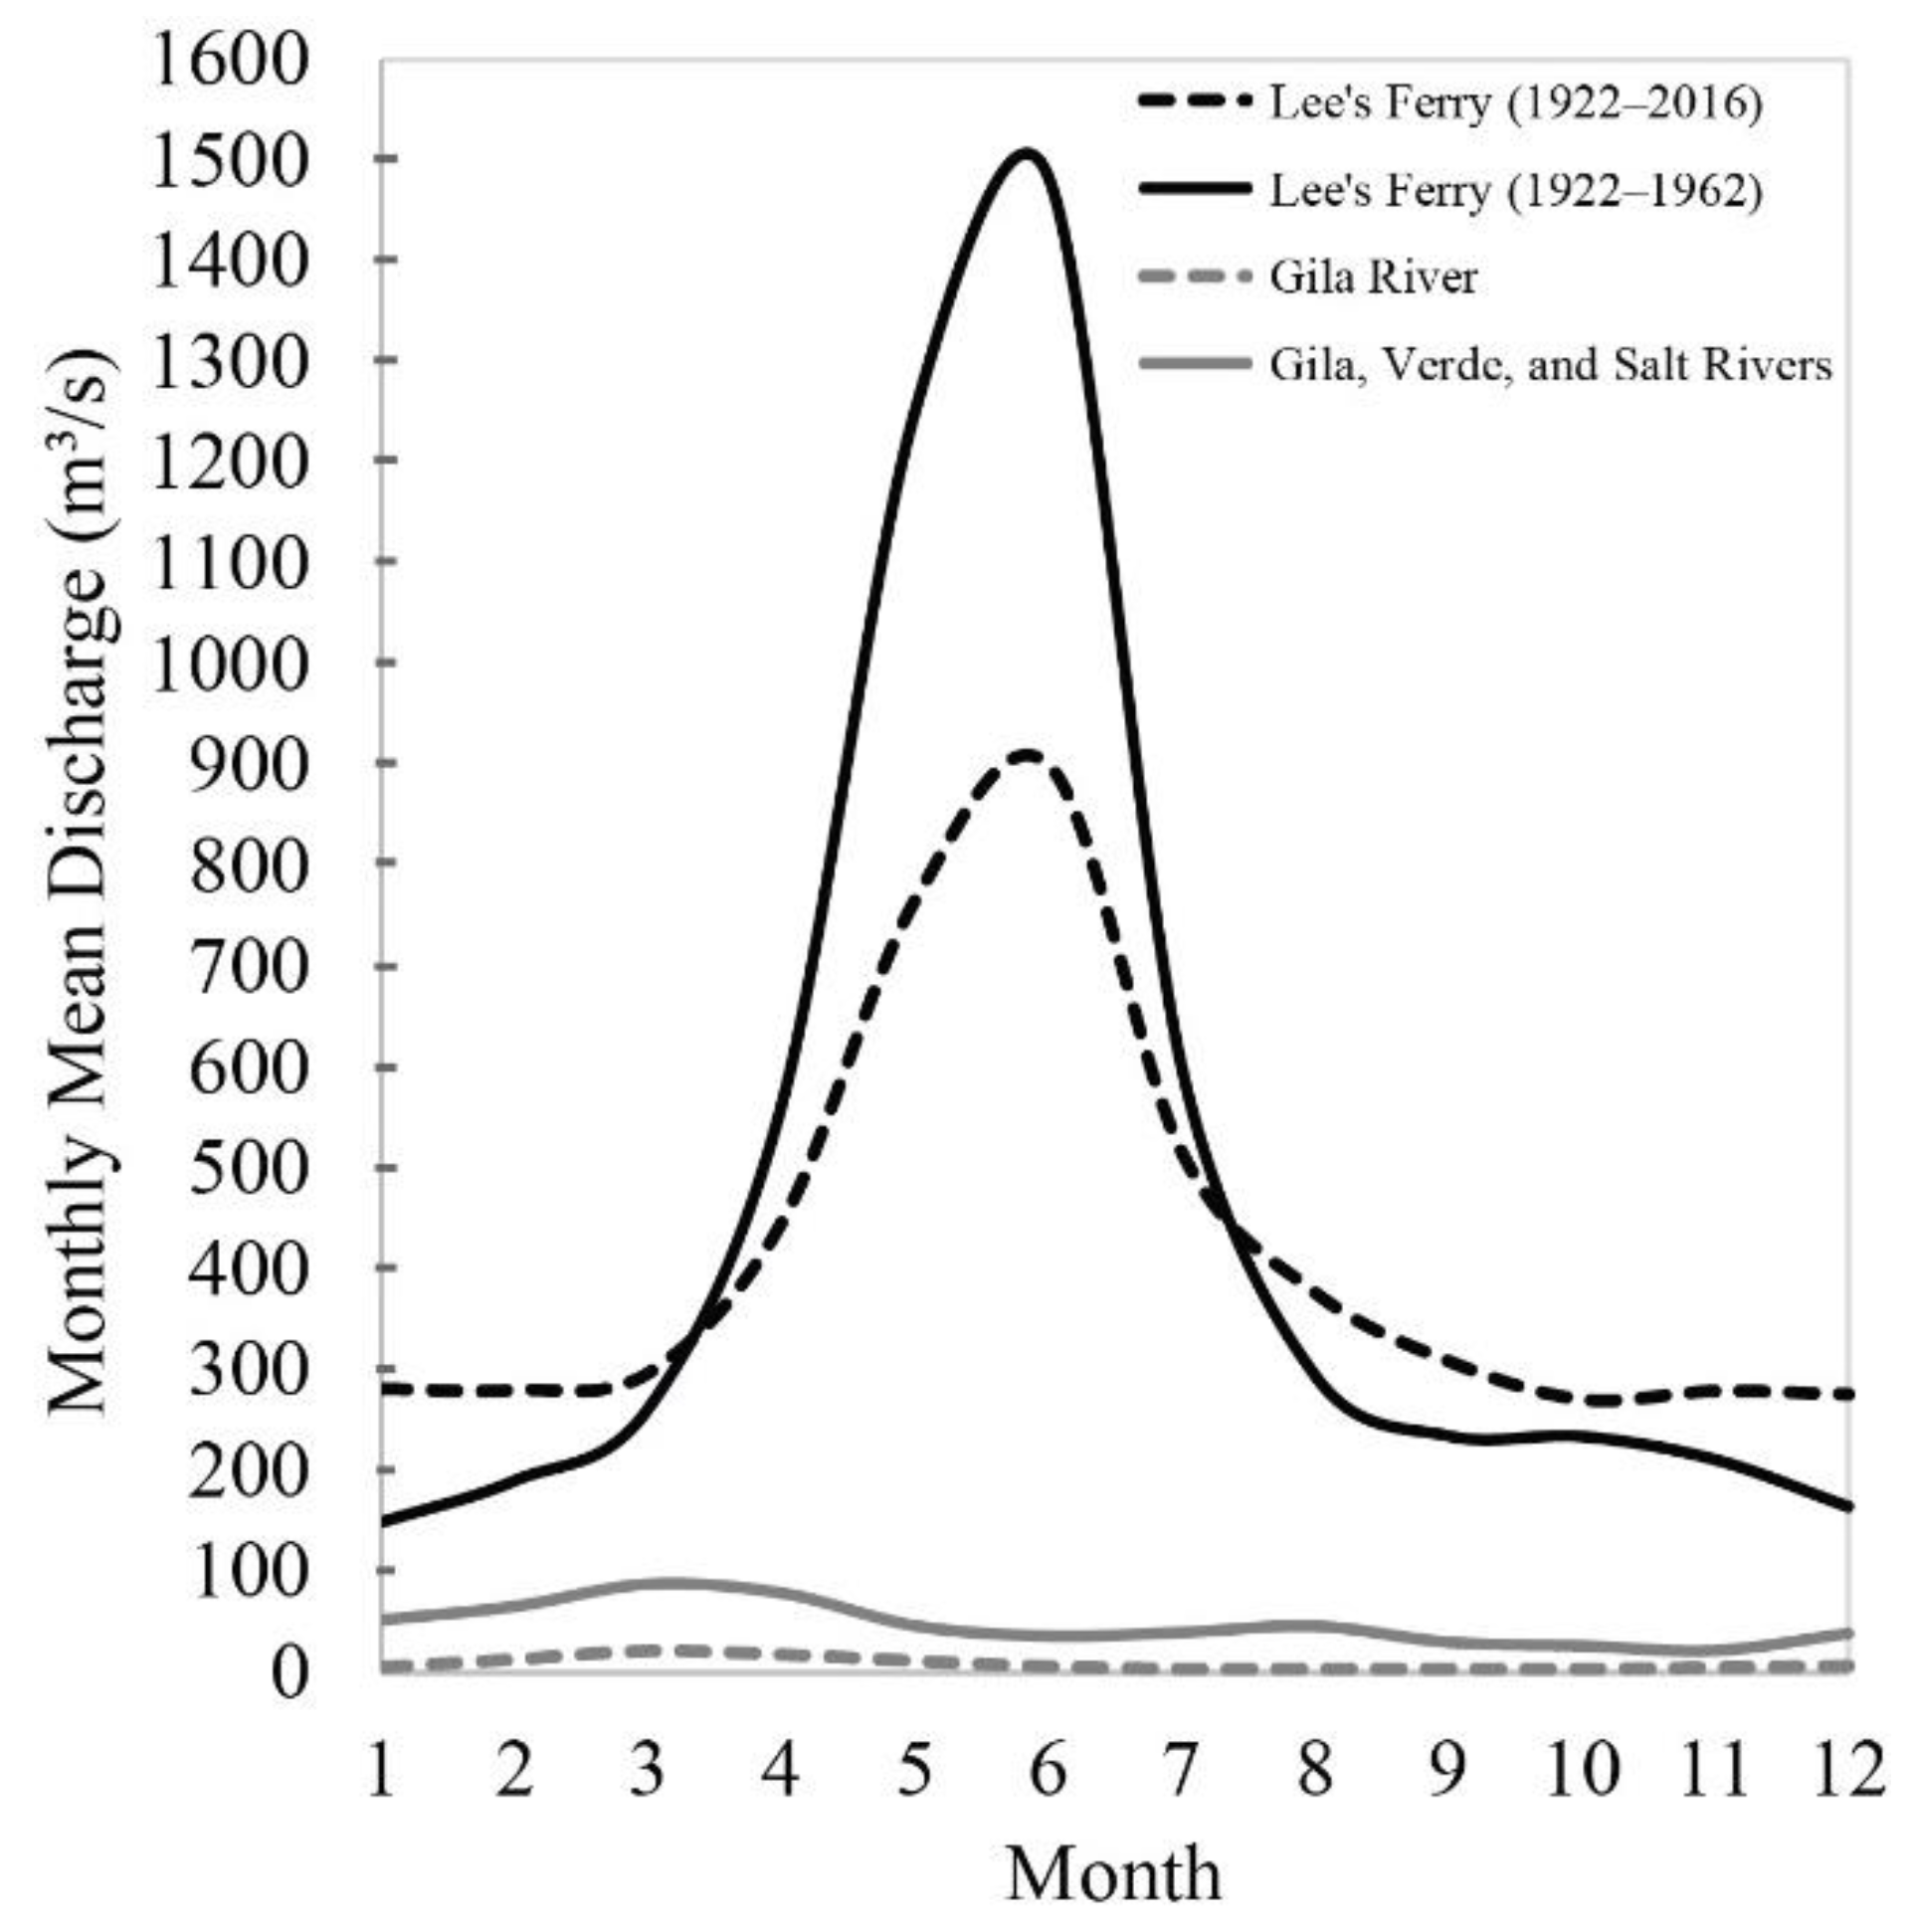
2.1.4. Colorado and Gila River Discharge
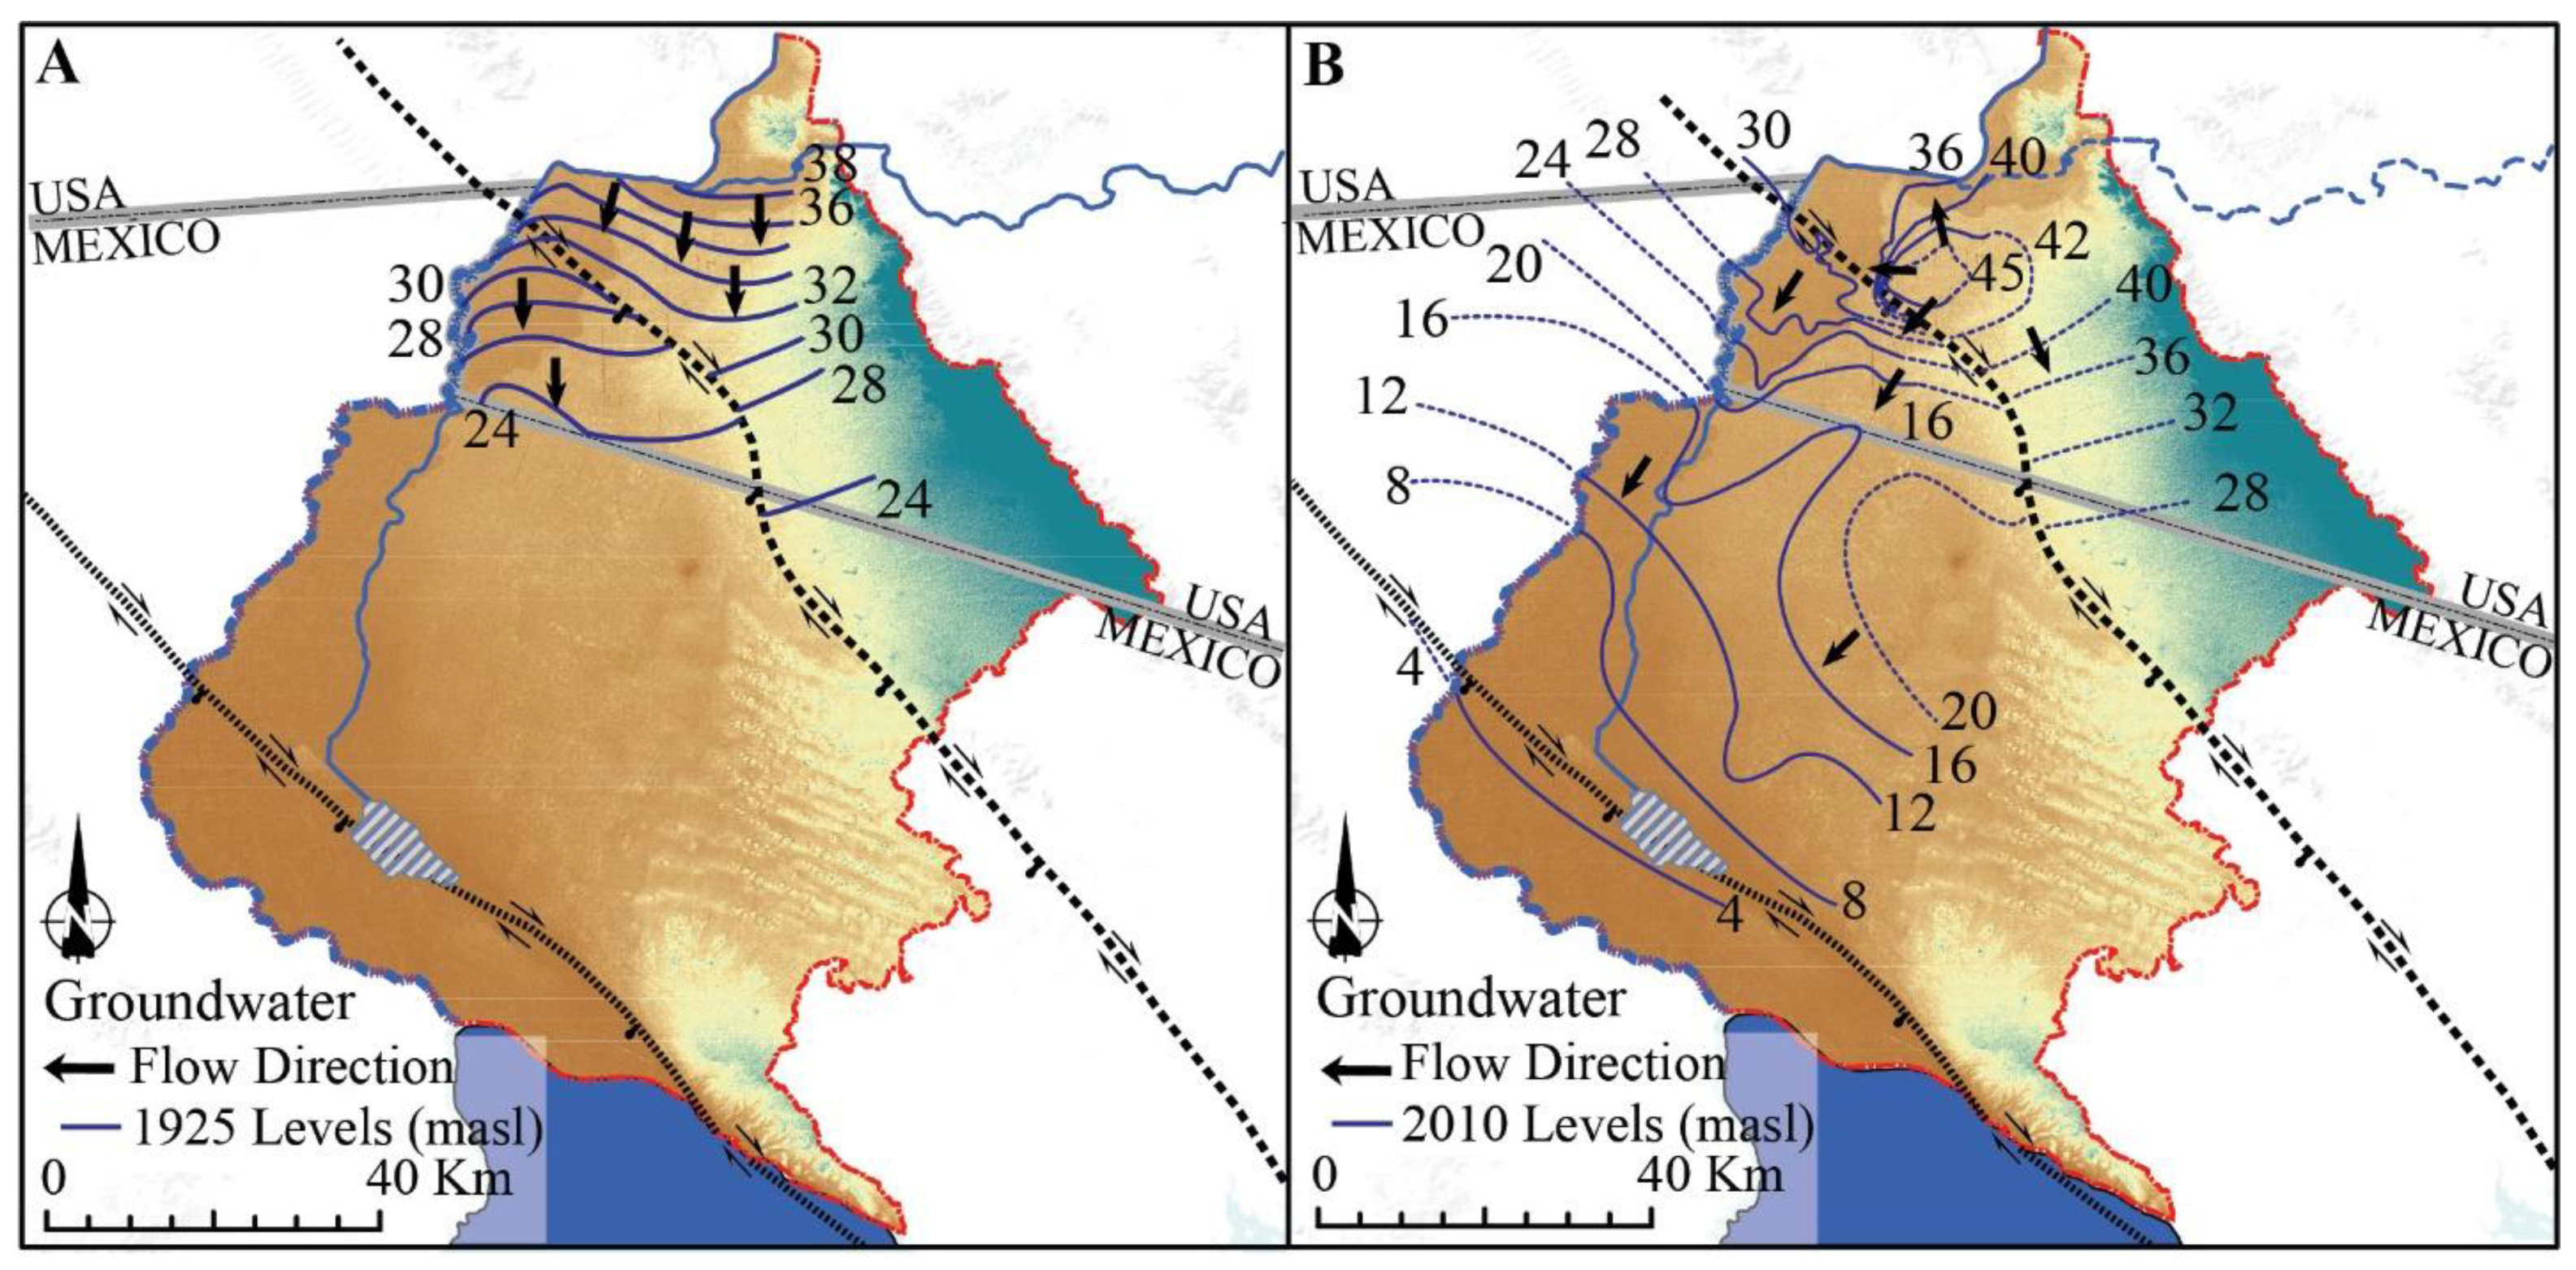
2.1.5. Hydrogeology
2.1.6. Ciénega de Santa Clara
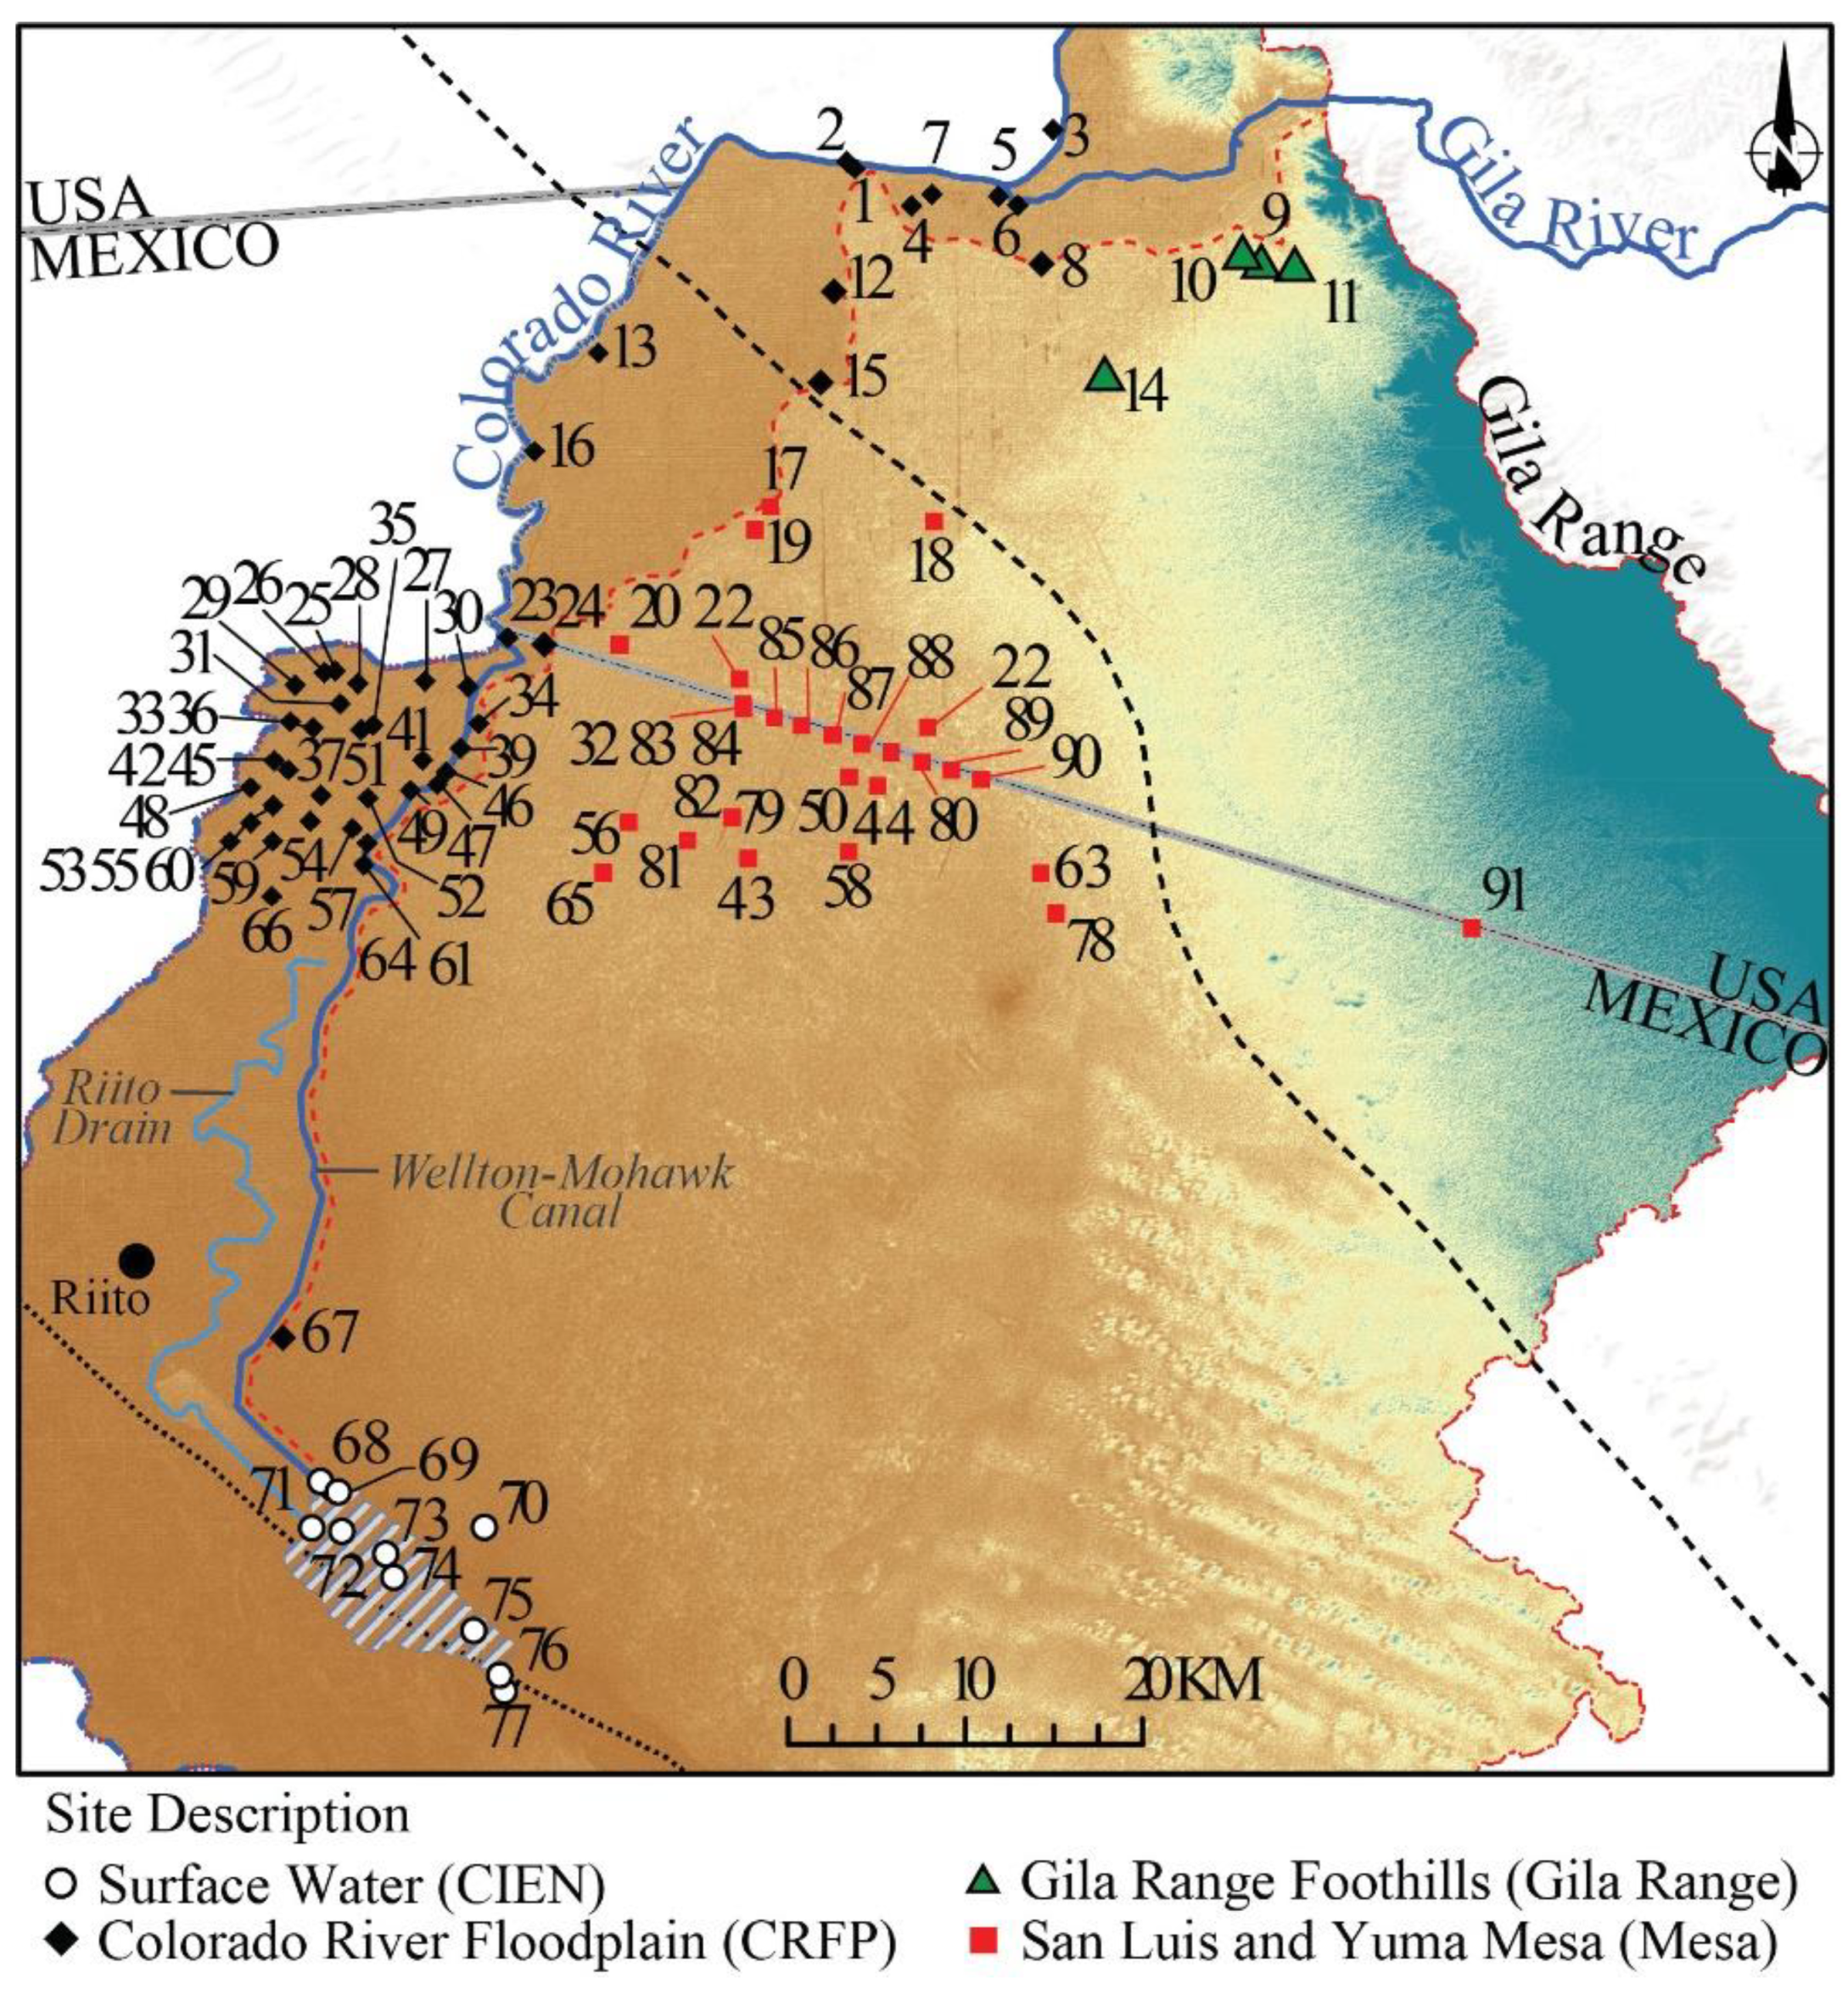
2.2. Field Methods
2.3. Laboratory Methods
2.4. Data
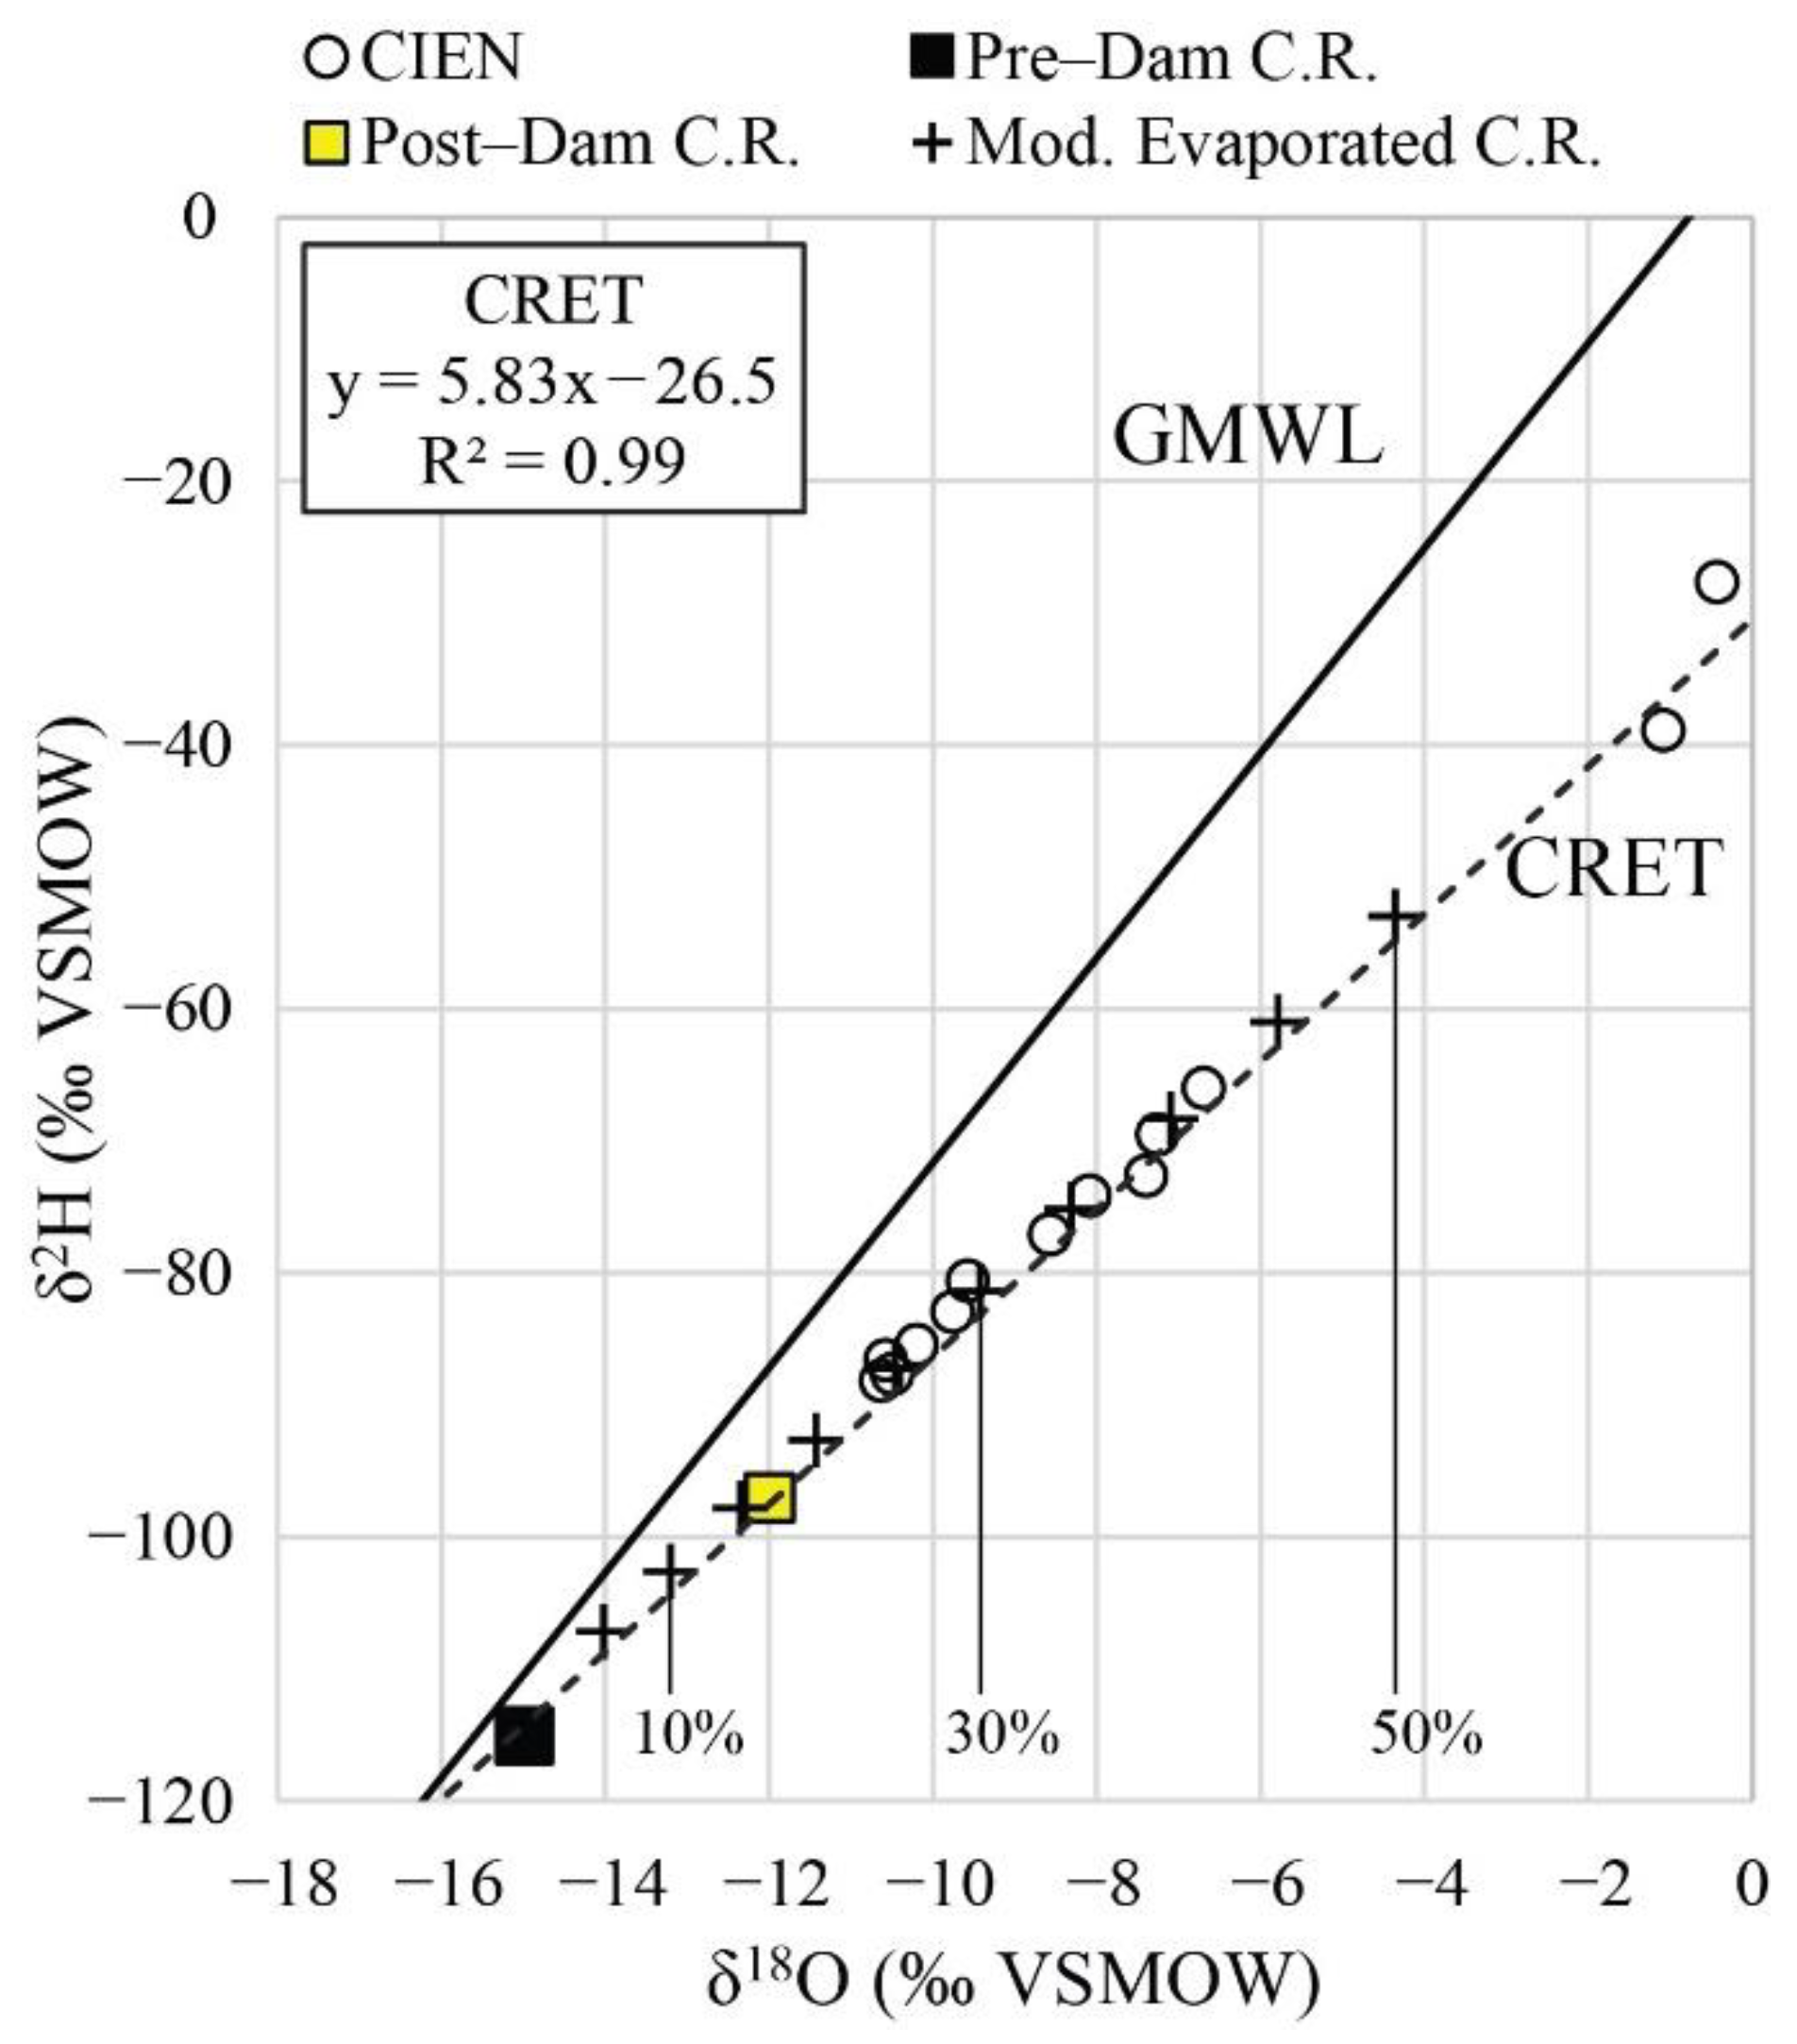
Evaporated Colorado River Water
3. Results
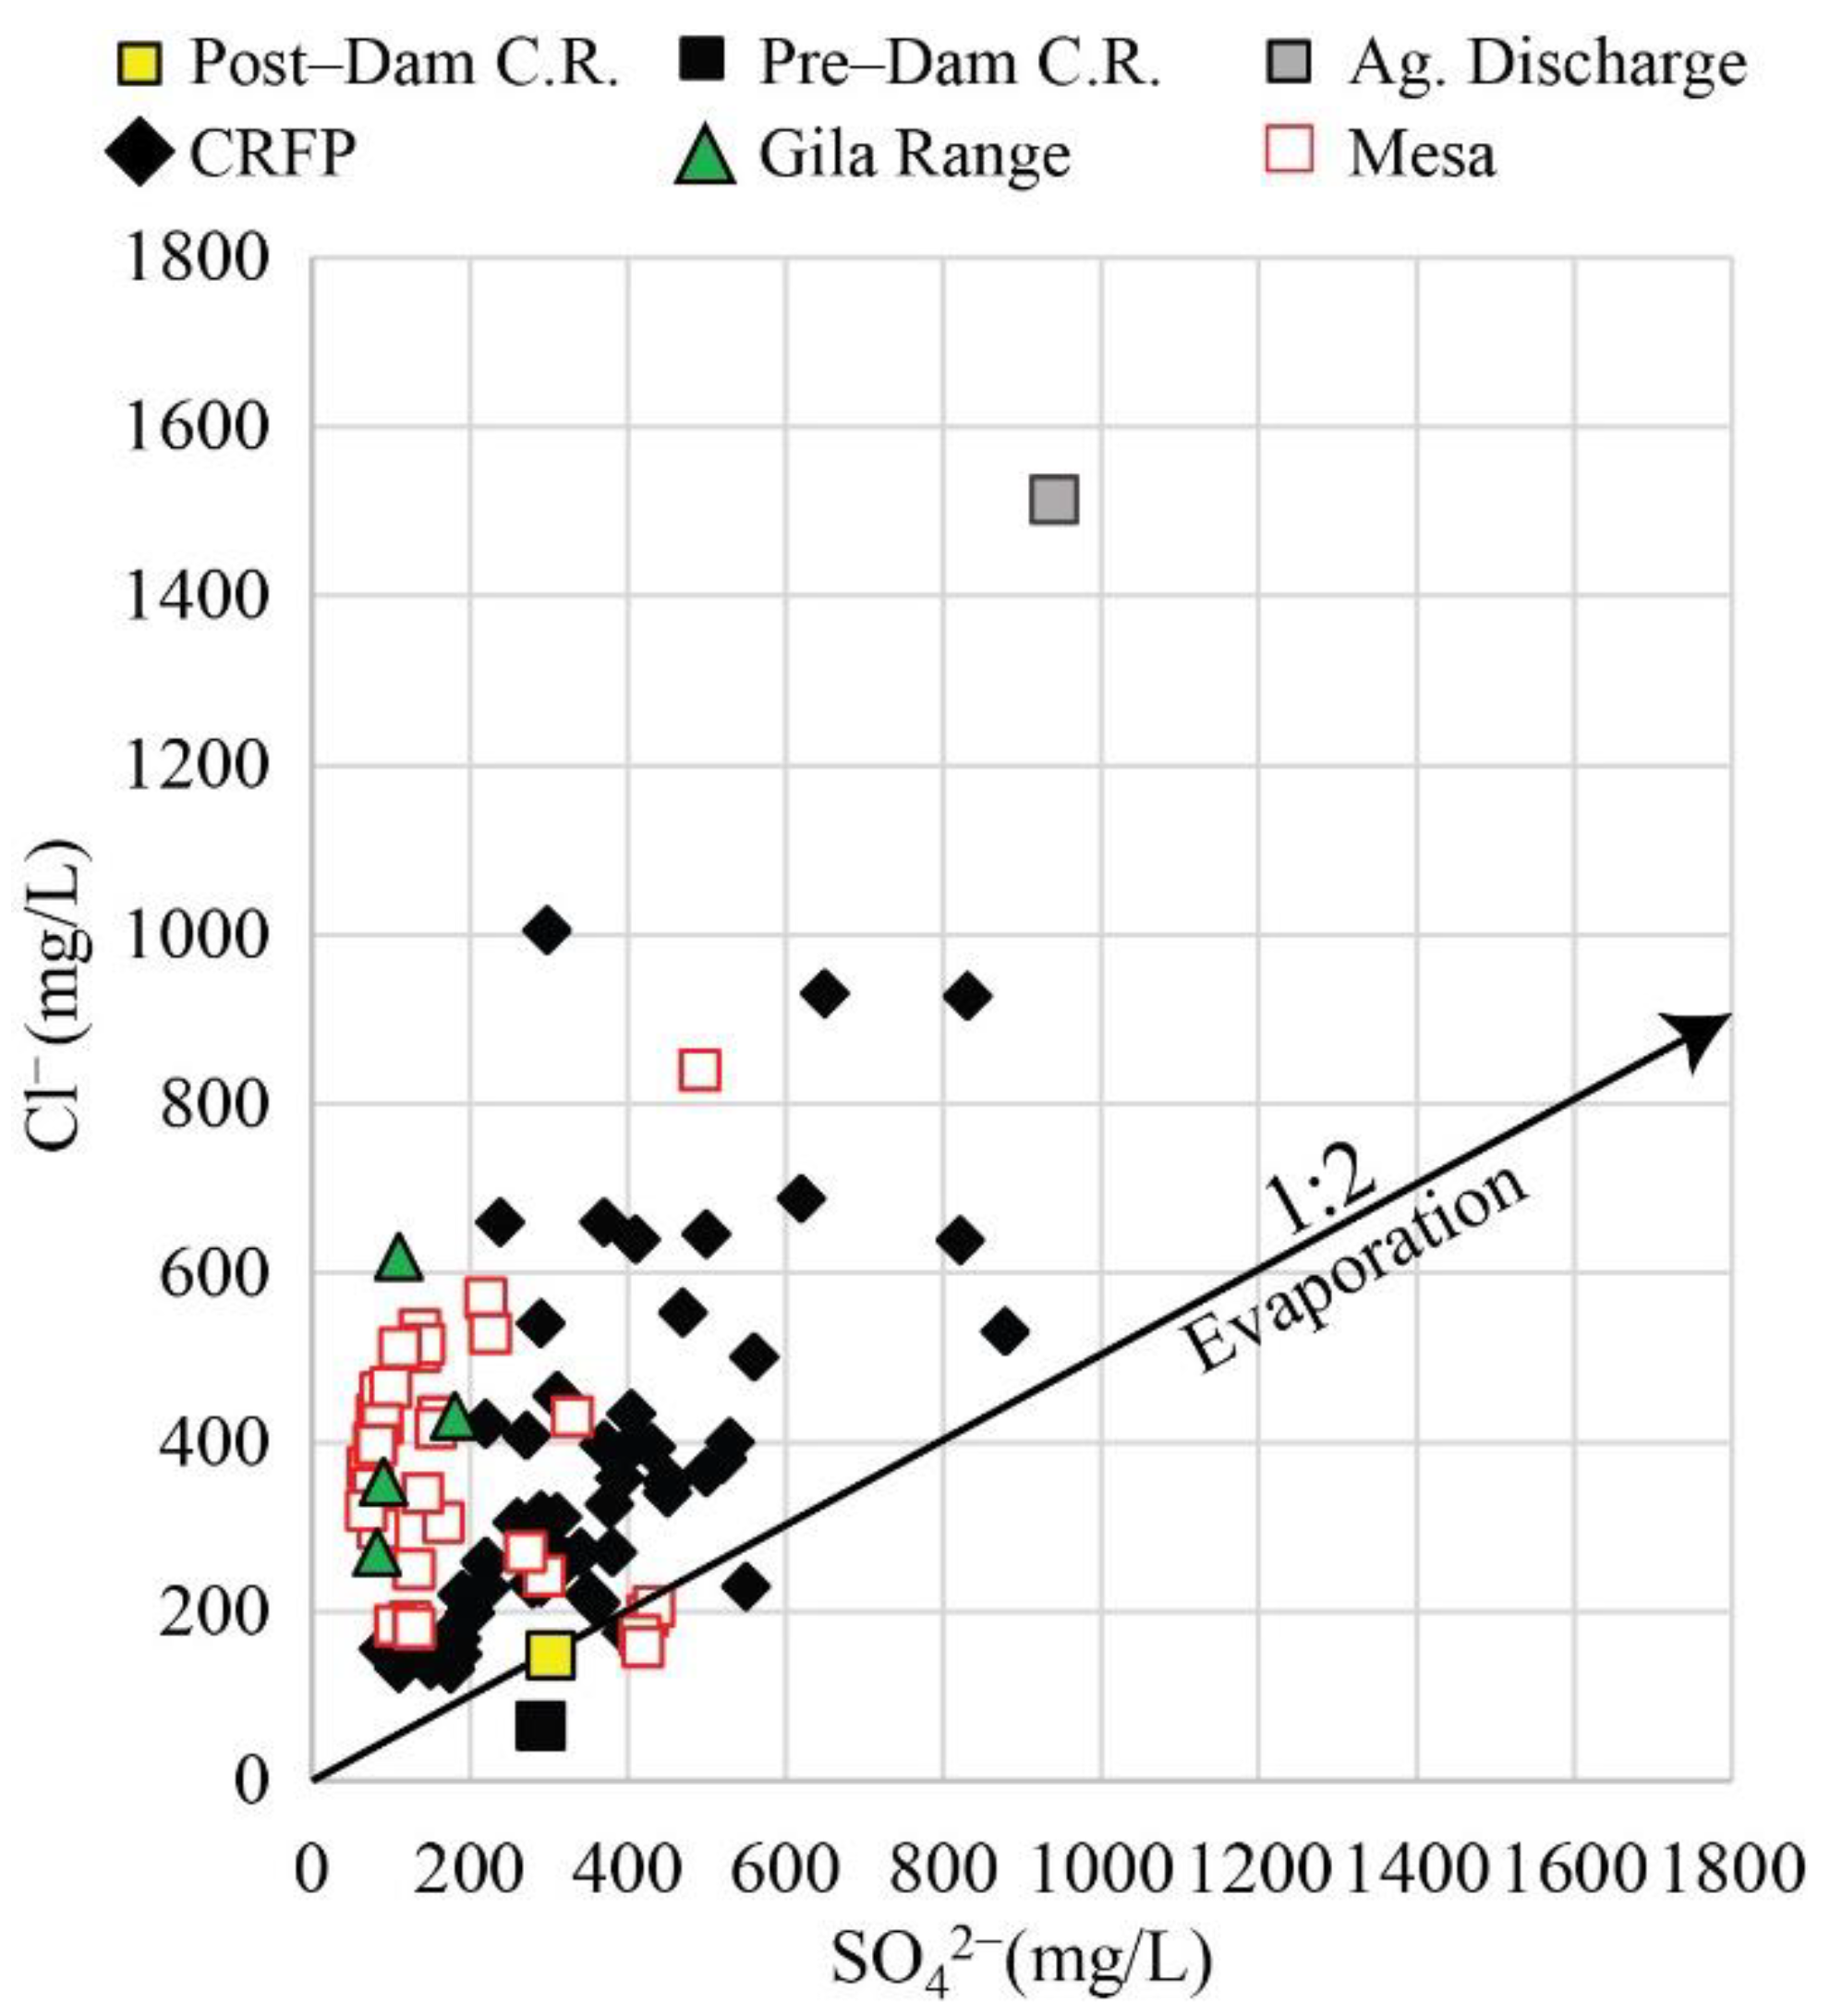
3.1. Major Ion Trends
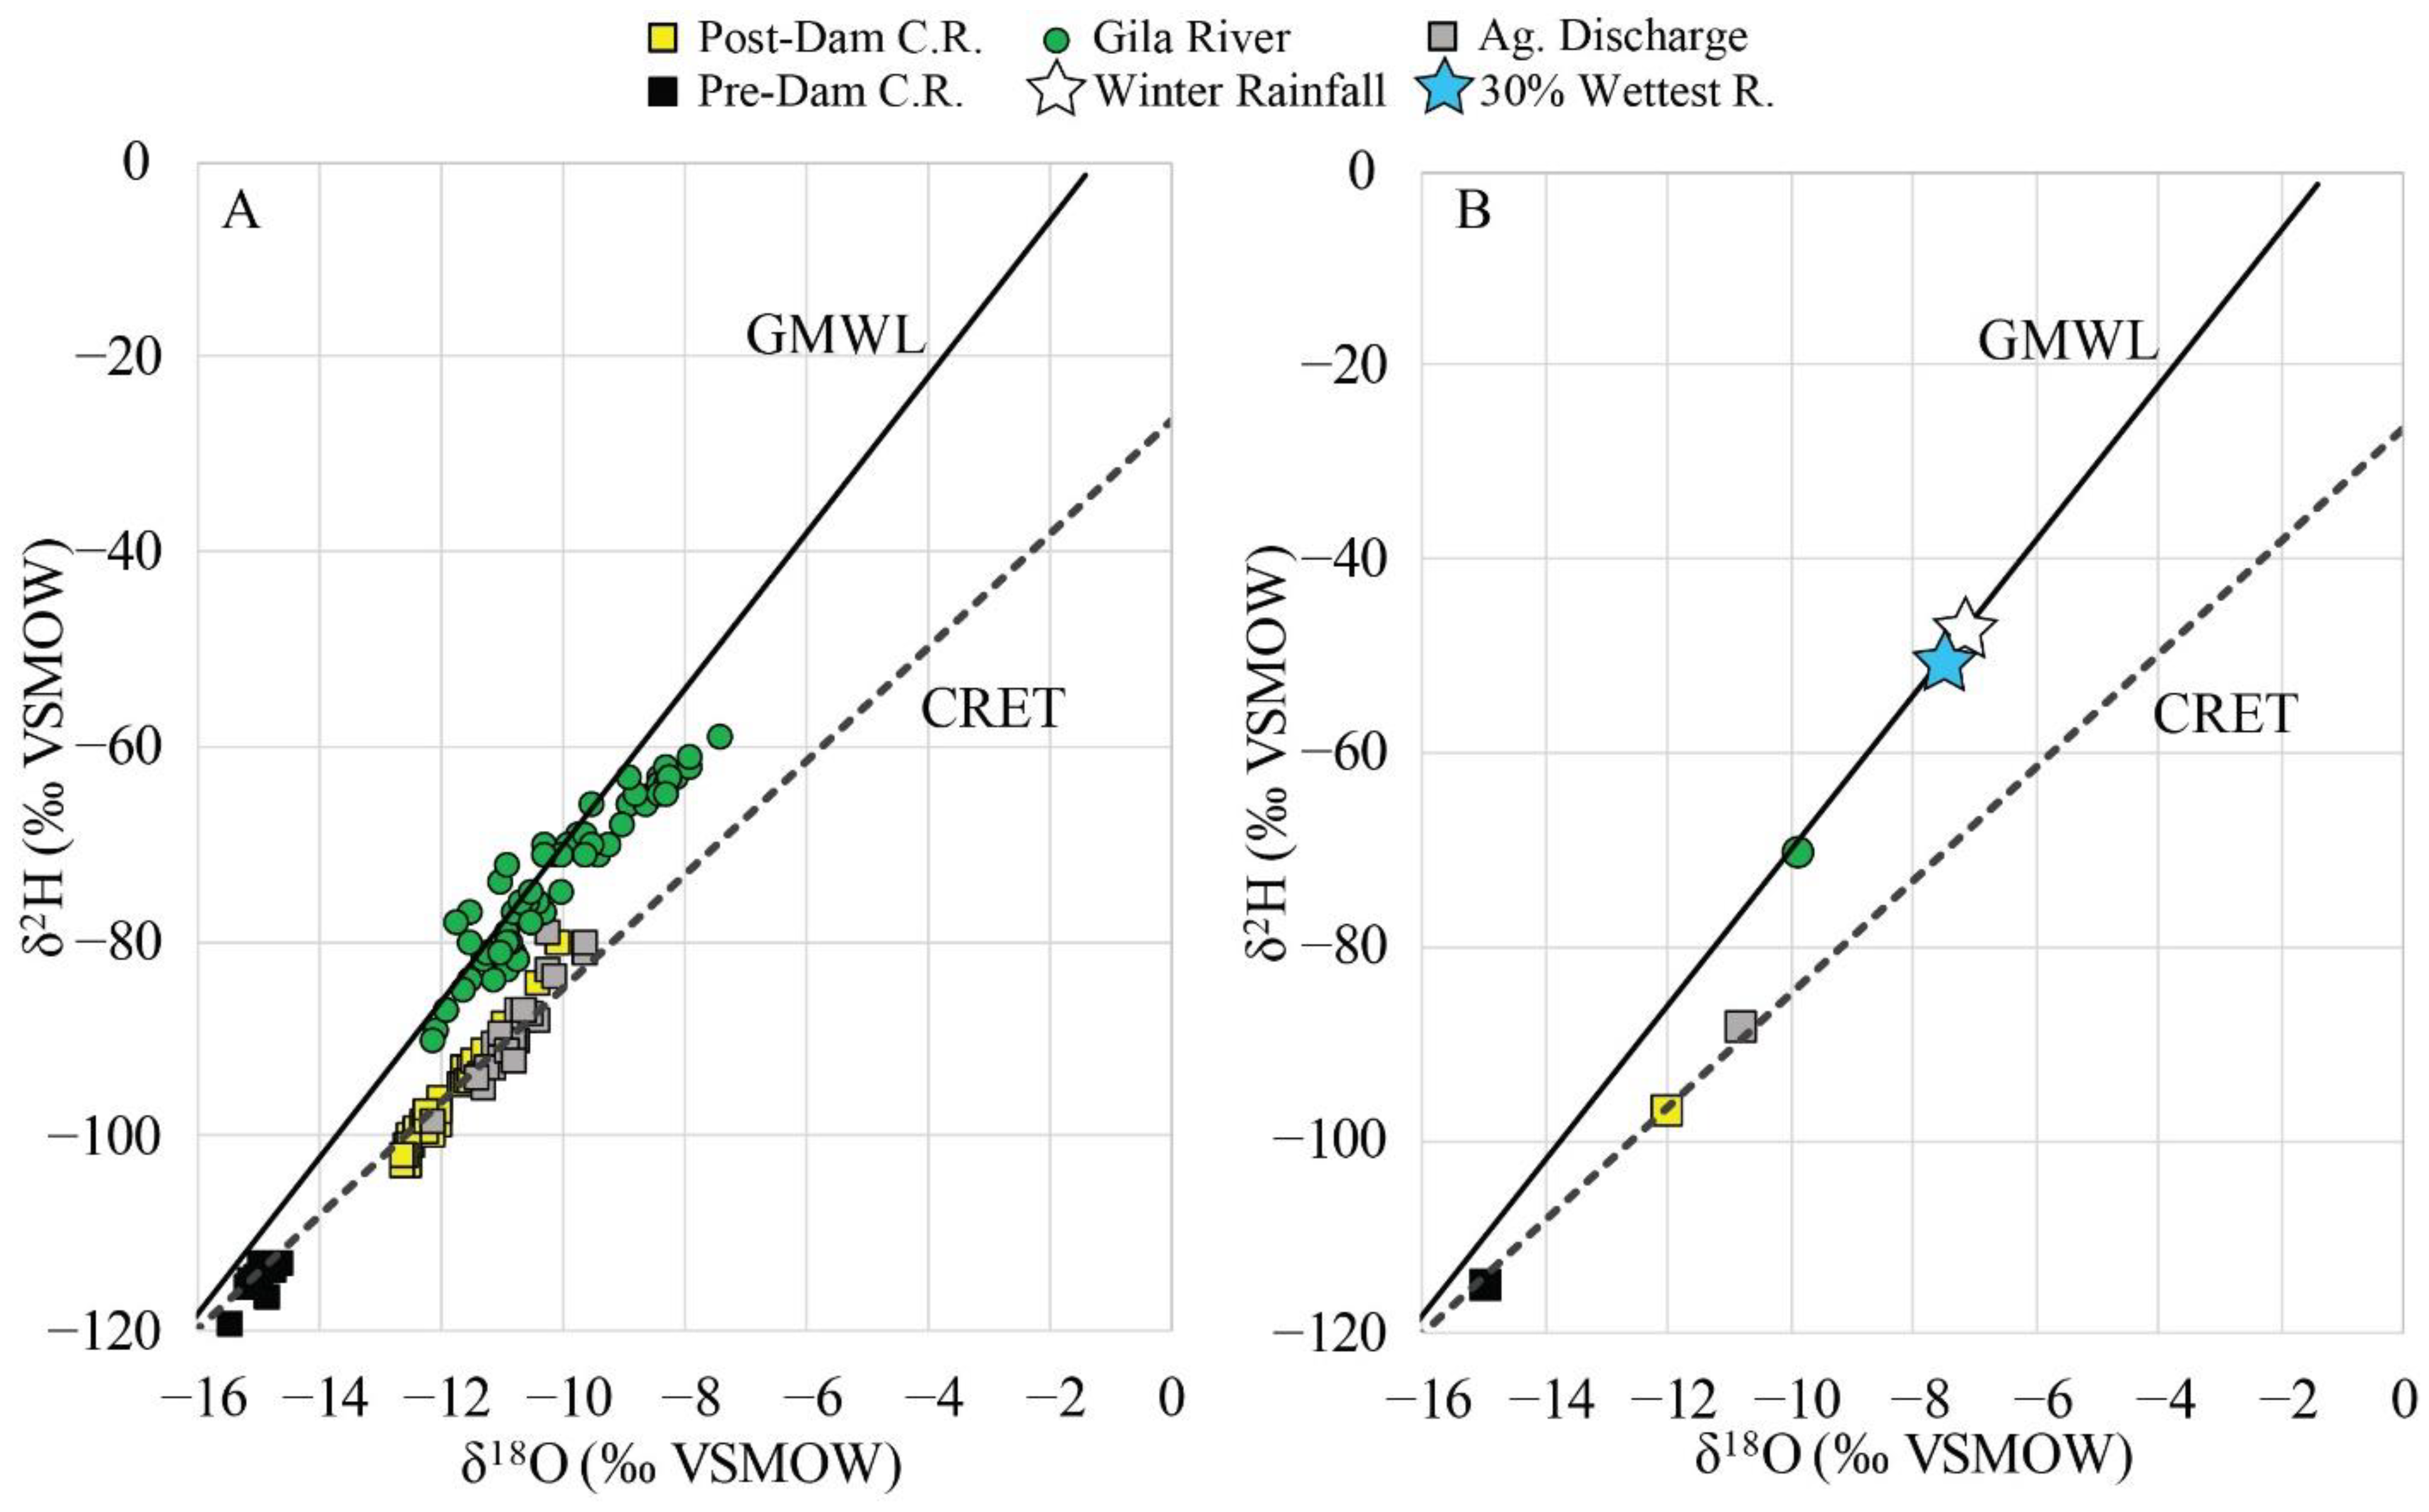
3.2. Stable Isotopes
3.2.1. Endmembers and Evaporation Calculation
3.2.2. Surface and Groundwater Data
3.2.3. H and 14C
4. Discussion
4.1. General Patterns
4.2. Source of Solutes
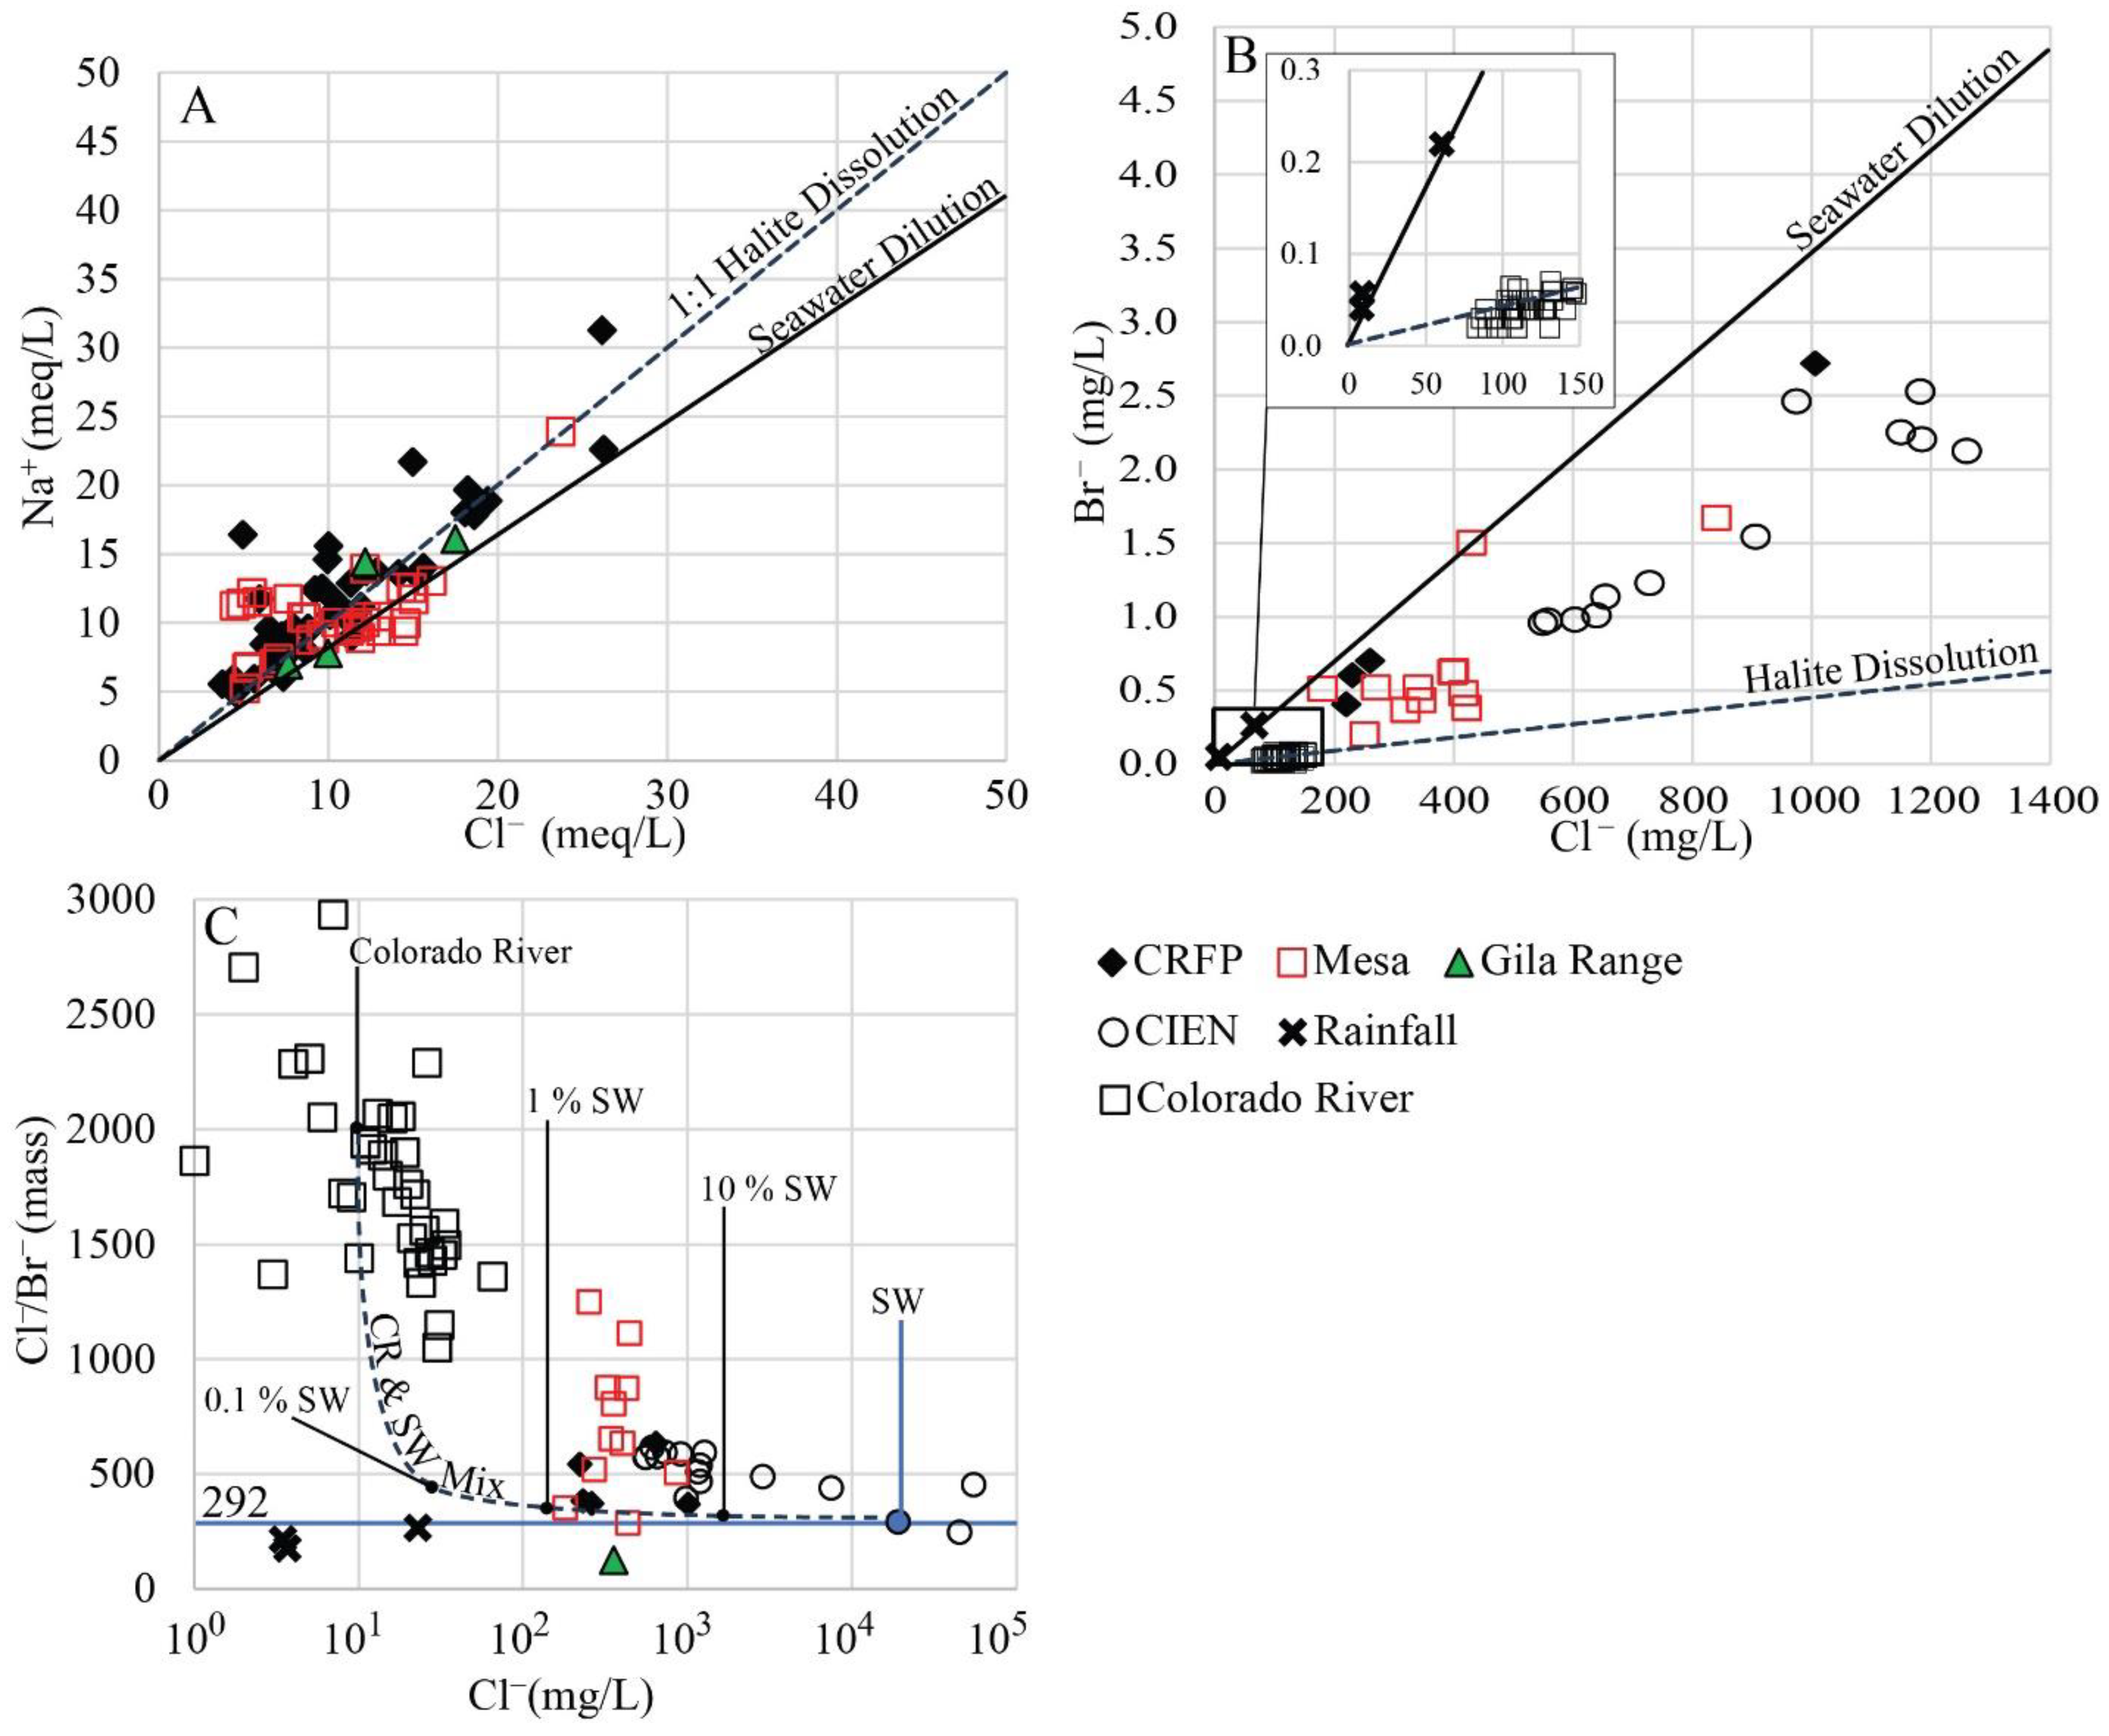
4.2.1. Na+ and Cl−

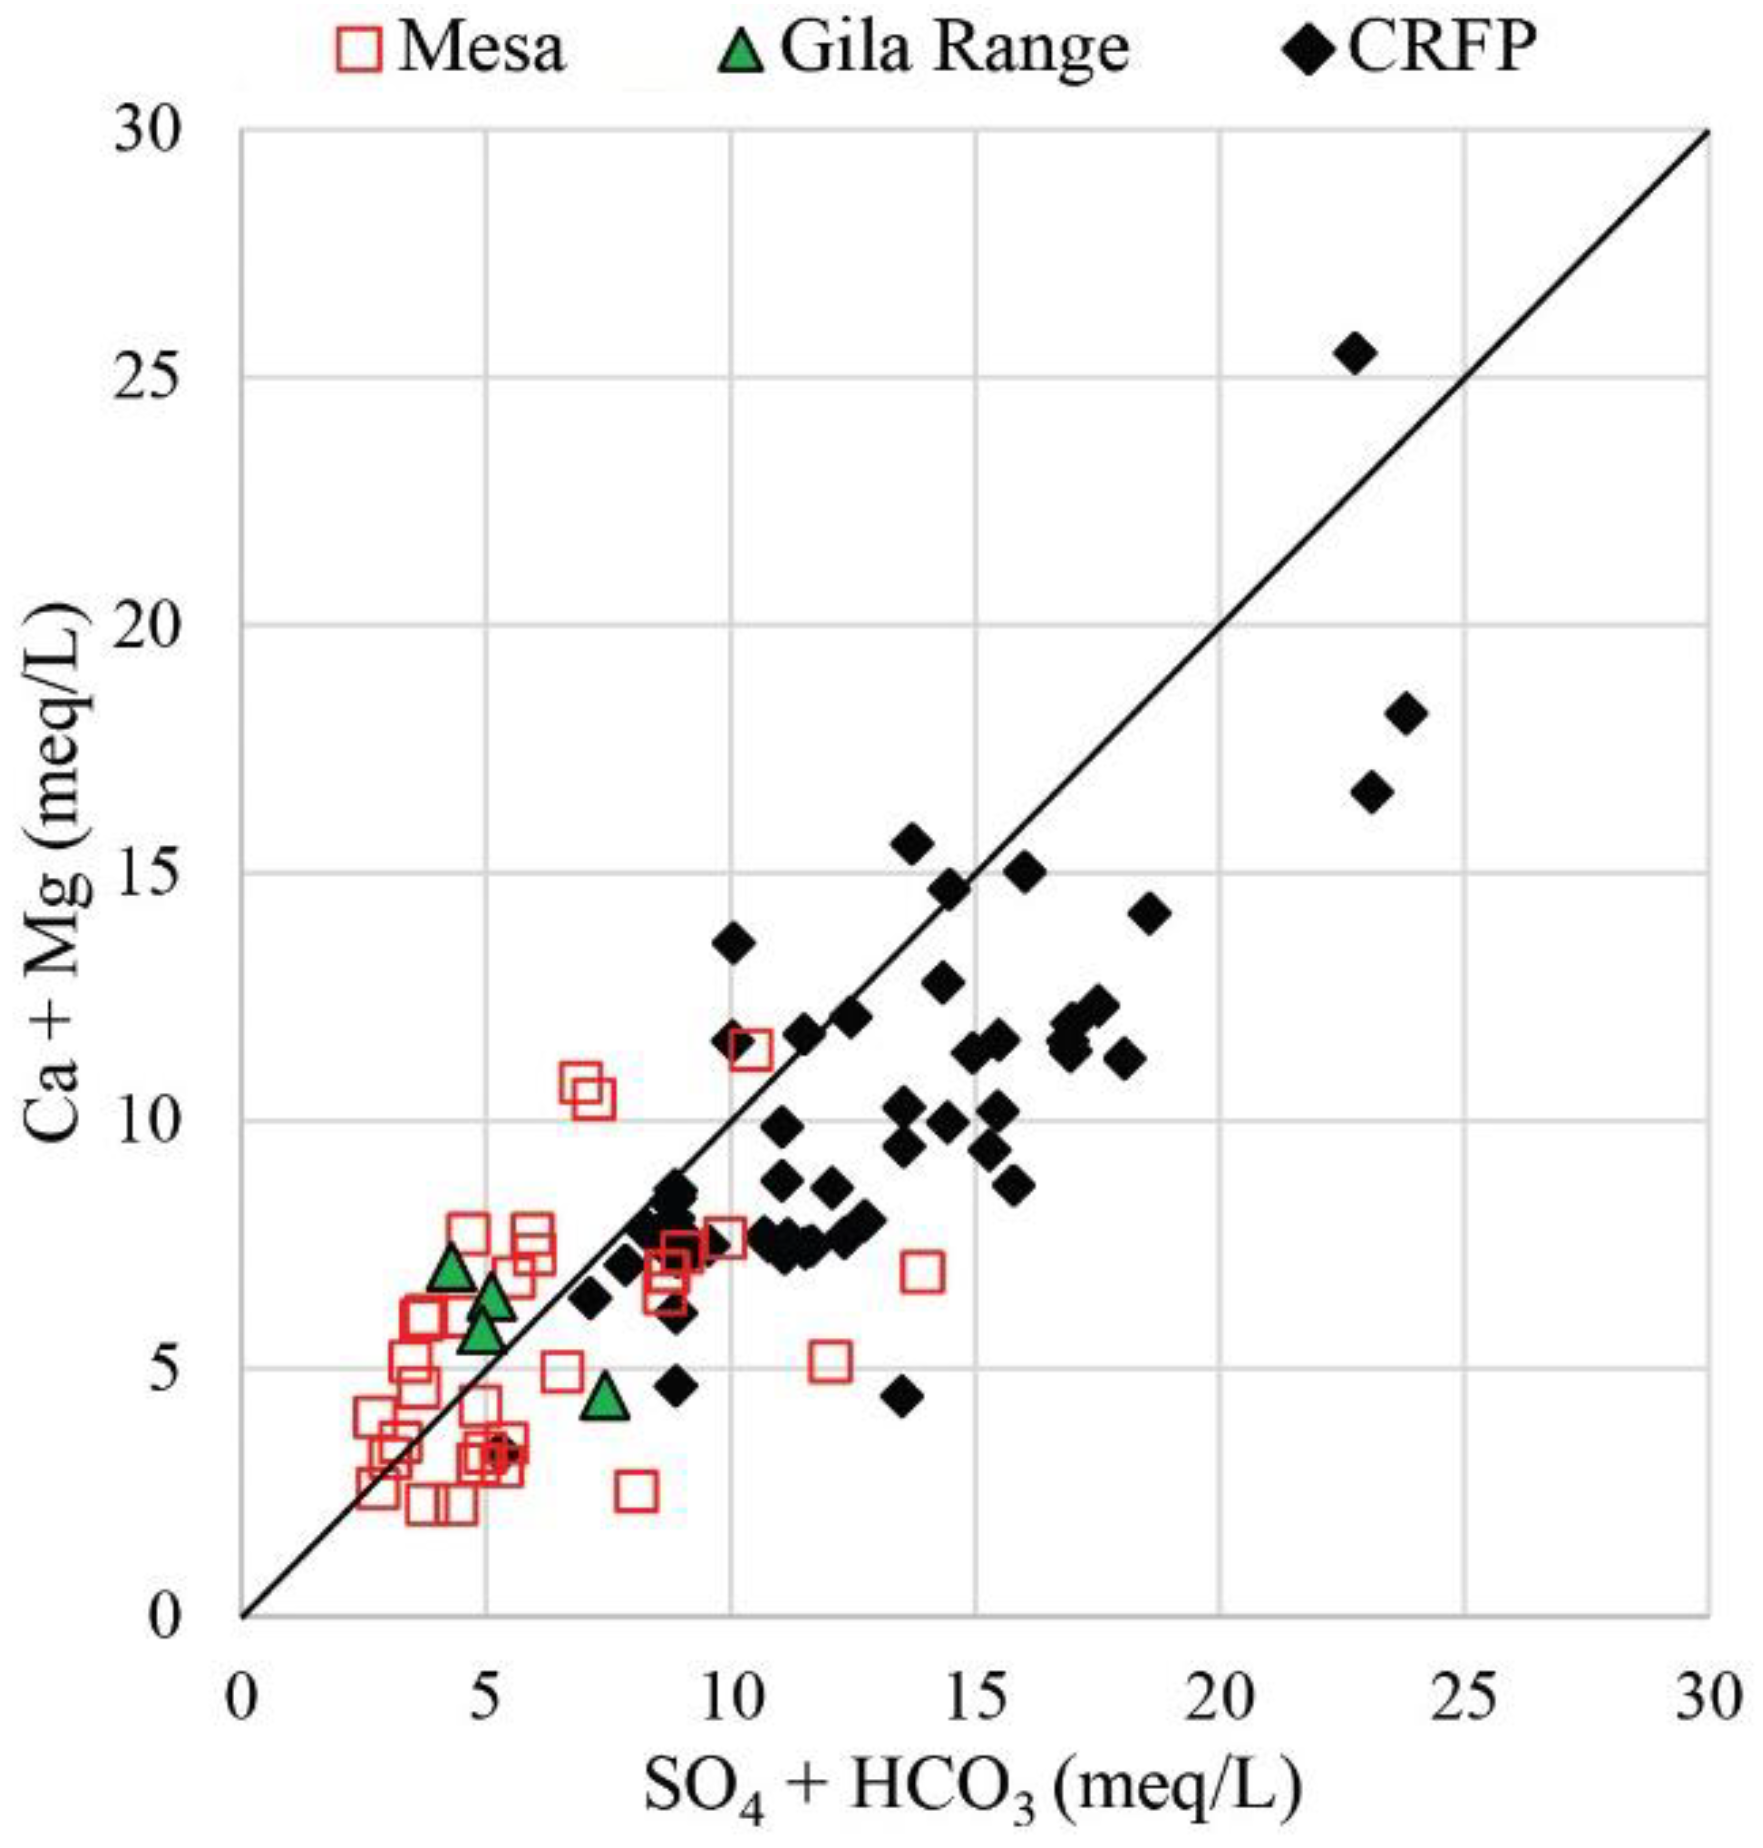
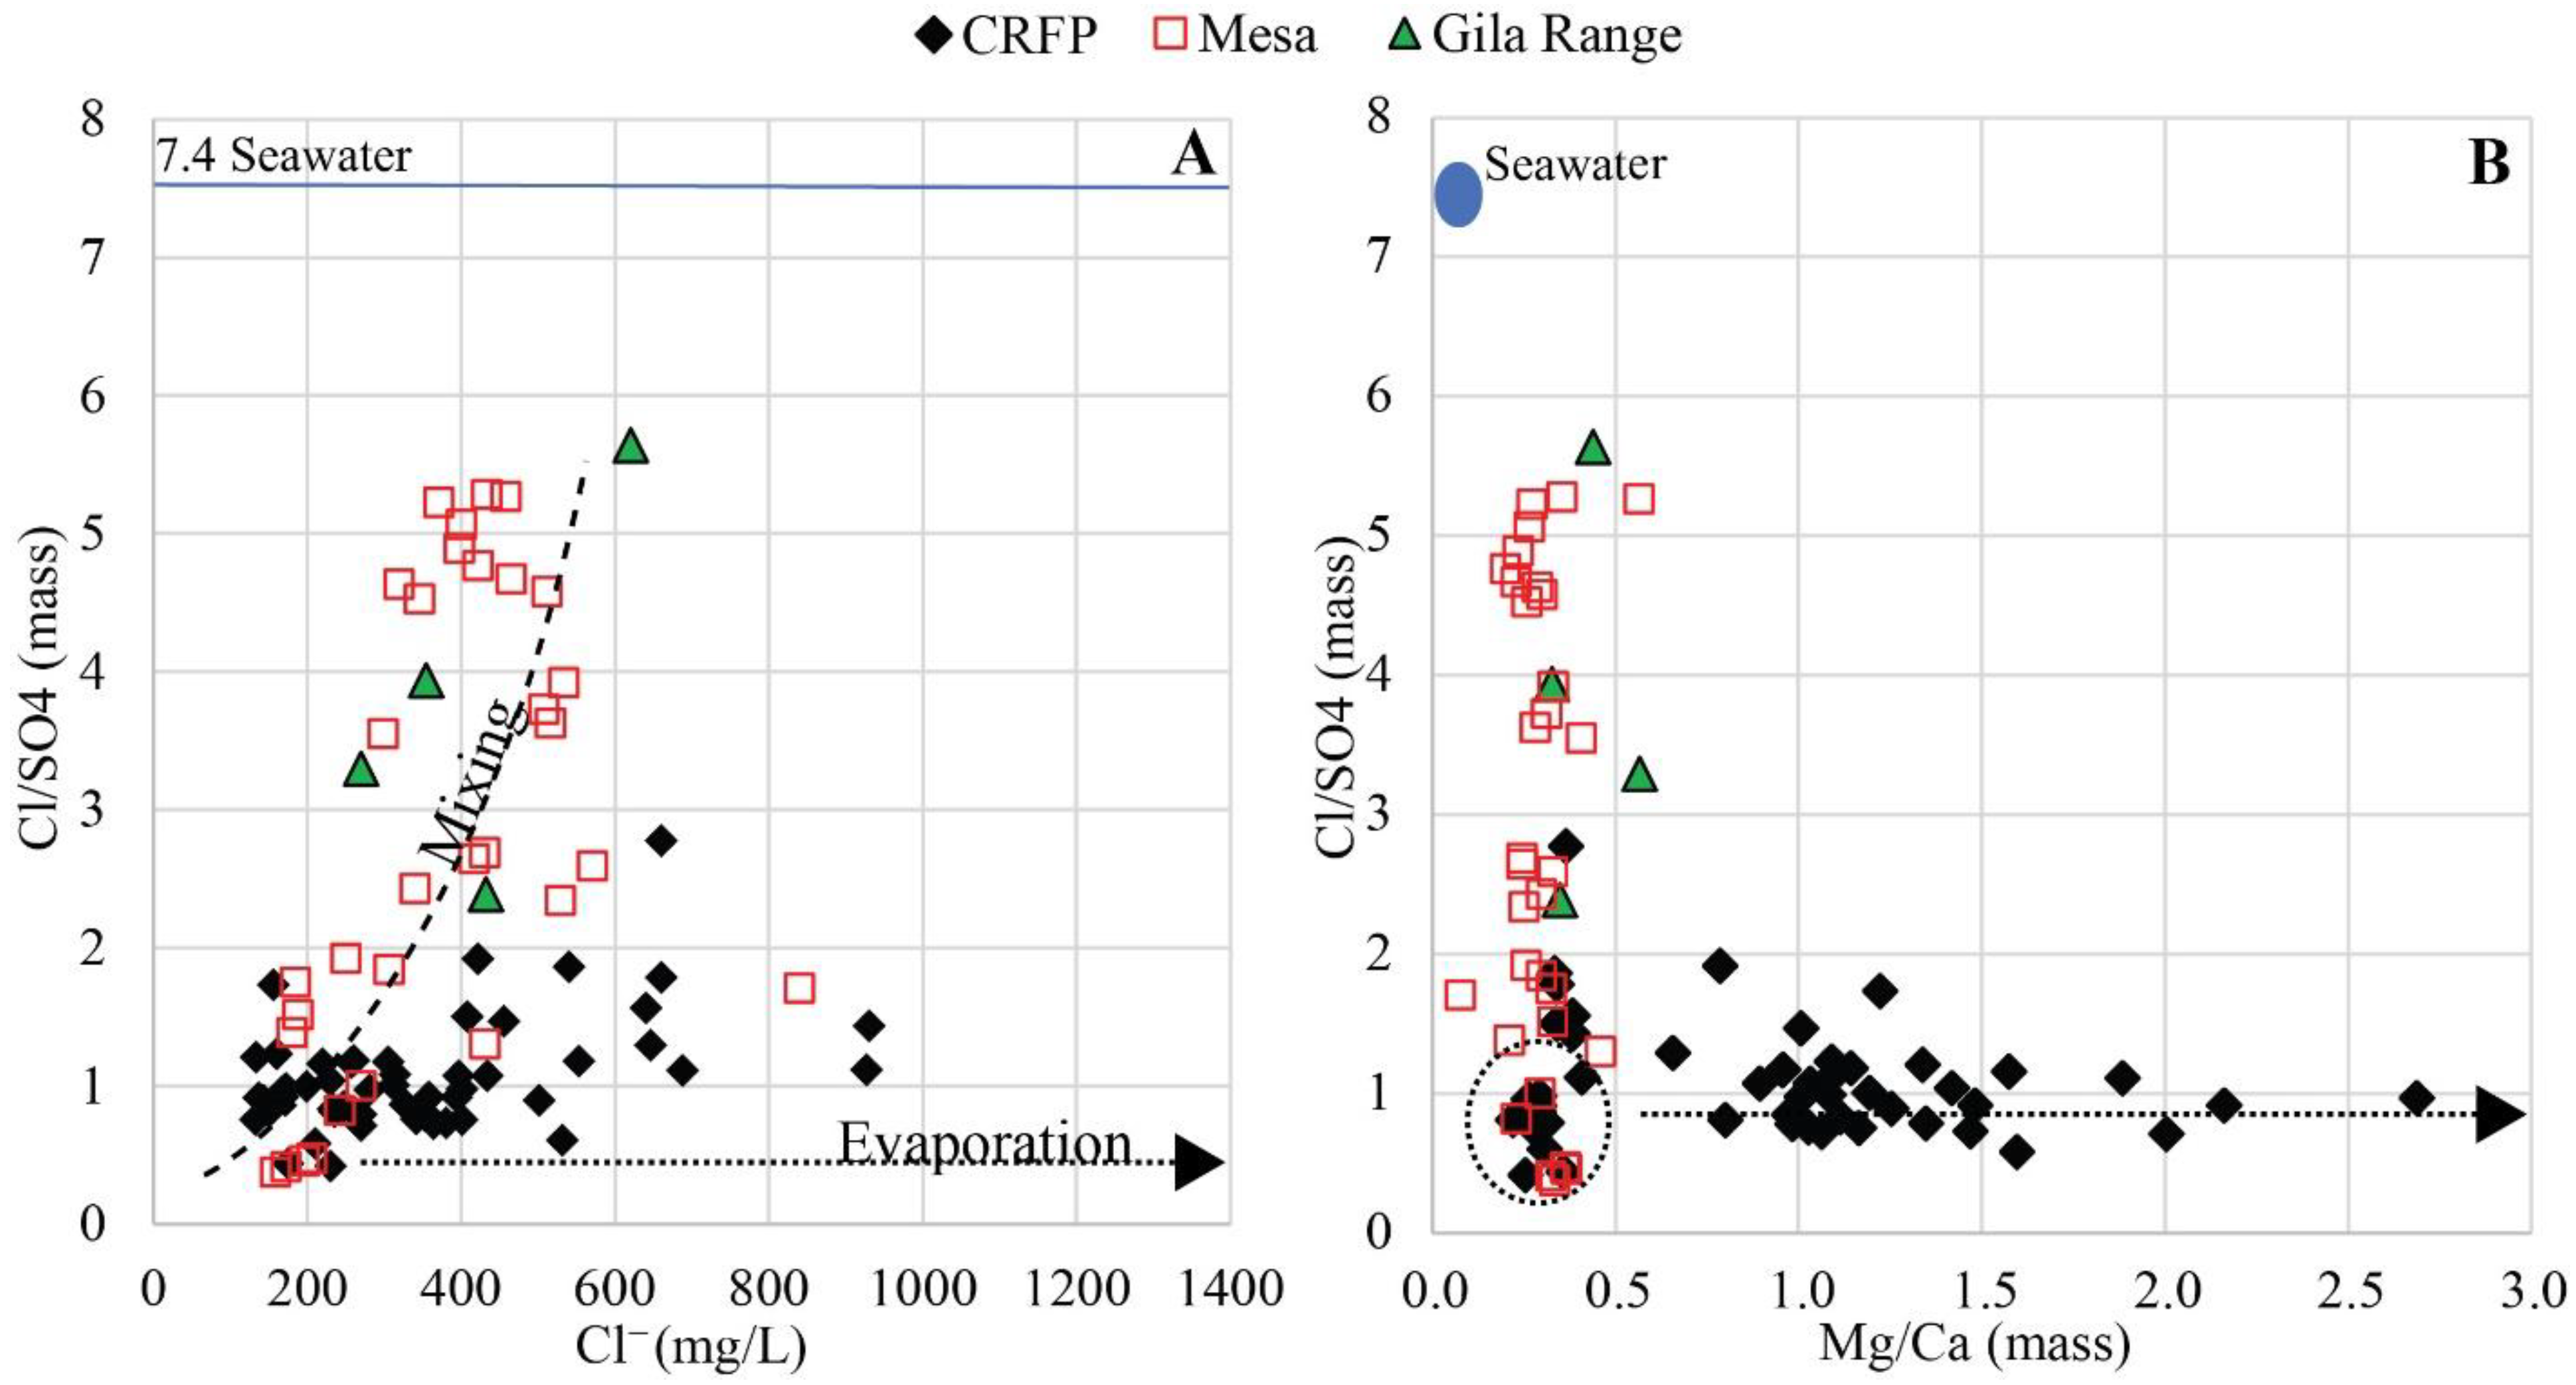
4.2.2. Ca2+, Mg2+, SO42−, and HCO3−
4.3. Hydrochemical Evolution
5. Conclusions
Supplementary Materials
Author Contributions
Funding
Institutional Review Board Statement
Informed Consent Statement
Data Availability Statement
Acknowledgments
Conflicts of Interest
References
- Barnett, T.P.; Pierce, D.W. Sustainable water deliveries from the Colorado River in a changing climate. Proc. Natl. Acad. Sci. USA 2009, 106, 7334–7338. [Google Scholar] [CrossRef] [PubMed]
- Zamora-Arroyo, F.; Flessa, K.W. Nature’s fair share: Finding and allocating water for the Colorado River delta. In Conservation of Shared Environments: Learning from the United States and Mexico; Lopez-Hoffman, L., McGovern, E.D., Varady, R., Flessa, W.K., Eds.; University of Arizona Press: Tucson, AZ, USA, 2009; pp. 23–38. [Google Scholar]
- Valdés-Casillas, C.; Hinojosa-Huerta, O.; Muñoz-Viveroz, M.; Zamora-Arroyo, F.; Carrillo-Guerrero, Y.; Delgado-Garcia, S.; Lopez-Camacho, M.; Glenn, E.P.; Garcia, J.; Riley, J.; et al. Information Database and Local Outreach Program for the Restoration of the Hardy River Wetlands, Lower Colorado River delta, Baja California and Sonora. Available online: http://www.sci.sdsu.edu/salton/InfoDatabaseRioHardy.html (accessed on 1 November 2016).
- Lancaster, N.; Greeley, R.; Christensen, P.R. Dunes of the Gran Desierto Sand-Sea, Sonora, Mexico. Earth Surf. Proc. Land. 1987, 12, 277–288. [Google Scholar] [CrossRef]
- CONAGUA: Comisión Nacional del Agua: Normas Climatológicas por Estado—Baja California (Presa Morelos). Available online: https://smn.conagua.gob.mx/es/informacion-climatologica-por-estado?estado=bc (accessed on 11 April 2021).
- Álvarez-Borrego, S.; Flores- Báez, B.P.; Galindo-Bect, L.A. Hidrología del Alto Golfo de California II. Condiciones durante invierno, primavera y verano. Cienc. Mar. 1975, 2, 21–36. [Google Scholar] [CrossRef]
- Payne, B.R.; Quijano, L.; Carlos, L.D. Environmental isotopes in a study of the origin of salinity of groundwater in the Mexicali Valley. J. Hydrol. 1979, 41, 201–215. [Google Scholar] [CrossRef]
- Van Der Kamp, P.C. Holocene continental sedimentation in the Salton Basin, California: A reconnaissance. G.S.A. Bull. 1973, 84, 827–848. [Google Scholar] [CrossRef]
- Olmsted, F.; Loeltz, O.; Irelan, B. Geohydrology of the Yuma Area, Arizona and California, Water Resources of Lower Colorado River-Salton Sea Area. US Geol. Surv. Prof. Pap. 1973, 486–H, 1–273. [Google Scholar]
- Dickinson, J.; Land, M.; Faunt, C.; Leake, S.; Richard, E.; Fleming, J.B.; Pool, D.R. Hydrologic Framework Refinement, Ground-Water Flow and Storage, Water-Chemistry Analyses and Water-Budget Components of the Yuma Area, Southwestern Arizona, and Southeastern California. USGS Sci. Investig. Rep. 2006, 5135, 1–88. [Google Scholar]
- CONAGUA: Comisión Nacional del Agua: Actualización de la Disponibilidad Media Anual de agua en el Acuífero Valle de San Luis Río Colorado (2601), Estado de Sonora. Available online: https://www.gob.mx/cms/uploads/attachment/file/104293/DR_2601.pdf (accessed on 18 January 2015).
- Curray, J.R.; Moore, D.G. Geologic history of the mouth of the Gulf of California. In Tectonics and Sedimentation along the California Margin; Crouch, J.K., Bachman, S.B., Eds.; Society of Economic Paleontologists and Mineralogists: Los Angeles, CA, USA, 1984; Volume 38, pp. 17–36. [Google Scholar]
- Gastil, R.G.; Phillips, R.P.; Allison, E.C. Reconnaissance geology of the state of Baja California. GSA Mem. 1975, 140, 1–170. [Google Scholar] [CrossRef]
- Meko, D.M.; Woodhouse, C.A.; Baisan, C.A.; Knight, T.; Lukas, J.J.; Hughes, M.K.; Salzer, M.W. Medieval Drought in the Upper Colorado River Basin. Geoph. Res. Let. 2007, 34, L10705. [Google Scholar] [CrossRef]
- Blaney, H.; Harris, K. Consumptive use of water rates in the lower Colorado River Basin: Report on water supply of the lower Colorado River basin: Project plan. U.S.B.R. 1952, 1, 1–427. [Google Scholar]
- Guay, B.; Eastoe, C.; Basset, R.; Long, A. Identifying sources of groundwater in the lower Colorado River valley, USA with δ18O, δ2H, and 3H: Implications for river water accounting. Hydrogeol. J. 2006, 14, 146–158. [Google Scholar] [CrossRef]
- U.S.G.S.: Water-Quality Data for the Nation. Available online: https://waterdata.usgs.gov/nwis (accessed on 12 December 2020).
- Morrison, J.I.; Postel, S.L.; Gieck, P.H. The Sustainable Use of Water in the Lower Colorado River Basin; Pacific Institute: Oakland, CA, USA, 1996; p. 77. [Google Scholar]
- Flessa, K.W.; Glenn, E.P.; Hinojosa-Huerta, O.; de la Parra-Renteria, C.A.; Ramirez-Hernandez, J.; Schmidt, J.C.; Zamora-Arroyo, F.A. Flooding of the Colorado River delta: A Landscape-Scale Experiment. Eos Trans. Am. Geophys. Union 2013, 94, 485–496. [Google Scholar] [CrossRef]
- Ariel Construcciones, S.A. Estudio Hidrogeológico Preliminar de los Acuíferos del Valle de Mexicali, B.C. y Mesa Arenosa de San Luis, Sonora; S.R.H.: Mexicali, México, 1967. [Google Scholar]
- Díaz Cabrera, P. Simulación Numérica del Acuífero Superior del Valle de Mexicali, Baja California, México. Master’s Thesis, Centro de Investigación Científica y de Educación Superior de Ensenada, Ensenada, México, December 2001. [Google Scholar]
- Ramírez-Hernández, J.; Hinojosa-Huerta, O.; Peregrina-Llanes, M.; Calvo-Fonseca, A.; Carrera-Villa, E. Groundwater responses to controlled water releases in the Limitrophe Region of the Colorado River: Implications for management and restoration. Eco Eng. 2013, 59, 93–103. [Google Scholar] [CrossRef]
- Orozco-Duran, A.; Daessle, L.W.; Camacho-Ibar, V.F.; Ortiz-Campos, E.; Barth, J.A.C. Turnover and release of P-, N-, Si-nutrients in the Mexicali Valley (Mexico): Interactions between the lower Colorado River and adjacent ground- and surface water systems. Sci. Total Environ. 2015, 512–513, 185–193. [Google Scholar] [CrossRef] [PubMed]
- CONAGUA: Comisión Nacional del Agua: Actualización de la Disponibilidad de Agua en el Acuifero del Valle de Mexicali (0210), Estado de Baja California. Available online: https://www.gob.mx/cms/uploads/attachment/file/103411/DR_0210.pdf (accessed on 18 January 2015).
- ADEQ: Arizona Department of Water Resources Well Registry. Available online: https://gisweb.azwater.gov/waterresourcedata/wellregistry/ (accessed on 15 January 2019).
- Glenn, E.P.; Lee, C.; Felger, R.; Zengel, S. Effects of water management on the wetlands of the Colorado River Delta, Mexico. Conserv. Biol. 1996, 10, 1175–1186. [Google Scholar] [CrossRef]
- Monitoring Program for the Ciénega de Santa Clara. Available online: https://www.ibwc.gov/Files/Exec_Summary_FR_Mon_Prog_Cienegad.pdf (accessed on 11 April 2016).
- Gieskes, J.; Rogers, W. Alkalinity determinations in interstitial waters of marine sediments. J. Sediment. Res. 1973, 43, 272–277. [Google Scholar] [CrossRef]
- Palomares-Ramírez, R.B. Identificación de los Componentes Hidrogeoquimicos que Contaminan el Acuífero del Módulo de Riego I del Valle de San Luis, R.C. Master’s Thesis, Universidad Autónoma de Baja California, Mexicali, México, December 2011. [Google Scholar]
- Zamora, H.A.; Wilder, T.W.; Eastoe, C.J.; McIntosh, J.C.; Welker, J.; Flessa, K.W. Evaluation of Groundwater Sources, Flow Paths, and Residence Time of the Gran Desierto Pozos, Sonora, Mexico. Geosciences 2019, 9, 378. [Google Scholar] [CrossRef]
- Makdisi, R.S.; Truesdell, A.H.; Thompson, J.M.; Coplen, T.B.; Sanchez, R. Geochemical evolution of Mexicali Valley groundwaters. In Proceedings of the Symposium on the Cerro Prieto Geothermal Field, Guadalajara, Mexico, 10 August 1982. [Google Scholar]
- Parkhurst, D.; Appelo, C. User’s guide to PHREEQC (version 2)—A computer program for speciation, batch-reaction, one-dimensional transport, and inverse geochemical calculations. USGS Water Resour. Investig. Rep. 1999, 99, 1–312. [Google Scholar]
- Towne, D. Ambient groundwater of the Lower Gila Basin: A 2013–2016 baseline study. Ariz. Dep. Environ. Qual. Rep. 2017, 17-01, 1–74. [Google Scholar]
- Towne, D. Ambient groundwater quality of the Gila Valley Sub-Basin of the Safford Basin: A 2004 baseline study. Ariz. Dep. Environ. Qual. Rep. 2009, 9–12, 1–99. [Google Scholar]
- Craig, H. Isotopic variations in meteoric waters. Science 1961, 133, 213–224. [Google Scholar] [CrossRef]
- Clark, I.; Fritz, P. Environmental Isotopes in Hydrogeology; Lewis Publishers: Boca Raton, FL, USA, 1997; pp. 87–88. [Google Scholar]
- Robertson, F.N. Geochemistry of groundwater in alluvial basins of Arizona and adjacent parts of Nevada, New Mexico, and California. US Geol. Surv. Prof. Pap. 1991, 1406-C, 1–97. [Google Scholar]
- Majoube, M. Fractionnement en oxygene-18 et en deuterium entre l’eau et sa vapeur. J. Chem. Phys. 1971, 197, 1423–1436. [Google Scholar] [CrossRef]
- Gonfiantini, R. Environmental isotopes in lake studies. In Handbook of Environmental Isotope Chemistry. The Terrestrial Environment; Fritz, P., Fontes, J., Eds.; Elsevier: Amsterdam, The Netherlands, 1986; Volume 2, pp. 113–168. [Google Scholar] [CrossRef]
- AZMET: The Arizona Meteorological Network. Available online: https://cals.arizona.edu/azmet/ (accessed on 8 July 2019).
- Barragán, R.M.; Birkle, P.; Portugal, E.; Arellano, V.M.; Álvarez, J. Geochemical survey of medium temperature geothermal resources from the Baja California Peninsula and Sonora, Mexico. J. Volc. Geoth. Res. 2001, 110, 101–119. [Google Scholar] [CrossRef]
- Dettman, D.L.; Flessa, K.W.; Roopnarine, P.D.; Schöne, B.R.; Goodwin, D.H. The use of oxygen isotope variation in the shells of estuarine mollusks as a quantitative record of seasonal and annual Colorado River discharge. Geoch. Cosmochim. Acta 2004, 68, 1253–1263. [Google Scholar] [CrossRef]
- Haber, S.A. Isotopes of Helium, Hydrogen, and Carbon as Groundwater Tracers in Aquifers along the Colorado River. Master’s Thesis, University of California, San Diego, CA, USA, May 2009. [Google Scholar]
- Eastoe, C.J.; Watts, C.J.; Ploughe, M.; Wright, W.E. Future use of tritium in mapping pre-bomb groundwater. Ground Water 2012, 50, 87–93. [Google Scholar] [CrossRef] [PubMed]
- Tuttle, M.L.W.; Fahy, J.; Grauch, R.I.; Ball, B.A.; Chong, W.; Elliott, J.G.; Kosovich, J.J.; Livo, K.E.; Stillings, L.L. Results of the Chemical Analyses of Soil, Shale, and Soil Shale Extract from the Mancos Shale Formation in the Gunnison Gorge National Conservation Area, Southwestern Colorado, and at Hanksville, Utah. USGS Open-File Rep. 2007, 2007-1002D, 1–67. [Google Scholar]
- Repenning, C.A.; Cooley, M.E.; Akers, J.P. Stratigraphy of the Chinle and Moenkopi Formations, Navajo and Hopi Indian Reservations Arizona, New Mexico, and Utah. US Geol. Surv. Prof. Pap. 1969, 521-B, 1–34. [Google Scholar]
- Zamora, H.A.; Eastoe, C.J.; Wilder, B.T.; McIntosh, J.C.; Meixner, T.; Flessa, K.W. Groundwater Isotopes in the Sonoyta River Watershed, USA-Mexico: Implications for Recharge Sources and Management of the Quitobaquito Springs. Water 2020, 12, 3307. [Google Scholar] [CrossRef]
- Eastoe, C.J.; Towne, D. Regional zonation of groundwater recharge mechanisms in alluvial basins of Arizona: Interpretation of isotope mapping. J. Geochem. Explor. 2018, 194, 134–145. [Google Scholar] [CrossRef]
- Jasechko, S.; Taylor, R. Intensive rainfall recharges tropical groundwaters. Environ. Res. Lett. 2015, 10, 124015. [Google Scholar] [CrossRef]
- Wahi, A.; Hogan, J.; Ekwurzel, B.; Baillie, M.; Eastoe, C. Geochemical Quantification of Semiarid Mountain Recharge. Ground Water 2008, 46, 414–425. [Google Scholar] [CrossRef]
- Meixner, T.; Manning, A.H.; Stonestrom, D.A.; Allen, D.M.; Ajami, H.; Blasch, K.W.; Brookfield, A.E.; Castro, C.L.; Clark, J.F.; Gochis, D.J.; et al. Implications of projected climate change for groundwater recharge in the western United States. J. Hydrol. 2016, 534, 124–138. [Google Scholar] [CrossRef]
- Markovich, K.H.; Manning, A.H.; Condon, L.E.; McIntosh, J.C. A mountain-front recharge component characterization approach combining groundwater age distributions, noble gas thermometry, and fluid and energy transport modeling. Water Resour. Res. 2021, 57, e2020WR027743. [Google Scholar] [CrossRef]
- Coplen, T.B.; Kendall, C. Stable Hydrogen and Oxygen Isotope Ratios for Selected Sites in the U.S. Geological Survey’s NASQAN and Benchmark Surface-water Networks. USGS Open-File Rep. 2000, 00-160, 48. [Google Scholar]
- Meybeck, M. Global chemical weathering of surficial rocks estimated from river dissolved loads. Am. J. Sci. 1987, 287, 401–428. [Google Scholar] [CrossRef]
- Portugal, E.; Izquierdo, G.; Truesdell, A.; Alvarez, J. The geochemistry and isotope hydrology of the Southern Mexicali Valley in the area of the Cerro Prieto, Baja California (Mexico) geothermal field. J. Hydrol. 2005, 313, 132–148. [Google Scholar] [CrossRef]
- Water Conditioning & Purification Magazine: Water Desalinization Processes and Associated Health and Environmental Issues. Available online: http://wcponline.com/2005/01/31/water-desalination-processes-associated-health-environmental-issues/ (accessed on 15 February 2016).
- Braitsch, O. Salt Deposits, their Origin and Composition; Springer: New York, NY, USA, 1971; pp. 1–26. [Google Scholar] [CrossRef]
- Davis, S.N.; Whittemore, D.O.; Fabryka-Marin, J. Uses of chloride/bromide ratios in studies of potable water. Ground Water 1998, 36, 338–350. [Google Scholar] [CrossRef]
- Fisher, R.S.; Mullican, W.F., III. Hydrochemical evolution of sodium-sulfate and sodium-chloride groundwater beneath the Northern Chihuahuan Desert, Trans-Pecos, TX, USA. Hydrogeol. J. 1997, 5, 4–16. [Google Scholar] [CrossRef]
- Appelo, C.A.J.; Postma, D. Geochemistry, Groundwater and Pollution, 2nd ed.; A.A. Balkema Publishers: Leiden, The Netherlands, 2005; pp. 201–204. [Google Scholar]


| Type | Year | pH | Ca2+ (mg/L) | Mg2+ (mg/L) | Na+ (mg/L) | K+ (mg/L) | HCO3− (mg/L) | SO42− (mg/L) | Cl− (mg/L) | NO3− (mg/L) | Br− (mg/L) | δ18O (‰) | δ2H (‰) |
|---|---|---|---|---|---|---|---|---|---|---|---|---|---|
| Pre-dam Colorado River | 1967–2015 | 7.8 | 89 | 30 | 95 | 5 | 190 | 290 | 65 | 2.16 | 0.05 | −15.0 | −115 |
| SD | 35 | 12 | 44 | 2 | 35 | 137 | 35 | 5.00 | 0.04 | 0.3 | 2 | ||
| Post-dam Colorado River | 1980–2015 | 8.2 | 89 | 32 | 146 | 5 | 197 | 302 | 149 | 0.37 | 0.31 | −12.0 | −97 |
| SD | 12 | 4 | 29 | 1 | 15 | 49 | 35 | 0.17 | 0.04 | 0.6 | 5 | ||
| Ag. discharge | 1961–1995 | 7.8 | 271 | 117 | 881 | 9 | 392 | 941 | 1514 | 2.13 | 0.62 | −10.8 | −89 |
| SD | 72 | 37 | 83 | 1 | 45 | 97 | 570 | 0.56 | 0.01 | 0.4 | 4 | ||
| Gila River | 2004–2005 | 8.0 | 56 | 19 | 342 | 4 | 255 | 262 | 348 | 3.64 | - | −9.9 | −71 |
| SD | 50 | 14 | 352 | 5 | 137 | 257 | 411 | 4.92 | - | 1.3 | 20 | ||
| Winter rainfall | 1990–2006 | −7.2 | −47 | ||||||||||
| Largest events | 1990–2006 | −7.5 | −50 |
Publisher’s Note: MDPI stays neutral with regard to jurisdictional claims in published maps and institutional affiliations. |
© 2021 by the authors. Licensee MDPI, Basel, Switzerland. This article is an open access article distributed under the terms and conditions of the Creative Commons Attribution (CC BY) license (https://creativecommons.org/licenses/by/4.0/).
Share and Cite
Zamora, H.A.; Eastoe, C.J.; McIntosh, J.C.; Flessa, K.W. Groundwater Origin and Dynamics on the Eastern Flank of the Colorado River Delta, Mexico. Hydrology 2021, 8, 80. https://doi.org/10.3390/hydrology8020080
Zamora HA, Eastoe CJ, McIntosh JC, Flessa KW. Groundwater Origin and Dynamics on the Eastern Flank of the Colorado River Delta, Mexico. Hydrology. 2021; 8(2):80. https://doi.org/10.3390/hydrology8020080
Chicago/Turabian StyleZamora, Hector A., Christopher J. Eastoe, Jennifer C. McIntosh, and Karl W. Flessa. 2021. "Groundwater Origin and Dynamics on the Eastern Flank of the Colorado River Delta, Mexico" Hydrology 8, no. 2: 80. https://doi.org/10.3390/hydrology8020080
APA StyleZamora, H. A., Eastoe, C. J., McIntosh, J. C., & Flessa, K. W. (2021). Groundwater Origin and Dynamics on the Eastern Flank of the Colorado River Delta, Mexico. Hydrology, 8(2), 80. https://doi.org/10.3390/hydrology8020080