Abstract
A comprehensive assessment of the stable isotope distribution in the groundwater systems of South Africa was conducted in relation to the diversity in the aquifer lithology and corresponding hydraulic characteristics. The stable isotopes of oxygen (18O) and hydrogen (2H) in groundwater show distinct spatial variation owing to the recharge source and possibly mixing effect in the aquifers with the existing water, where aquifers are characterized by diverse hydraulic conductivity and transmissivity values. When the shallow aquifer that receives direct recharge from rainfall shows a similar isotopic signature, it implies less mixing effect, while in the case of deep groundwater interaction between recharging water and the resident water intensifies, which could change the isotope signature. As aquifer depth increases the effect of mixing tends to be minimal. In most cases, the isotopic composition of recharging water shows depletion in the interior areas and western arid zones which is attributed to the depleted isotopic composition of the moisture source. The variations in the stable isotope composition of groundwater in the region are primarily controlled by the isotope composition of the rainfall, which shows variable isotope composition as it was observed from the local meteoric water lines, in addition to the evaporation, recharge and mixing effects.
1. Introduction
Environmental isotopes are routinely used worldwide in the study of surface water and groundwater systems, as they provide unique information on the transport and interconnectivity of the resources and their reservoirs [1,2]. Since precipitation is the predominant source of water both for surface water and groundwater reservoirs, monitoring of the isotopic composition of rainfall helps to understand the source for moisture, condensation, and moisture transport processes in the atmosphere, on land, and in the subsurface up to the time of groundwater recharge. Groundwater recharge from rainfall and surface water sources could take place either directly or indirectly, which is an important process for the renewability of the scarce water resource in arid and semi-arid regions including southern Africa. The presence of large water bodies that can generate sufficient vapor for rainfall has direct implications for the variation of stable isotopes of atmospheric water, surface water, and groundwater. In the South African context, variations in the distribution of rainfall, geology, and topography mean that the groundwater recharge processes and the rates of recharge could vary across the country and make the recharge estimation challenging, while recharge events are unpredictable [3,4]. Uncertainties in recharge estimation lead to difficulties in groundwater resources management and enforcing the regulations. Besides, the arid and semi-arid climatic conditions of South Africa are known to create uncertainty about the role of rainfall in generating recharge as compared to humid regions, while the bedrock geology is dominantly composed of crystalline basement rocks [4].
In semi-arid regions, a much smaller proportion of rainfall recharges aquifers [3,4], and understanding the rainfall recharge process is crucial to accurately estimate the groundwater reserve. Generally, recharge processes cause a shift in the isotope composition of the recharging water mainly due to the evaporation process [1]. Stable isotope composition in rainfall is, to some extent, transferred to groundwater and the isotopic signature shift between the two water types reveals the characteristics of groundwater in the aquifer [1]. Consequently, the isotope composition of groundwater becomes a characteristic of an area within a certain recharge period, in addition to the nature of the aquifer that hosts the groundwater [4]. During periods with dry climatic conditions, the properties of the recharging water change significantly [5]. Thus, based on the variation in the stable isotope composition of groundwater, it is possible to conceptualize the variation in the recharge condition, and hence, the moisture source of the precipitation can be traced.
Therefore, this paper attempts to bring together all reliable stable isotope data of groundwater in South Africa (Figure 1) and interpretations of the information obtained using the available local meteoric water lines in terms of elucidation of moisture sources, the influence of geological heterogeneities on the isotopic signature, variability and identification of important recharge mechanisms across South Africa.
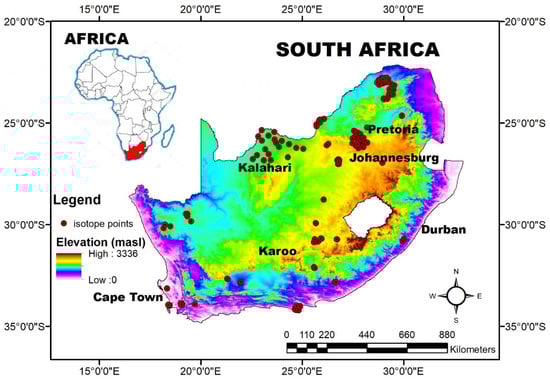
Figure 1.
Location map of stable isotope data points.
1.1. Spatial Isotope Context
The concept of “isoscapes” (i.e., isotopic landscapes) describes the mapping of large-scale and spatiotemporal distributions of stable isotope ratios in various environmental matrices such as rainfall, oceans, rocks, plants, and animals [6]. Isoscape patterns can help to answer research questions in the hydrological, climatic, paleoecological, and biological disciplines [7]. Based on the Global Network of Isotopes in Precipitation (GNIP) data, a regionalized cluster-based water isotope prediction for point- and large-scale spatiotemporal patterns of the stable isotope composition (δ2H, δ18O) of precipitation was developed [8]. This new regression equation for the global meteoric water line (GMWL) was defined based on 49 years of data (1960−2009, equation 1 [8]) that has low d-excess compared to the 1961 equation that has a d-excess of 10‰ [9].
δ2H = 7.91δ18O + 8.72‰
The distribution of stable isotopes in tap water in South Africa has been found to contain variable δ2H and δ18O compositions due to diversity in the source water [10]. It is important to note that domestic water supply from taps is primarily obtained from dams that have undergone evaporation, or from springs and boreholes with variable stable isotope composition. Therefore, the isotope composition of tap water may not be used to characterize the rainfall or groundwater accurately since the tap water source is subjected to the processes of evaporation, recycling, and filtration. However, the isoscapes of stable isotopes in the tap water and groundwater in South Africa in relation to rainfall distribution were presented in the form of spatial maps where isotope modeling has provided valuable information on the non-uniform isotope composition of the water sources [11]. Due to the widespread stable isotope variation in groundwater across the South African aquifers, it was found prudent to investigate the controls on the isotopic variation in relation to rainfall trajectories, lithological and hydrogeological diversity of the aquifers.
1.2. Climatic Setting
South Africa falls under the subtropical climatic zone that has complex air circulation dynamics as a result of the influence of the inter-tropical convergence zone (ITCZ), subtropical high-pressure zones (SHPZ) located on the South Indian Ocean, Kalahari and South Atlantic Ocean high pressure, and the southern temperate zone (STZ) characterized by a low-pressure cold front from the Antarctic [4,5,12,13]. The seasonal north-south migration of the high-pressure cells limited by the movement of the ITCZ has tremendously influenced the occurrence of rainfall and its spatial variation in South Africa. Consequently, the western part of the country receives rainfall of less than 200 mm/year (Figure 2). However, in the northwestern part, with a particular reference to the Kalahari region, which is predominantly semi-arid, the annual rainfall ranges from 200 mm to 600 mm [14]. While, the eastern section displays a humid climate with an average annual rainfall of about 1100 mm/year [4], and the southwestern coastal zones with a temperate climatic setting (Figure 2). The average annual rainfall amount for Cape Town, for example, varies between 450 mm and 1300 mm [15], while over much of the Western Cape Province, it exceeds 600 mm [16] with lower values towards the Karoo region. The spatial variation and the seasonality of rainfall also change the effective recharge to the aquifers since dry cold weather in the winter season facilitates evaporation of the water due to low humidity and, hence, water with enriched stable isotopes recharges the aquifers [17]. The average ambient temperature during the summer months ranges between 24 °C and 20 °C, while during the winter season it ranges from 10 °C to 17 °C. Based on Figure 3, the potential evapotranspiration is less than 1900 mm/yr in the high rainfall eastern sector while the Northern Cape region displays annual values of above 3000 mm/yr [12].
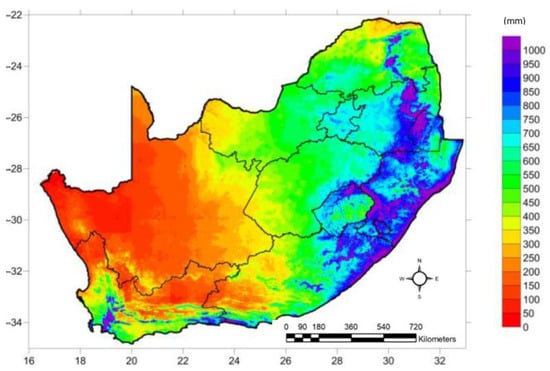
Figure 2.
Mean annual precipitation in South Africa (adapted from [12]).
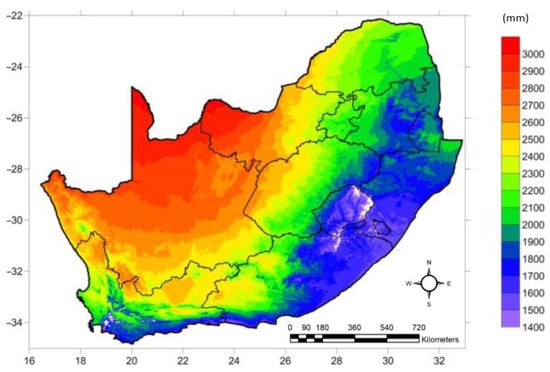
Figure 3.
Mean annual potential evapotranspiration (mm) in South Africa (adapted from [12]).
1.3. Geological Outline
The geological history of South Africa dates back to the Archean Eon where Greenstone belts form the base of the stratigraphy which occur dominantly in the northern (Limpopo) and north-eastern part of the country (Barberton), small outcrops in the eastern part of KwaZulu-Natal and circular basement rocks in the Johannesburg region (Figure 4) [18] The Archean granitoid intrusions occupy a large part of the northern and eastern part of the country including the Vredefort dome, patchy outcrops in the western and northwestern part of the country consisting of a combination of granitic gneiss, gabbro, serpentinite and granodiorite that have been eroded, weathered and tectonically altered since their emplacement [19,20]. The overlying units are composed of ultramafic intrusion, metasedimentary rocks (the Witwatersrand Supergroup, Transvaal Supergroup, Karoo Supergroup), basement granites, metasedimentary and metavolcanics (Ventersdorp Supergroup, Pongola Supergroup, Dominon Group, Natal Group, Cape Fold Belt), younger intrusions (Bushveld Igneous Complex: granodiorite, anorthosite, norite, gabbro, and granite), Kalahari Group and coastal sediments [21].
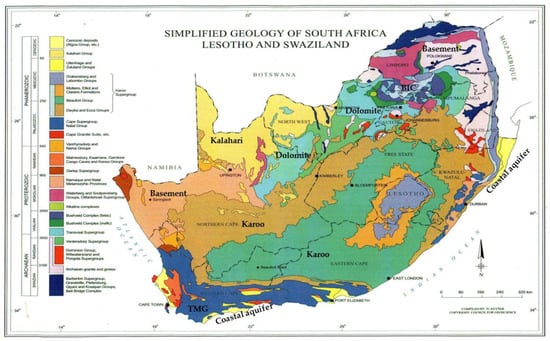
Figure 4.
Generalized geological map of South Africa (Source: [21], Council for Geosciences), where prominent aquifers are marked.
Chronostratigraphically, the Archean Eon is represented by the Greenstone belts, granites and genesis, the Witwatersrand Supergroup metasedimentary rocks, the Pongola Supergroup and Dominon Group metavolcanics; Proterozoic Eon is represented by the Transvaal Supergroup metasedimentary rocks, Bushveld Igneous Complex intrusions, Waterberg and Southpandberg Group sediments, Namaqua-Natal metamorphic province, while the Palaeozoic and Mesozoic Era are represented by the Cape Supergroup widely represented by the Table Mountain Group (TMG) metasedimentary rocks and Natal Group sediments and the Karoo Supergroup metasedimentary and meta-volcanic rocks [21]. The Cenozoic Era is represented by the Kalahari Group sediments, the Zululand Group and recent semi consolidated sediments along the coastal regions [21].
2. Materials and Methods
The collection of stable isotope data was initiated over a decade ago. Since 2014 intensive stable isotope analyses have been conducted at the University of the Witwatersrand, Johannesburg. Periodically, the groundwater samples which were collected from different parts of South Africa by the authors were analyzed using the Liquid-Water Isotope Analyzer (LWIA) machine. The LWIA uses high-resolution laser absorption spectroscopy, which provides accurate isotope ratio measurements over wide ranges of delta values (i.e., highly depleted to highly enriched stable isotopic signals). To measure the stable isotope composition, water samples were filled in 2-mL vials using a disposable pipette and then each vial was immediately capped using Teflon septa. During measurement, the samples were calibrated against reference standards with known isotope ratios and the samples were measured six times with two preparatory injections in order to minimize the standard deviation. The accuracy of the measurement was 0.20‰ and 1.0‰ for δ18O and δ2H, respectively. Some duplicate samples were measured with a similar instrument at the iThemal environmental isotope laboratory in Gauteng for quality control purposes. The long-term mean isotope data of the Global Network of Isotopes in Precipitation (GNIP), the Global Meteoric Water Line [8] was used for the interpretation of the δ18O and δ2H composition of the various groundwater samples while the Local Meteoric water Lines were used to assess the variation in slopes in relation to the humidity change cross the country.
Furthermore, existing stable isotope data were collected from published documents which were measured either through Liquid Water Isotope Analyzer or through Isotope-Ratio Mass Spectrometry (IRMS). The existing and newly generated stable isotope data were interpreted to get an insight into its spatial distribution within the various aquifers. Relevant diagrams were generated in order to extract valuable information and understand the variation in the stable isotope composition of groundwater across South Africa.
3. Results and Discussion
3.1. Characteristics of Major Aquifers
Owing to the lack of primary porosity in dense/crystalline sedimentary, volcanic, intrusive, and metamorphic rocks, the recharge and occurrence of groundwater in these secondary aquifers are highly complex and characterized by strong spatial variability [22,23,24,25,26,27]. Limited areas of the South African landmass are characterized by primary porosity aquifers that are limited to the Kalahari Group sediments, Cenozoic coastal sediments such as the Maputaland Group, Algoa Group, and some basaltic areas in the Karoo sequence. However, weathering processes through geological time and subsequent deposition provided suitable conditions for recharge to take place. Besides, the fracturing of dense crystalline rock is more important than the weathering processes in regulating groundwater recharge and circulation. Even though the rocks have undergone low-grade metamorphism, the protolith composition and original texture generate different responses, and hence, metasedimentary and metavolcanic rocks may not have similar hydraulic characteristics as intrusive rocks and Archean greenstones. As a result, aquifers in South Africa have diverse hydraulic characteristics where hydraulic conductivity plays a crucial role in facilitating groundwater recharge from rainfall, delaying recharge in the vadose zone and favoring evaporation on the surface, while transmissivity allows the mixing of recharged water during circulation within aquifers. Because of different degrees of weathering and fracturing, the main aquifers are both single and multilayered that fall under unconfined and confined conditions. Borehole records from the national groundwater archive (NGA) of the Department of Water and Sanitation (http://www.dwa.gov.za/groundwater/nga.aspx (accessed on 19 April 2021)) show that a large number of water supply boreholes are located in the crystalline basement aquifers (weathered/fractured) that tap water on average from a depth not more than 100 m. Within the Kahalari sediments and in fractured metasedimentary and metavolcanic rocks, the depth extends to over 400 m. Only limited boreholes in the Karoo sedimentary aquifers pass the 2000 m mark, while for energy and mining-related drillings in the Bushveld Igneous Complex, the depth exceeds 300 m.
The majority of the shallow aquifers in South Africa are composed of alluvial sediments, weathered crystalline rocks and semi-consolidated Cenozoic sediments. The fractured metasedimentary rocks that are located at different depths give rise to a confined aquifer owing to the configuration of the confining unit. However, based on the investigation that was conducted for the current work, generally the water strikes and final water levels in boreholes during drilling range between 10 and 15 m, while due to ductile deformation and inter-layering of rocks with diverse hydraulic characteristics, there is a very good possibility to strike an artesian aquifer, particularly in the Table Mountain Group, Karoo Supergroup and Kahalari Group aquifers.
The presence of dolerite dykes and sills, lamprophyre and syenite dykes that cross-cut the basement, metasedimentary and metavolcanic rocks support the notion of deep-originated geological structures and hence, controlling the depth of recharge and groundwater circulation. Due to the variable hydraulic nature of dykes and sills as compared to the host rock, groundwater in these structures could contain water with variable isotopic composition.
The hydraulic conductivity (K) and transmissivity (T) values presented in Table 1 signify the highly variable nature of aquifers in South Africa. It is obvious that due to the consideration of saturated thickness in the calculation of transmissivity, the values can comfortably characterize the aquifer rather than hydraulic conductivity which represents a velocity vector. The variability in hydraulic parameters in various aquifers could be attributed to the dominance of secondary porosity that controls recharge mechanisms and rates into aquifers at different scales. Even though the K values are small, the T values vary widely with the highest record in the dolomitic aquifers reach up to 25,000 m2/day (Table 1). In limited areas, the TMG quartzites, coastal sediments and Bushveld Igneous Complex also have high T values of 2485 m2/day, 156 m2/day and 500 m2/day, respectively. It is known that aquifers with high K and T could facilitate easy circulation and pronounced mixing of groundwater in aquifers from recharge to discharge areas. Consequently, the isotopic composition of groundwater at the time of sampling may not necessarily correlate with the actual isotope composition of the groundwater.

Table 1.
Representative hydraulic parameters (TMG refers to Table Mountain Group).
3.2. Hydrogeological Characteristics of the Main Aquifers
Alluvial deposits constitute the most widespread shallow unconfined aquifers in South Africa that occur along river valleys, tectonic grabens and low-lying areas. These provide an opportunity for direct rainfall recharge, localized storage and mixing of water with surface water systems including rivers, streams and wetlands. Groundwater in the shallow alluvial aquifers is characterized by distinct isotopic signature from rainfall, seepage from stream network, and water that runs off from hillslopes and recharges the aquifers [2]. In this connection, sand rivers are defined as shallow unconsolidated alluvial deposits in the active stream courses within which thin saturated basal sands form limited aquifers with the depth to the water table which is less than two meters, within unconsolidated sands that are regularly recharged during rainfall [37]. For example, in some areas of the lower Crocodile River basin (west of the city of Pretoria), some boreholes that tap alluvial aquifer produce as much as 16 l/s [22]. These shallow unconsolidated sandy alluvial aquifers, overlying the basement crystalline rocks, often provide water for small-scale irrigation. Hence, recharge from episodic rainfall and runoff that joins streams sustain the aquifers. It was also reported that there is a hydraulic disconnection between the alluvial aquifer and the regional groundwater, hence, these alluvial aquifers usually contain locally recharged water [37].
The semi-consolidated Cenozoic sediments occupy the coastal part of South Africa (southwestern, southern, and southeastern regions) with variable thicknesses. They overlay crystalline rocks of different ages that have undergone numerous geological processes. These sediments were found to be suitable for groundwater storage and circulation in the coastal regions owing to the presence of primary porosity often they contain fresh groundwater, as opposed to saline water which originates from the sea. Due to their localized nature, groundwater occurrence is characterized by local flow, while the underlying bedrock could be connected to the regional groundwater flow [16,23,24,25,26,33].
In the Kalahari region, the Cenozoic Kalahari Group sediments constitute productive aquifers that are composed of different formations containing clayey gravel, siltstone, marl, and sandstone. These lithologies form a shallow aquifer while the deep aquifer is composed of the Karro Supergroup rocks. Since the Kalahari sediments overly the Karoo sedimentary rocks, they mostly form an unconfined system with a predominant local recharge, which is facilitated by the Kalahari sand, while the underlying Karro Supergroup rocks make up confined aquifer with a regional groundwater flow. Such characteristics were evident from the Stampeient artesian system that extends from Namibia to South Africa [38]. The Kalahari and the Karoo aquifers can be categorized as transboundary aquifers as a result of their extensive nature covering the vast regions in southern Africa. The Kalahari sediments cover areas in South Africa, Botswana and Namibia, while the Karoo sediments are prevalent in South Africa and Lesotho, and hence, constituting unconfined and confined transboundary aquifers with substantially high aquifer productivity (Table 2).
Table 2.
Summary of the aquifer characteristics.
The Karoo Supergroup rocks are classified into different Groups and Formations with dominant lithologies represented by sandstone, shale, mudrock, and diamictite [32,39,40], where hydrogeological characteristics of the rocks were enhanced by the presence of dolerite sills and dykes, besides various faults and fractures. As a result, both shallow-unconfined aquifers are widespread with depths reaching about 300 m, while deep aquifers, particularly, confined are unique to the Karoo region with depths as much as 2000 m [32,40,41,42]. The Karoo groundwater Atlas proposed the presence of three zones of groundwater occurrence, viz: the main shallow aquifer (<300 m); an intermediate zone down to about 1000 m; and a deep zone down to the basement with pockets of thermal, saline, confined groundwater [42]. The complexity of the Karoo aquifer was enhanced by its location in the arid climatic setting where rainfall is minimal. The prevalence of shale/mudstone/siltstone (Beaufort Group), dolerite intrusions with ring complexes and alluvial deposits help to retain recharging water at a shallow depth. However, the presence of deformed metasedimentary layers at depth helps to facilitate vast groundwater storage, besides the creation of confined aquifers and hence, boreholes sustain irrigation and livestock farming in the region.
The Cape Supergroup rocks primarily occur in the southern part of South Africa with the most extensive metasedimentary outcrops categorized as the Table Mountain Group (TMG). The TMG with a thickness of about 2000 m, consists of partially metamorphosed sandstones and quartzites. Because of the presence of fractures in the rocks, the aquifer constitutes one of the major fractured aquifers in South Africa [16,42]. Besides, the presence of geothermal phenomena below 2000 m depth signifies the possibility of deep groundwater circulation [16,43,44]. Due to tectonic disturbances and subsequent erosion, the Table Mountain Group metasedimentary rocks outcrop in different locations in the Western Cape and Eastern Cape provinces. Irrespective of lithology, all rocks (quartzite, sandstone, shale) act as promising aquifers. In the eastern and northeastern sectors, mainly in the KwaZulu-Natal Province, the Natal Group sandstones and the Masikaba Formation form highly productive fractured aquifers that have been reported to have high groundwater potential due to extensive fracturing and faulting [45].
The fracturing of quartzites and shales of the Witwatersrand and Transvaal Supergroups provides a suitable condition for recharging water, besides its association with the quartzites, shales and dolomites of the Transvaal Supergroup. The characteristic feature of the Witwatersrand Supergroup rocks is the widespread presence of contact springs that circulate through quartzites and emerges at the contact with shale. The most productive aquifer from the Transvaal Supergroup is represented by the dolomites of the Malmani Subgroup often identified as the Malmani Dolomites, which contain five Formations (from base to top: the Oaktree, Monte Christo, Lyttelton, Eccles, and Frisco Formations) that are differentiated based on variations in stromatolite morphology, chert content, and the presence of shale and chert-breccia horizons [46,47]. The karst structures were found to be more prominent in the chert-rich dolomite of the Eccles and Monte Christo Formations [46], resulting in variable water-bearing and storage characteristics of dolomites [48].
The Malmani dolomitic aquifers have high importance for future water supply in South Africa [47,49]. Regional assessment of dolomitic aquifers has been conducted through different projects as reported [35,47], and includes recharge modeling based on the 14C data [50]. These studies revealed that the dolomites of the Malmani Subgroup act as the main aquifer in the area and are characterized by extreme spatial heterogeneity that strongly influences the hydraulic behavior of the aquifer [22,47].
The crystalline basement rocks support groundwater supply for various industrial activities. In the basement aquifers, groundwater often occurs in the upper weathered and fractured zone in unconfined aquifer conditions. Analysis of water strike and final static water level shows that over 50% of boreholes in the Johannesburg region and Limpopo crystalline belts occur under semi-confined condition, highlighting the control of lithology and structures in the groundwater occurrence in the area [23,26,27,28,33,51,52,53]. The borehole yields of the basement aquifers in the Johannesburg region vary between 1.5 to 6.8 l/s, while in the Limpopo crystalline aquifers, the yield varies between 2.1 to 9.5 l/s [52]. This variation was attributed to the occurrence of geological structures such as faults, joints, folds, and dykes that control recharge and groundwater flow.
3.3. Stable Isotope Distribution
The regression equations for the Local and Global Meteoric Water Lines (LMWL and GMWL) are presented in Table 3 and their respective plots of the slopes of the LMWL (Figure 5) reveal an interesting trend of the slopes of the LMWL lower than the slopes of the GMWL. The lower slopes of all LMWLs in South Africa compared to the slope of the GMWL are attributed to the semi-arid climatic condition of the southern African region and the associated low atmospheric humidity, except maybe for the eastern coastal region of the KwaZulu-Natal Province. This could be due to months with low or no rainfall (dry season, or end and beginning of wet season) that occurs in low humidity atmospheric condition where rainfall evaporates between the cloud and soil. Moreover, these rainfalls could be more enriched than rainfall generated in the middle of a wet season due to the combination of high ambient temperature, limited precipitation, unsaturated atmospheric profile resulting in a higher enrichment, which leads to the lower slopes of the LMWL.
Table 3.
Regression equations for local meteoric water lines in various parts of South Africa.
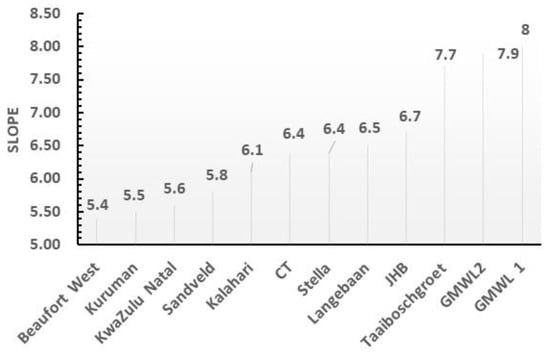
Figure 5.
The Local MWL slopes displaying lower slopes than the GMWL (see Table 3 for the MWL equations) in South Africa.
The first GMWL was reported in 1961 based on one year of rainfall isotope data with the regression equation of δ2H = 8δ18O + 10‰ [9]. While, based on 49 years of rainfall isotope data, a new regression line has been reported [8] that has a more or less similar slope but smaller d-excess signifying the importance of regional moisture sources over the local system.
In the South African context, the western section of the Karoo, Northern Cape, and the northern part of the Western Cape provinces that are relatively close to the south Atlantic air mass display the lowest slope of 5.4, 5.5, and 5.8, respectively (Table 3 and Figure 5), which could indicate the dominance of low humidity air mass in the region besides the location of the areas in the arid- and semi-arid climatic setting.
However, regions with relatively high slopes are located in the Cape Town area, Johannesburg-Pretoria region, and Limpopo province, indicating the prevalence of high humidity moisture source for the rainfalls limited to different seasons, often controlled by the southerly temperate moisture generated by low-pressure cells that advance towards South Africa from the south polar region besides subtropical moisture source from the southern Indian Ocean [4,13,54].
The δ18O and δ2H composition of most groundwaters reflects the mean weighted annual isotope composition of precipitation [1,2]. However, it is clear that for precipitation to reach the zone of saturation (groundwater zone) it requires to be facilitated by the hydraulic parameters including porosity, hydraulic conductivity and transmissivity that regulate the recharging water and mixing process. If the lithology of the aquifer is composed of alluvium, weathered zone, fractured zones, and karst, it facilitates direct recharge from rainfall. Often preferential and piston flows along tectonic lines and karstic environment display unique isotope signature. The variability in the hydraulic characteristics could affect the effective rainfall to pass through the vadose zone and reach the aquifer and hence, causing mixing of stable isotopes during the circulation process. In sedimentary structure with primary porosity, the rate mixing in the vadose zone may not be linked to its saturation level but more with its capacity to transfer water.
If the soil structure is homogeneous the vertical flow velocity is identical which corresponds to a piston flow model, therefore, the newly arriving recharge pushes the previous recharge without mixing. If the soil structure is heterogeneous the vertical flow velocity is heterogeneous then the newly arriving recharge pushes the previous recharge with partial mixing between them. If the vadose zone is thick then, mixing could be achieved.
Aquifers with high K often contain recharge from direct rainfall with minimal evaporation effect.
The rainfall-runoff relationship, which is controlled by the local geology and slope play important role in the contribution of rainfall to replenish the aquifer [55,56,57]. The unsaturated zone with low K could delay recharge and hence affecting the δ18O and δ2H composition. However, in high K condition, there could be less transit time in the unsaturated zone and hence, mixing could take place only at the contact with the zone of saturation.
Different regions with variable geological compositions show different isotope values (Figure 6) owing to the variability in hydraulic conductivity and transmissivity that in turn controls recharge and mixing of water in the aquifers at different proportions. Variations in the stable isotope composition of groundwater are primarily controlled by the isotope composition of the rainfall, which shows variable values as it was observed from the local meteoric water lines (Table 3), besides evaporation and subsequent recharge and mixing effect. When mixing takes place in isotopically distinct water, the process proceeds based on isotopic proportion as per the equation δsample = ΧδA + (1 − Χ)δB [1], where Χ represents the percentage of mixing proportion from the end members A and B. This implies that when rainfall (A) mixes with the resident groundwater (B) in the aquifer, the isotopic signature could change accordingly based on the proportional mixing. Based on this hypothesis, the mixing effect could progressively disappear as the volume of recharge is negligible with respect to total water in the aquifer. Besides, this process can be verified with two samplings during a year in different seasons.
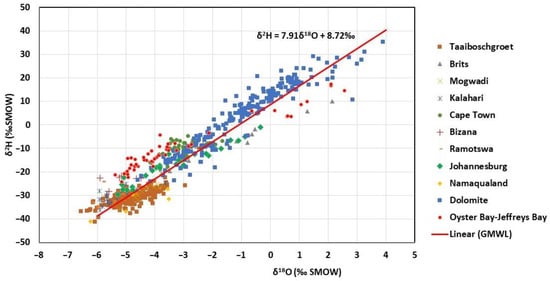
Figure 6.
The distribution of δ18O and δ2H in groundwater in different aquifers (GMWL from [8]).
In the Cape Town region, the low isotopic shift between rainfall and springs suggests that the recharge for the cold springs was related to recent local rainwater [15]. It is important to note the fact that the steady flow of the springs (10 to 20 l/s) throughout the year was related to the occurrence of a vast aquifer with high storage and transmission potential. The values of δ2H and δ18O for thermal springs in the Cape Town area range from −39.0‰ to −16.0‰ and −7.11‰ to −0.27‰, respectively, while in cold springs the δ2H values range from −5.0‰ to −19.0‰ and δ18O ranges from −1.40‰ to −4.40‰ which were related to high-temperature isotopic exchange than evaporation [15]. The cold springs show the isotopic signal of the local rainfall but the shift in the hot springs signifies different sources or deep groundwater circulation which is isolated from the present-day recharge or mixing effect.
In the areas where the main geological setup is composed of basement granites and greenstones, such as in the Limpopo Province, the extensional tectonic disturbance has generated grabens later filled by the Karoo basaltic lava flows and sediments (e.g., Taaiboschgroet area: Limpopo); with a high density of dolerites dykes (e.g., Mogwadi area), besides regional faults that cross-cut several lithologies which facilitate the occurrence of groundwater generated from the meager rainfall in the area (about 450 mm/yr). In the Taaiboschgroet area, the mean δ2H and δ18O values have a very small range of variation independent of sampling depth and lithology (the Clarens sandstone and the overlying Lebombo basalt of the Karoo Supergroup), with a deuterium excess of about +3‰ [58]. The small range of δ18O of variation (−4‰ to −6‰), with a regression slope of 5.5 for groundwater in the unconfined aquifer (basaltic in composition) indicates that the recharge condition was fairly uniform, with regional groundwater flows along the faults [58]. Even though boreholes tap the lower Clarens sandstone (about 300 m thick) and the overlying Lebombo basalt of the Karoo Supergroup that has a thickness of 200 m, the results display an average composition of −30.8‰ for δ2H and −4.77‰ for δ18O (Table 4). The δ2H and δ18O plot presented in Figure 6 shows that fairly closely clustered data, independent of sampling depth and lithology, signifies uniformity in hydraulic characteristics of the aquifers such as the Taaiboschgroet, Oyster bay-Jeffreys bay, Namaqualand, Bongwana-Bizana, Ramotswa and Kahalari areas. However, the plot in Figure 6 further reveals the possibility of mixing in the aquifers and the presence of different recharge events in different seasons.
Table 4.
Statistical results for the δ2H and δ18O composition in groundwater (n refers to the number of samples).
The comparative plots, based on the minimum, maximum and average values (Figure 7), and the statistical data in Table 4 depict highly variable δ2H and δ18O compositions. For example, the monitoring results obtained from one dolomite cave drip shows a wide range of isotopic variation (Figure 6 and Figure 7) which seems to be seasonally controlled infiltration from rainfall with a piston or preferential flow mechanism. In this condition, there is less chance of mixing and hence reflecting the isotope composition of the recharging water. While the remaining samples from boreholes show a low range of variation between the maximum and minimum compositions even though recharged by rainfall, which could be attributed to a proportional mixing effect during the recharge process within the aquifer. The wider gap between the maximum and minimum values in Figure 7 a and b could signify the variation in the δ2H and δ18O composition of recharging water depending on the rainfall characteristics and degree of mixing.
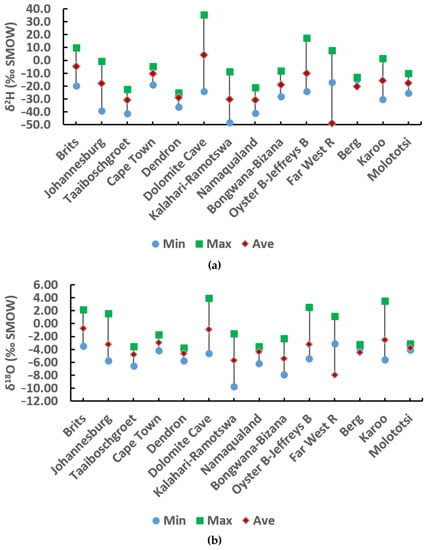
Figure 7.
Comparative plot showing the distribution of the Minimum, Maximum and Average values (a) δ2H and (b) δ18O.
The δ2H and δ18O composition of water vary temporally and spatially based on the geographic location and moisture source [3,4,5,13]. Often, the regional approach in the stable isotope application gives a holistic view of sources of recharging water, seasonality of rainfall, and regional groundwater circulation. The variation in the environmental isotopes of water in rainfall and groundwater in southern Africa shows that the lowest δ18O values (<−6.00‰) in groundwater are from the Northern Cape Province. While, the highest δ18O values (>−1.00‰) are believed to be derived from irrigated areas where evaporation enrichment is likely to have occurred, which subsequently shows the 18O enrichment in the groundwater. This indicates that only the moisture source that generates recharge cannot control the isotopic signature but also the land use activities [59].
Based on the Department of Water and Sanitation National groundwater pollution project database it was reported that the δ2H values in groundwater of South Africa range from −57.0‰ to +5.6‰, while the δ18O values range from −6.80‰ to +1.10‰ [11,59]. However, the current data compilation revealed that the δ2H values in groundwater range from −48.2‰ to 35.3‰, while δ18O ranges from −9.74‰ to 3.9‰ with average values of −14.5‰ for δ2H and −3.09‰ for δ18O with the most stable isotope depleted and enriched groundwater distributed in the drier part of the country indicating a long trajectory for moisture from cold/polar region or rainout effect. The highest calculated d-excess is in the range of 21.8‰. Recently, it was reported that the complex trajectory of moisture from the polar region towards the South African interior with some characteristic feature of highly depleted moisture is not related to the nearby oceans [53].
Based on the 18-Oxygen and 14-Carbon composition of groundwater, three groups of aquifers were recognized in the Karoo region (Figure 8) [41,60], similar to the classifications of the groundwater occurrence into shallow, intermediate and deep aquifers [42], where deep groundwater in the Karoo lies below 1500 m depth and is characterized by an average δ18O value of −7.00‰ and δ2H value of −37.0‰. While the intermediate aquifers (with mixed water) are characterized by an average δ18O value of −5.20‰ and δ2H value of −28.0‰. This shows the distinct isotopic variation of the deeper aquifer that may not be related to the current local rainfall but water recharged at different times from variable moisture sources that circulated several hundred or thousands of meters depth. In this process, the mixing of water is inevitable thereby altering the isotopic composition.
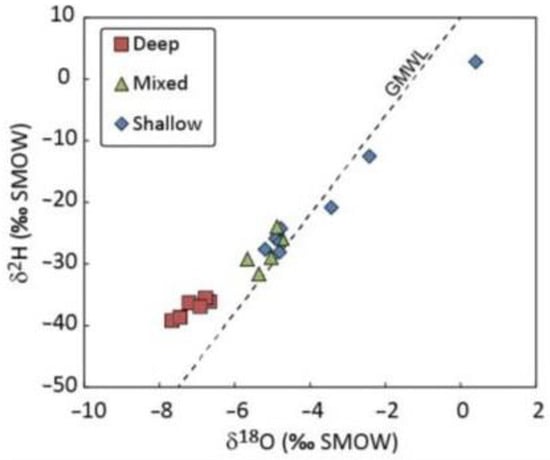
Figure 8.
The δ18O and δ2H plot for Karoo groundwater (Source: [41,60]).
The isotope compositions in local groundwater in the semi-arid region, such as in the Karoo, Kalahari and Northwest regions in general, indicate a more depleted signature than the local rainwater at the time of sampling. The local groundwater isotopic composition falls around −38 ± 5.0‰ for δ2H and −6.5 ± 2.5‰ for δ18O than the bulk rainwater isotopic compositions, which indicates that the recharged water originated from a series of relatively depleted rainfall events, with individual isotopic compositions, even lighter than the bulk sampled rainwater [5] (Figure 8). This could also be attributed to the differential recharge time (season), rainfall event, mixing and regional groundwater circulation. This observation underscores the importance of the hydraulic property of the aquifer in regulating recharge.
Unless shallow alluvial aquifers are considered, recharging water will take a long journey to diffuses through or cross the unsaturated zone to reach the aquifer.
Despite the general understanding of the lack of groundwater recharge in the Kalahari aquifers because of limitation in the rainfall occurrence and high evapotranspiration, there exist several pieces of isotopic evidence that support the contrary [61,62]. The overall results suggest that the δ18O and δ2H composition roughly decreases from the eastern part of the country to the west while the isotopes are relatively enriched as compared to those in Botswana and Namibia [61]. In general, the isotopic composition of rainfall and groundwater show diverse compositional variation.
4. Conclusions
The δ18O and δ2H isotopic data of groundwater throughout South Africa were compiled, integrated with newly generated supplemental data and interpreted to understand the recharge sources, mechanisms and isotopic variability in light of the diversity of aquifer hydraulic properties across the country.
The results indicate that the δ18O and δ2H composition of groundwater at the time of sampling may not necessarily correlate with the overall isotope composition of the recharging water in the various aquifers. The variability in the hydraulic conductivity and transmissivity appear to affect the effective rainfall to pass through the vadose zone and reach the aquifer and hence, causing mixing of water with variable stable isotope composition. Thus, different regions with variable geological conditions show different isotope values owing to the variability in hydraulic conductivity and transmissivity that in turn controls recharge and mixing of water in the aquifers at different proportions. The unsaturated zone with low T in arid and semi-arid regions favors slow groundwater recharge with a substantial change in the δ18O and δ2H composition due to evaporation and mixing process if sufficient water is encountered. Otherwise, proportional mixing of the incoming recharging water and resident water is expected in the upper part of the zone of saturation. The predominant presence of an indirect recharge from surface water alters the δ18O and δ2H composition through the evaporation process besides mixing with the surface impoundments. The irrigation return was identified with the enriched δ18O and δ2H composition in groundwater, hence the importance of land-use change in controlling the stable isotope signature.
The observed alignment of the isotopic data along the meteoric water line also confirms the mixing trend. Very closely clustered data suggest the possibility of a similar source and uniform mixing of water. Such aquifers display a small range in the maximum and minimum composition. On the other hand, a wide gap signifies variability in the recharge source, less chance of mixing and climatic control on recharge.
The isotopic data further shows that the long trajectory of moisture from the southern polar region has impacted the isotope composition in various parts of the country with a depleted δ18O and δ2H signatures. The shallow aquifers that are composed of alluvial sediments and cold springs often show the isotopic signature of the recharging rainfall as opposed to thermal springs and deep groundwater that are subjected for mixing. Often, shallow karstified dolomites provide access for direct rainfall recharge while the deeper system might have been isolated from present-day meteoric sources as a result of the small size of fractures and hence display depleted isotope signature. A similar isotopic feature was observed in the Karoo and Kalahari sedimentary systems. Though the current paper clearly reveals regional stable isotopic compositions and the processes responsible for the isotopic variability, the authors recommend further studies based on continuous rainfall and groundwater stable isotopic monitoring at the local scale.
Author Contributions
T.A.A. has compiled the data and drafted the manuscript, M.B.D. and H.M. have contributed by enriching it and critically reviewed the manuscript. All authors have read and agreed to the published version of the manuscript.
Funding
No funding was received from any source to prepare this review paper.
Institutional Review Board Statement
Not applicable.
Informed Consent Statement
Not applicable.
Data Availability Statement
Acknowledgments
We wish to thank the contribution of the three anonymous reviewers through a critical review of the manuscript.
Conflicts of Interest
There is no conflict of interest with any company or institution in the preparation of this manuscript.
References
- Clark, I.D.; Fritz, P. Environmental Isotopes in Hydrogeology; Lewis Publishers: New York, NY, USA, 1997; 328p. [Google Scholar]
- Abiye, T.A. (Ed.) The Use of Isotope Hydrology to Characterize and Assess Water Resources in South(ern) Africa; WRC: Pretoria, South Africa, 2013; 211p. [Google Scholar]
- Xu, Y.; Beekman, H.E. Groundwater Recharge Estimation in Southern Africa; UNESCO Paris: Paris, France, 2003; 206p. [Google Scholar]
- Abiye, T.A. Synthesis on groundwater recharge in Southern Africa: A supporting tool for groundwater users. J. Groundwater Sustain. Dev. 2016, 2, 182–189. [Google Scholar] [CrossRef]
- Van Wyk, E. Correlations between rainwater and groundwater geochemistry signatures with reference to episodic rainfall events in semi-arid environments, South Africa. In The Use of ISOTOPE Hydrology to Characterize and Assess Water Resources in South(ern) Africa; Abiye, Ed.; WRC: Pretoria, South Africa, 2013; pp. 102–110. 210p. [Google Scholar]
- Bowen, G.J.; West, J.B. Isotope Landscapes for TerrestrialMigration Research Tracking Animal Migration with Stable Isotopes; Academic Press: New York, NY, USA, 2008; pp. 79–106. [Google Scholar]
- Wassenaar, L.I.; Van Wilgenburg, S.L.; Larson, K.; Hobson, K.A. A groundwater isoscape (δD, δ18O) for Mexico. J. Geochem. Explor. 2009, 102, 123–136. [Google Scholar] [CrossRef]
- Terzer, S.; Wassenaar, L.I.; Araguás-Araguás, L.J.; Aggarwal, P.K. Global isoscapes for 18O and 2H in precipitation: Improved prediction using regionalized climatic regression models. Hydrol. Earth Syst. Sci. 2013, 17, 1–16. [Google Scholar] [CrossRef]
- Craig, H. Isotopic Variations in Meteoric Waters. Science 1961, 133, 1702–1703. [Google Scholar] [CrossRef] [PubMed]
- West, A.; February, E.; Bowen, G. Creating a Map of Stable Isotopes in Tap Water Across South Africa for Hydrological, Ecological and Forensic Applications; WRC: Pretoria, South Africa, 2011. [Google Scholar]
- West, A.G.; February, E.C.; Bowen, G.J. Spatial analysis of hydrogen and oxygen stable isotopes (“isoscapes”) in groundwater and tap water across South Africa. J. Geochem. Explor. 2014, 145, 213–222. [Google Scholar] [CrossRef]
- Schulze, R.E.; Maharaj, M.; Lynch, S.D.; Howe, B.J.; Melvil-Thomson, M. South Africa Atlas of Agrohydrology and Climatology; WRC: Pretoria, South Africa, 1997. [Google Scholar]
- Van Wyk, E. Estimation of Episodic Groundwater Recharge in Semi-Arid Fractured Rock Aquifers. Ph.D. Thesis, University of the Free State, Bloemfontein, South Africa, 2010; 272p. [Google Scholar]
- Tessema, A.; Mengistu, H.; Chirenje, A.; Abiye, T.A.; Demlie, M.B. The relationship between Lineaments density and Borehole yield in the Northwest Province, South Africa: Results from Geophysical Studies. Hydrogeol. J. 2012, 20, 351–368. [Google Scholar] [CrossRef]
- Harris, C.; Diamond, R. Oxygen and hydrogen isotopes record of cape town rainfall and its application to recharge studies of Table Mountain groundwater. In The Use of Isotope Hydrology to Characterize and Assess Water Resources in South(ern) Africa; Abiye, Ed.; WRC: Pretoria, South Africa, 2013; pp. 38–52. 210p. [Google Scholar]
- Rosewarne, P.N. Hydrogeological characteristics of the Table Mountain Group Aquifers. In A Synthesis of the Hydrogeology of the Table Mountain Group—Formation of a Research Strategy; Pietersen, K., Parsons, R., Eds.; WRC: Pretoria, South Africa, 2002; pp. 33–44. [Google Scholar]
- Abiye, T.; Mengistu, H.; Masindi, K.; Demlie, M. Surface Water And Groundwater Interaction in The Upper Crocodile River Basin, Johannesburg, South Africa: Environmental Isotope Approach. South Afr. J. Geol. 2015, 118, 109–118. [Google Scholar] [CrossRef]
- Brandl, G.; Cloete, M.; Anhaeusser, C.R. Archaean Greenstone Belts. In The Geology of South Africa; Johnson, M.R., Anhaeusser, C.R., Thomas, R.J., Eds.; The Geological Society of South Africa, Council for Geosciences: Pretoria, South Africa, 2006; pp. 9–56. 691p. [Google Scholar]
- Mccarthy, T.; Rubidge, B. The Story of Earth and Life; Struik: Cape Town, South Africa, 2005; 336p. [Google Scholar]
- Robb, L.J.; Brandl, G.; Anhaeusser, C.R.; Poujol, M. Archaean granitoid intrusions. In The Geology of South Africa; Johnson, M.R., Anhaeusser, C.R., Thomas, R.J., Eds.; The Geological Society of South Africa, Council for Geosciences: Pretoria, South Africa, 2006; pp. 57–94. 691p. [Google Scholar]
- Johnson, M.R.; Anhaeusser, C.R.; Thomas, R.J. (Eds.) The Geology of South Africa; The Geological Society of South Africa, Council for Geosciences: Pretoria, South Africa, 2006; 691p. [Google Scholar]
- Barnard, H.C. An Explanation for the 1:500,000 Hydrogeological Map of Johannesburg 2526; Department of Water Affairs and Forestry: Pretoria, South Africa, 2000; 84p.
- Vegter, J.R. Hydrogeology of Groundwater, Limpopo Granulite-Gneiss Belt; WRC: Pretora, South Africa, 2001; 81p. [Google Scholar]
- Vegter, J.R. Hydrogeology of Groundwater Region 1: Makoppa Dome; WRC: Pretoria, South Africa, 2001; 42p. [Google Scholar]
- Vegter, J.R. Hydrogeology of the Groundwater Region 7. Polokwane/Pietersburg Plateau; WRC: Pretora, South Africa, 2003; 41p. [Google Scholar]
- Holland, M. Hydrogeological Characterisation of Crystalline Basement Aquifers within the Limpopo Province, South Africa. Ph.D. Thesis, The University of Pretoria, Pretoria, South Africa, 2011. [Google Scholar]
- Abiye, T.A.; Mengistu, H.; Demlie, M.B. Groundwater resource in the crystalline rocks of the Johannesburg area, South Africa. J. Water Resour. Protect. 2011, 3, 199–212. [Google Scholar] [CrossRef][Green Version]
- Mohuba, S.C.; Abiye, T.A.; Demlie, M.B.; Modiba, M.J. Hydrogeological Characterization of the Thyspunt Area, Eastern Cape Province, South Africa. Hydrology 2020, 7, 49. [Google Scholar] [CrossRef]
- Woodford, A.C. Interpretation and applicability of pumping-tests in Table Mountain Group Aquifers. P7184. In A Synthesis of the Hydrogeology of the Table Mountain Group-Formation of a Research Strategy; Pietersen, K., Parsons, R., Eds.; WRC: Pretoria, South Africa, 2002; 258p. [Google Scholar]
- Meyer, R.; Talma, A.S.; Duvenhage, A.W.A.; Eglington, B.M.; Taljaard, J.; Botha, J.F.; Verwey, J.; van der Voort, I. Geohydrological Investigation and Evaluation of the Zululand Coastal Aquifer; WRC: Pretoria, South Africa, 2002. [Google Scholar]
- Nel, J.; Nel, M.; Dustay, S.; Siwawa, S.; Mbali, S. Towards a Guideline for the Delineation of Groundwater Protection Zones in Complex Aquifer Settings; WRC: Pretoria, South Africa, 2014. [Google Scholar]
- Botha, J.F.; Verwey, J.P.; van der Voort, I.; Vivier, J.J.P.; Buys, J.; Colliston, W.P.; Look, J.C. Karoo Aquifer: Their Geology, Geometry and Physical Properties; WRC: Pretoria, South Africa, 1998; 192p. [Google Scholar]
- Holland, M.; Witthüser, K. Evaluation of geologic and geomorphologic influences on borehole productivity in crystalline bedrock aquifers of Limpopo Province, South Africa. Hydrogeol. J. 2011, 19, 1065–1083. [Google Scholar] [CrossRef]
- Titus, R.; Beekman, H.; Adams, S.; Strachan, L. (Eds.) The Basement Aquifers of Southern Africa; WRC: Pretora, South Africa, 2009. [Google Scholar]
- Kafri, U.; Foster, M. Hydrogeology of the Malmani dolomite in the Klip River and Natalspruit basins, South Africa. Environ. Geol. Water Sci. 1989, 13, 153–166. [Google Scholar] [CrossRef]
- Schrader, A.; Erasmus, E.; Winde, F. Determining hydraulic parameters of a karst aquifer using unique historical data from large scale dewatering by deep level mining—A case study from South Africa. Water S. Afr. 2014, 40, 555–570. [Google Scholar] [CrossRef]
- Walker, D.; Jovanovic, N.; Bugan, R.; Abiye, T.A.; du Preez, D.; Parkin, G.; Gowing, J. Alluvial aquifer characterisation and resource assessment of the Molototsi sand river, Limpopo, South Africa. J. Hydrol. Reg. Stud. 2018, 19, 177–192. [Google Scholar] [CrossRef]
- Peck, H. The Preliminary Study of the Stampriet Transboundary Aquifer in the South East Kalahari/Karoo Basin. Master’s Thesis, University of the Western Cape, Cape Town, South Africa, 2009; 93p. [Google Scholar]
- A Synthesis of the Hydrogeology of the Table Mountain Group-Formation of a Research Strategy; Pietersen, K., Parsons, R., Eds.; WRC: Pretoria, South Africa, 2002; 258p. [Google Scholar]
- Woodford, A.C.; Chevallier, L. (Eds.) Hydrogeology of the Main Karoo Basin: Current Knowledge and Future Research Needs; WRC: Pretora, South Africa, 2002; 506p. [Google Scholar]
- Murray, R.; Swana, K.; Miller, J.; Talma, A.S.; Tredoux, G.; Vengosh, A.; Darrah, T. The Use of Chemistry, Isotopes and Gases as Indicators of Deeper Circulating Groundwater in the Main Karoo Basin; WRC: Pretoria, South Africa, 2015; 243p. [Google Scholar]
- The Karoo Groundwater Atlas; SRK Consulting (Pty)Ltd.: Cape Town, South Africa, 2012; 18p.
- Xu, Y.; Wu, Y.; Duah, A. Groundwater Recharge Estimation of Table Mountain Group Aquifer Systems with Case Studies; WRC: Pretoria, South Africa, 2007; 196p. [Google Scholar]
- Hartnady, C.H.H.; Hay, E.R. Fracture system and Attribute studies in Table Mountain Group Groundwater Target generation. In A Synthesis of the Hydrogeology of the Table Mountain Group-Formation of a Research Strategy; Pietersen, K., Pasons, R., Eds.; WRC: Pretoria, South Africa, 2002; pp. 89–96. [Google Scholar]
- Demlie, M.; Titus, R. Hydrogeological and hydrogeochemical characteristics of the Natal Group sandstone, South Africa. S. Afr. J. Geol. 2015, 118, 33–44. [Google Scholar] [CrossRef]
- Eriksson, K.A. and Truswell, J.F. Stratotypes from the Malmani Subgroup north-west of Johannesburg, South Africa. Trans. Geol. Soc. S. Afr. 1974, 77, 211–222. [Google Scholar]
- Meyer, R. Hydrogeology of Groundwater, The Karst Belt; WRC: Pretoria, South Africa, 2014; 285p. [Google Scholar]
- Bredenkamp, D.B.; Vogel, J.C.; Wiegmans, F.E.; Xu, Y.; Janse van Rensburg, H. Use of Natural Isotopes and Groundwater Quality for Improved Estimation of Recharge and Flow in Dolomitic Aquifers; KV 177/07; Water Research Commission: Pretoria, South Africa, 2007. [Google Scholar]
- Winde, F. Challenges for sustainable water use in dolomitic mining regions of South Africa – a case study of uranium pollution, Part I: Sources and pathways. Phys. Geogr. 2006, 27, 335–346. [Google Scholar] [CrossRef]
- Bredenkamp, D.B. The use of natural isotopes and groundwater quality for improved recharge and flow estimates in dolomitic aquifers. Water Sa 2007, 33, 87–94. [Google Scholar] [CrossRef][Green Version]
- Abiye, T.A. Provenance of groundwater in the crystalline aquifer of Johannesburg area, South Africa. Int. J. Phys. Sci. 2011, 6, 98–111. [Google Scholar]
- Abiye, T.A.; Tshipala, D.; Leketa, K.; Villholth, K.G.; Ebrahim, K.G.; Magombeyi, M. Hydrogeological characterization of the crystalline aquifer in the Hout River Catchment, Limpopo province, South Africa. J. Groundw. Sustain. Dev. 2020, 11, 100406. [Google Scholar] [CrossRef]
- Jonker, B.; Abiye, T.A. Groundwater potential in the Kalahari region of South Africa. S. Afr. J. Geol. 2017, 120, 385–402. [Google Scholar] [CrossRef]
- Leketa, K.; Abiye, T.A. Investigating stable isotope effects and moisture trajectories for rainfall events in Johannesburg, South Africa. Water Sa 2020, 46, 429–437. [Google Scholar] [CrossRef]
- Leketa, K.; Abiye, T.A.; Butler, M. Characterisation of groundwater recharge conditions and flow mechanisms in bedrock aquifers of the Johannesburg area, South Africa. Environ. Earth Sci. 2018, 77, 726–737. [Google Scholar] [CrossRef]
- Harris, C.; Burgers, C.; Miller, J.; Rawoot, F. O and H isotope record of Cape Town rainfall from 1996, to 2008, and its application to recharge studies of Table Mountain groundwater, South African. S. Afr. J. Geol. 2010, 113, 33–56. [Google Scholar] [CrossRef]
- Leketa, K.; Abiye, T.A. Modelling the impacts of climatic variables on the hydrology of the Upper Crocodile River Basin, Johannesburg, South Africa. Environ. Earth Sci. 2019, 78, 358. [Google Scholar] [CrossRef]
- Butler, M.; Verhagen, B.T. Towards a management model for the exploitation of groundwater from the Taaibosch Karoo Graben, Limpopo province. In The Use of Isotope Hydrology to Characterize and Assess Water Resources in South(ern) Africa; Abiye, Ed.; WRC: Pretoria, South Africa, 2013; pp. 53–82. 210p. [Google Scholar]
- Talma, A.S.; van Wyk, E. Rainfall and Groundwater Isotope Atlas. In The Use of Isotope Hydrology to Characterize and Assess water Resources in South(ern) Africa; Abiye, Ed.; WRC: Pretoria, South Africa, 2013; pp. 83–101. 210p. [Google Scholar]
- Miller, J.; Swana, K.; Talma, S.; Vengosh, A.; Tredoux, G.; Murray, R.; Butler, M. O, H, CDIC, Sr, B and 14C isotope fingerprinting of deep groundwaters in the Karoo Basin, South Africa as a precursor to shale gas exploration. Procedia Earth Planet. Sci. 2015, 13, 211–214. [Google Scholar] [CrossRef][Green Version]
- De Varies, J.J. Holocene depletion and active recharge of the Kalahari groundwaters- A review and an indicative model. J. Hydrol. 1984, 1–4, 221–232. [Google Scholar] [CrossRef]
- Talma, A.S.; Verhagen, B.T.; Tredoux, G. Kalahari groundwater isotope synthesis. In The Use of Isotope Hydrology to Characterize and Assess Water Resources in South(ern) Africa; Abiye, Ed.; WRC: Pretoria, South Africa, 2013; pp. 111–122. 210p. [Google Scholar]
Publisher’s Note: MDPI stays neutral with regard to jurisdictional claims in published maps and institutional affiliations. |
© 2021 by the authors. Licensee MDPI, Basel, Switzerland. This article is an open access article distributed under the terms and conditions of the Creative Commons Attribution (CC BY) license (https://creativecommons.org/licenses/by/4.0/).