1. Introduction
Scientific knowledge and theory pertaining to environmental flows advanced noticeably in the past few decades. This resulted in the conceptual development of various environmental flow assessment methodologies of river flows [
1,
2]. In the 1970s and 1980s, the water surface profile method [
3,
4], based on channel characteristics, and the Montana method [
5], based on streamflow characteristics, were developed. The range in variability approach was developed in the 1990s to evaluate statistical variables of streamflow regarded as important indicators of hydrologic alteration [
6]. More recently, the ecological limits of hydrologic alteration were developed to assess the flow alteration and ecological response between anthropogenic alterations and social, economic, and ecological preferences [
1,
7].
These existing environmental flow assessment methods were developed at the regional scale to balance ecosystem management with societal objectives for river management, which have the potential to negatively affect a river ecosystem by influencing the natural variations in flow [
1,
7,
8]. These methods demonstrate that the degree of hydrologic change affects existing hydro-ecological relationships with the greatest effects on river ecosystems being associated with severe hydrologic alteration [
6].
Theoretical and conceptual knowledge related to the impact of longwall mine subsidence of streams [
9,
10,
11] and groundwater [
12,
13,
14] existed since the early 1980s. Hydrogeologic studies were completed concomitantly to engineering studies examining mine subsidence theory of overburden movement and deformation [
15,
16,
17] as it relates to local stress-relief fracture systems [
18,
19,
20]. Existing environmental flow assessment methods do not, however, provide a proper tool to assess natural flows in headwater streams or evaluate flow in streams which underwent restoration to correct post-mine streamflow disruption.
CONSOL Pennsylvania Coal Company, LLC (CPCC) used intervention measures, such as streamflow augmentation and streambed grouting, to restore post-mine streamflow disruptions since 2006. The effects of longwall mine subsidence on streams in Pennsylvania are regulated under the Pennsylvania Clean Streams Law, the Mine Subsidence Act, and environmental regulations adopted pursuant to these and other laws, including Chapters 86, 87, 89, 93, and 105 of Title 25 of the Pennsylvania Code. The Pennsylvania Department of Environmental Protection (PADEP) also uses its October 2005 Technical Guidance Document No. 563-2000-655, entitled “Surface Water Protection Underground Bituminous Coal Mining Operations” (referred to herein as the Streams TGD) to interpret the various regulatory requirements applicable to longwall mining [
21].
The Streams TGD provides guidance on subsidence-induced flow loss that may occur as the result of physical changes to the streambed, such as bedrock heaves and fractures, and subsidence-induced inverts that may create pooling in low-gradient streams and associated floodplain wetlands. The Streams TGD specifies hydrologic and biological monitoring frequency and reporting requirements and methods to compare pre-mine and post-mine biological indices to determine if restoration achieved established biological recovery end points. However, the Streams TGD does not prescribe methods to compare pre-mine and post-mine hydrologic conditions or contain specific hydrologic recovery end points. Throughout this paper, the term post-mine is used to reference both post-mine and post-restoration conditions.
Empirical data specific to the Streams TGD substantially improved CPCC’s understanding of the implications of longwall mine subsidence on local surface water flow regimes. In compliance with the Streams TGD, CPCC collected and analyzed hydrologic monitoring data to develop a hydrologic environmental flow method associated with streams undermined by longwall mining at its Bailey Mine located in Greene County, Pennsylvania, United States of America (USA).
2. Materials and Methods
2.1. Site Description and Hydrogeologic Setting
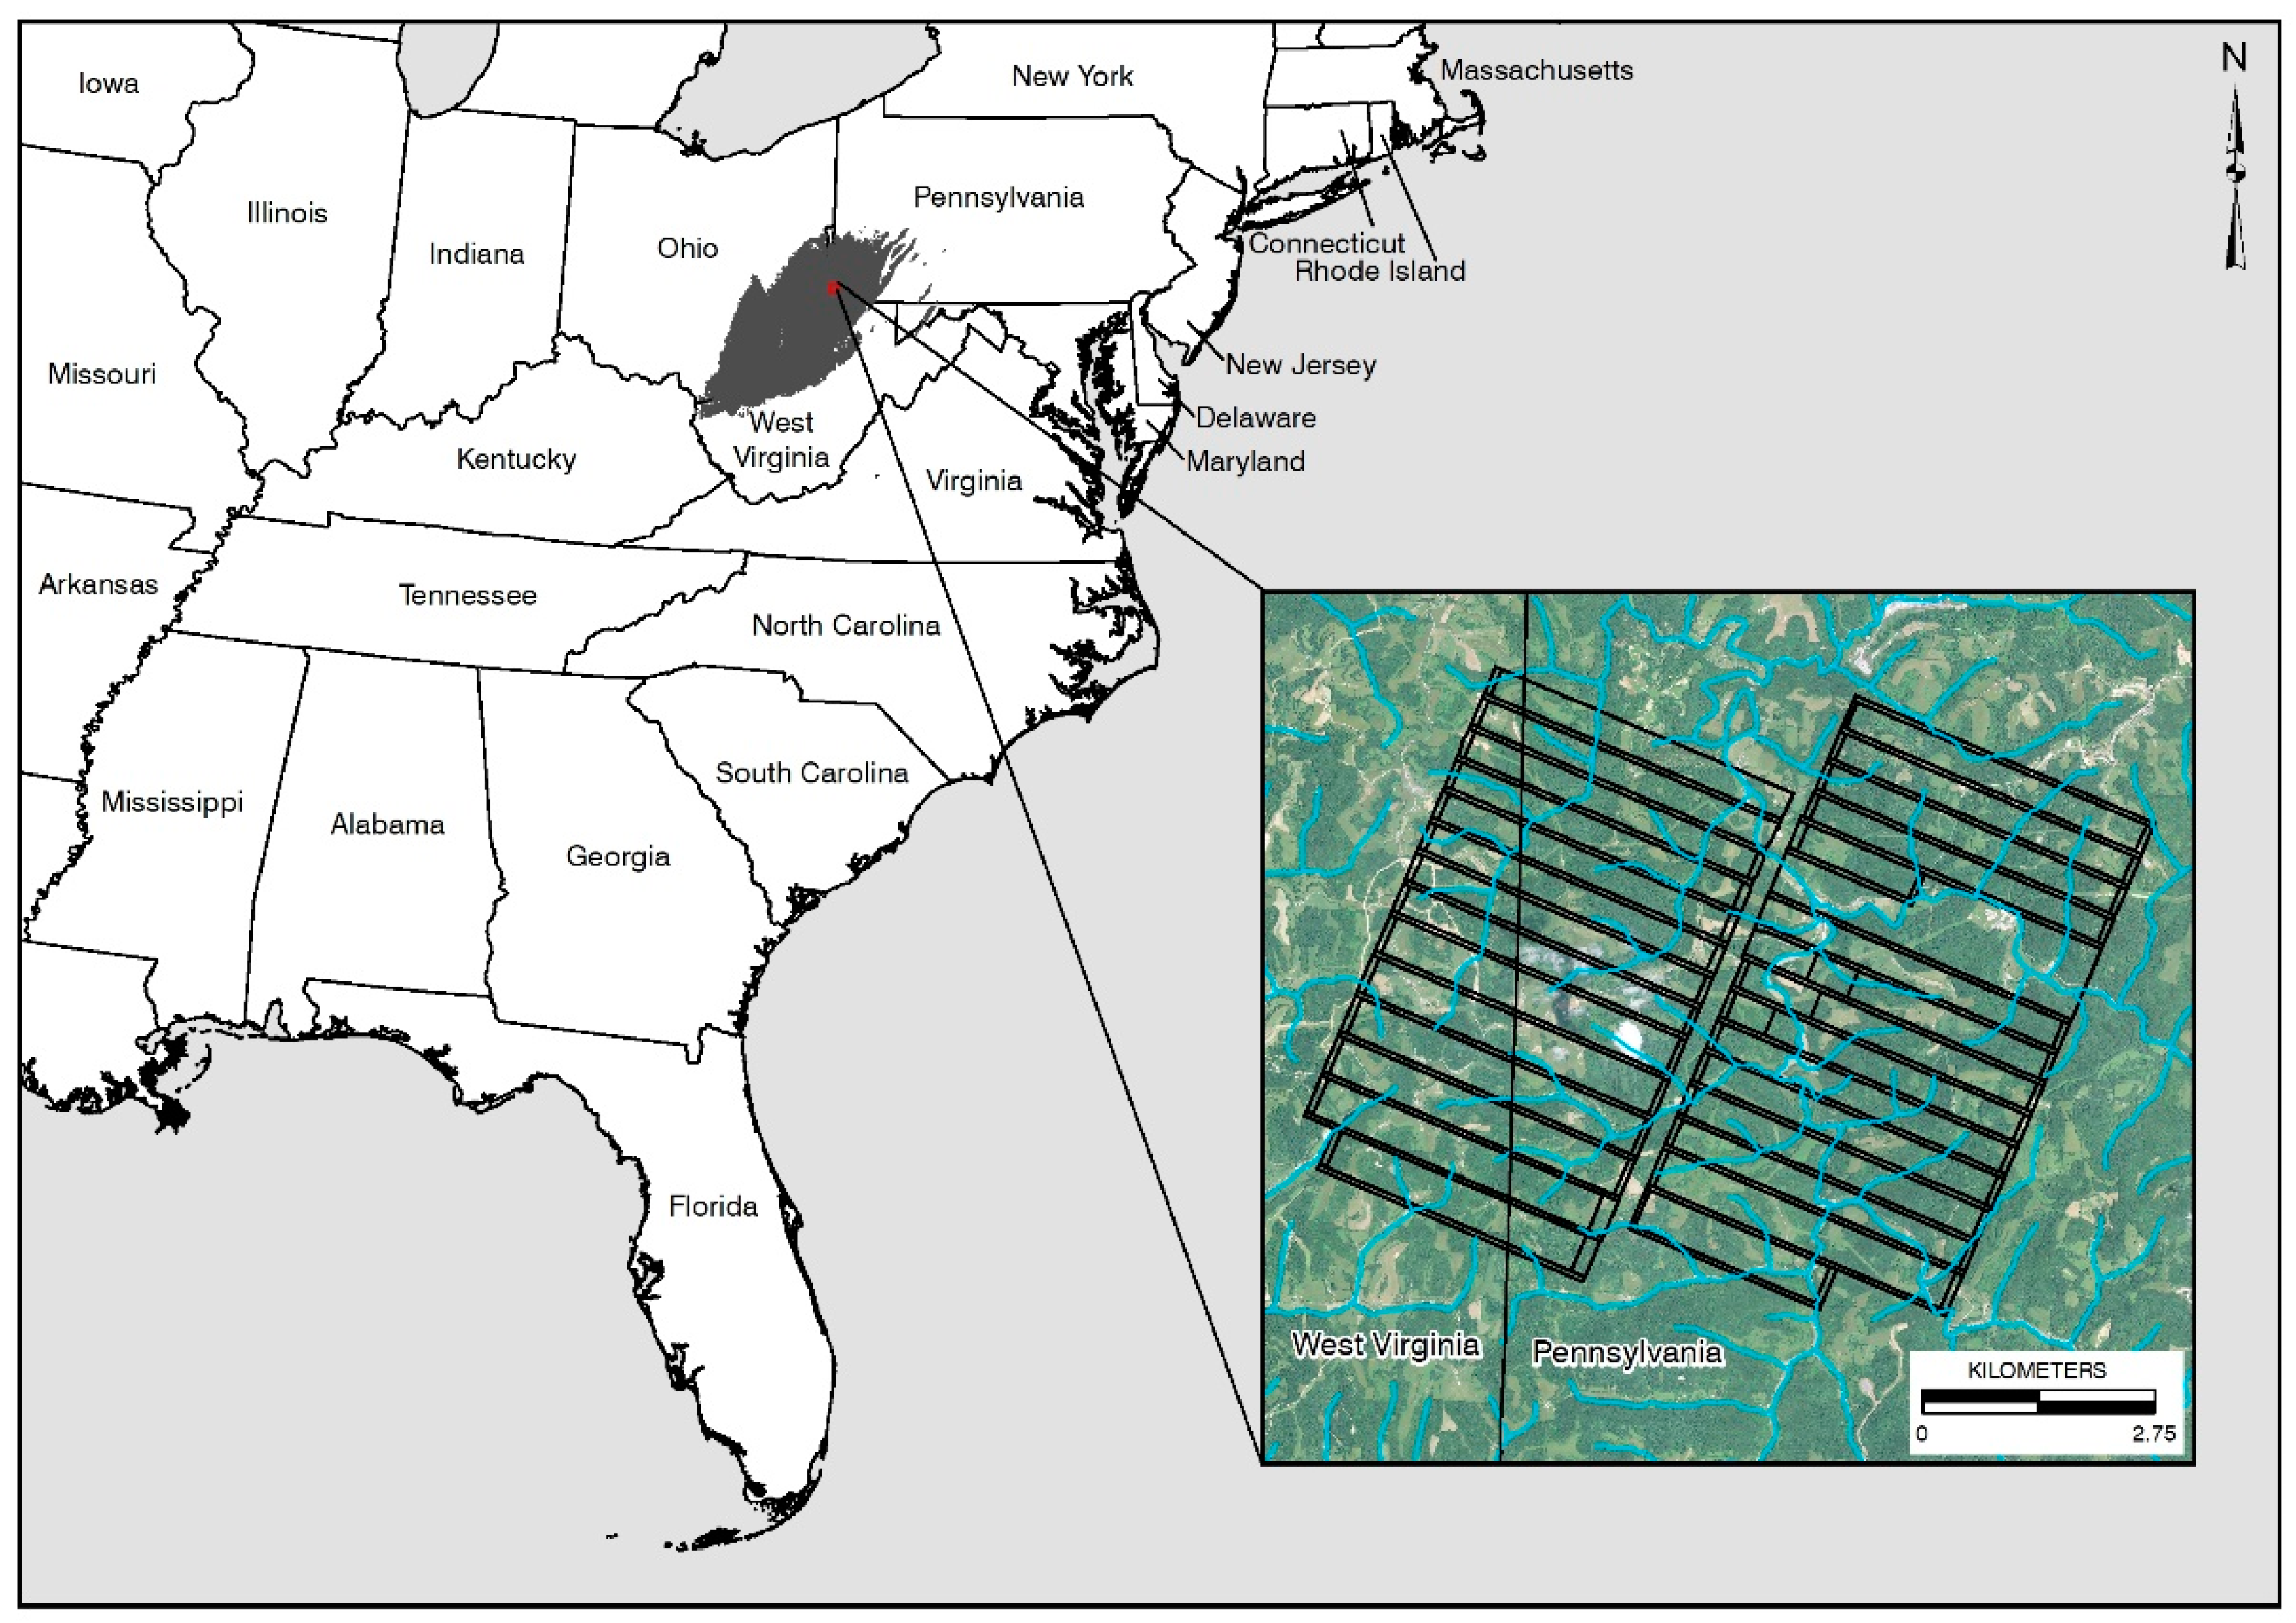
The Bailey Mine is a longwall mine operation producing thermal and high-vol metallurgical coal from the Pittsburgh coal seam (
Figure 1). Annual production at the Bailey Mine averaged 11.16 million metric tons per year during the past three years (2016 to 2018). Extraction of coal beneath streams within the study area began fourth quarter, 2004 and ended first quarter, 2012.
A longwall mine operation is a highly productive and mechanized underground full extraction technique designed to induce controlled subsidence. The operation consists of a shearer with two rotating cutting drums and a series of self-advancing hydraulic roof supports that protect the working face. As a longwall panel is retreated, the overburden above the extracted coal seam progressively subsides, resulting in dynamic movement of the overburden and ground surface. The dimensions of the longwall panels within the study area are 2 m high (approximate extraction height), 4570 m long and 335 to 457 m wide, and are oriented south (S) 67° east (E).
The Bailey Mine is located in the Washington Hills section of the Appalachian Plateau physiographic province. The terrain is characterized by broad ridges, deeply incised headwater streams, and flat open valley bottom areas adjacent to low-gradient (<2%) streams. Land use is predominantly forest. Surface elevations of streams in the study area range from 286.5 m to 402.3 m above mean sea level.
Near-surface geology within the study area consists primarily of cyclothemic deposits of sandstones, siltstones, shales, limestones, clays, and coal beds of the Dunkard Group of late Pennsylvanian to early Permian Age. The exposed strata traverse the Waynesburg Sandstone unit of the Lower Waynesburg Formation to the Upper Rush Run Sandstone unit of the Tenmile Member, Greene Formation. Overburden thickness between the Pittsburgh seam and the streambeds within the study area ranges from 94.5 m to 256.0 m.
Annual rainfall recorded by the National Weather Service in Waynesburg, PA (WYNP1/NWS; mean (M) = 110.9 cm, SD = 19.8 cm) varied across the study period (2004–2017) from a low of 88.0 cm (2014) to a high of 158.1 cm (2011). The 30-year (1986–2015) average annual rainfall was 103.8 cm.
2.2. Streambed Restoration Techniques
The fundamental goal of stream restoration in the Commonwealth of Pennsylvania is to minimize any adverse effects that may be induced by mine subsidence and to ensure that coal mine activity permits are designed to protect and maintain the existing and designated uses of perennial and intermittent streams.
Mine subsidence can induce streambed ruptures, such as bedrock heaves and fractures, which pirate surface water from the streambed. Streamflow augmentation is used as a proactive flow management technique to bridge the time between the first observed incident of mine subsidence-induced flow loss and streamflow loss restoration. Streamflow augmentation involves the delivery and discharge of fresh water to the stream to restore and maintain streamflow, thereby supporting the existing biological communities. During the streamflow augmentation period, CPCC performs a pre-mitigation survey to identify the location(s) and extent of flow loss restoration that is necessary.
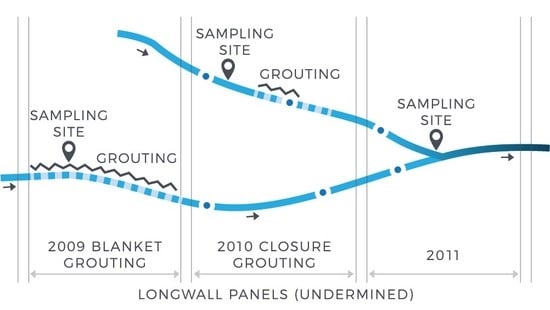
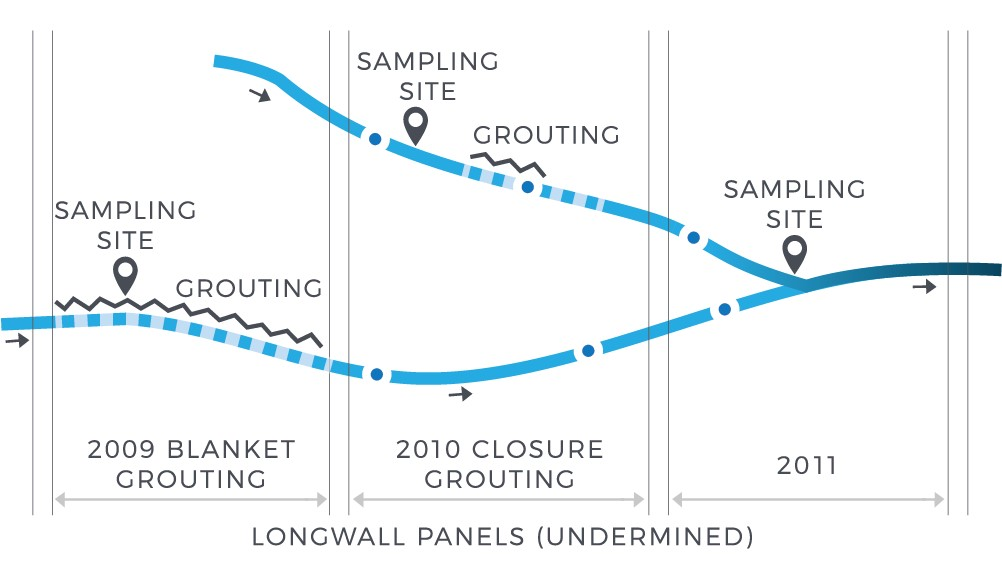
Flow loss restoration seeks to seal surface and/or near-surface bedrock fractures that may be the cause of flow loss. Bedrock permeation grouting is a streambed restoration procedure that injects a grout into the rock to reduce or eliminate the loss of surface water. CPCC initially used a blanket grouting procedure where boreholes were drilled in a single pass along the entire length of stream. A stable, cement-based grout was injected into the boreholes to fill fractures or voids. Communication of grout to the streambed surface through adjacent injection boreholes was commonly observed, and full closure of fractures could not be confirmed.
CPCC revised its original technique in 2010 and since then used a performance-based closure-style grouting procedure. This technique involves drilling a primary set of boreholes, at approximately 3-m centers, to a depth of 1.8 m, which is the practical limit of manually operated equipment. A cement-, bentonite-, and water-based grout is injected into each borehole using a high-shear, high-speed colloidal mixer until the desired pressure is achieved. An inflatable packer, charged with compressed air, promotes confinement and prevents the return of grout to the surface. A custom manifold directs grout to a single or suite of injection boreholes for simultaneous injection, and recirculates unused grout back to the mixer to reduce waste. Grout density, viscosity, and compression strength are evaluated using standard testing methods, and field jar samples are collected and tested to ensure <2% shrinkage after curing. Drilling and injection of additional sets of boreholes at incrementally closer spacing is completed as necessary to achieve full closure.
This revised technique confirms closure (or determines the capacity of the streambed to convey water) by monitoring injection pressures and grout volumes and collecting streamflow measurements following each series (primary, secondary, etc.) of grouting. The current approach also minimizes disturbance of the streambed by targeting only reaches exhibiting ground deformation or streamflow reduction identified during the pre-mitigation stream survey. To date, CPCC grouted approximately 14.97 km of streambed in the study area.
2.3. Hydrologic Monitoring
CPCC analyzed two stream characteristics for this study: stream discharge, measured at fixed surface water monitoring locations (sample sites), and stream flow duration or intermittency, determined by observations and documentation of the longitudinal extent of flow along the stream channel.
This study involved collecting and analyzing 12,356 individual stream discharge measurements at 88 sample sites and recording flow observations along 29 streams (51.9 km) classified as warm water and trout-stocked fisheries. Stream discharge was measured using the United States Geological Survey (USGS) midsection current meter method [
22]. Timed volumetric measurement was also used if water depths were too shallow to obtain accurate readings with a velocity meter. Stream flow observations included documenting the extent of flowing and non-flowing reaches (flow loss), flow origination points, ruptures and fractures of bedrock or bedload, pooling, discoloration caused by mineral leaching, and other observable conditions.
Monthly data and streambed observations, as recommended in the Streams TGD, were collected using TerraSync software (Version 5.86, Trimble Inc., Sunnyvale, CA, USA) installed on handheld Trimble global positioning system (GPS) units. These field data were post-processed using Pathfinder Office. Custom Microsoft Excel scripts expedited quality control prior to the data being uploaded to a propriety Microsoft Access database. Streambed observations, such as flow loss, were downloaded into ArcGIS to be measured and evaluated for trends.
Monthly sampling frequency, which is specified by the Streams TGD, does not enable the use of analysis techniques that require continuously monitored data, such as predicting low flow duration or peak flow magnitude. These approaches are valid for extreme event analysis and rooted in applications associated with drought and flood risk. For an analysis of change in hydrologic response, the use of base flow data provides a more balanced and representative distribution, which is more suitable to the objectives of this study.
The sensitivity of detecting potential mine-subsidence effects is improved by removing the confounding effect of extreme weather events. To identify and remove the effect of these events, a Microsoft Excel script identified data collected within 48 h of an event that recorded a rainfall of 1.1 cm (daily mean storm event across the 30-year precipitation record) or greater. The parameters used to identify data influenced by extreme weather event flows were selected a priori to strike a balance between excluding event-generated variance and preserving sufficient data to ensure an adequate sample size. The script also identified and removed data collected during periods of USGS-declared droughts.
The duration of pre-mine monitoring (M = 3.2 years, SD = 1.1 years) was nearly equivalent to the duration of post-mine monitoring (M = 3.4 years, SD = 1.2 years). The comparison of pre-mine to post-mine data over several years reduced the influence of annual precipitation differences. The rolling three-year average precipitation (M = 111.3 cm, SD = 10.7 cm) was less variable than the annual average precipitation (M = 110.9 cm, SD = 19.8 cm), which supported a more consistent comparison by controlling the influence of precipitation differences between the two periods.
2.4. Statistical Analysis
The distribution of the pre-mine and post-mine stream discharge data for each sample site was positively skewed and heavily tailed. A Shapiro–Wilk goodness-of-fit test using ProUCL 5.1 concluded that data for a majority of the sample sites (86 of 88) were non-normally distributed. Non-normal distributions can affect sample statistics, which are calculated to infer characteristics associated with measures of central tendency, spread, and symmetry [
23].
Nonparametric statistics or the use of data transformation and parametric analysis of the transform of the data are typically used to analyze non-normally distributed data. The principal advantage of nonparametric statistics is that they are invariant to measurement scale and can be used to test population parameters when the assumption of normality cannot be met [
23]. Because nonparametric tests can be less sensitive, a larger difference is needed before the null hypothesis can be rejected. When the assumptions of parametric methods are met, the nonparametric counterpart needs a larger sample size to overcome the loss of information to obtain the same result; therefore, the nonparametric test can also be less efficient [
24].
Parametric tests require symmetry, linearity, and homoscedasticity to interpret data effectively. The log transformation is a traditional approach to handle positively skewed data and can produce these characteristics [
23]. When data transformation successfully produces a normal or nearly normal distribution, the parametric test is a better estimator of the difference between the two groups of data. Parametric procedures can also enable regression analysis, which is nearly impossible to complete using nonparametric methods [
23].
To determine if any difference existed between the distribution of pre-mine and post-mine stream discharge data, parametric and nonparametric statistical hypothesis testing were performed. Statistical significance was determined by comparing the attained p-value to an a priori criterion of 0.05 and fit to a two-tailed test. To determine if long-term systematic trends existed, analysis was performed on a comparison of the entire pre-mine and post-mine periods; therefore, a seasonality analysis was not performed.
The parametric two-sample t-test and z-test were used to examine differences of base-10 log transformation of the discharge data (log base flow) between the 88 pre-mine and post-mine discharge sample sites. Because the log of zero is undefined, pre-mine and post-mine zero streamflow events were assigned a value of 0.38 L/min (0.1 gallon/min). The z-test was used on the log base flow data collected at 80 of the 88 sample sites, as these datasets met the sample size assumption. The two-sample t-test was used for the remaining eight sample sites. The appropriate t-test formula was determined by the results of the F-test, as there are two options for the t-test discriminated by equal or unequal variances.
An equivalent nonparametric test for independent samples was used to determine any similar differences. The Wilcoxon rank sum test is a robust technique that is used to determine statistical significance of the difference in magnitude between the ranks of the pre-mine and post-mine stream discharge data.
While statistical significance relates to whether an effect exists, practical significance refers to the magnitude of the effect and its potential for field-based application. To determine the practical significance of identified relationships, three methods were used to test the strength of these relationships: linear regression, probabilistic risk assessment, and correlation analysis of change.
2.4.1. Linear Regression
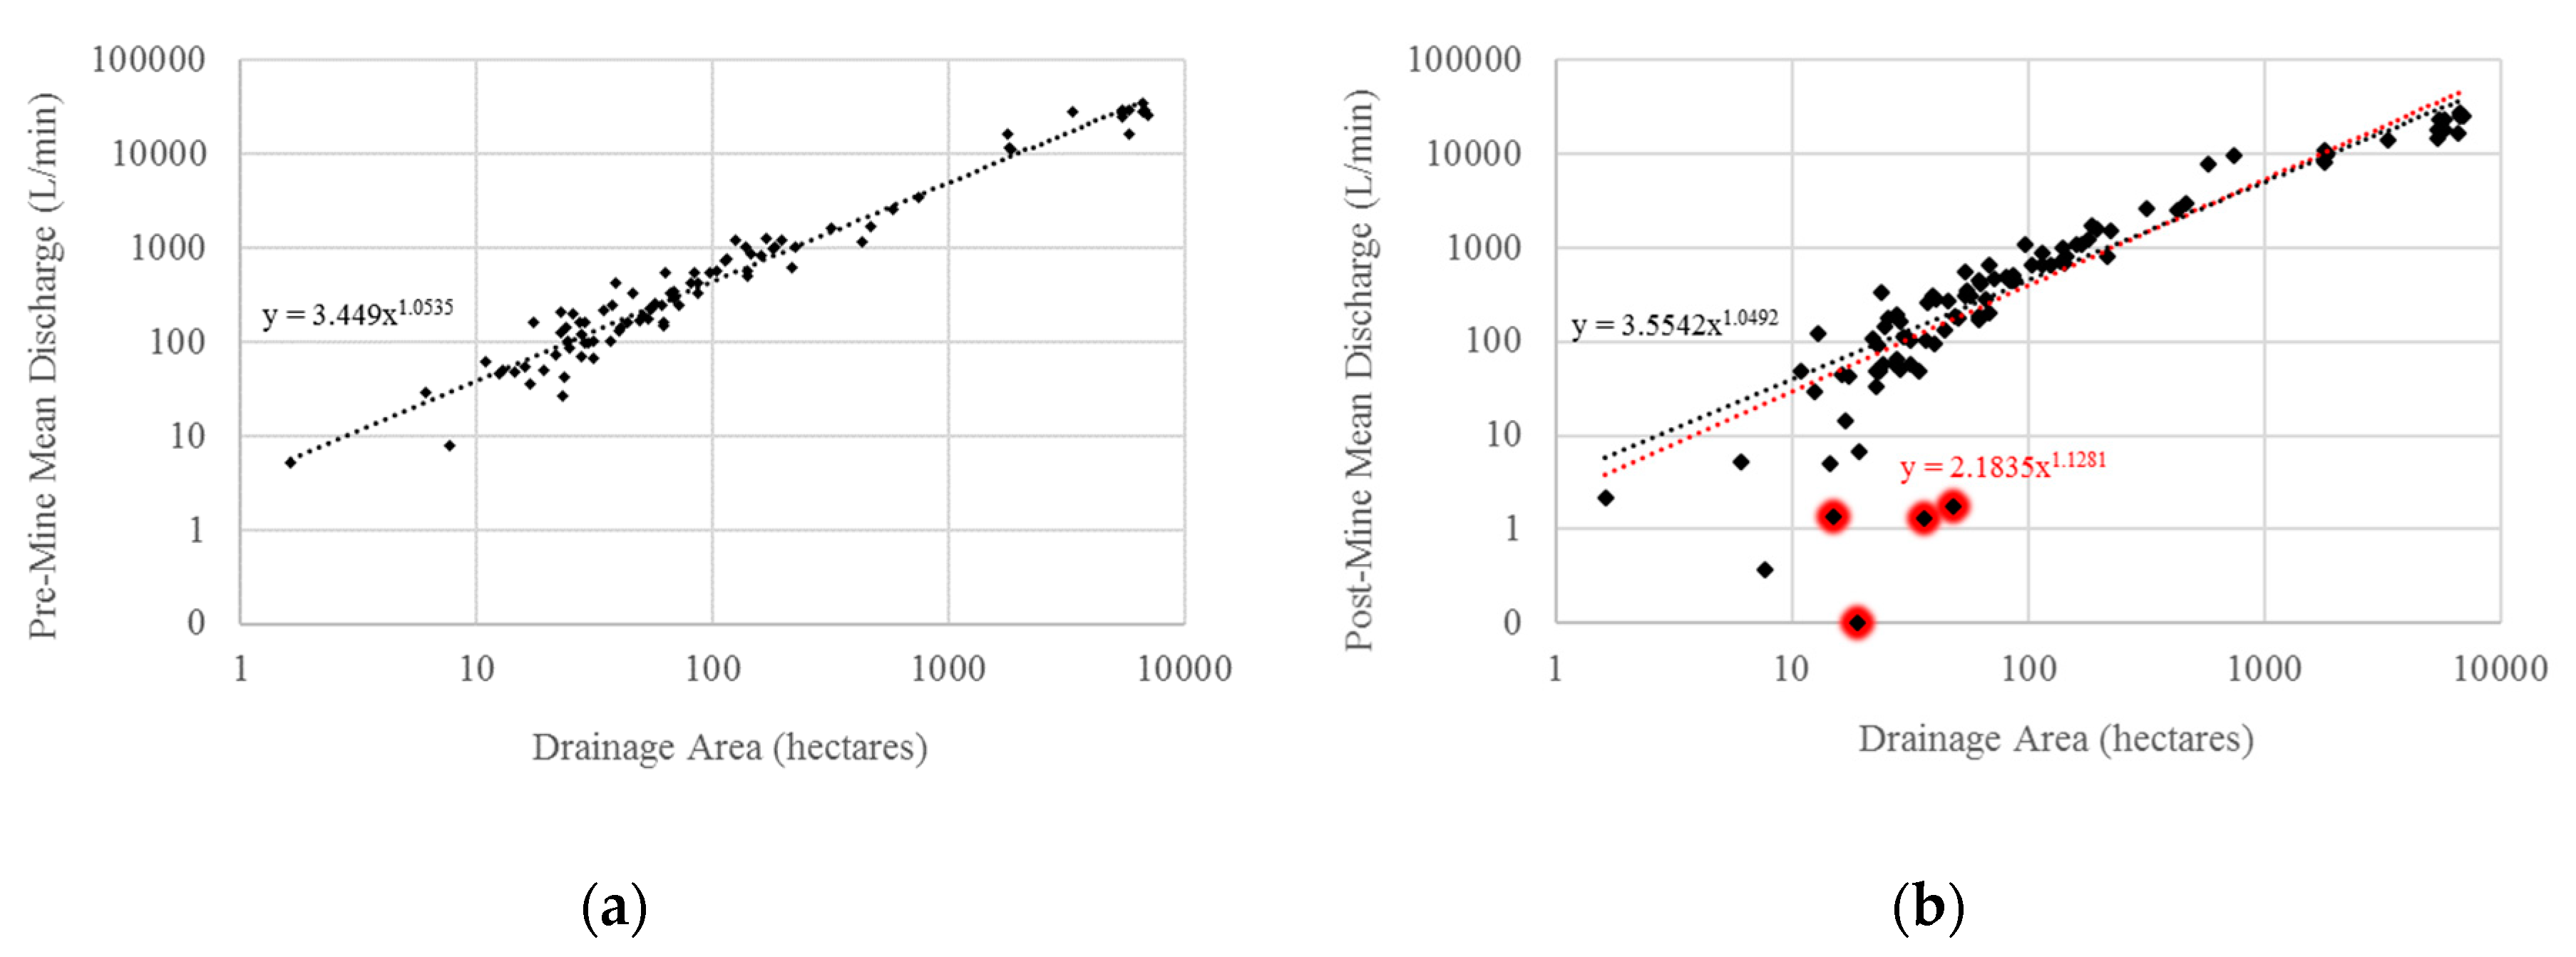
To compare the cumulative pre-mine and post-mine stream discharge datasets, a simple linear regression of stream discharge and drainage area was completed for pre-mine and post-mine discharge data. The empirical relationship between stream discharge and drainage area was expressed as a power function in the form Q =
bA
c, where
b is a proportionality constant and
c is an exponent that scales discharge to drainage area [
25]. A Pearson’s
r correlation using the Fisher
z transformation solution was used to determine the degree of association between average stream discharge and drainage area. These two linear regression lines were compared to determine mining impacts.
2.4.2. Probabilistic Risk Assessment
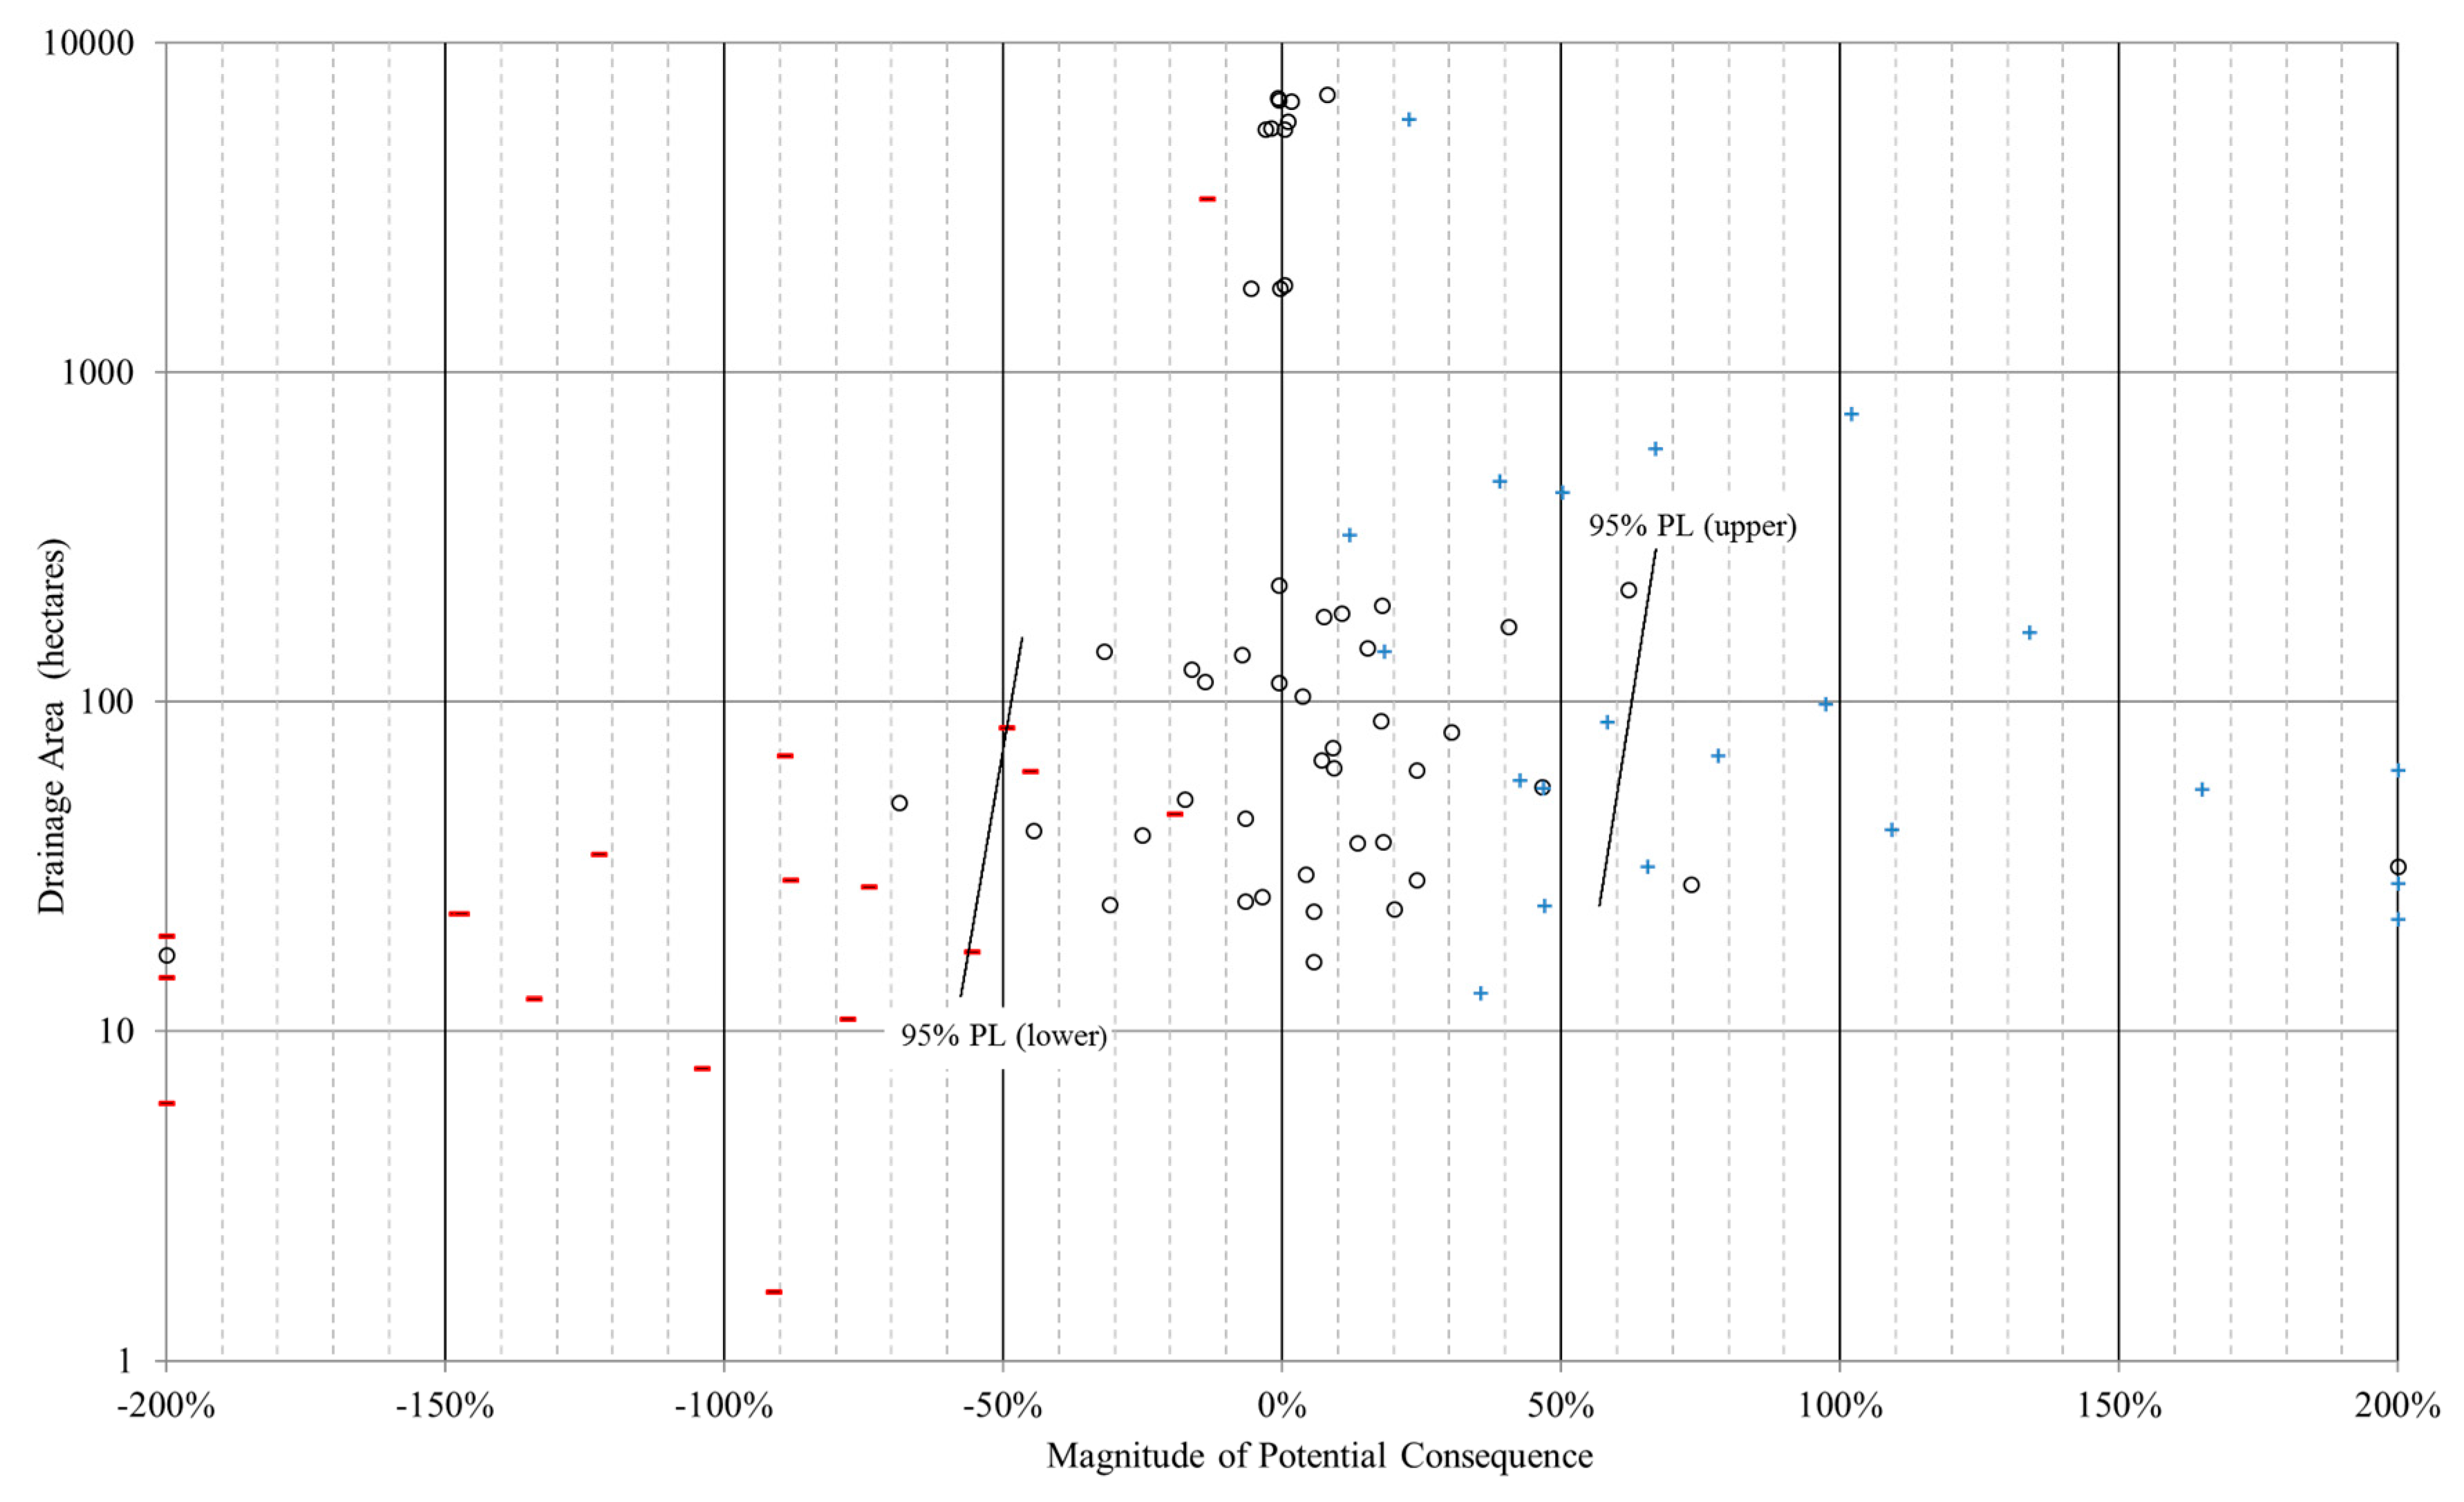
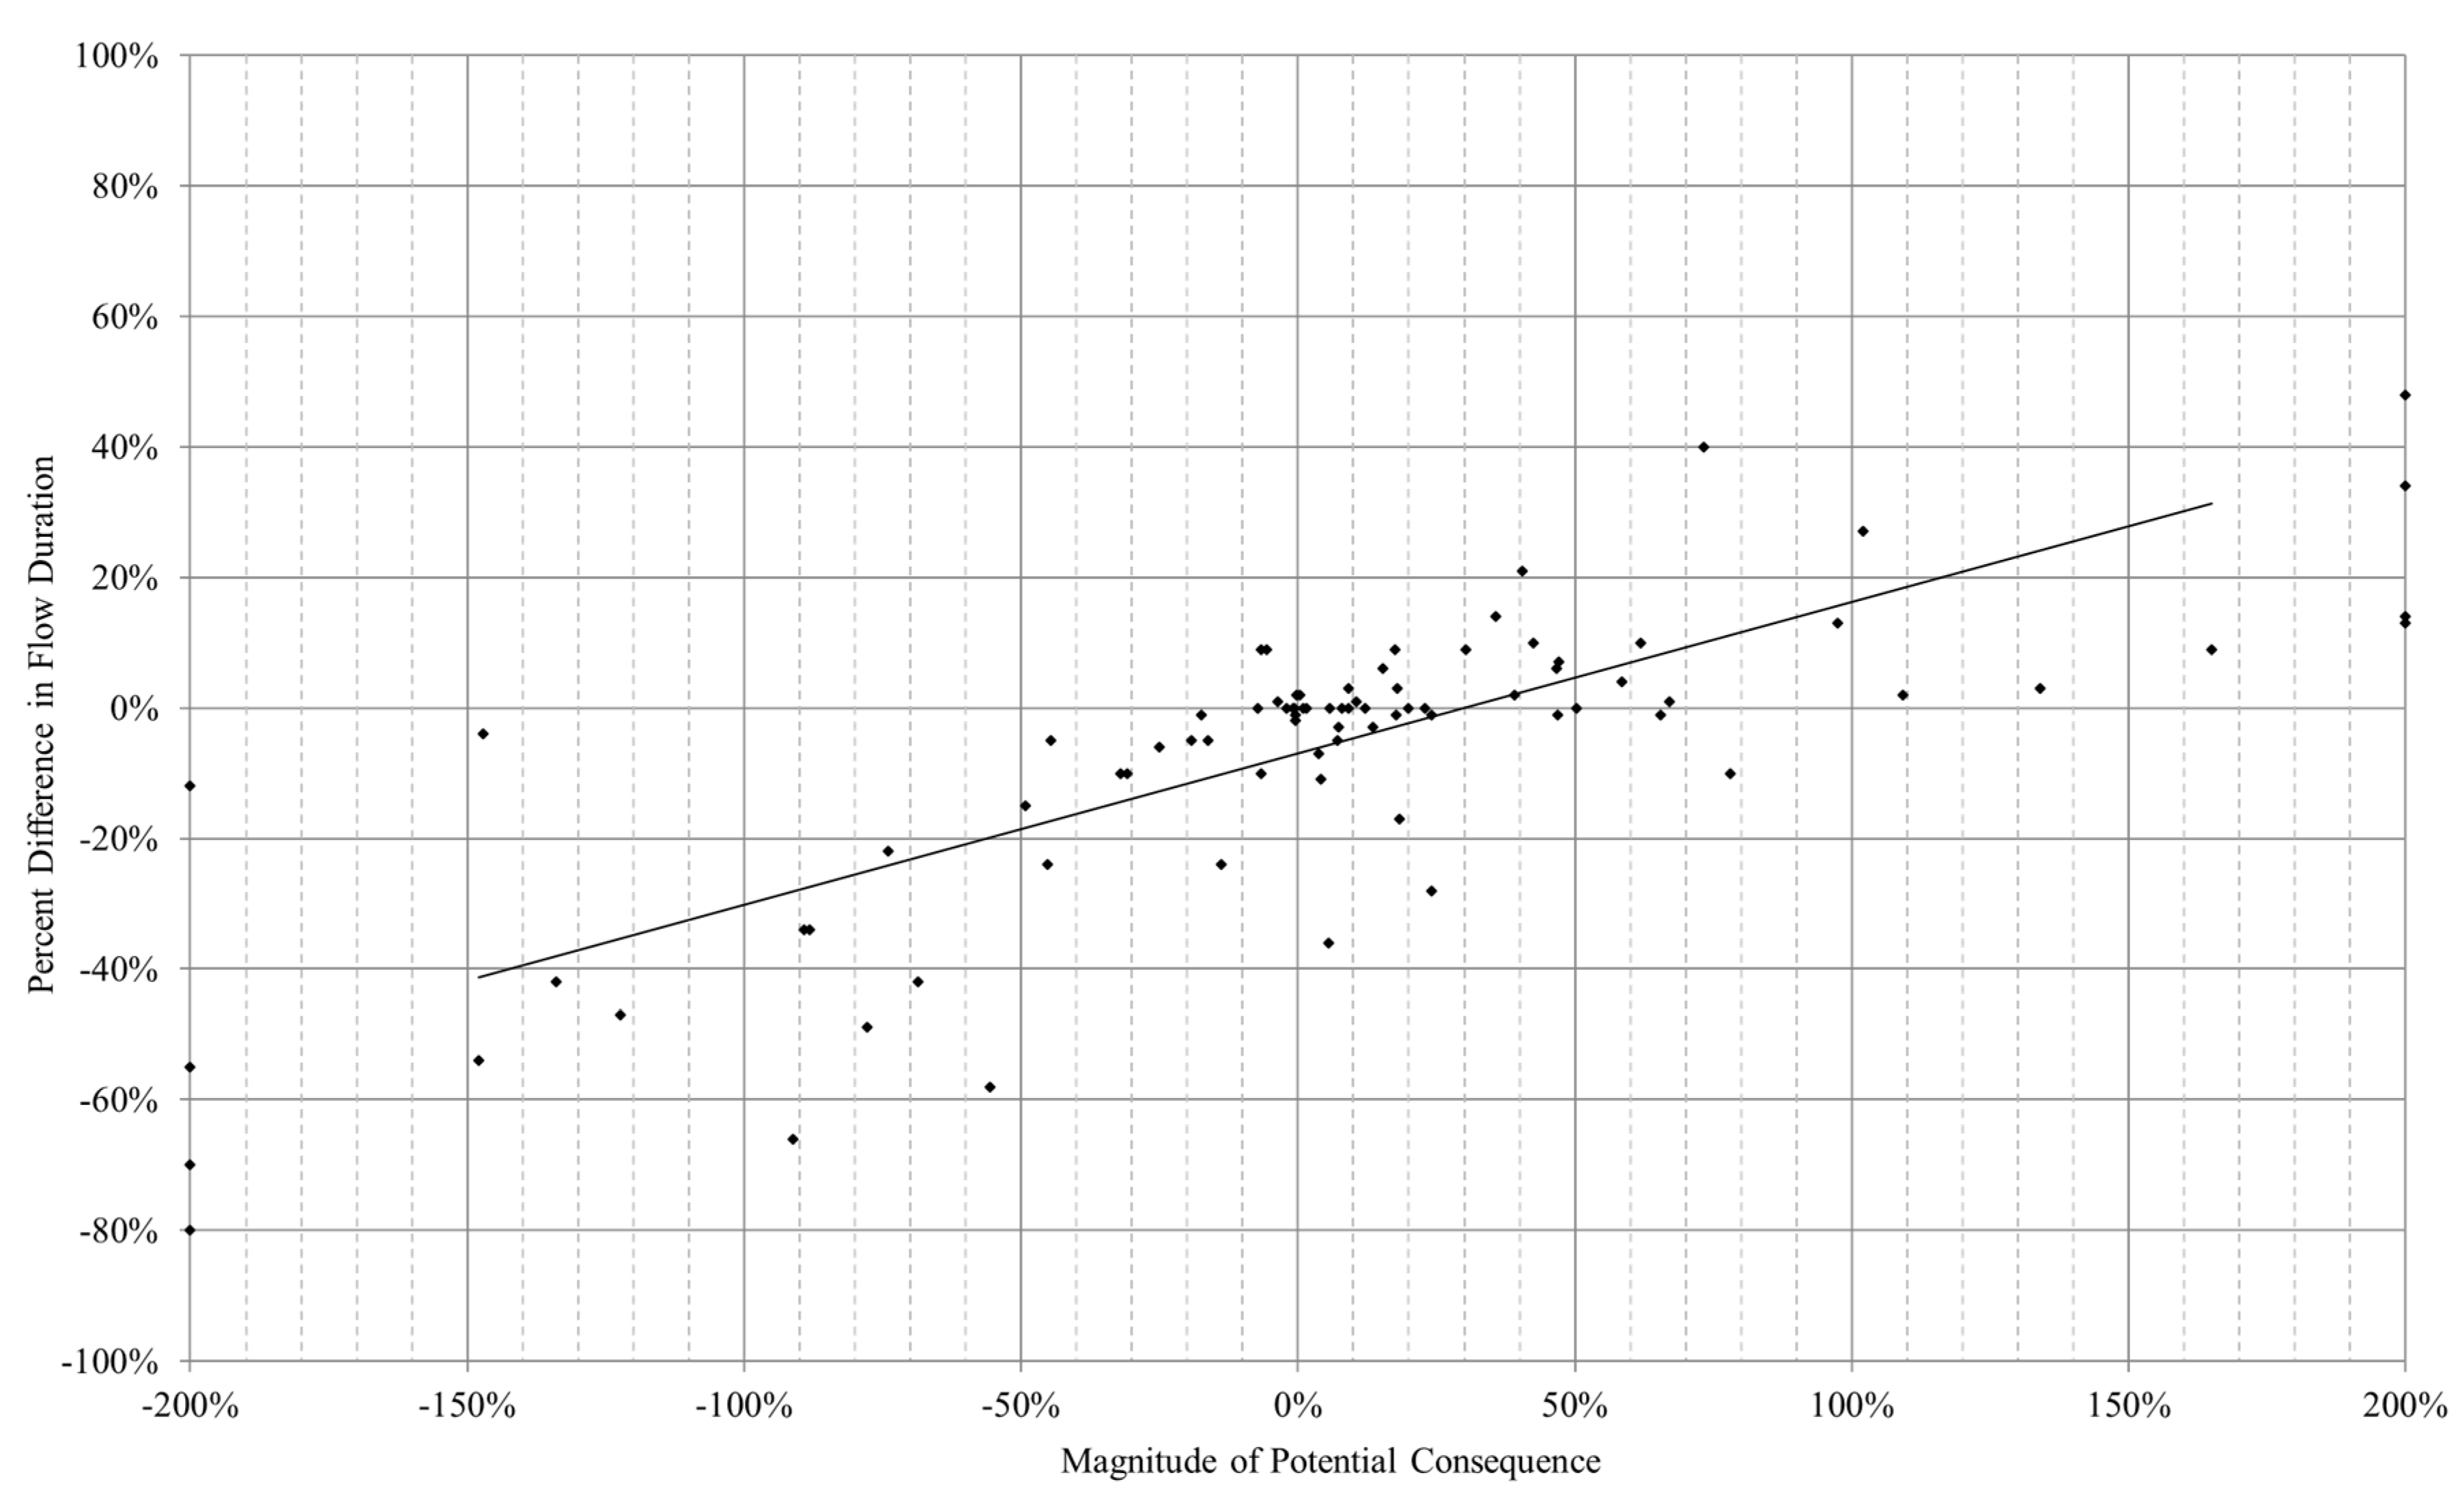
To predict the likelihood that changes in stream discharge are likely or unlikely to occur, probabilistic risk assessment (PRA), involving the use of likelihood and a measure of the magnitude of potential consequences should changes occur, was completed. The likelihood metric (level of probability) was derived from the nonparametric hypothesis test results, specifically differentiating the results into statistically significant or non-significant events. The magnitude of potential consequence (MPC) was calculated as ((post-mine log average Q − pre-mine log average Q)/pre-mine log average Q) × 100.
2.4.3. Correlation Analysis of Change
To estimate the threshold criteria of stream flow extent and duration associated with likely hydrologic alteration, a correlation analysis of stream discharge and stream flow observation data was completed. Hydrologic data associated with intermittent flow conditions were used to investigate changes to the extent (spatial variation) and duration (temporal variation) of flow to determine the direction and magnitude of change between the pre-mine and post-mine periods.
Change in intermittent flow condition is directional; a regressive change indicates an increase to the extent and duration of a stream’s intermittency that is trending toward a drier streambed condition, whereas a progressive change indicates a decrease to the extent and duration of a stream’s intermittency trending toward a continuous flowing condition. It is reasonable to expect a regressive change in intermittent flow condition where stream discharge decreases and a progressive change where stream discharge increases. It is also logical to state this relationship in terms of magnitude, where the degree of difference in intermittent flow condition is dependent on changes in stream discharge.
2.4.4. Environmental Flow Assessment
Hydrologic-based environmental flow assessment methodologies are the most frequently used methodologies used to make environmental flow recommendations [
8]. The Montana method, or a derivation of the original, is routinely used in 16 US states or Canadian provinces in North America and is now the most commonly applied hydrologic environmental flow assessment methodology worldwide [
8].
Mimicking the design of the Montana method, the degree of hydrologic alteration measured at sample sites located at the mouth of the 29 streams within the study area was examined to determine whether downstream use impairment was likely. This approach aggregates all drainage features within a given watershed into a single representative sample, allowing multivariate analysis of the changes in the discharge measured at the mouth and changes in intermittency across the entire monitored length of the streams.
4. Discussion
The conceptual foundation used to facilitate environmental flow assessment is based on classifying streams according to ecologically meaningful streamflow characteristics which are intuitively amenable to other research studies [
1]. A risk-based approach can be initiated by using simple tools and readily available data, provided the hydrologic analysis generates information of sufficient certainty. As the need for prediction resolution increases, the environmental flow assessment method becomes more sophisticated and resource-intensive [
1].
Existing large-scale environmental flow assessment methodologies qualified the various degrees of hydrologic alteration based upon the quantity of hydrologic change (Montana method) and the frequency, duration, and timing of hydrologic change (range in variability approach). The hydrologic methods divide the range of possible hydrologic alteration into three classes of equal range: 0% to 33% represents little or no alteration, 34% to 67% represents moderate alteration, and 68% to 100% represents a high degree of alteration [
5,
6].
Table 1 shows that the probabilistic risk assessment methodology produced threshold criteria results that are within the range of moderate hydrologic alteration as described by these methods.
Table 1 results are also logical from a perspective of statistical variance, as these threshold criteria trend from higher values of acceptable alteration for headwater streams, which exhibit flashier flow characteristics as the baseflow is primarily derived from precipitation, to lower values of acceptable alteration for larger order streams, which display relatively more uniform flow characteristics as the source of baseflow is sustained through groundwater influence.
The hydrologic response observed at 14 of the 29 streams indicated no difference between the pre-mine and post-mine distribution of stream discharge. For the remaining 15 streams, six streams had downward trends indicating diminished post-mine discharge, and nine streams had upward trends indicating improved post-mine discharge, as shown in
Figure 5.
Generally, it is suggested that streams within watersheds smaller than 80 ha experience dewatering longer than streams with greater drainage areas [
10,
11]. For this study, it does not appear that streams with watersheds smaller than 80 ha were more susceptible to hydrologic effects of mine subsidence; the difference is posited to be caused by a lack of restoration interventions within the previously studied streams. The streams that exhibited diminished post-mine streamflow conditions in this study (
n = 6) are located within watersheds smaller than 80 ha; however, seven streams within watersheds smaller than 80 ha indicated no difference, and five streams indicated improved post-mine streamflow conditions. The streams that exhibited diminished post-mine streamflow conditions did not affect downstream hydrologic conditions, as sample sites located immediately downstream of the confluence between the studied stream and its receiving stream indicated no difference between the pre-mine and post-mine distribution of discharge in all cases for which data were available.
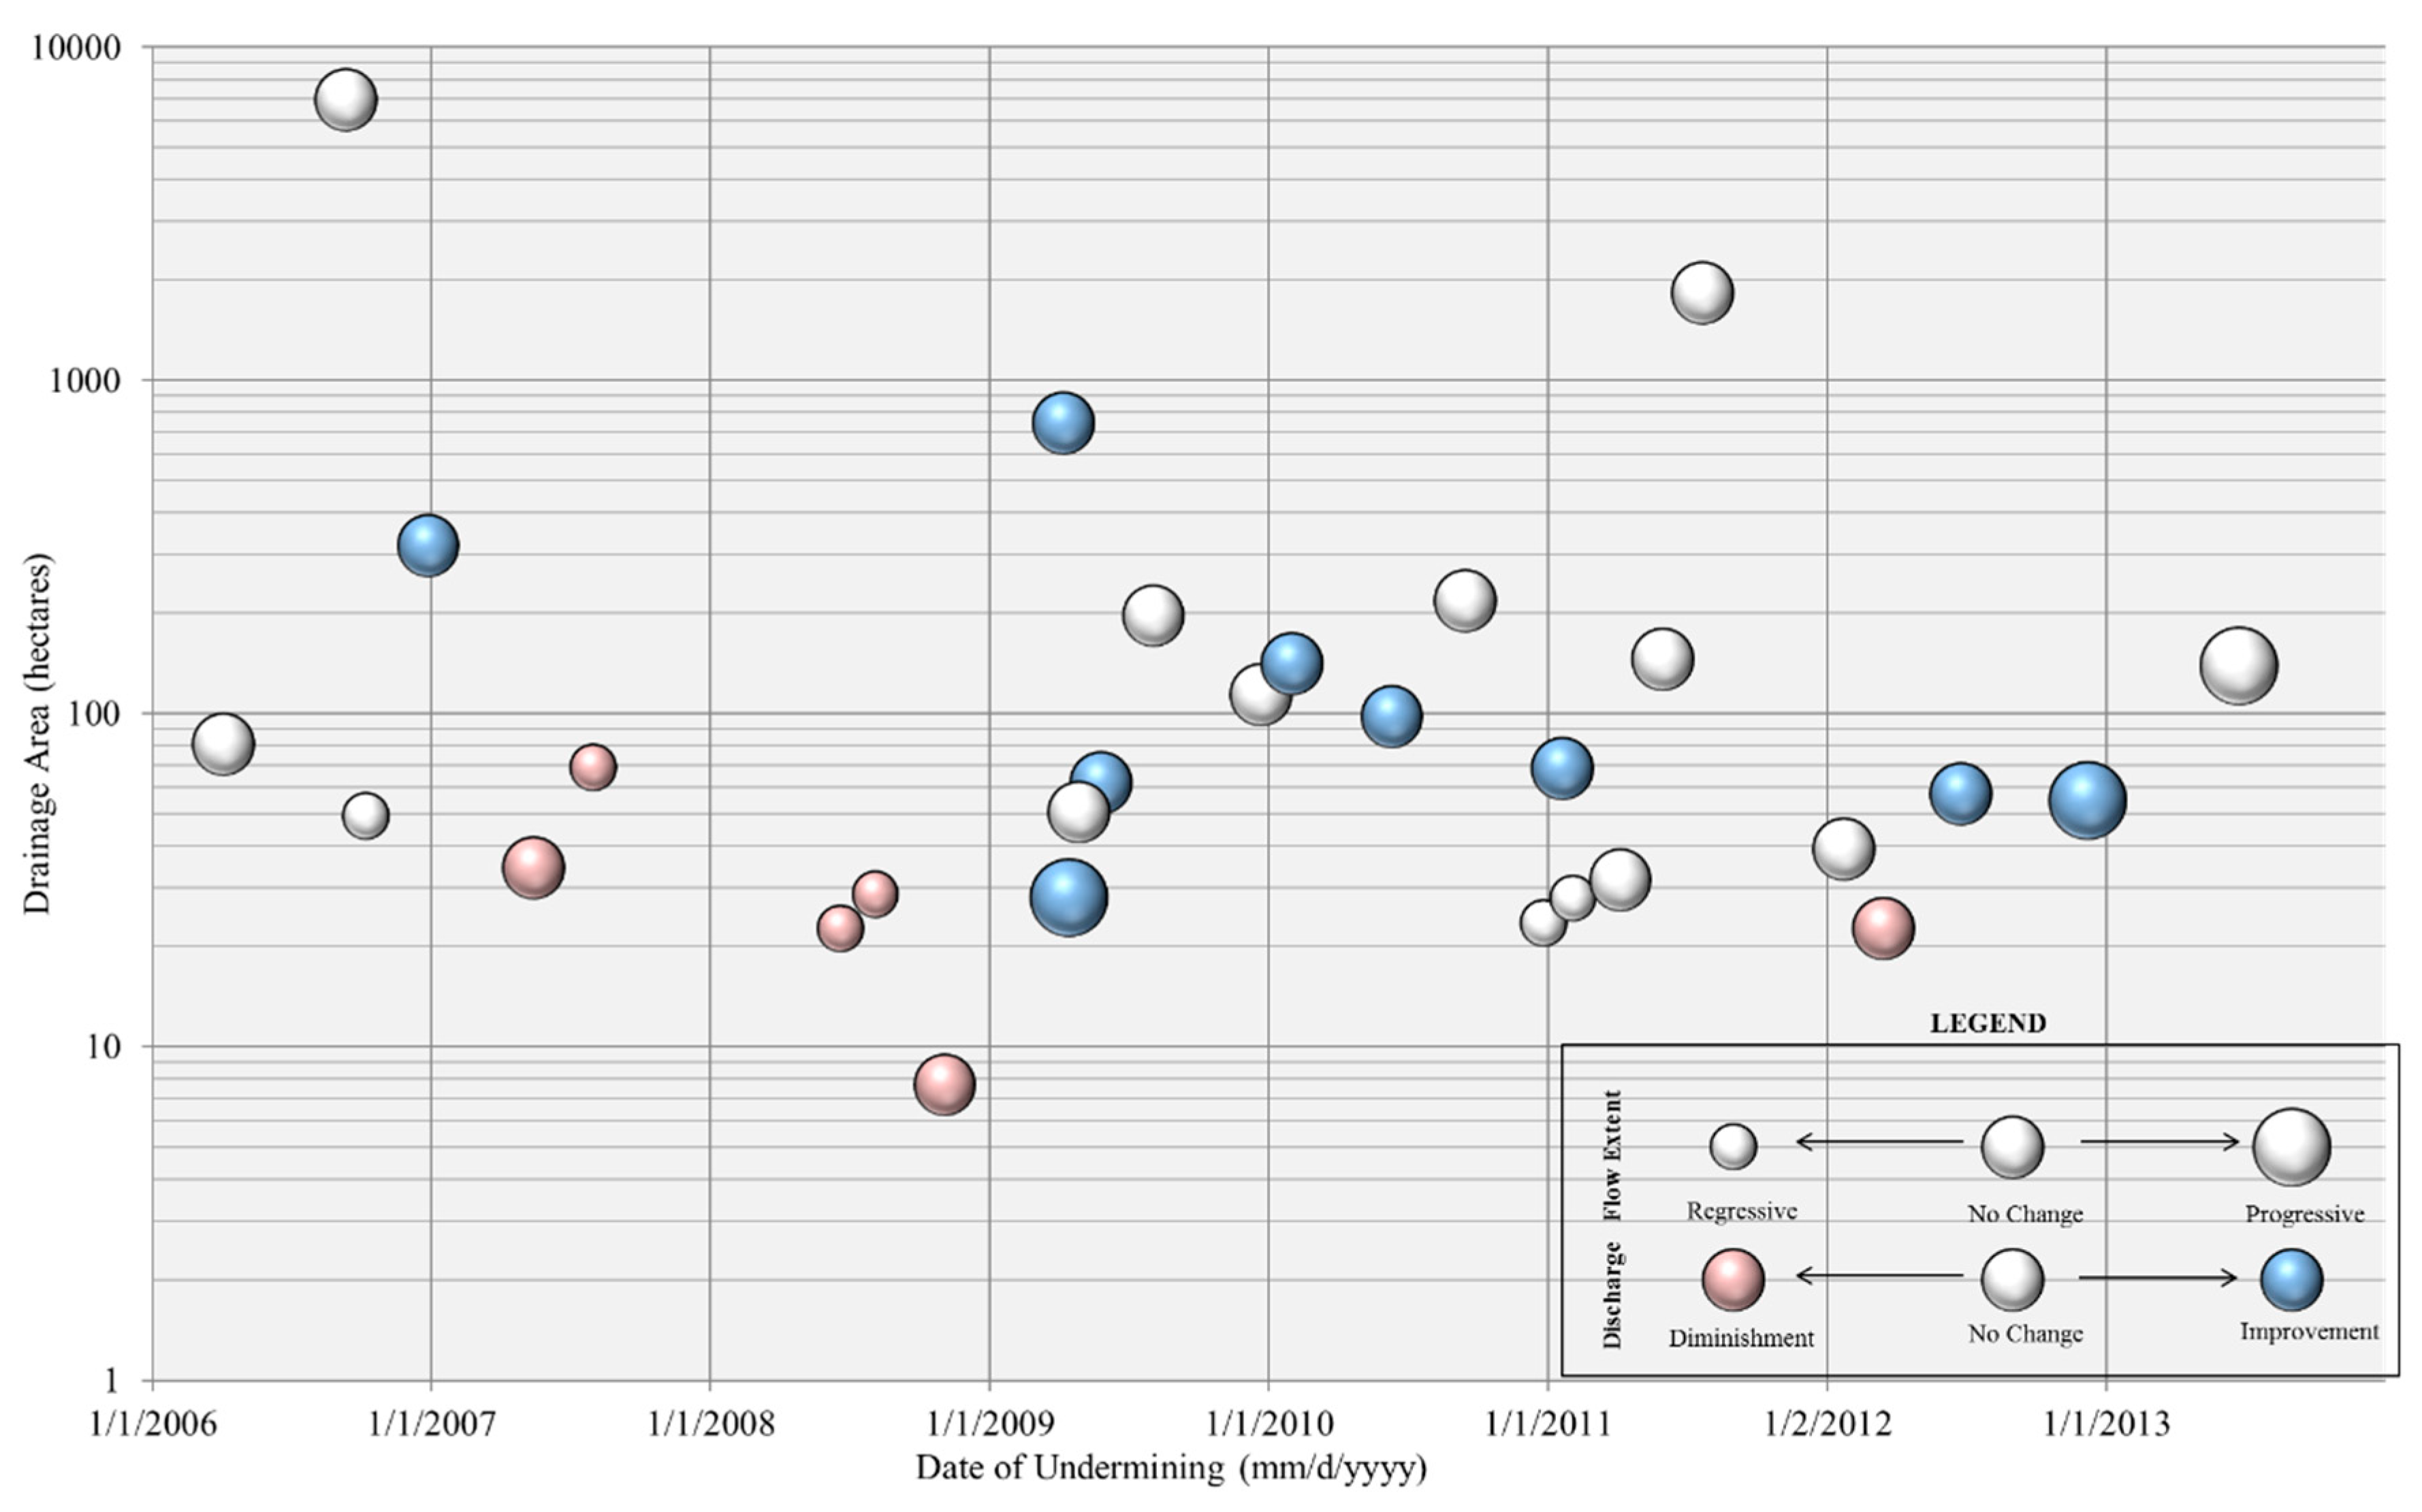
Of the six streams identified with diminished streamflow conditions, five were mined between 2007 and 2009. This suggested a possible correlation between streambed grouting techniques and flow loss restoration.
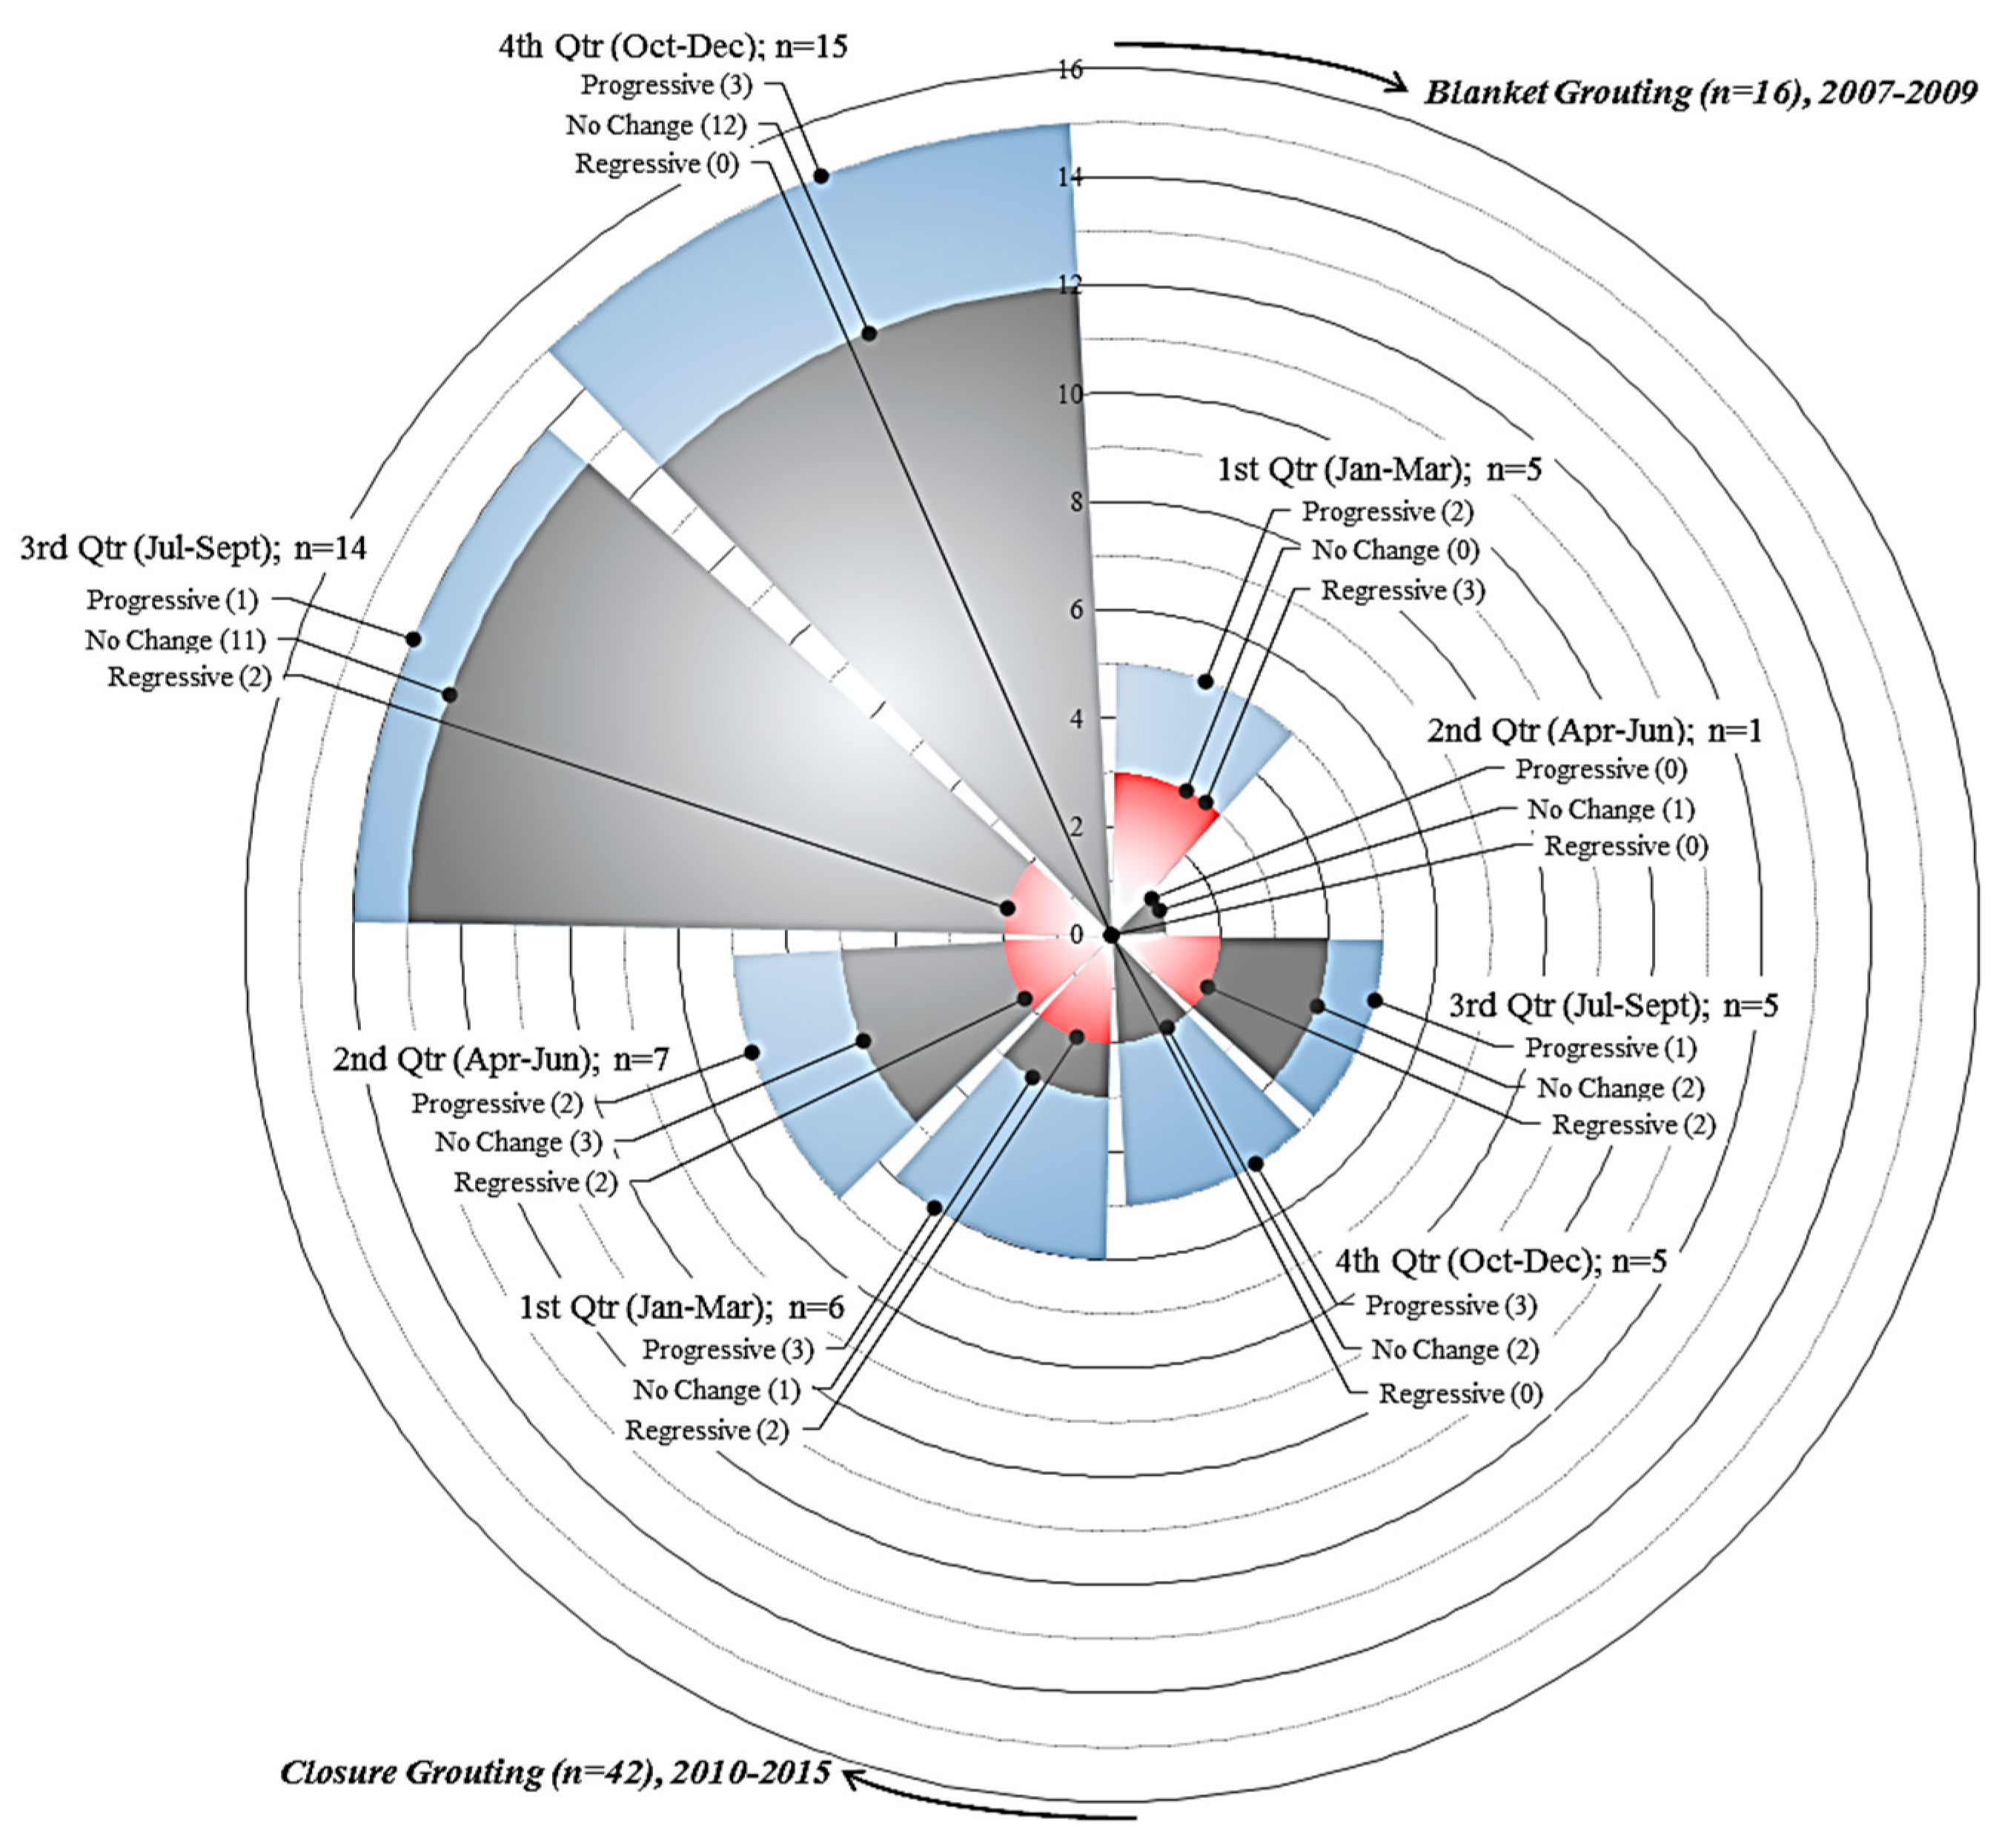
Figure 6 shows that, when analyzing all sample sites where flow loss restoration was performed (
n = 58), blanket grouting (performed from 2007 to 2009) was less effective than the performance-based closure-style grouting used since 2010.
Of the 16 samples sites where blanket grouting was performed (2007 through 2009), five sites exhibited diminished streamflow conditions, an incidence of 31%. Of the 42 sample sites where closure-style grouting was performed (since 2010), six sites exhibited diminished streamflow conditions, an incidence of 14%.
Figure 6 also shows that flow loss restoration is less effective when grouting (blanket or closure-style) is performed in the first quarter (January–March) of the calendar year. Grouting was performed during the first quarter at 11 sample sites, five of which were identified with diminished streamflow conditions. This represents an incidence of 45%. The incidence of sample sites with diminished streamflow conditions when grouting was performed during the second, third, and fourth quarters was 25% (two of eight sample sites), 21% (four of 19 sample sites), and 0% (zero of 20 sample sites), respectively.
It is logical that flow loss restoration is less effective in the winter months and more effective in the summer and fall. Groundwater levels of unconfined aquifers follow a natural cyclic pattern of seasonal fluctuation. Typically, hydraulic head increases during the winter and spring in response to greater recharge rates, and decreases during the summer and fall in response to increased evapotranspiration rates. It is possible that the long-term effectiveness of flow loss restoration is affected when grout is injected into near-surface bedrock under a high hydraulic head condition, as this condition could affect the integrity of the grout through dilution or erosion prior to attaining a complete in situ cure.
5. Conclusions
Various approaches were examined to develop an environmental flow assessment method for headwater streams to evaluate the magnitude of likely hydrologic alteration and to determine the effectiveness of stream restoration techniques. These methods were derived from a common dataset and are differentiated by the technique used for statistical analysis. While most of the 88 monitoring sites and 29 streams showed no effect on flow or recovery following mining, four sample sites with significant hydrologic change were detected by all three methods: the univariate search method of linear regression, probabilistic risk assessment, and the flow duration parameter of correlation analysis. These four sample sites would also be classified as having a high degree of alteration, as determined by the Montana method and range in variability approach. Circumstantial evidence supports these findings, as diminished streamflow observed at these four sites following flow loss restoration persisted longer than sample sites determined to be restored effectively.
Probabilistic risk assessment and correlation analysis of change are objective, pragmatic, and statistically delimited. However, hydrologic alteration, as determined by these environmental flow assessment methodologies, does not necessarily imply that ecological impact occurred, but rather that there is a greater likelihood of ecological change for a stream.
One issue confronting the study of environmental flows is the shortage of research documenting practical application, despite expanding literature on method development [
2]. Empirical models that directly predict ecological response to various degrees of flow alteration are not readily available [
1]. The establishment of a holistic methodology is an alternative approach via which environmental flow assessment can advance through the examination of multidisciplinary elements [
8].
Additional study will be considered to investigate changes in species composition and abundance, biological metrics, habitat characteristics, and other applicable ecological indicators as they relate to various degrees of hydrologic alteration determined by the probabilistic risk assessment and correlation analysis of change criteria. The Streams TGD includes two standard biological sampling procedures to establish pre-mine conditions and to evaluate post-mine changes: (i) a field-based assessment of biological indicators, and (ii) a protocol for collecting, processing, and calculating an index of biotic integrity score using benthic macroinvertebrates. Biomonitoring locations are paired with over 50 sample sites used for this study. Future research will evaluate the hydro-ecological relationship of headwater streams and determine its application to compliance, permitting, and regulatory functions.


