Article

The Effect of Climate Change on Loss of Lake Volume: Case of Sedimentation in Central Rift Valley Basin, Ethiopia

1
Institute for Basic Science, Technology and Innovation, Pan African University, Nairobi 62000-0020, Kenya
2
Jaramogi Oginga Odinga University of Science and Technology, Bondo 210-40601, Kenya
3
Institute of Technology (AAiT), Addis Ababa University, Addis Ababa 385, Ethiopia
4
Kibabii University, Bungoma 1699-50200, Kenya
*
Author to whom correspondence should be addressed.
Hydrology 2018, 5(4), 67; https://doi.org/10.3390/hydrology5040067
Submission received: 27 October 2018 / Revised: 6 December 2018 / Accepted: 8 December 2018 / Published: 11 December 2018

Abstract

:
Evaluating the impact of climate change on sediment yield has become one of the major topics in climate research. The purpose of this study was to investigate sediment yield contribution to lake volume change under changing climatic conditions in the Central Rift Valley Basin. The ensemble mean of five regional climate models (RCMs) in the coordinated regional climate downscaling experiment (CORDEX)-Africa was considered for the purpose of this study. The climate variables (precipitation, minimum and maximum temperatures) in RCMs were bias corrected against observed data (1985–2016) using linear scaling (LS), power transformation (PT), variance of scaling (VS), and quantile mapping (QM). Two emission scenarios, the Representative Concentration Pathways, RCP4.5 and RCP8.5, were considered for the future scenario period (2041–2070). Better results were obtained when the ensemble values of the bias correction methods were used. Hence, the projected values of climate variables after bias correction were used in the Soil and Water Assessment Tool (SWAT) hydrological model to estimate the sediment yield contribution to lake volume change due to climate change. The results show that the average projected precipitation will decrease by 7.97% and 2.55% under RCP4.5 and RCP8.5, respectively. On average, the maximum temperature will increase by 1.73 °C and 2.36 °C under RCP4.5 and RCP8.5, respectively, while the minimum temperature will increase by 2.16 °C and 3.07 °C under RCP4.5 and RCP8.5, respectively. The average annual sediment yield contributions to Lake Ziway were 431.05 ton/km2 and 322.82 ton/km2 for the Meki and Ketar rivers, respectively, in the historical period (1985–2010). The study also reveals that the annual sediment yield that was estimated for the Meki River was 323 ton/km2 and 382 ton/km2 under RCP4.5 and under RCP8.5, respectively. The sediment estimations for the Ketar River were 157 ton/km2 and 211 ton/km2 under RCP4.5 under RCP8.5, respectively. This will decrease the rate of volume change in Lake Ziway by 38% under RCP4.5 and by 23% under RCP8.5. The results show that the life expectancy of the lake is likely to increase under climate change scenarios. This will help water resources managers make informed decisions regarding the planning, management, and mitigation of the river basins.

1. Introduction

In any generic watershed, soil erosion in the upper catchments not only removes the fertile and nutrient-rich soils, but also causes sedimentation of the receiving water bodies such as lakes, reservoirs, ponds, and rivers. The sedimentation of the water bodies reduces their capacity and the useful lifespan of the reservoir. Sediment yield can be described as the amount of sediment that would enter into a reservoir located at the outlet of the basin [1]. It is the net result of soil erosion and processes of sediment accumulation, so it depends on variables that control water and sediment discharge to reservoirs [2]. Sediment yield is influenced by many factors, which include topography, soil, climate, land use, and drainage characteristics [3,4,5,6]. The problem of sedimentation is aggravated by human activities and climate change. A study conducted by Belete [7] on Lake Hawasa showed that sedimentation caused the rise in the lake’s level.
The effects of climate change on water resources have been widely studied [8,9,10,11,12,13]. However, such potential effects on sediment yield have received comparatively little attention. Climate change affects hydroclimatic variables that in turn affect the sedimentation of the lakes. It is likely to affect sediment yield because of its effect on precipitation extremes [14,15,16]. The intensity of rainfall, streamflow, and temperature are some of the parameters that influence the movement of sediment in the basin. According to Rodríguez-Blanco et al. [17], the suspended sediment response to climate change generally followed the patterns of simulated changes in streamflow. Climate change can also affect future reservoir planning and management [18]. The volume variability of lake is more responsive to extreme climate events than to other anthropogenic factors [7]. According to Mulugeta et al. [19], there is a need for future investigation to establish a relationship between the lake volume dynamics and effect of climate variability impacting hydrological and erosion processes.
The projected climate data was used to evaluate the impact of climate change on sediment yield in the lakes. This helps to estimate sediment yield contribution to lake volume or level change due to climate change in order to take necessary measures. The sedimentation of lakes is a major challenge within the Central Rift Valley [20]. For instance, it was reported that sediment deposition contributed to reduction in the level of Lake Ziway in the last three decades [21]. However, no research has been conducted with regard to climate change impact on sediment yield in the Central Rift Valley Basin, Ethiopia. Therefore, this study was conducted to investigate how changes in climate affect the sedimentation of the lake in future scenarios using outputs from regional climate models (RCMs).
To predict and estimate sediment yield within river basins, a number of hydrological models have been developed. Among these models is the Soil and Water Assessment Tool (SWAT), which has shown its robustness worldwide in predicting sediment yield under different catchment characteristics. Studies carried out in different watersheds have shown that the SWAT model can be relied upon in predicting and estimating sediment yield. For instance, an evaluation of the SWAT model in simulating sediment yield in the watershed of Lake Jebba in Nigeria revealed satisfactory performance for streamflow and sediment yield predictions in the watershed [22]. In another study, Duru [2] applied the SWAT model to simulate water balance, stream flow, and sediment yield in the Cubuk I and Cubuk II reservoirs of Turkey, and the model performed well for both streamflow and suspended sediment load estimation. Palazon and Navas [23] also showed that the SWAT model can be used as a useful approach for sediment yield assessment. Ayana et al. [24] examined the applicability of the SWAT model in estimating runoff and sediment yields in the Fincha watershed in Ethiopia. Ayele et al. [25] also used the SWAT model for sediment yield prediction in the Upper Blue Nile Basin. Cousino et al. [15] and Azari et al. [26] have also applied the SWAT model to evaluate the impact of climate change on sediment yield.
Hence, the main objective of this study was to investigate the contribution of sediment yield to lake volume change under changing climatic condition using the SWAT model in the Central Rift Valley Basin.

2. Materials and Methods

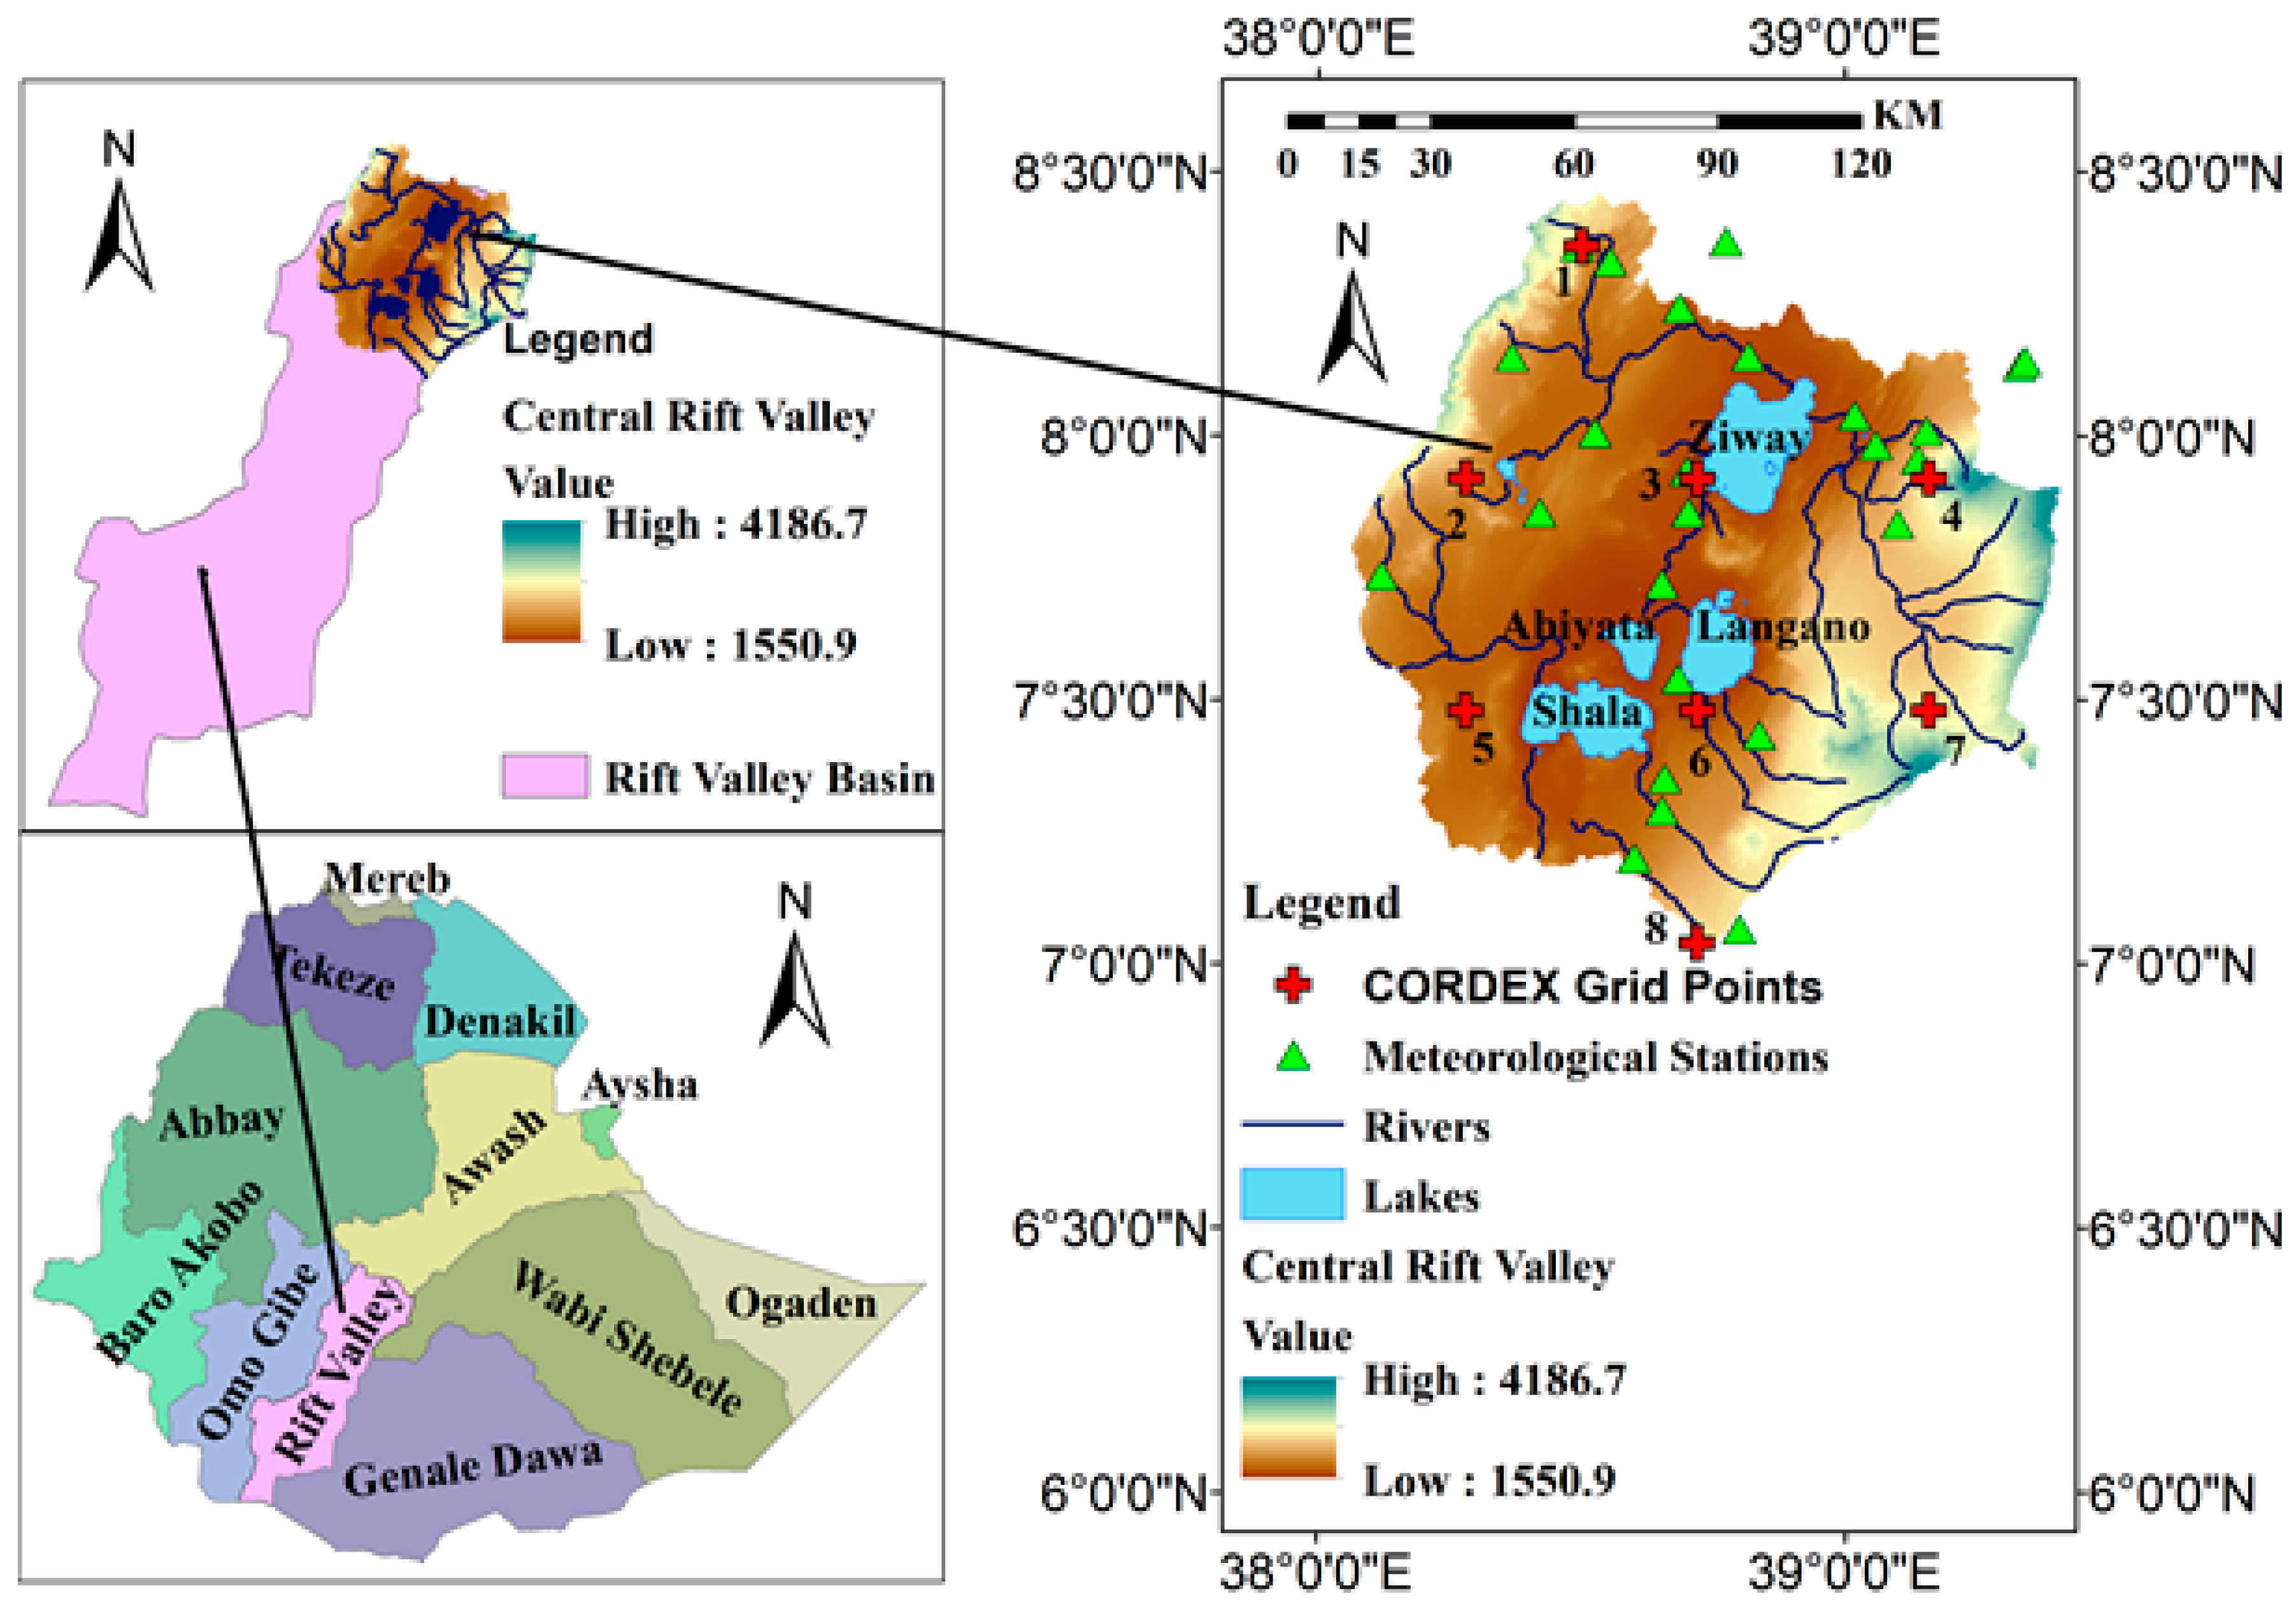
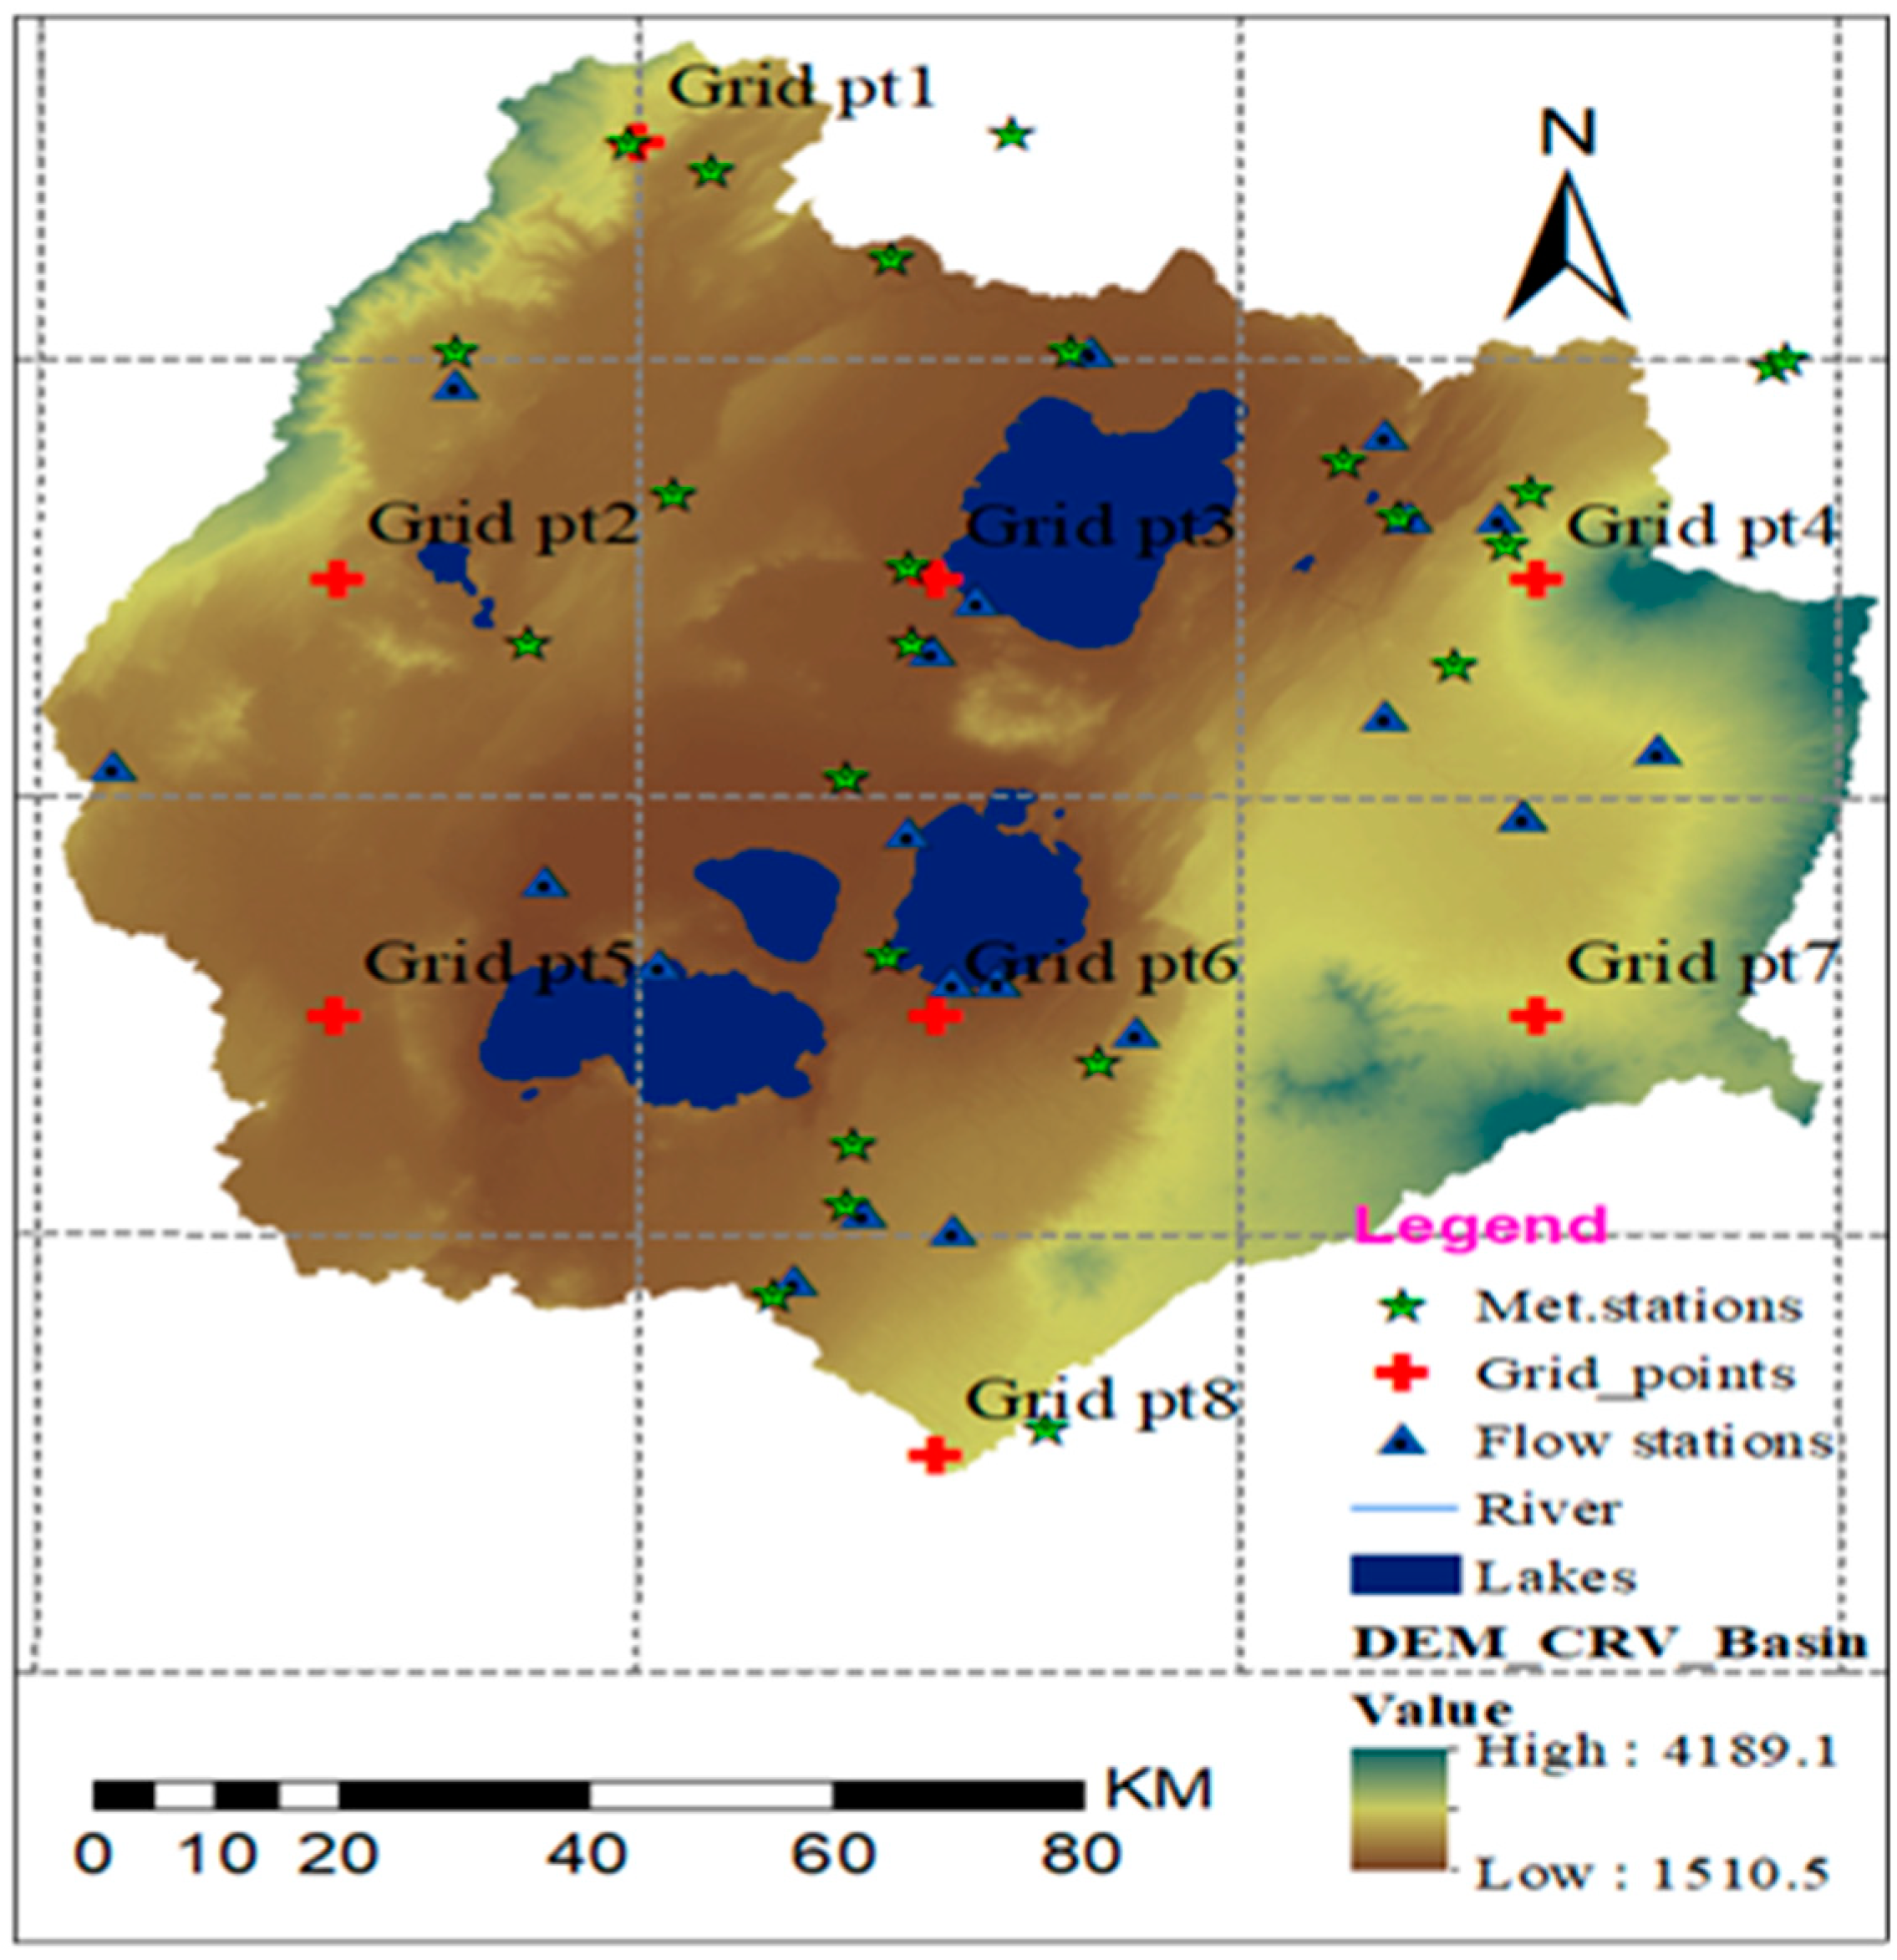
2.1. Description of the Study Area

The Central Rift Valley Basin (CRVB) is located between 38°15′ E and 39°30′ E longitude and 7°10′ N and 8°30′ N latitude, as indicated in Figure 1. It covers an area of approximately 14,477 km2. Locally, the Central Rift Valley Basin is situated in two adjoining regions: namely, the administrative regions of Oromia and the Southern Nations Nationalities and Peoples Region (SNNPR). The mean annual rainfall of the study area varies between 600 mm near the lakes and 1200 mm in the highlands or mountainous areas. The average minimum temperature is 10.5 °C, while the average maximum temperature is 24.3 °C. The basin contains four major lakes, namely: Ziway, Shala, Abiyata, and Langano. It also has perennial rivers, which include: Meki, Ketar, Bulbula and Harakalo. Lake Abiyata is connected to both the Ziway and Langano lakes through the Bulbula and Horakela rivers, respectively. However, Lake Abiyata is more sensitive to the reduced flows of the Bulbula River compared to those of the Horakela River. Within the same basin, the lakes have different characteristics. Lake Shala is the deepest and closed lake, and is highly alkaline, making its water not usable for irrigation purpose [27]. Lake Langano has a relatively stable water level as compared to other lakes in the basin. Among all of the lakes, only Lake Ziway is a freshwater lake. Hence, this study focused more on this lake in the Central Rift Valley Basin.
Lake Ziway has a catchment of about 7300 km2, a lake surface area of 440 km2, a lake volume of 1.5 million cubic meter (mcm), and a maximum depth of nine meters. The Meki and Ketar rivers are the two major rivers, contributing an annual streamflow of about 276 mcm and 464 mcm, respectively. According to data obtained from Ministry of Water, Irrigation and Electricity (MWIE), the rate of sediment entering the lake through Meki River is higher than that of the Ketar River.
A study conducted in the Central Rift Valley by Meshasha et al. [28] showed that the rate of soil erosion is increasing over time. The major contributing factors for the high rate of erosion are intense rainfall, steep topography, poor vegetation cover, and anthropogenic factors. Deforestation, steep slope cultivation, the removal of crop residues, and inadequate conservation practices are some of the anthropogenic factors causing the high rate of soil erosion. However, the rate and magnitude of contributions from these factors are not well understood [20]. Moreover, there is no specific study on the contributions of climate change to the rate of sedimentation of lakes in the Central Rift Valley Basin.

2.2. Data Collection

For modeling purpose using SWAT, input data such as the digital elevation model (DEM), hydrological, meteorological, soil and land-use/cover data, and amount of abstraction in the basin are required. The daily meteorological data collected from 1985 to 2016 include rainfall, minimum temperature, maximum temperature, relative humidity, wind speed, and solar radiation. The daily available streamflow data collected were from 1985 to 2010. All of the required data were obtained from the National Meteorological Agency of Ethiopia, the Ministry of Water, Irrigation, and Electricity, the Oromia Bureau of Water and Energy, the Oromia Water Works Design and Supervision Enterprise (OWWDSE), the Oromia Irrigation Development Authority (OIDA), and the Rift Valley Lakes Basin Authority (RVLBA).
The hydrological and meteorological data collected were checked for their homogeneity, correctness, sufficiency, and completeness. The missing data values were filled using the inverse distance weighing (IDW) method, and then finally used as inputs to the climate and hydrological models.
Land use/cover, soil, and slope are the most important factors that affect soil erosion. Of the total area under study, the agricultural land is the most dominant land use (72.64%), followed by range land (14.65%). About 40% of the study area predominantly consists of the Haplic Luvisols soil type, followed by Vitric Andosols, which accounts for about 13%, and Calcaric Fluvisols being the least dominant soil type, consisting of 0.25% of the total area under study. About 39% of the study area is predominantly with a slope range of 3–8%, while 20% of the area under study has a slope range of 0–3% (20%). This implies that more than 50% of the study area has a slope ranging from 0–8%. Two slope ranges occupy more than 50% of the total.

2.3. Climate Models and RCPs Emission Scenarios

The CORDEX (coordinated regional climate downscaling experiment) is supported by the World Climate Research Programme (WCRP) to foster global partnership to generate an ensemble of high-resolution historical and future climate projections at the regional scale. The downscaling in this approach is based on the predictions and climate scenarios in Coupled Model Intercomparison Project Phase 5 (CMIP5) [29]. The purpose of CORDEX-Africa is to promote international downscaling coordination and facilitate easier analysis by scientists and end-user communities at the local level of regional climate changes [30]. Africa is one of the most vulnerable regions to weather and climate variability [31]. Thus, CORDEX-Africa is one of the special concerns of the CORDEX program. The importance of fully exploiting the CORDEX-Africa multi-Global Climate Model (GCM)/multi-RCM ensemble has been strongly emphasized. This helps to assess the climate change signal, and possibly, to identify and quantify the many sources of uncertainty [32]. CORDEX-Africa provides projected climate outputs at a relatively higher spatial resolution (50 km × 50 km).
The present study used five regional climate models (RCMs) with the driving model ICHEC-EC-EARTH under CORDEX-Africa. The models used were: CCLM4-8-17, HIRHAM5, RACMO22T, RCA4, and REMO2009. The future scenario period (2041–2070) and historical/baseline scenario period (1985–2016) were considered to evaluate patterns of change in the climate data. The representative concentration pathways (RCPs) scenarios RCP4.5 and RCP8.5 were considered for this study, because CORDEX-Africa prioritizes the RCP4.5 and RCP8.5 scenarios [33]. The RCM climate data outputs in CORDEX-Africa under emission scenarios RCP4.5 and RCP8.5 were bias corrected for application in the SWAT hydrological model, for climate change impact studies in the Central Rift Valley Basin. Bias correction was considered for precipitation, as well as minimum and maximum temperatures. The values of relative humidity, solar radiation, and wind speed in the historical period were used in a future scenario period without making any change, as the change in these values may not have significant impact when modeling climate change scenarios [15].

2.4. Bias Corrections

Bias correction is a statistical method that is used to correct the climate models outputs deviation from observed data. This approach is commonly used to adjust simulated climate data at an appropriate spatial and temporal scale to use in hydrological modeling. There are different methods of bias correction. Linear scaling (LS), power transformation (PT), variance of scaling (VS), and distribution mapping were used for this study [34,35,36,37,38]. A detailed description of these bias correction methods can also be found in Gadissa et al. [39].

2.4.1. Linear Scaling

The linear scaling method is the simplest bias correction method; it has been the most widely used approach. The multiplicative correction approach is applied to precipitation. In this case, the ratio of the mean monthly observed precipitation and that of the model is used to scale model data at each time step (Equation (1)). Temperature was corrected by the additive correction approach under linear scaling. The mean monthly difference of the model and observed data was calculated and added to the model data at each time step (Equation (2)).
The linear scaling approach can be defined as:
P c o r =   P u n c ( P o b s , c t r ¯ / P r c m , c t r ¯ )
T c o r =   T u n c + ( T o b s , c t r ¯   T r c m , c t r ¯ )
where P c o r is corrected precipitation, P u n c is uncorrected precipitation, P o b s , c t r ¯ and P r c m , c t r ¯ are the mean value of observed and simulated precipitation, respectively, and T stands for temperature.

2.4.2. Power Transformation Method

Unlike linear scaling, the power transformation method considers the correction of variance in addition to mean values of observed and model data. It was specifically applied to adjust the precipitation time series due to the use of a power function:
P c o r =   a P u n c b
where, P c o r is the corrected precipitation, and a and b are the transformation coefficients (parameters).

2.4.3. Variance of Scaling (VoS)

This method is the same as the power transformation (PT) method, but effective to correct the mean and variance of time series temperature data.
T S c o r =   T ¯ O b s + S d o b s S d m o d ( T m o d   T ¯ m o d )
where, T S c o r is the corrected temperature in the scenario period, T ¯ o b s is the observed mean, S d o b s and S d m o d   are the observed and model standard deviation, respectively, and   T ¯ m o d is the mean temperature value of the model.

2.4.4. Quantile Mapping (QM)

Currently, quantile mapping (QM) is the most widely accepted bias correction method for impact studies using hydrological models. It is applied by calibrating the simulated cumulative distribution function (CDF) by adding both the mean delta change and the individual delta change in the corresponding quantiles to the observed quantiles. The method is most applicable for precipitation. The precipitation adjustment is expressed in terms of CDF [37].
P c o r , m , d =   e c d f o b s , m 1 ( e c d f r a w , m ( P r a w , m , d ) )
where Pcor,m,d is corrected precipitation on the dth day of the mth month, ecdf is the empirical cumulative distribution function, and Praw,m,d is the raw precipitation on the dth day of the mth month.

2.5. SWAT Model Setup and Data Input

SWAT is a physically-based semi-distributed model [40]. It is computationally efficient in simulating detailed hydrological processes at high spatial resolution by dividing the catchment into hydrological response units (HRUs) based on land use/cover, soil, and slope. SWAT is designed to predict watershed management practices on hydrology, sediment load, and water quality. The hydrology component is based on a water balance equation; surface runoff is computed based on the Soil Conservation Service (SCS) curve number method. Surface runoff can also be computed based on the Green and Ampt method. There are three options to estimate evapotranspiration: the Hargreaves, Priestley–Taylor, and Penmann–Monteith methods. In this study, surface runoff was computed based on the SCS curve number method, and the Penmann–Monteith method was applied to estimate evapotranspiration.
The main inputs for the SWAT model include digital elevation model (DEM), land use/cover data, soil data, and weather data (temperature and precipitation). The SWAT model setup for the assessment of hydrological processes in the Central Rift Valley was described by Desta and Lemma [41]. The model setup begins with watershed delineation and generating streamflow networks from DEM data using ArcSWAT software in the ArcGIS interface. Hydrological response units were defined; sensitivity analysis for parameters was also conducted. Finally, the model was calibrated and validated using the performance evaluation criteria. The simulation results of the SWAT model in the future period was based on the input from the downscaled values of RCM in CORDEX-Africa under different emission scenarios.
The water balance equation used in the SWAT model is:
SW t =   SW 0 + i = 1 t ( R Q surf ET Q perc Q r )
where SWt is the final soil water content (mm), SWo is the initial soil water content on day i (mm), t is time (days), R is the amount of precipitation on day i (mm), Qsurf is the amount of surface runoff on day i (mm), ET is the amount of evapotranspiration on day i (mm), Qperc is the amount of percolation on day i (mm), and Qr is the amount of groundwater flow on day i (mm).
The sediment yield from the study area was based on a modified Universal Soil Loss Equation [3]. The equation is given as:
Sed = 11.8 ( Q surf     q peak     A hru ) 0.56     K USLE     C USLE     P USLE     LS USLE     CFRG
where Sed is the sediment yield on a given day (metric tons), Qsurf is the surface runoff (mm/ha), qpeak is the peak runoff rate (m3/s), Ahru is the area of the HRU (ha), K, C, P, and LS, are the Universal Soil Loss Equation (USLE) soil erodibility, cover and management factor, support practice factor, and topographic factor, respectively, and CFRG is the coarse fragment factor.
SWAT uses a simple mass balance model to simulate the transport of sediment into and out of water bodies. It assumes a mixed system when calculating sediment movement through a water body. This means sediment entering the water body is distributed throughout the volume. The mass balance equation is:
sed w =   sed w , i +   sed fi   sed st   sed fo
where sedw is the amount of sediment in the water body at the end of the day (metric tons), sedw,i is the amount of sediment in the water body at the beginning of the day (metric tons), sedfi is the amount of sediment added to the water body with inflow (metric tons), sedst is the amount of sediment removed from the water by settling (metric tons), and sedfo is the amount of sediment transported out of the water body with outflow (metric tons). The detailed procedure is found in Neitsch et al. [42].

2.6. Sensitivity Analysis, Calibration, and Validation of SWAT Model

SWAT-Calibration and Uncertainty Programs (CUP) with the Sequential Uncertainty Fitting (SUFI-2) algorithm [43] was used for parameter optimization. Sensitivity analysis is to check the rate of change in output parameters with respect to the input parameters of the model. The input data to the SWAT model was carefully assessed, and the model was run for 16 years (1985–2000) for calibration purposes. The first three years were considered as the model warm-up period. This helps the model run to reach optimum efficiency, and the simulation in this period was not considered in the result analyses. After repeated calibration, the fitted values of parameters were identified. The simulated streamflow data of 10 years (2001–2010) was used for validation purposes. The fitted parameters were used in SWAT-CUP with SUFI-2 in the validation period. The model performance efficiency was determined by comparing observed against simulated hydrographs.
Two commonly used indicators, namely the coefficient of determination (R2) and Natch–Sutcliffe coefficient of efficiency [44], were used for calibration and validation of the SWAT model to test the goodness of fit between monthly simulated and observed values. The values of the coefficient of determination (R2) and Nash–Sutcliffe efficiency coefficient (ENS) ranged from 0 to 1. The performance indicators are calculated as follows:
R 2 =   [ i = 1 n [ ( O i     O avg ) ( S i     S avg ) ] [ i = 1 n ( O i     O avg ) 2 ] 0.5 [ i = 1 n ( S i     S avg ) 2 ] 0.5 ] 2
where, R2 is the coefficient of determination, Oi is the ith observed parameter, Oavg is the mean of the observed parameters, Si is the ith simulated parameter, Savg is the mean of model-simulated parameters, and n is the total number of events.
E NS = 1   i = 1 n ( O i   S i ) 2 i = 1 n ( O i   O avg ) 2
where ENS is the Nash–Sutcliffe efficiency coefficient, Oi and Si are the observed and the simulated values, respectively, and Qavg is the average observed values.
For the purpose of this study, performance efficiency as recommended by Ayele et al. [25] and Pereira et al. [45] was used. The objective function can be further elaborated quantitatively and qualitatively as: ENS > 0.75 (good); 0.36 < ENS < 0.75 (satisfactory); and ENS < 0.36 (unsatisfactory). For R2: 0.7 < R2 < 1 (very good); 0.6 < R2 < 0.7 (good); 0.5 < R2 < 0.6 (satisfactory); and R2 < 0.5 unsatisfactory.

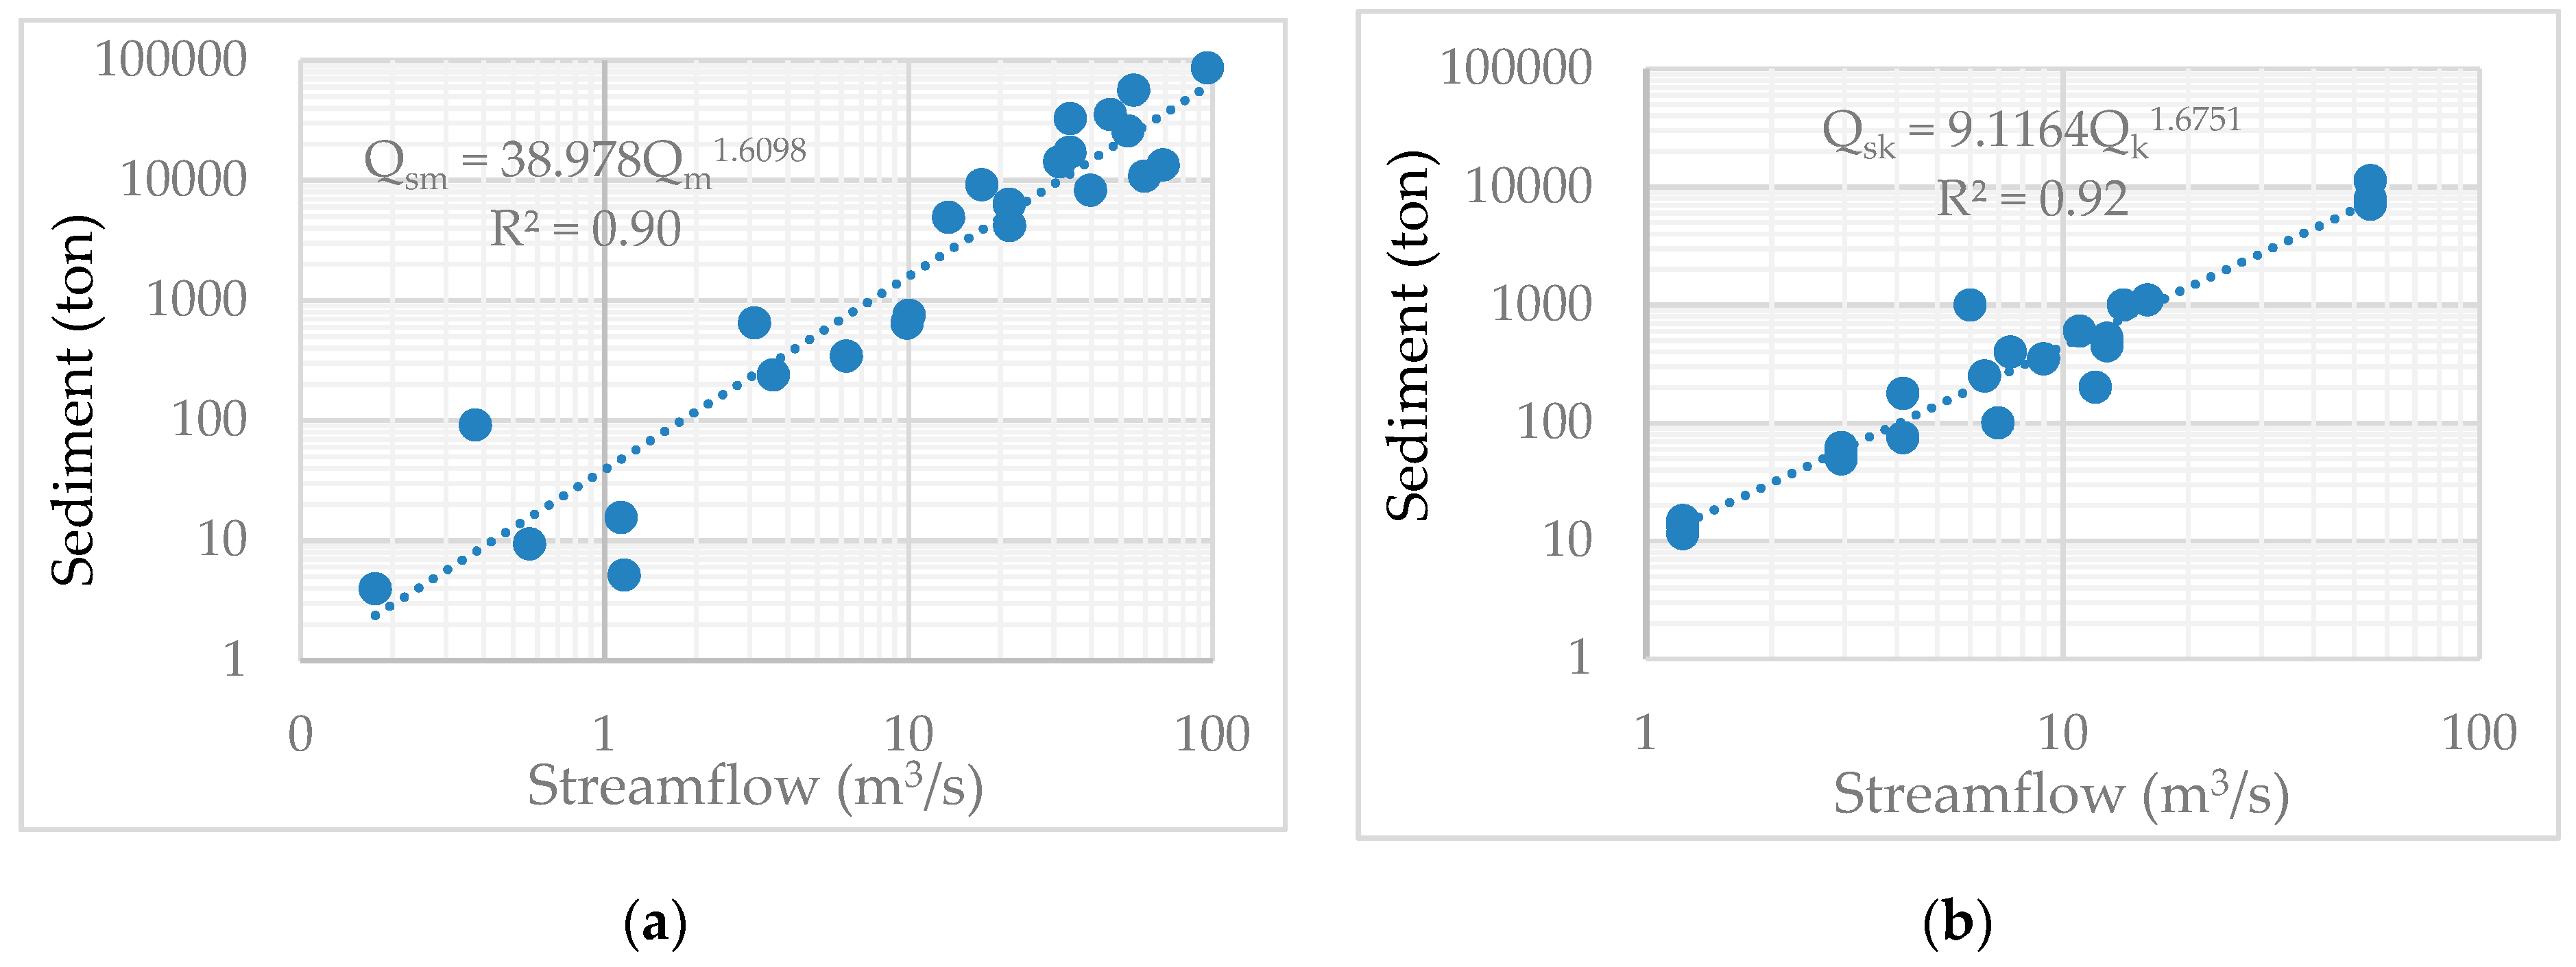
2.7. Sediment Rating Curve Development

Few measurements were conducted for sediment load collected from Ministry of Water, Irrigation, and Electricity (MWIE) with the corresponding streamflow data. The suspended load in milligram per liter was converted to tons/day as follows:
Q s ( ton/day ) =   0.0864 × Q f × S
where, Qs is suspended sediment (ton/day), Qf is streamflow (m3/s), and S is the suspended sediment load (mg/L).
Since the sediment measurement in the basin is less, a rating curve was developed to estimate sediment yield from flow measurement. Suspended sediment rating curves for the Meki and Ketar rivers are described by graphs of suspended sediment load versus discharge (Figure 2). Curve fitting for the regression model was made using the power function.
The equations developed from the suspended sediment rating curves for the Meki and Ketar rivers were as follows:
Q s m =   38.978 × Q m 1.6098
Q s k =   9.1164 × Q k 1.6751
where, Qsm and Qsk are suspended sediment for the Meki and Ketar rivers (ton/day), respectively, Qm is the Meki streamflow (m3/s), and Qk is the Ketar streamflow (m3/s).

2.8. Lake Volume Change Due to Sedimentation

Sediment yield contributions to Lake Ziway through the Meki and Ketar rivers were determined from the SWAT model. The suspended sediment load in tons were converted to storage volume considering the density of 1.2 g/m3 and a correction factor of 1.3 to account for the non-linearity relation of streamflow and suspended sediment on a monthly basis instead of daily basis [27]. The trap efficiency curve developed by Brune [46] considering the correlation of reservoir capacity and inflow ratio [47,48] was adopted for this study. Accordingly, the trap efficiency of 98% was considered to estimate the volume of deposition. The storage capacity of the lake was estimated from the elevation–volume relations developed from a bathymetric survey conducted in 2005/6 by the Ministry of Water, Irrigation, and Electricity. Accordingly, the trap efficiency of 98% was considered to estimate the volume of deposition.

3. Results and Discussion

3.1. Climate Change Projection of Ensemble RCMs Outputs

The relative annual changes in terms of precipitation, as well as maximum and minimum temperature, were assessed for all of the grid points (Figure 3) in the study area (Table 1). The ensemble mean of five models was used to assess the climate change in future scenarios (2041–2070) with respect to the base/historical period (1985–2016) under RCP4.5 and RCP 8.5. The average values of the different bias correction methods (linear scaling, power transformation, variance of scaling, and distribution mapping) were applied [39]. Accordingly, precipitation change will vary from −11.71% under RCP4.5 to 1.70% under RCP8.5. Overall, the results indicated that precipitation values will decrease on average by 7.78% under RCP4.5 and 2.33% under RCP8.5 in the study area. The results also indicate that all of the values of maximum temperature will increase from 1.61 °C under RCP4.5 to 2.57 °C under RCP8.5. The results show that the minimum temperature increased from 1.91 °C under RCP4.5 to 3.94 °C under RCP8.5. The study conducted by Lijalem et al. [49] on climate change impact on Lake Ziway watershed water availability also showed an increase in average monthly maximum temperature up to 3.6 °C and minimum temperature up to 4.2 °C under a special report on emission scenarios (SRES) in the period from 2001–2099. The precipitation showed variable changes for different seasons.
The decreases in precipitation, maximum temperature, and minimum temperature amounts are statistically significant at the 5% significance level (p < 0.05). The result is consistent with the studies of different scholars [13,50]. According to Alamou et al. [13], the annual precipitation of West Africa will decrease under RCP4.5 for the period 2041–2070 as compared to the reference period (1981–2010).

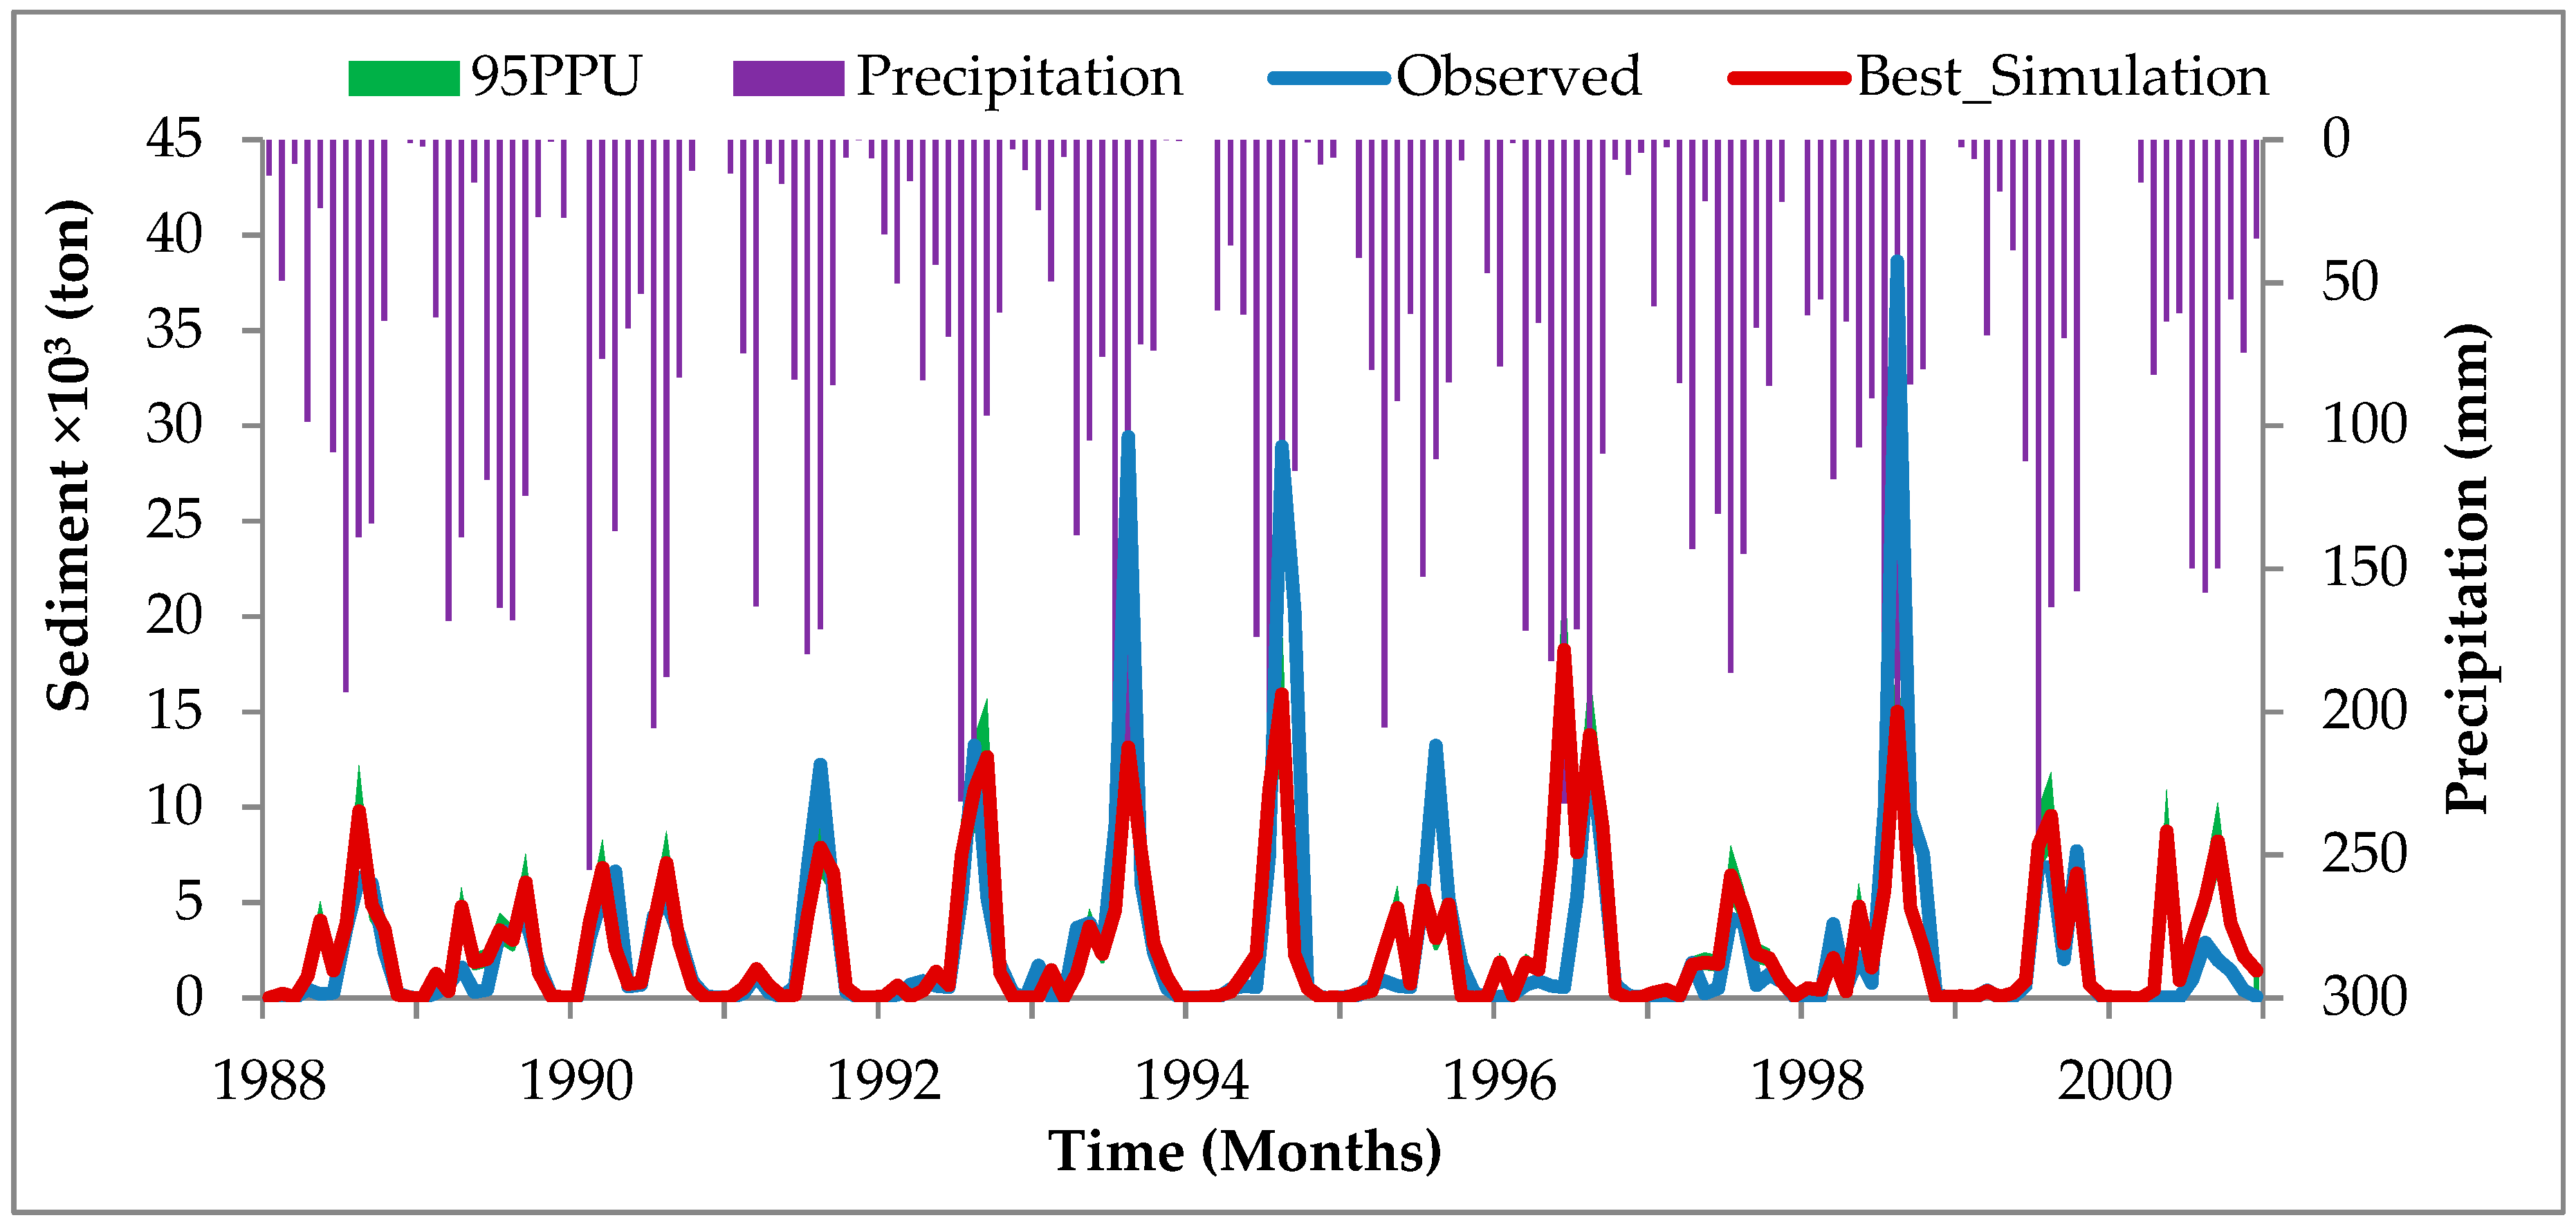
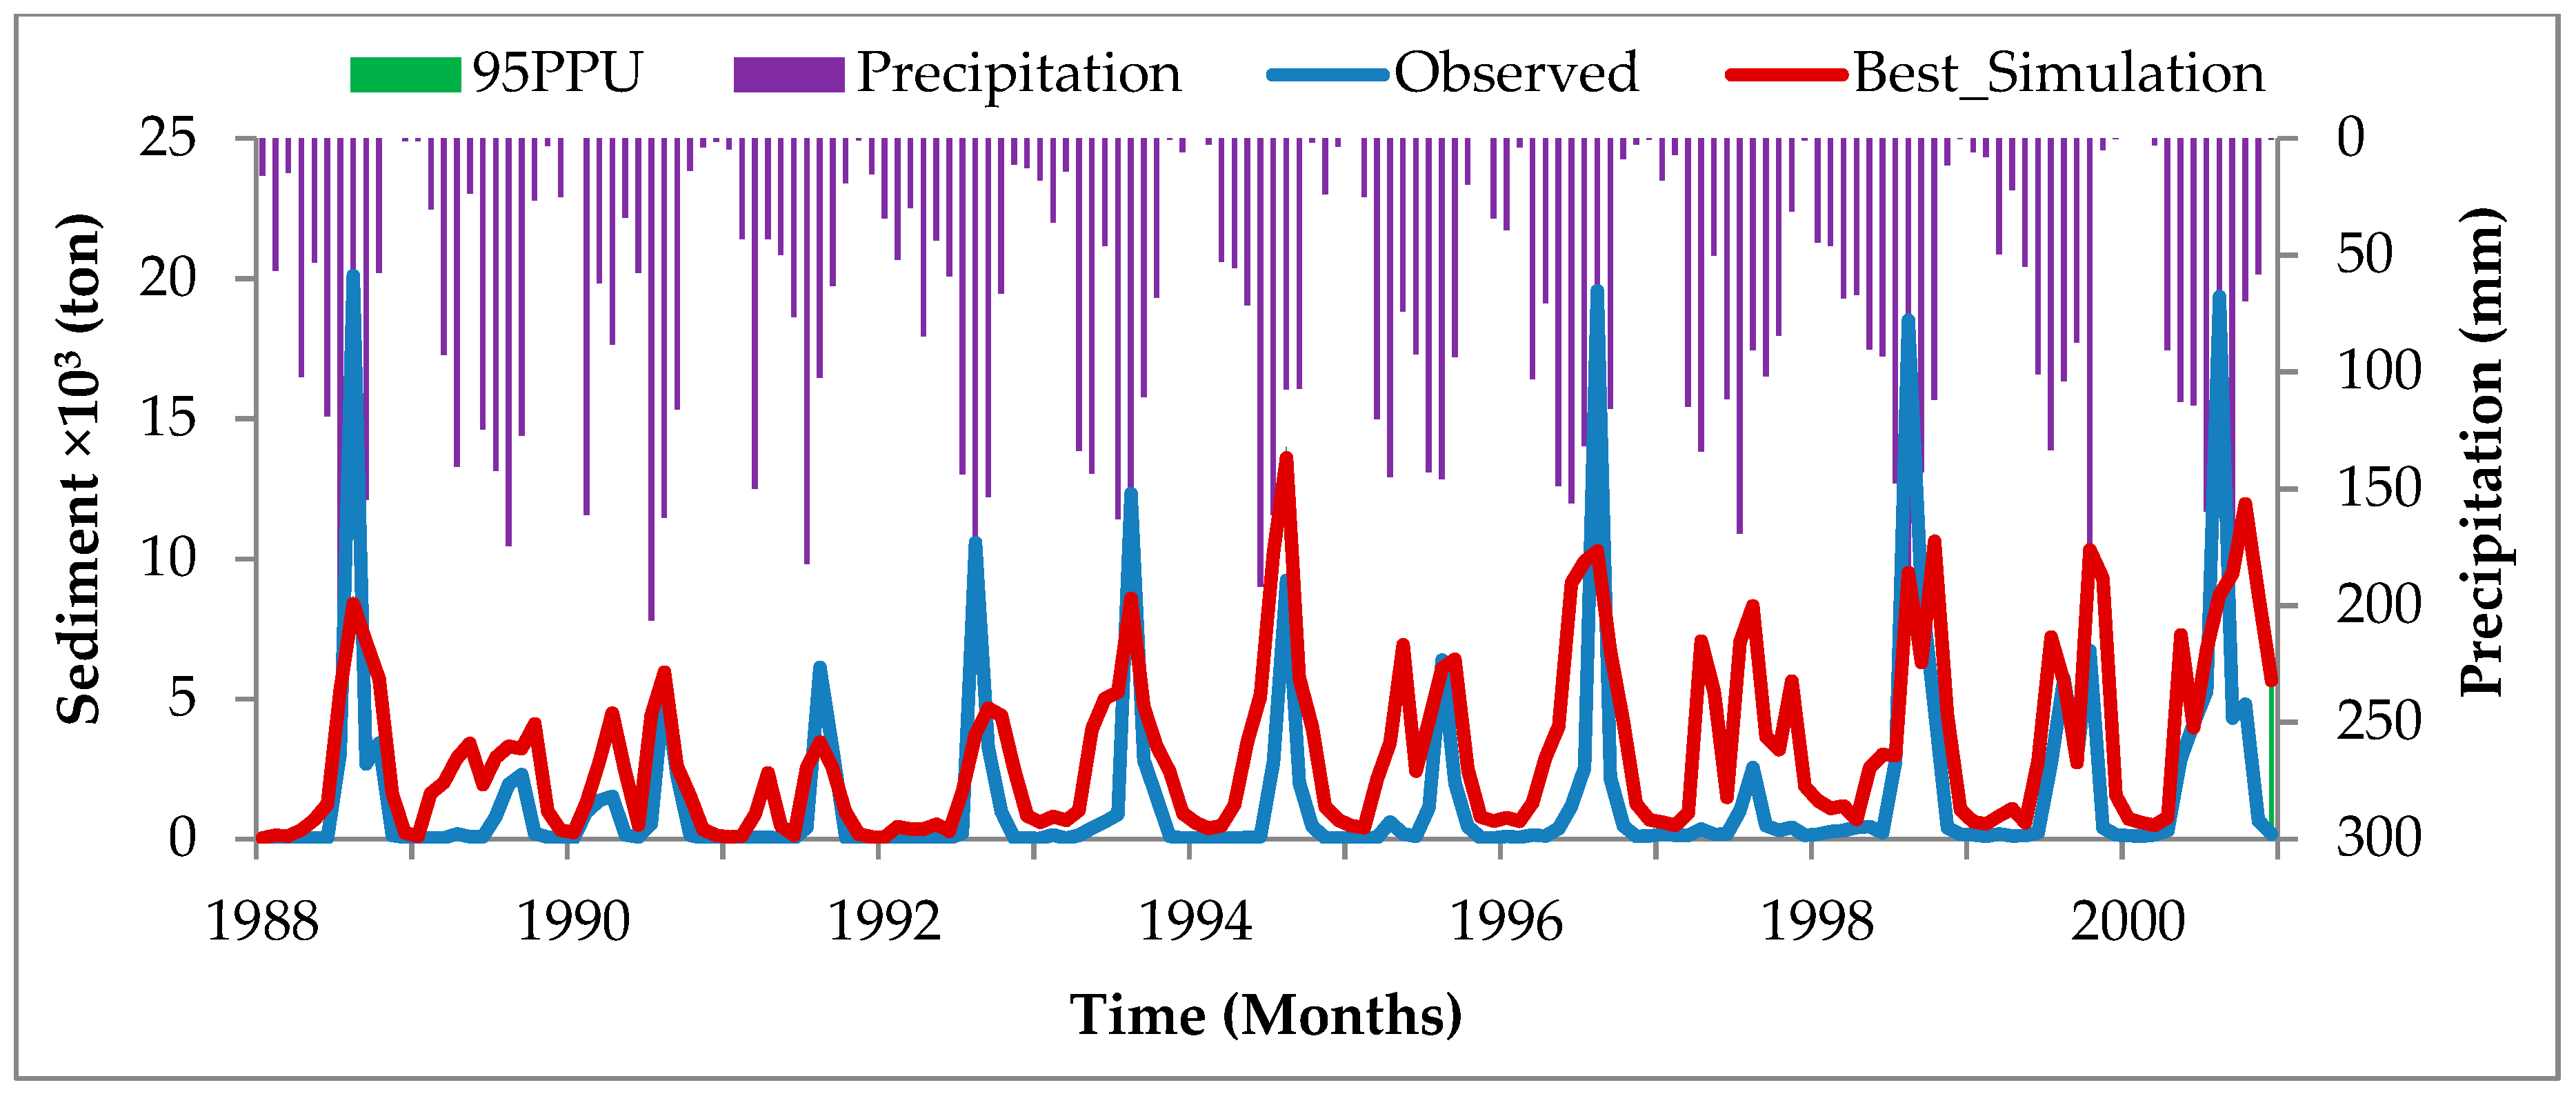
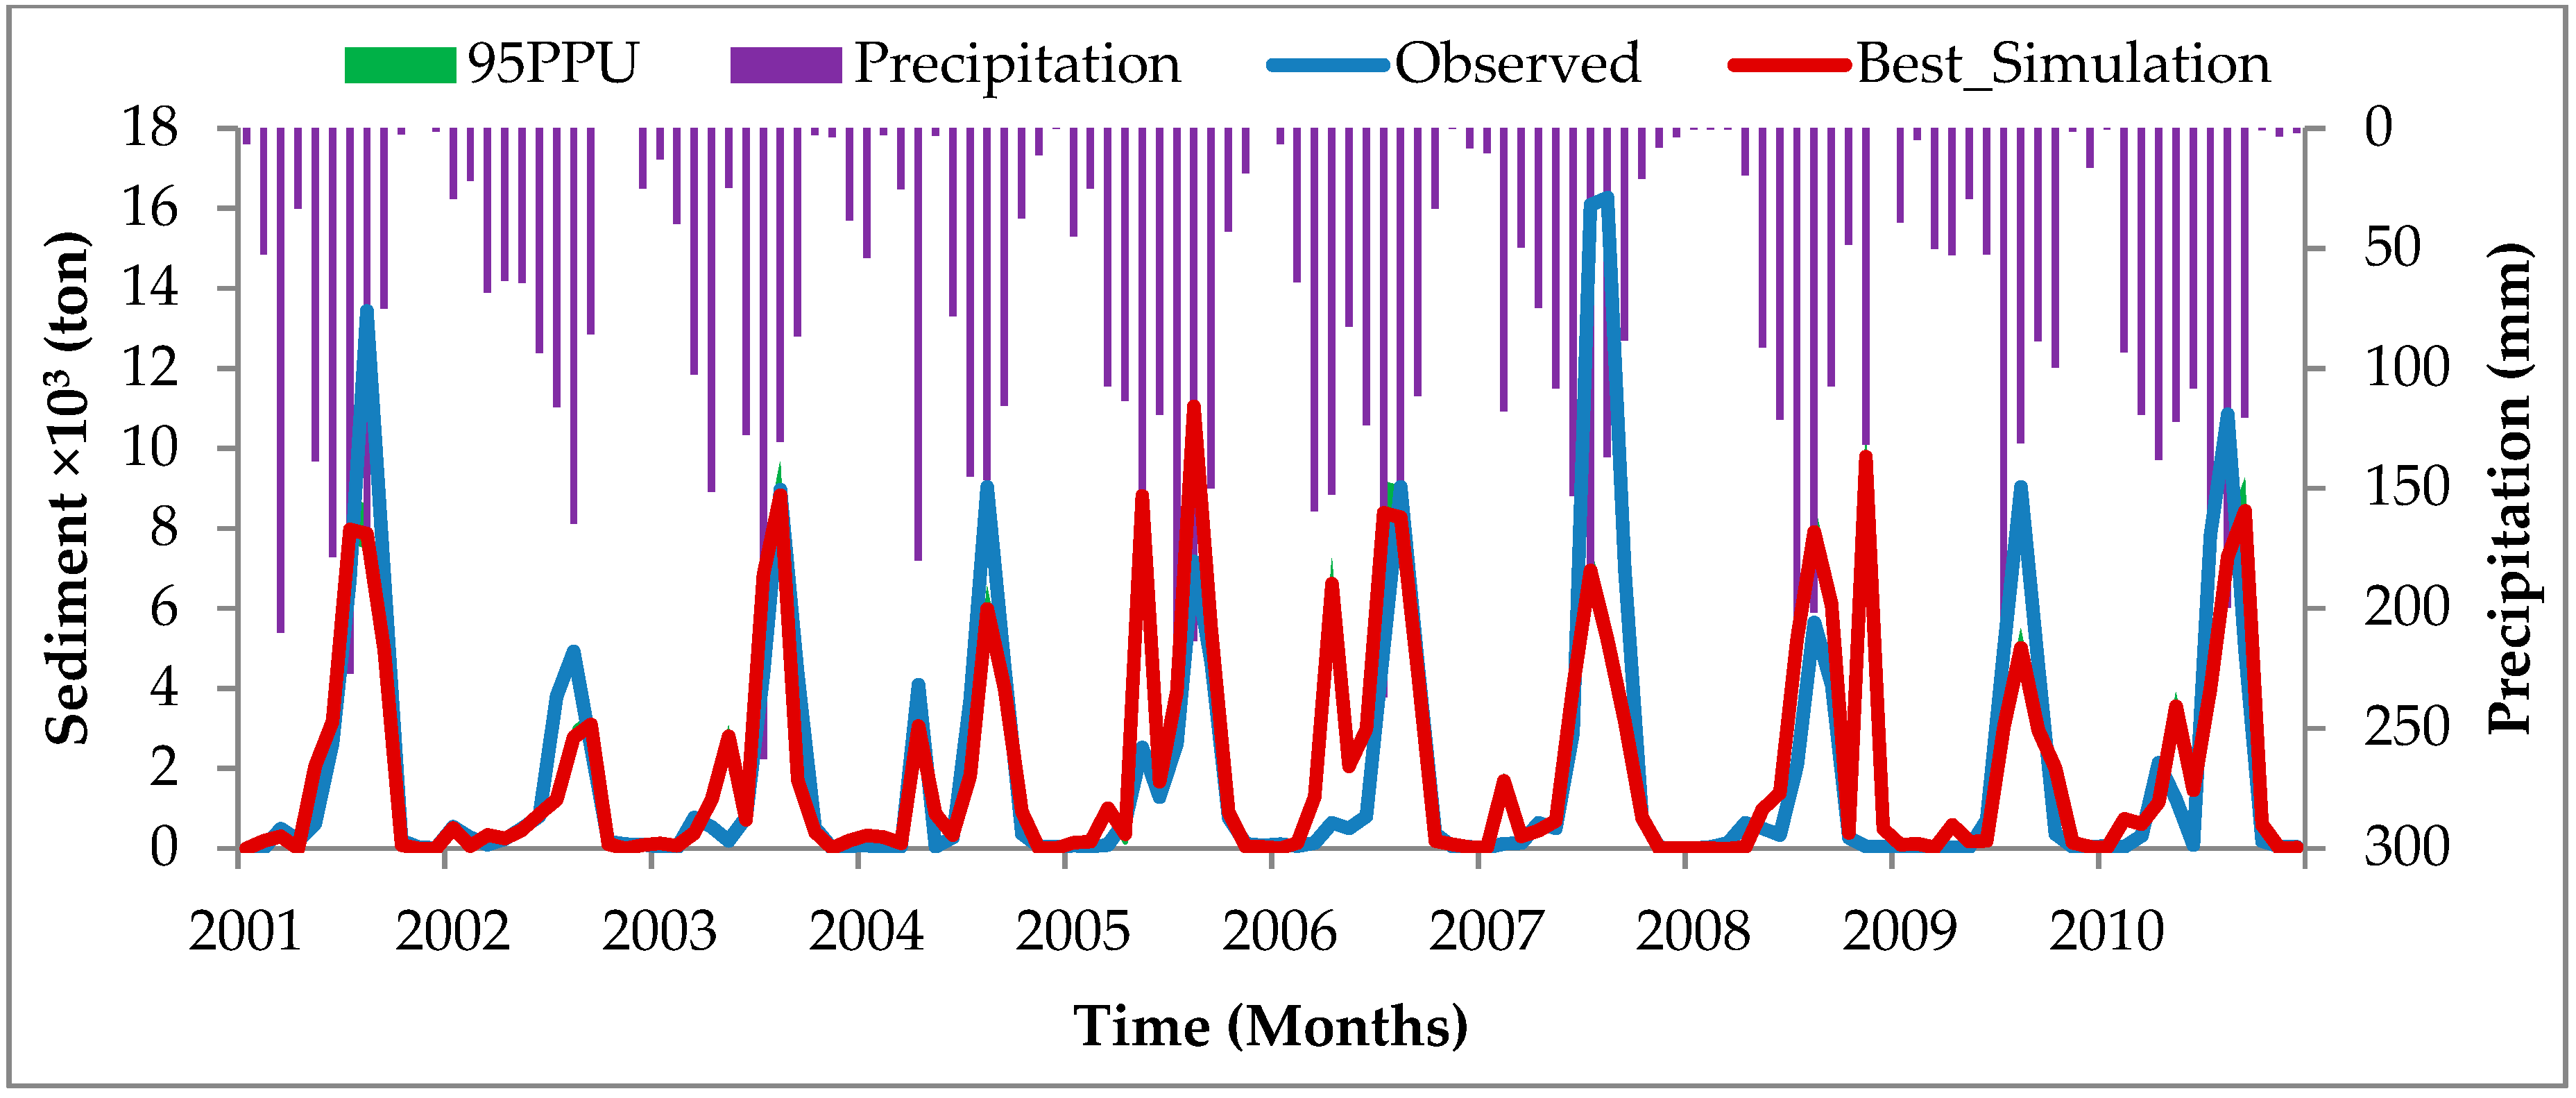
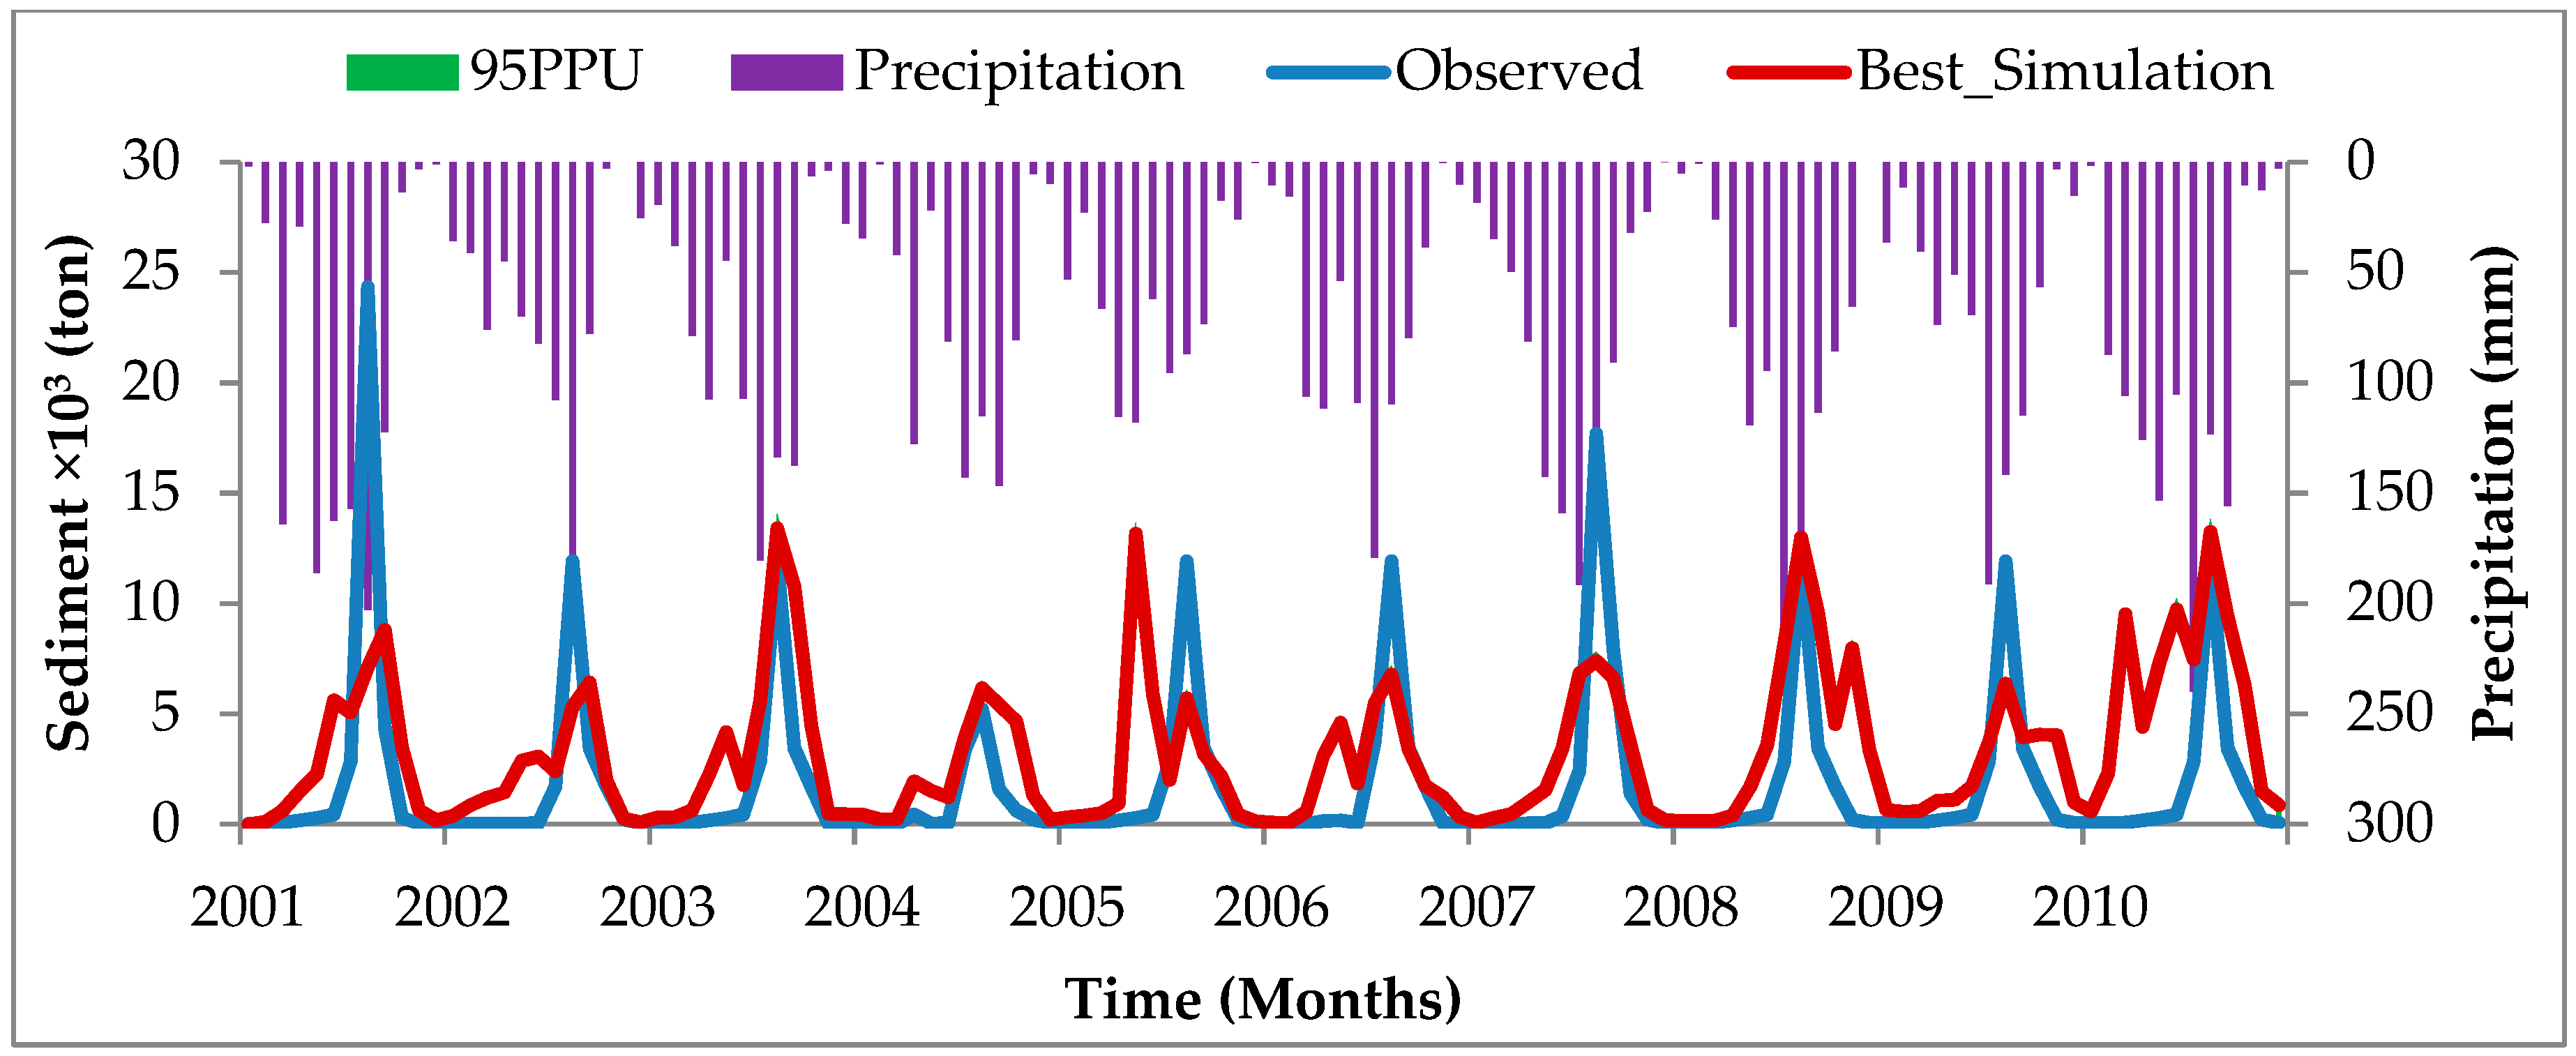
3.2. Assessment of SWAT Model Performance Efficiency

The parameters that optimize SWAT model performance for calibration and validation were identified by running the model several times to match the observed and simulated variables. Thirteen parameters that are sensitive to streamflow [39] and four parameters that are sensitive to sediment load, and their rankings, are given in Table 2 and Table 3. The SCS runoff curve number (R__CN2) was the most sensitive parameter to streamflow for both the Meki and Ketar rivers. After model calibration and validation were done for streamflow using SWAT-CUP-SUFI2, parameters that were sensitive to sediment load were selected. The linear re-entrainment parameter for channel sediment routing (SPCON) was the most sensitive parameter to sediment yield for the Meki and Ketar rivers.
The calibration results showed a fairly good agreement between the observed and simulated monthly streamflow, with ENS and R2 values of 0.60 and 0.62, respectively, for the Meki River, and 0.61 and 0.61 respectively for the Ketar River. The validation results also showed a good agreement, with ENS and R2 values of 0.54 and 0.60 respectively for the Meki River, and 0.57 and 0.58 respectively for the Ketar River.
The calibration and validation of the SWAT model for sediment yield are illustrated in Figure 4, Figure 5, Figure 6 and Figure 7 for the Meki and Ketar rivers. The results showed a good agreement between the observed and simulation values for calibration and validation periods, with R2 and ENS indicated in Table 4. According to Pereira et al. [45], the model performance for sediment yield estimation was in the satisfactory range. The model performance efficiency for the calibration and validation periods was lower for the Ketar River as compared to the Meki River. This might be due to the scarcity and uncertainty of the collected data. The efficiency results of the SWAT model in this study showed similarity with other studies in different parts of the world in simulating sediment yield. A study by Adem et al. [51] in the Upper Gilgel Abay of the Blue Nile Basin in Ethiopia showed similar efficiency values of SWAT model calibration and validation for sediment yield estimation. Ayana et al. [24] examined the applicability of SWAT in estimating runoff and sediment yields in the Fincha watershed in Ethiopia. It was concluded that the SWAT model performed well in predicting flow and yield in a given watershed. Similar results were reported by Ayele et al. [25] in the Upper Blue Nile Basin. Gathagu et al. [52] used the SWAT model in the Thika-Chania catchment in Kenya to evaluate soil and conservation practices to control sediment yield, and found satisfactory results. Licciardello et al. [53] also evaluated the SWAT model in simulating sediment deposition in a Sicilian reservoir by comparing with different bathymetric measurements. The study revealed that there is a higher efficiency coefficient between sedimentation volume simulated by the SWAT model and that obtained from bathymetric measurements.
The finding of this study in the historical period showed an underestimation of sediment yield as compared to values in a study conducted by Meshasha et al. [20] in the same area. Meshasha et al. [20] estimated a sediment yield of 611 ton/km2 for the Meki River and 494 ton/km2 for the Ketar River. Similar values have been used in different studies, such as Rift Valley Master Plan [27] for the Central Rift Valley Basin.

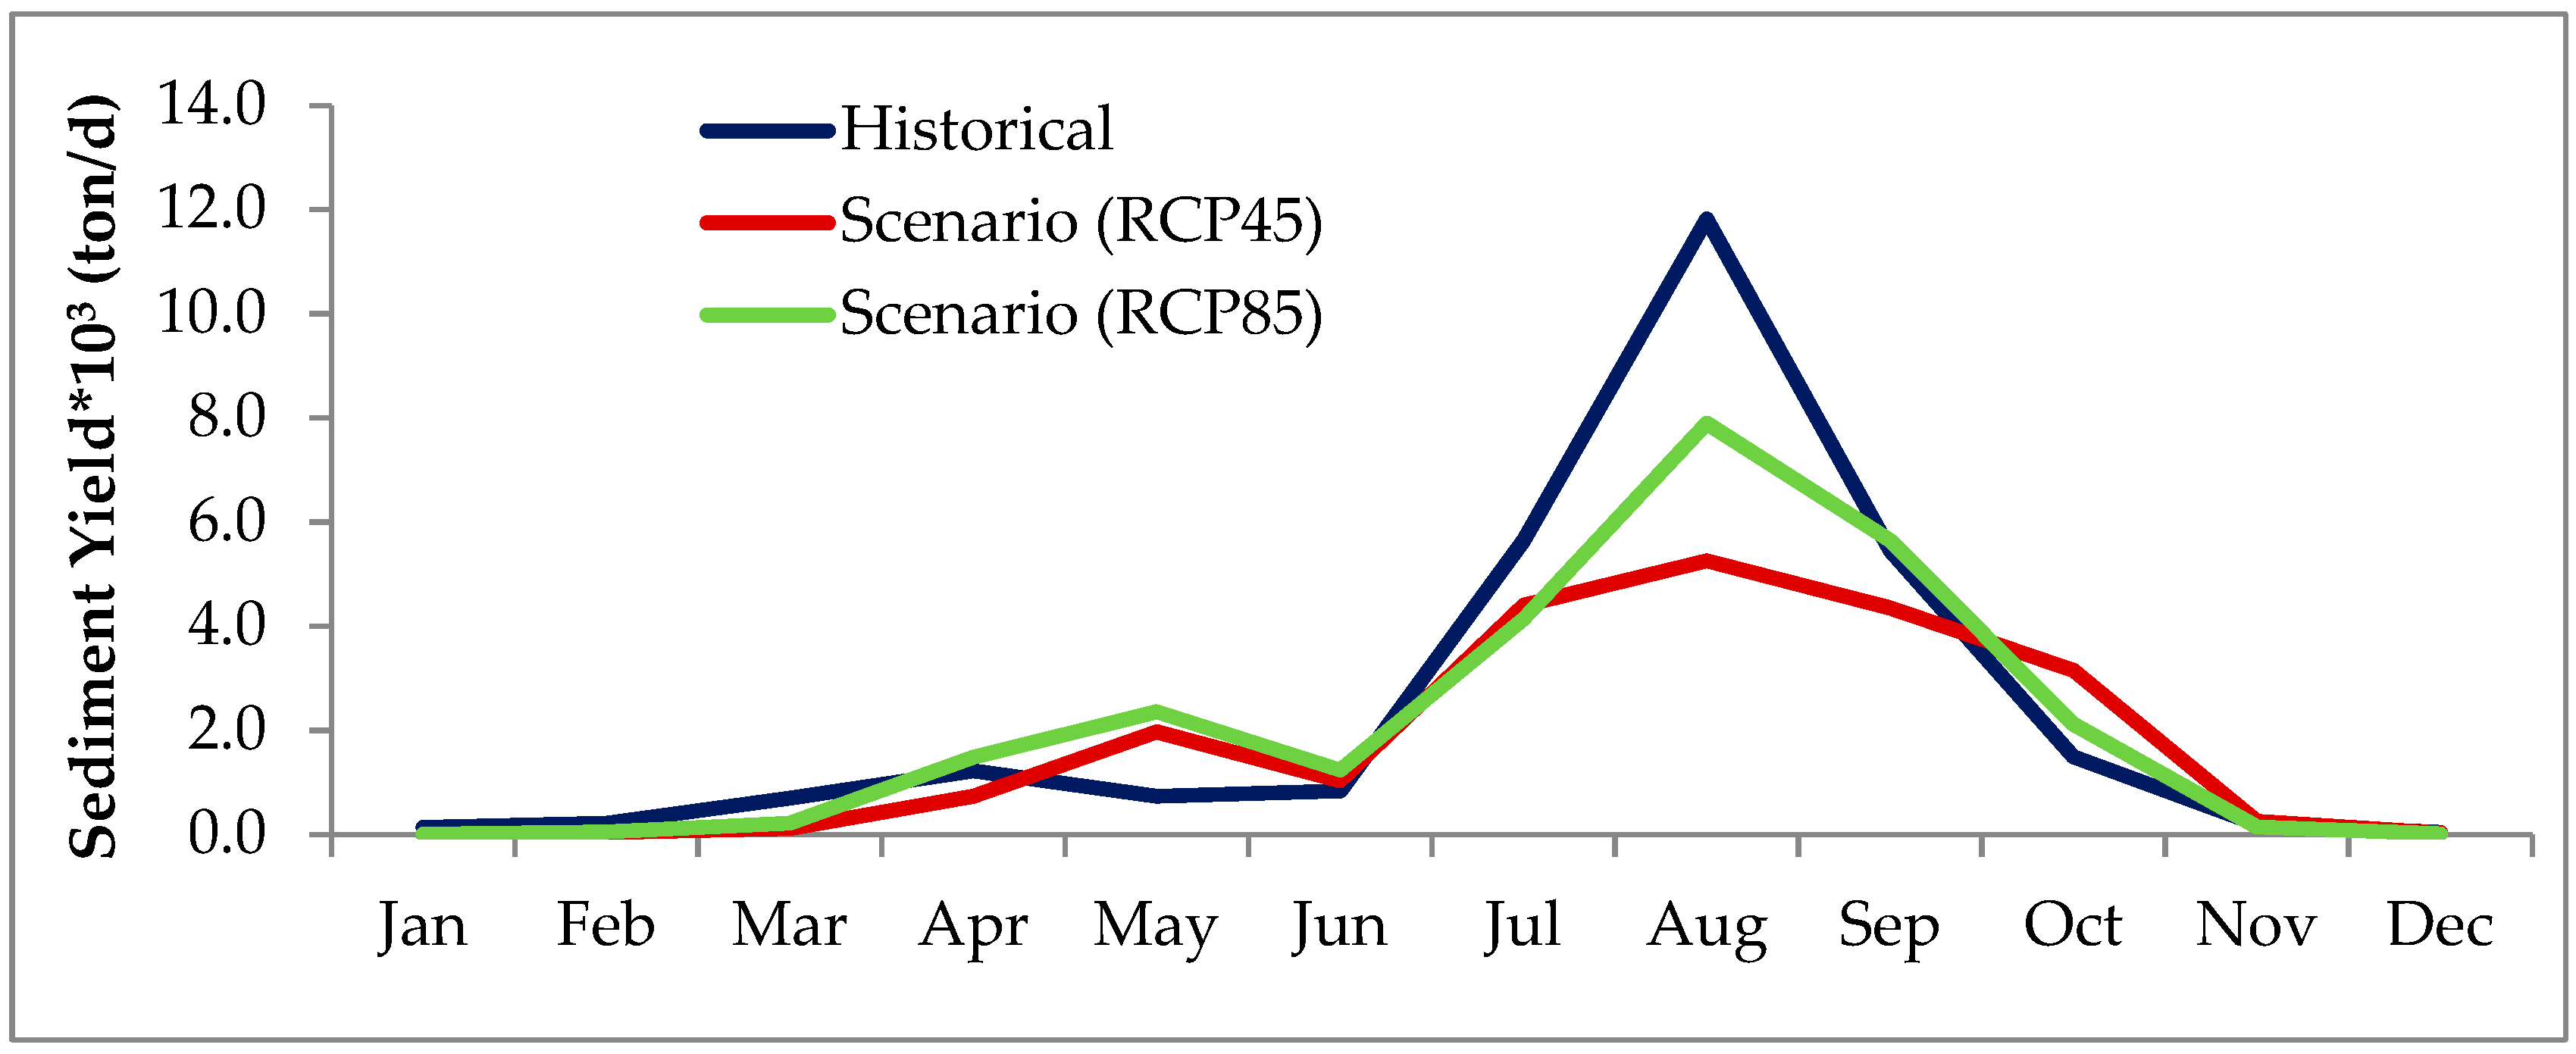
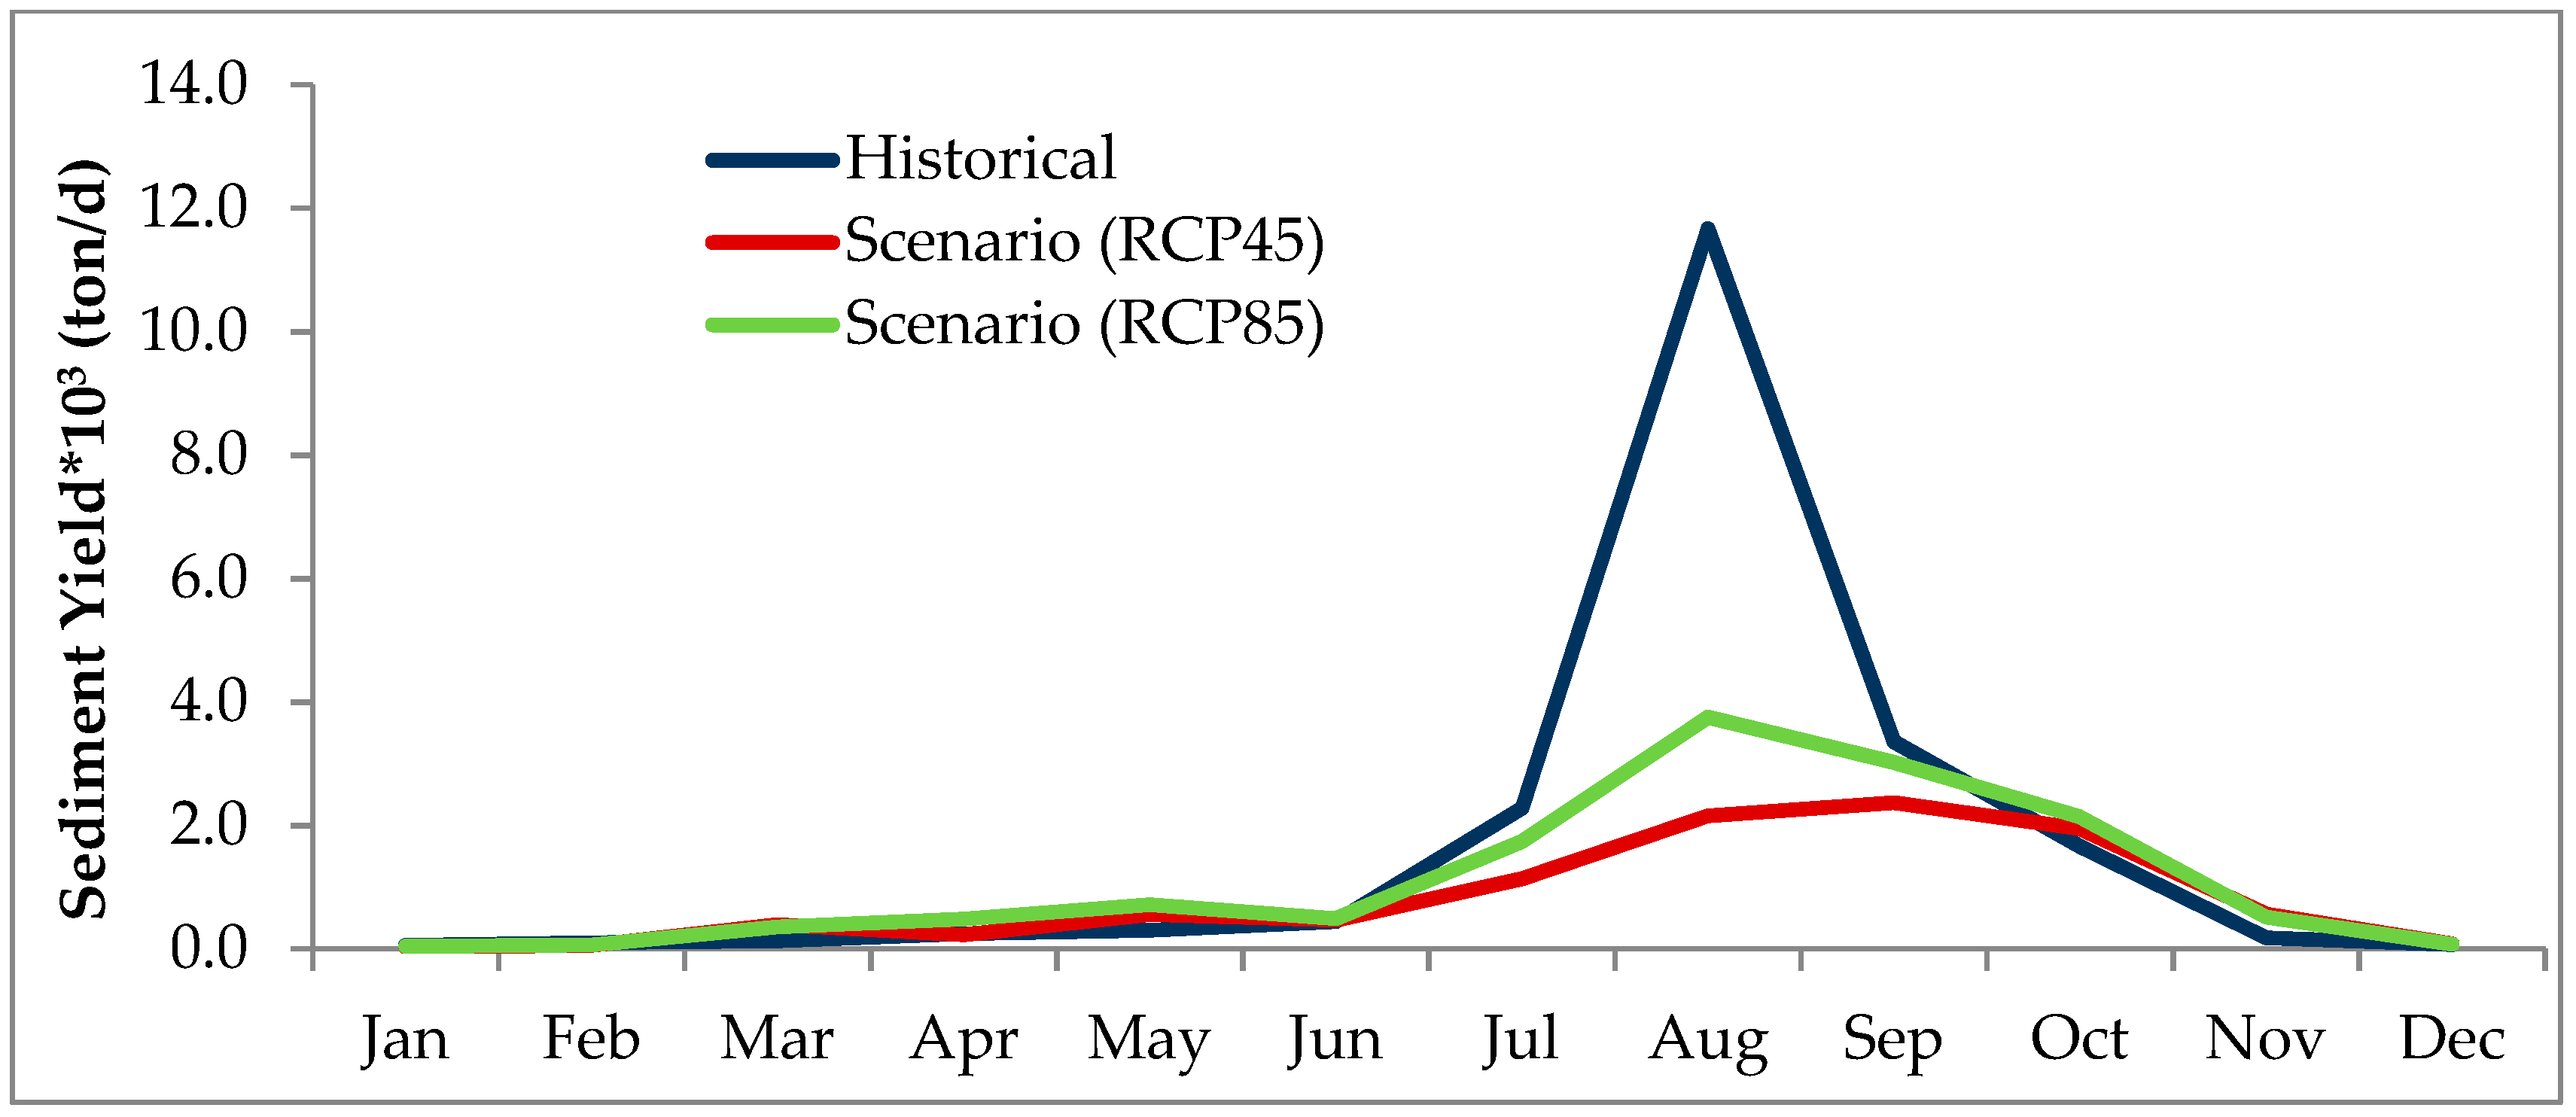
3.3. Effect of Climate Change on Lake Sedimentation

The average annual sediment yield contributions to Lake Ziway were 431.05 ton/km2 and 322.82 ton/km2 for the Meki and Ketar rivers, respectively, in the historical period (1985–2010). The average annual sediment yield showed a decreasing pattern in the future climate scenario as compared to the historical period (Table 5). The average percentage decrease in sediment yield ranged from 11.3 under RCP8.5 for the Meki River to 51.5 under RCP4.5 for the Ketar River. This might be related to a decrease in streamflow in the future scenario period (2041–2070), which in turn was related to a decrease in the precipitation amount. The projected climate data outputs from the ensemble mean of regional climate models (RCMs) in our study show that precipitation will decrease, while the minimum and maximum temperature will increase, as described in Section 3.1. The increase in temperature is further associated with an increase in evapotranspiration. Thus, the combined effects of decrease in precipitation and increase in temperature in the future period might cause a reduction in streamflow. It has also been shown that there is a significant relationship between streamflow and sediment yield with a coefficient of determination (R2) of 0.9. Hence, the result implies that the reduction in sediment yield in the future period is associated with the reduction in streamflow, which is associated with different climate factors.
It has been revealed in a study conducted by Adem et al. [51] in the Upper Gilgel Abay of the Blue Nile Basin in Ethiopia that sediment yield was related to a change in climate variables and thus to streamflow. The variation in the values of sediment yield due to streamflow change that resulted from climate change has also been reported by many scholars [12,17,26,54,55]. In a similar study, average annual sediment loads generally decreased in response to climate change by 23.5% and 3.3% under RCP4.5 and RCP8.5, respectively in the mid-century (2046–2065) [15]. Li et al. [56] predicted the annual rate of decrease in water and sediment discharges mainly controlled by climate variability. Rodríguez-Blanco et al. [17] also showed that suspended sediment is generally expected to decrease in 2031–2060 by 11%, and in 2069–2098 by 8%, as compared to the baseline period (1981–2010). This was mainly due to decreased streamflow in response to climate change.
Figure 8 and Figure 9 depict that there will a decrease in the average monthly sediment yield for both rivers under both scenarios during the rainy season (July, August, and September) in the scenario period (2041–2070) as compared to the historical period (1985–2010).
The estimated sediment yield in ton/year was changed to volume basis using a reservoir trap efficiency [29] of 98% for Lake Ziway to estimate the volume change from sedimentation under climate change. Elevation–volume values developed from a bathymetric survey conducted by the Ministry of Water, Irrigation and Electricity in 2005/2006 was used to estimate the lake’s capacity. The average annual sediment volume entering Lake Ziway in the historical period (1985–2010) was 2.25 million cubic meters (MCM). The volume will be 1.38 MCM and 1.72 MCM in the scenario period (2041–2070) under RCP4.5 and RCP8.5, respectively. The results revealed that there would be a decrease in the rate of lake volume change by 38% and 23% under RCP4.5 and RCP8.5, respectively, due to sedimentation under changing climatic conditions in the scenario period (2041–2070) as compared to the historical period (1985–2010).

4. Conclusions

This paper investigated the effect of climate change on sediment yield contribution to volume change of Lake Ziway in the Central Rift Valley Basin (Ethiopia). Regional climate models (RCMs) in CORDEX-Africa were applied for this investigation. The five RCMs with driving model ICHEC-EC-EARTH under CORDEX-Africa that were used for this study were CCLM4-8-17, HIRHAM5, RACMO22T, RCA4, and REMO2009. The study reveals that there will be a decrease in the precipitation values for all of the grid points in the scenario period (2041–2070) as compared to the historical period (1985–2010) under RCP4.5. However, it showed an increasing trend for some grid points and decreasing trend for others under RCP8.5. The results show that the maximum and minimum temperature will increase under both scenarios, RCP4.5 and RCP8.5. The model response to climate change indicated a decrease in streamflow during the peak period in the scenario period (2044–2070) as compared to the historical period (1985–2010) under RCP4.5 and RCP8.5 emission scenarios. However, the trend will slightly increase during the off-peak period. The projected climate variables were used in the SWAT model to estimate the sediment yield contribution to Lake Ziway volume change. The performance of the SWAT model to predict sediment yield was in the satisfactory range. The results show that climate change will affect the sedimentation rate, so that the rate of annual volume change will be reduced by 38% and 23% under RCP4.5 and RCP8.5, respectively, in the scenario period (2041–2070) as compared to the historical period (1985–2010).
This study is the first approach to evaluate the effect of climate change on sediment yield in the Central Rift Valley Basin. The findings of this study indicate that the life expectancy of the lake will relatively increase under climate change. This may be helpful for planning and implementing sediment management strategies in the basin and similar areas. It also increases understanding of future implications of potential climate change impacts on sedimentation of Lake Ziway for effective management. Land use in this study was assumed to remain the same in the future. Hence, further research is recommended to study the combined effect of climate change and land use on sediment yield, which in turn affects the volume of Lake Ziway.

Author Contributions

All authors made substantial contribution to the development of this manuscript. T.G. was in charge of conceptualization, data analysis and writing of original draft. M.N., F.B. and B.M. reviewed, edited and improved the manuscript. All authors read and approved the final manuscript.

Funding

This research was funded by African Union under Pan African University Project.

Acknowledgments

The authors are grateful to Ministry of Water, Irrigation, and Electricity (MWIE), National Meteorological Service Agency (NMSA), Rift Valley Lakes Basin Authority, Oromia Water, Minerals and Energy Office, and Oromia Water Works Design and Supervision Enterprise for providing relevant data.

Conflicts of Interest

The authors declare no conflict of interest.

References

  1. Samad, N.; Chauhdry, M.H.; Ashraf, M.; Saleem, M.; Hamid, Q.; Babar, U.; Tariq, H.; Farid, M.S. Sediment yield assessment and identification of check dam sites for Rawal Dam catchment. Arabian J. Geosci. 2016, 9, 466. [Google Scholar] [CrossRef]
  2. Duru, U. Modeling Sediment Yield and Deposition Using the SWAT Model: A Case Study of Cubuk I And Cubuk II Reservoirs, Turkey. Ph.D. Thesis, Colorado State University, Fort Collins, CO, USA, 2015. [Google Scholar]
  3. Williams, J.R. Sediment Routing for Agricultural Watersheds. Water Resour. Bull. 1975, 11, 965–974. [Google Scholar] [CrossRef]
  4. Wuttichaikitcharoen, P.; Babel, M.S. Principal Component and Multiple Regression Analyses for the Estimation of Suspended Sediment Yield in Ungauged Basins of Northern Thailand. Water 2014, 6, 2412–2435. [Google Scholar] [CrossRef] [Green Version]
  5. Zhang, Z.; Sheng, L.; Yang, L.; Chen, X.; Kong, L.; Wagan, B. Effects of Land Use and Slope Gradient on Soil Erosion in a Red Soil Hilly Watershed of Southern China. Sustainability 2015, 7, 14309–14325. [Google Scholar] [CrossRef] [Green Version]
  6. Da Silva, V.; Silva, M.; De Souza, E. Influence of land use change on sediment yield: A case study of the sub-middle of the São Francisco river basin. J. Braz. Assoc. Agric. Eng. 2016, 36, 1005–1010. [Google Scholar] [CrossRef]
  7. Belete, M.D. The Impact of Sedimentation and Climate Variability on the Hydrological Status of Lake Hawassa, South Ethiopia. Ph.D. Thesis, Universität Bonn, Bonn, Germany, 2013. [Google Scholar]
  8. Kasei, R.A. Modelling Impacts of Climate Change on Water Resources in the Volta Basin, West Africa. Ph.D. Thesis, Rheinischen Friedrich-Wilhelms-Universität Bonn, Bonn, Germany, 2009. [Google Scholar]
  9. Seyoum, T.; Koch, M. SWAT—Hydrologic Modeling and Simulation of Inflow to Cascade Reservoirs of the Semi-Ungaged Omo-Gibe River Basin, Ethiopia. Available online: http://www.uni-kassel.de/fb14/geohydraulik/koch/paper/2013/Koblenz/Teshome/Gibe_Paper.pdf (accessed on 11 March 2018).
  10. Singh, D.; Gupta, R.D.; Jain, S.K. Assessment of impact of climate change on water resources in a hilly river basin. Arabian J. Geosci. 2015, 8, 10625–10646. [Google Scholar] [CrossRef]
  11. Chaemiso, S.E.; Abebe, A.; Pingale, S.M. Assessment of the impact of climate change on surface hydrological processes using SWAT: A case study of Omo-Gibe river basin, Ethiopia. Model. Earth Syst. Environ. 2016, 2, 205. [Google Scholar] [CrossRef]
  12. Shrestha, S.; Shrestha, M.; Babel, M.S. Modelling the potential impacts of climate change on hydrology and water resources in the Indrawati River Basin, Nepal. J. Environ. Earth Sci. 2016, 75, 280. [Google Scholar] [CrossRef]
  13. Alamou, E.A.; Obada, E.; Afouda, A. Assessment of Future Water Resources Availability under Climate Change Scenarios in the Mékrou Basin, Benin. J. Hydrol. 2017, 4, 51. [Google Scholar] [CrossRef]
  14. Peizhen, Z.; Molnar, P.; Downs, W.R. Increased sedimentation rates and grain sizes 2–4 Myr ago due to the influence of climate change on erosion rates. Nature 2001, 410, 891. [Google Scholar] [CrossRef] [PubMed]
  15. Cousino, L.K.; Becker, R.H.; Zmijewski, K.A. Modeling the effects of climate change on water, sediment and nutrient yields from the Maumee River watershed. J. Hydrol. Reg. Stud. 2015, 4, 762–775. [Google Scholar] [CrossRef]
  16. Bussi, G.; Dadson, S.J.; Prudhomme, C.; Whitehead, P.G. Modelling the future impacts of climate and land-use change on suspended sediment transport in the River Thames (UK). J. Hydrol. 2016, 542, 357–372. [Google Scholar] [CrossRef]
  17. Rodríguez-Blanco, M.L.; Arias, R.; Taboada-Castro, M.M.; Nunes, J.P.; Keizer, J.J.; Taboada-Castro, M.T. Potential Impact of Climate Change on Suspended Sediment Yield in NW Spain: A Case Study on the Corbeira Catchment. Water 2016, 8, 444. [Google Scholar] [CrossRef]
  18. Abera, F.F.; Asfaw, D.H.; Engida, A.N.; Melesse, A.M. Optimal Operation of Hydropower Reservoirs under Climate Change: The Case of Tekeze Reservoir, Eastern Nile. Water 2018, 10, 273. [Google Scholar] [CrossRef]
  19. Mulugeta, D.; Diekkrüger, B.; Roehrig, J. Characterization of Water Level Variability of the Main Ethiopian Rift Valley Lakes. J. Hydrol. 2015, 3, 1. [Google Scholar]
  20. Meshesha, D.T.; Tsunekawa, A.; Tsubo, M.; Haregeweyn, N. Spatial analysis and semi-quantitative modeling of specific sediment yield in six catchments of the central rift valley of Ethiopia. J. Food Agric. Environ. 2011, 9, 784–792. [Google Scholar]
  21. Amare, M.W. Assessment of Lake Ziway Water Balance. Master’s Thesis, Addis Ababa University, Addis Ababa, Ethiopia, 2008. [Google Scholar]
  22. Adeoguni, A.G.; Sule, B.F.; Salami, A.W. Simulation of Sediment Yield at the Upstream Watershed of Jebba Lake in Nigeria Using SWAT Model. Malays. J. Civil Eng. 2015, 27, 25–40. [Google Scholar]
  23. Palazon, L.; Navas, A. Modeling sediment sources and yields in a Pyrenean catchment draining to a large reservoir (Ésera River, Ebro Basin). J. Soils Sedim. 2014, 14, 1612–1625. [Google Scholar] [CrossRef] [Green Version]
  24. Ayana, A.B.; Edossa, D.C.; Kositsakulchai, E. Simulation of sediment yieldusing SWAT model in Fincha watershed, Ethiopia. Kasetsart J. (Nat. Sci.) 2012, 46, 283–297. [Google Scholar]
  25. Ayele, G.T.; Teshale, E.Z.; Yu, B.; Rutherfurd, I.D.; Jeong, J. Streamflow and Sediment Yield Prediction for Watershed Prioritization in the Upper Blue Nile River Basin, Ethiopia. Water 2017, 9, 782. [Google Scholar] [CrossRef]
  26. Azari, M.; Moradi, H.R.; Saghafian, B.; Faramarzi, M. Climate change impacts on streamflow and sediment yield in the North of Iran. Hydrol. Sci. J. 2016, 61, 1. [Google Scholar] [CrossRef]
  27. Halcrow, G. Rift Valley Lakes Basin Integrated Resources Development Master Plan Study Project; Draft Phase 2 Report; Ministry of Water Resource: Addis Ababa, Ethiopia, 2008. [Google Scholar]
  28. Meshesha, D.T.; Tsunekawa, A.; Tsubo, M. Continuing land degradation: Cause-effect in Ethiopia’s central rift valley. Land Degrad. Dev. 2010, 23, 130–143. [Google Scholar] [CrossRef]
  29. Brands, S.; Herrera, S.; Fernández, J.; Gutiérrez, J.M. How well do CMIP5 Earth System Models simulate present climate conditions in Europe and Africa? Clim. Dyn. 2013, 41, 803–817. [Google Scholar] [CrossRef] [Green Version]
  30. Trzaska, S.; Schnarr, E. A Review of Downscaling Methods for Climate Change Projections; United States Agency for International Development by Tetra Tech ARD: Washington, DC, USA, 2014; pp. 1–42. [Google Scholar]
  31. IPCC. Climate Change 2007: The physical science basis. In Contribution of Working Group I to the Fourth Assessment Report of the Intergovernmental Panel on Climate Change; Solomon, S., Qin, D., Manning, M., Chen, Z., Marquis, M., Averyt, K.B., Tignor, M., Miller, H.L., Eds.; Cambridge University Press: Cambridge, UK; New York, NY, USA, 2007. [Google Scholar]
  32. Dosio, A.; Panitz, H.J. Climate change projections for CORDEX-Africa with COSMO-CLM regional climate model and differences with the driving global climate models. Clim. Dyn. 2016, 46, 1599–1625. [Google Scholar] [CrossRef]
  33. Haile, A.T.; Rientjes, T. Evaluation of regional climate model simulations of rainfall over the Upper Blue Nile basin. Atmos. Res. 2015, 161–162, 57–64. [Google Scholar]
  34. Teutschbein, C.; Seibert, J. Bias correction of regional climate model simulations for hydrological climate-change impact studies: Review and evaluation of different methods. J. Hydrol. 2012, 456–457, 12–29. [Google Scholar] [CrossRef]
  35. Themeßl, M.J.; Gobiet, A.; Heinrich, G. Empirical-statistical downscaling and error correction of regional climate models and its impact on the climate change signal. Clim. Chang. 2012, 112, 449–468. [Google Scholar] [CrossRef]
  36. Lafon, T.; Dadson, S.; Buys, G.; Prudhomme, C. Bias correction of daily precipitation simulated by a regional climate model: A comparison of methods. Int. J. Climatol. 2013, 33, 1367–1381. [Google Scholar] [CrossRef]
  37. Fang, G.H.; Yang, J.; Chen, Y.N.; Zammit, C. Comparing bias correction methods in downscaling meteorological variables for a hydrologic impact study in an arid area in China. Hydrol. Earth Syst. Sci. 2015, 19, 2547–2559. [Google Scholar] [CrossRef] [Green Version]
  38. Gumindoga, W.; Rientjes, T.H.M.; Haile, A.T.; Makurira, H.; Reggiani, P. Bias correction schemes for CMORPH satellite rainfall estimates in the Zambezi River Basin. Hydrol. Earth Syst. Sci. Discuss. 2016. [Google Scholar] [CrossRef]
  39. Gadissa, T.; Nyadawa, M.; Behulu, F.; Mutua, B. Assessment of Catchment Water Resources Availability under Projected Climate Change Scenarios and Increased Demand in Central Rift Valley Basin. In Extreme Hydrology and Climate Variability: Monitoring, Modelling, Adaptation and Mitigation; Melesse, A.M., Abtew, W., Senay, G., Eds.; in press.
  40. Arnold, J.G.; Srinivasan, R.; Muttiah, R.S.; Williams, J.R. Large area hydrologic modeling and assessment part I: Model development. J. Am. Water Resour. Assoc. 1998, 34, 73–89. [Google Scholar] [CrossRef]
  41. Desta, H.; Lemma, B. SWAT based hydrological assessment and characterization of Lake Ziway sub-watersheds, Ethiopia. J. Hydrol. Reg. Stud. 2017, 13, 122–137. [Google Scholar] [CrossRef]
  42. Neitsch, S.L.; Arnold, J.G.; Kiniry, J.R.; Williams, J.R. Soil and Water Assessment Tool Theoretical Documentation Version 2009; Tech. Rep. No. 406; Texas Water Resources Institute: College Station, TX, USA, 2011. [Google Scholar]
  43. Abbaspour, K.C. SWAT-CUP: SWAT Calibration and Uncertainty Programs—A User Manual. Eawag: Swiss Federal Institute of Aquatic Science and Technology; SIAM: Duebendorf, Switzerland, 2015; 100p. [Google Scholar]
  44. Nash, J.E.; Sutcliff, J.V. River flow forecasting through conceptual models, part I. a discussion of principles. J. Hydrol. 1970, 10, 282–290. [Google Scholar] [CrossRef]
  45. Pereira, D.R.; Martinez, M.A.; Pruski, F.F.; da Silva, D.D. Hydrological simulation in a basin of typical tropical climate and soil using the SWAT model part I: Calibration and validation tests. J. Hydrol. Reg. Stud. 2016, 7, 14–37. [Google Scholar] [CrossRef]
  46. Brune, G.M. Trap Efficiency of Reservoirs. Trans. Am. Geophys. Union 1953, 34, 407–418. [Google Scholar] [CrossRef]
  47. Revel, N.M.; Ranasiri, L.P.; Rathnayake, R.M.; Pathirana, K.P. Estimation of Sediment Trap Efficiency in Reservoirs, An Experimental Study. Engineer 2015, 48, 43–49. [Google Scholar] [CrossRef]
  48. Mulu, A.; Dwarakish, G.S. Different Approach for Using Trap Efficiency for Estimation of Reservoir Sedimentation. An Overview. International Conference on Water Resources, Coastal and Ocean Engineering (Icwrcoe 2015). Aquat. Procedia 2015, 4, 847–852. [Google Scholar] [CrossRef]
  49. Lijalem, Z.A.; Roehrig, J.; Dilnesaw, A.C. Climate Change Impact on Lake Ziway Watershed Water Availability, Ethiopia. Available online: http://www.uni-siegen.de/zew/publikationen/volume0607/zeray.pdf (accessed on 10 May 2017).
  50. Zhou, B.; Wen, Q.H.; Xu, Y.; Song, L.; Zhang, X. Projected Changes in Temperature and Precipitation Extremes in China by the CMIP5 Multimodel Ensembles. J. Am. Meteorol. Soc. 2014, 27, 6591–6611. [Google Scholar] [CrossRef]
  51. Adem, A.A.; Tilahun, S.A.; Ayana, E.K.; Worqlul, A.W.; Assefa, T.T.; Dessu, S.B.; Melesse, A.M. Climate Change Impact on Sediment Yield in the Upper Gilgel Abay Catchment, Blue Nile Basin, Ethiopia. In Landscape Dynamics, Soils and Hydrological Processes in Varied Climates; Springer: Cham, Switzerland, 2015; pp. 615–644. [Google Scholar]
  52. Gathagu, J.N.; Mourad, K.A.; Sang, J. Effectiveness of Contour Farming and Filter Strips on Ecosystem Services. Water 2018, 10, 1312. [Google Scholar] [CrossRef]
  53. Licciardello, F.; Toscano, A.; Cirelli, G.L.; Consoli, S.; Barbagallo, S. Evaluation of Sediment Deposition in a Mediterranean Reservoir: Comparison of Long Term Bathymetric Measurements and SWAT Estimations. Land Degrad. Dev. 2017, 28, 566–578. [Google Scholar] [CrossRef]
  54. Azim, F.; Shakir, A.S.; Kanwal, A. Impact of climate change on sediment yield for Naran watershed, Pakistan. Int. J. Sedim. Res. 2016, 31, 212–219. [Google Scholar] [CrossRef]
  55. Kazimierski, L.D.; Irigoyen, M.; Re, M.; Menendez, A.N.; Spalletti, P.; Brea, J.D. Impact of Climate Change on sediment yield from the Upper Plata Basin. Int. J. River Basin Manag. 2013, 11, 411–421. [Google Scholar] [CrossRef]
  56. Li, Z.; Xu, X.; Yu, B.; Xu, C.; Liu, M.; Wang, K. Quantifying the impacts of climate and human activities on water and sediment discharge in a karst region of southwest China. J. Hydrol. 2016, 542, 836–849. [Google Scholar] [CrossRef]
Figure 1. Location map of the study area with lakes, river networks, and grid points.
Hydrology 05 00067 g001
Figure 2. Scattered plot of sediment load vs. streamflow for (a) Meki River and (b) Ketar River.
Hydrology 05 00067 g002
Figure 3. Coordinated regional climate downscaling experiment (CORDEX) grid points and selected meteorological stations in the study area.
Hydrology 05 00067 g003
Figure 4. Sediment yield calibration for the Meki River.
Hydrology 05 00067 g004
Figure 5. Sediment yield calibration for the Ketar River.
Hydrology 05 00067 g005
Figure 6. Sediment yield validation for the Meki River.
Hydrology 05 00067 g006
Figure 7. Sediment yield validation for the Ketar River.
Hydrology 05 00067 g007
Figure 8. Sediment yield in the Meki River in the future scenario as compared to the historical period (1985–2010).
Hydrology 05 00067 g008
Figure 9. Sediment yield in the Ketar River in the future scenario as compared to the historical period (1985–2010).
Hydrology 05 00067 g009
Table 1. Change in climate data in scenario period as compared to the historical period.
GridPrecipitation (%)Maximum TempMinimum Temp
RCP4.5RCP8.5RCP4.5RCP8.5RCP4.5RCP8.5
1−11.71−7.04+1.81+2.44+2.21+3.15
2−13.64−8.33+1.91+2.57+2.77+3.94
3−4.240.73+1.79+2.44+2.33+3.25
4−5.540.21+1.71+2.34+1.92+2.73
5−9.33−1.69+1.62+2.19+2.02+2.84
6−4.271.70+1.67+2.27+2.14+2.99
7−6.35−3.13+1.74+2.41+1.91+2.77
8−7.14−1.11+1.61+2.21+2.00+2.86
Aver.−7.78−2.33+1.73+2.36+2.16+3.07
Table 2. Sensitivity rank of hydrological parameters for model calibration.
Parameter NameDescriptionRankFitted Value
MekiKetarMekiKetar
R__CN2.mgtSCS runoff curve number11−0.220.21
V__ESCO.hruSoil evaporation compensation factor2100.370.67
V__GWQMN.gwThreshold depth of water in shallow aquifer394366.514237.00
V__EPCO.hruPlant uptake compensation factor4110.280.92
V__SLSUBBSN.hruAverage slope length526.4178.50
R__SOL_AWC(.).solSoil available water capacity680.43−0.13
V__SURLAG.bsnSurface runoff lag time764.2514.05
R__SOL_K(..).solSoil saturated hydraulic conductivity850.920.27
V__ALPHA_BF.gwBase flow alpha factor940.330.22
V__GW_DELAY.gwGroundwater delay103398.06208.54
V__CH_K2.rteEffective hydraulic conductivity in main channel117498.53454.88
Table 3. Parameters for sediment calibration and their ranks.
ParameterDescriptionFitted ValueRank
MekiKetarMekiKetar
SPCONLinear re-entrainment parameter for channel sediment routing0.000110.0001511
SPEXPExponential re-entrainment parameter1.487341.147534
CH_COV2Channel cover factor0.973510.965022
CH_ERODMOChannel erodibility factor1.018210.485043
Table 4. Model performance efficiency during calibration and validation periods.
Gauging StationNash–Sutcliffe Efficiency (ENS)Coefficient of Determination (R2)
CalibrationValidationCalibrationValidation
Meki0.560.520.540.50
Ketar0.530.490.510.49
Table 5. Sediment yield estimation.
RiverSediment Yield (ton/km2)Change (%)
HistoricalRCP45RCP85RCP4.5RCP8.5
Meki431.05322.82382.31−25.1−11.3
Ketar323.82157.06211.00−51.5−34.8

