1. Introduction
The most common water-related hazards in urban areas, which causes substantial damages to human lives, health and infrastructures are urban floods. Urban flooding is a serious issue and a challenge to the development of cities and their residents. Common reasons for urban flooding are lack of drainage facilities, inadequate openings, inadequate water storage, intense rainfall, encroachment and blocking in the drainage system and backwater effect at outfalls. Urban floods have adverse impacts on the urban infrastructures such as transportation, electricity, water supply and drainage. Moreover, it adversely affects the lives of residents. These lead to extreme damages and disorder in the serviceability of urban infrastructures as well as transportation [
1]. In recent years, more attention has been paid to consider the ability of urban drainage measures to reduce urban flood risks [
2,
3,
4]. Effective adaptation measures can be made only after the nature of the impact is well understood. For urban planning and disaster preparedness, a quantitative assessment of the increase of flood hazards is important [
5]. Urban cities are generally located in the flat areas in the middle or lower reaches of main rivers and much exposed to intensive floods. Urbanization in developing countries has been taken place in an unsustainable way, with a consequent degradation of the quality of life and the environment. It is essential to assess the impact of floods in urban areas and to prepare long-term plans for flood risk management through structural and non-structural countermeasures. This will assist policymakers to better understand the vulnerability of the urban regions under socio-economic and climatic changes because their contribution to the country’s economy is enormous. In this study, we discuss a specific ancient canal system and related floods in the Metro Colombo area which is in the heart of the commercial capital of Sri Lanka.
The study was carried out based on hydrological modelling, flood impact assessment and estimating the efficiency of flood mitigation countermeasures. The main objective of this study was to assess the extent of inundations and flood levels for design rainfalls within the Metro Colombo area to identify the vulnerable areas and residents. Flood inundation maps were developed for the design rainfalls of having return periods of 10-year, 25-year and 50-year. It was essential to have flood inundation maps for the Metro Colombo canal basin to decide on new developments and flood mitigation/protection activities. The structural countermeasures to reduce the floods can be identified using the flood inundation maps. Also, the objective of this study extended to check the effectiveness of selected countermeasures which could be introduced to the canal system to mitigate floods. The feasibility of different countermeasures was assessed based on the reduction in inundation area and their impacts on the residents of seven Divisional Secretary’s Divisions (DSDs).
To achieve these objectives, the entire canal system of the Metro Colombo area was modelled using MIKE11, MIKE21 and MIKE FLOOD models. The Digital Elevation Model (DEM) of the 30 m grid was introduced to MIKE21 as a two-dimensional domain. The DEM used in the study was a specially produced DEM, after a Lidar survey which was carried out covering the Metro Colombo area in 2011. Its horizontal accuracy was 1.0 m and the vertical accuracy was in the range of 0.15 m to 0.20 m. MIKE11 and MIKE21 models were coupled using MIKE FLOOD by defining the links between channels and floodplains. Sea levels at the outlets to the Ocean and the Kelani River discharges were used as boundary conditions for the model.
2. Study Area
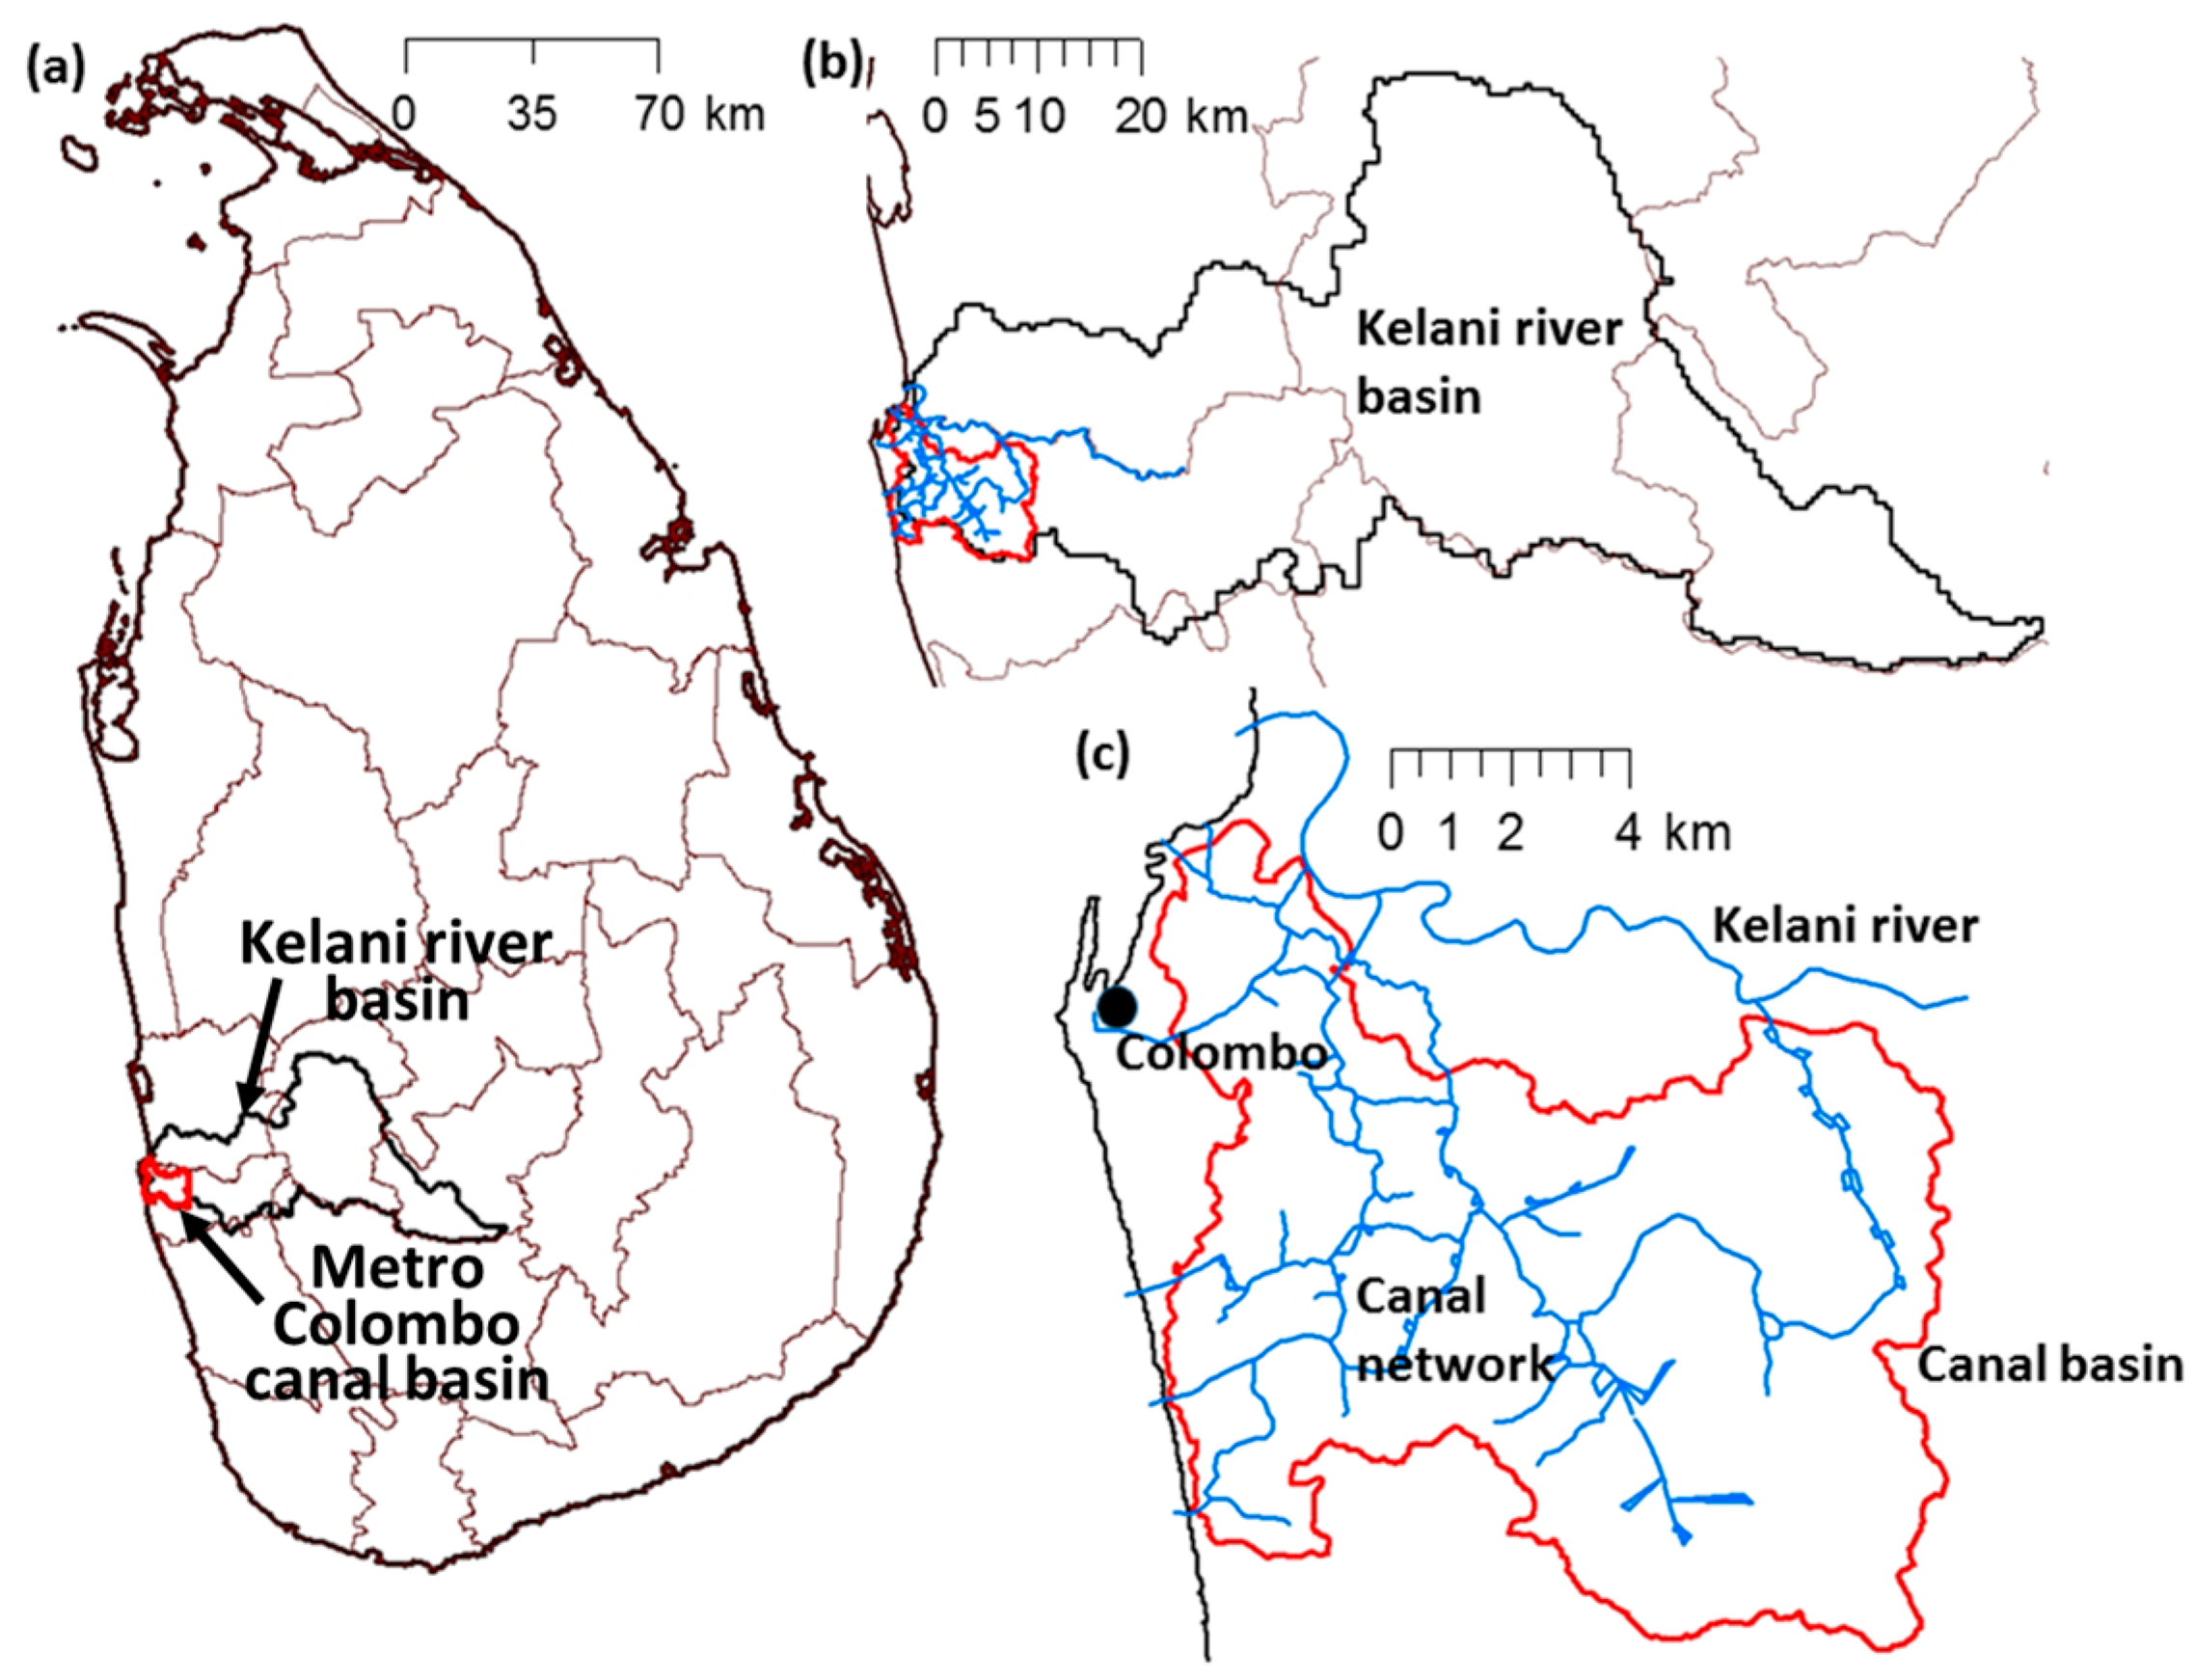
The Metro Colombo canal system is in the Colombo city, in the wet zone of Sri Lanka. Colombo city is a coastal city located in the western part of Sri Lanka and it is the commercial capital of the country. The Metro Colombo canal system connects to the Kelani River which is the fourth largest river in Sri Lanka. The Kelani River drains into the Indian Ocean through Colombo and it is a highly influential river in Sri Lanka due to its economic and social importance.
Figure 1 depicts the locations of the Colombo city, Kelani River basin and the Metro Colombo canal system. The Colombo district has a population of 2.3 million within 699 km
2 of area. It has a high population density of 3400 people/km
2 as of 2012 [
6]. The Colombo city area is subjected to frequent floods during the south-west monsoon when it coincides with localized depressions.
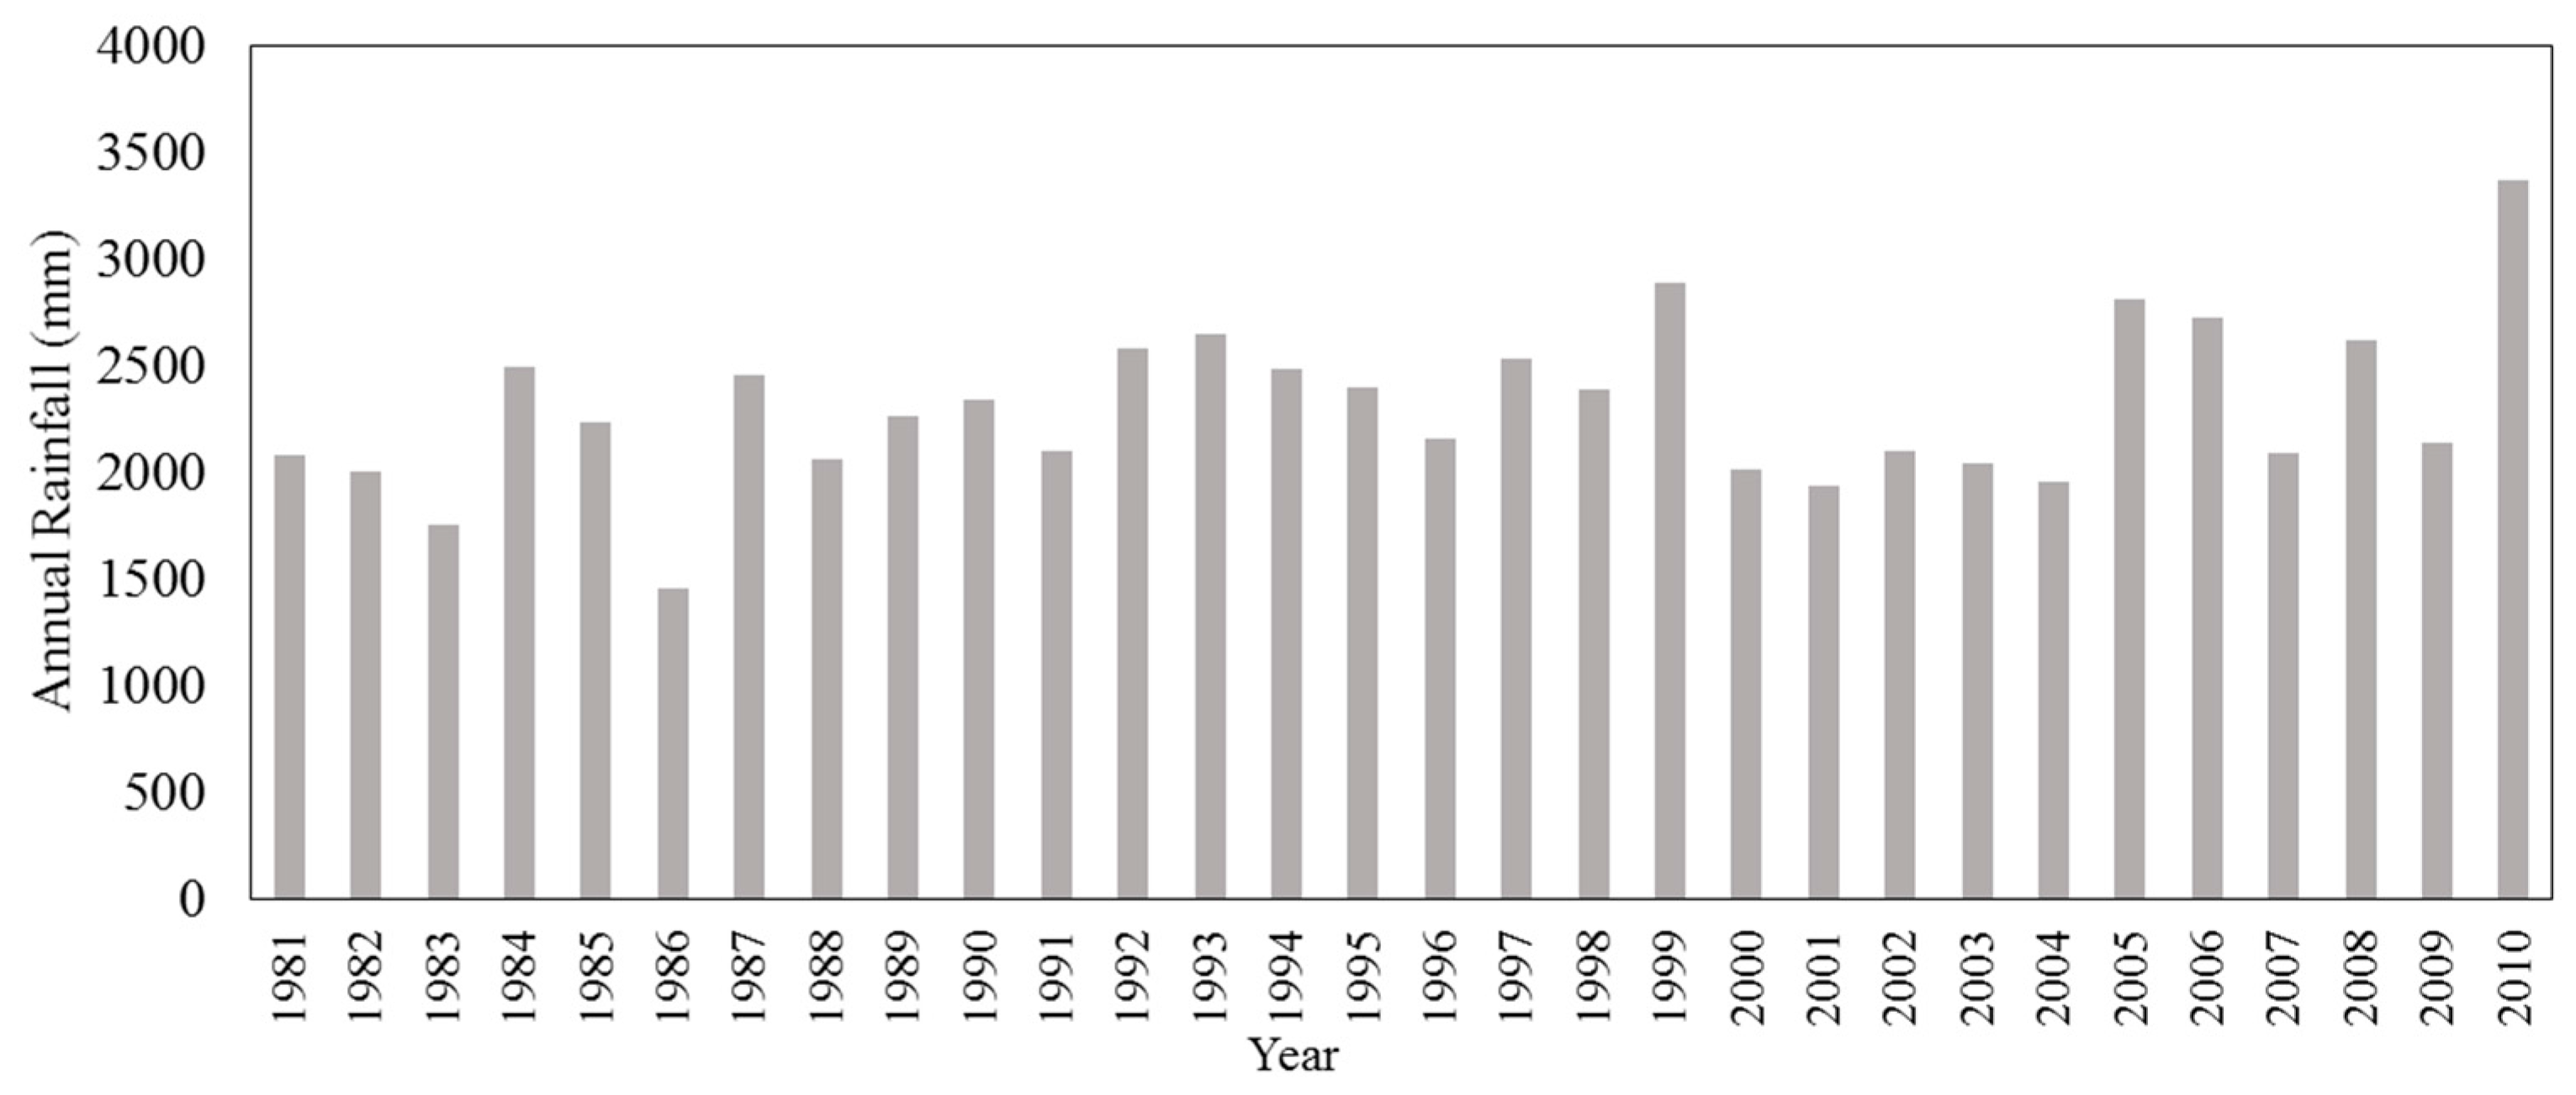
Figure 2 illustrates the annual rainfall in Colombo for 30 years from 1981 to 2010. An increment in the annual rainfall was identified for 30 years from 1981 to 2010. For each 10-year period, 1981–1990, 1991–2000 and 2001 to 2010 the yearly average rainfalls were 2113 mm, 2418 mm and 2377 mm respectively. Moreover, the maximum annual rainfalls were 2493 mm, 2888 mm and 3370 mm for each 10-year period. The increase in annual average rainfall and maximum annual rainfall indicate the vulnerability of the Colombo city to floods.
The history of the Metro Colombo canal system is mostly discussed from the time of King Veera Parakramabahu VII, who ruled Sri Lanka and established Kotte as the capital in the 15th-century. The Portuguese who ruled some parts of Sri Lanka from the 16th-century to the 17th-century improved the canal system for efficient transportation. The Dutch, who captured the island from the Portuguese, established Colombo as the capital and they enhanced the waterways systematically by adding structures and diversions in the 18th century. The British who ruled the island from the 18th-century to the 20th-century added several openings to the sea (for example, outfall at Wellawatta canal, Dehiwela canal) to control floods in the area [
7].
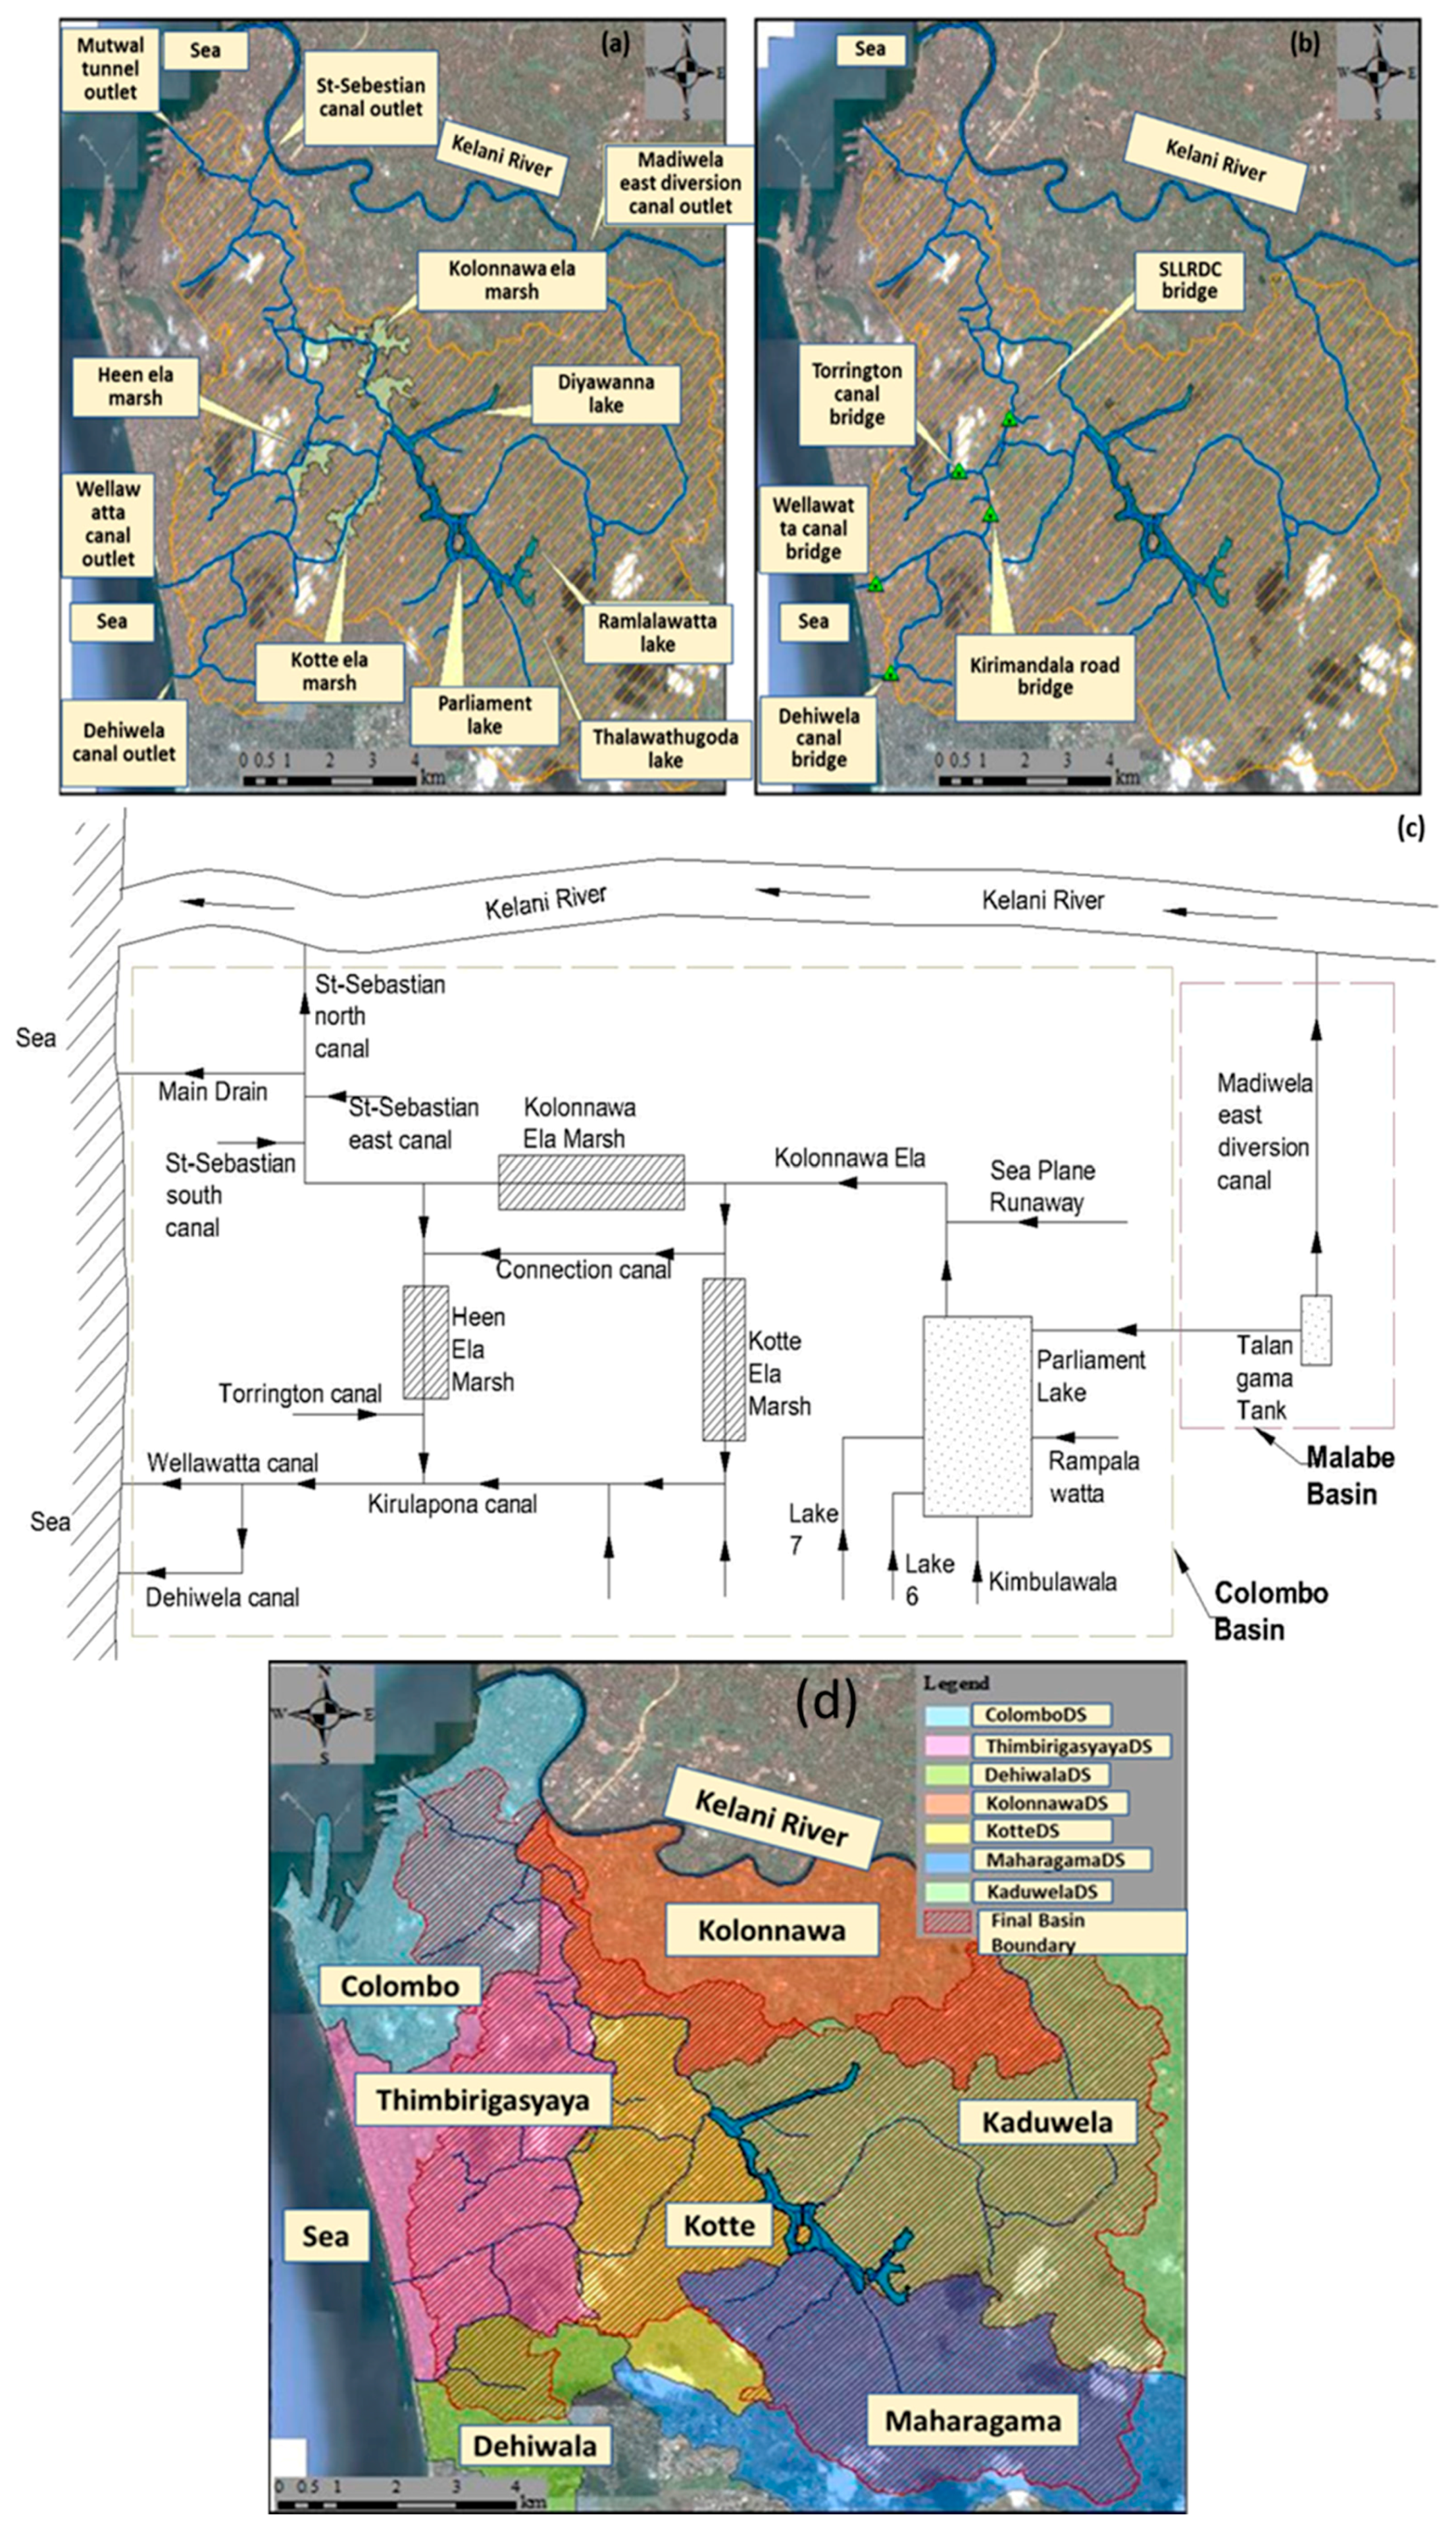
At present, the canal system acts as a passage to drain out flood water from the Metro Colombo area. The total length of it is 67 km. It has five main outfalls, among them three outlets—Dehiwela canal outlet, Wellawatta canal outlet and Mutwal tunnel outlet—drain the water into the Indian Ocean (
Figure 3a). The other two, named as St-Sebastian north canal outlet and Madiwela east diversion canal outlet discharge flood water into the Kelani River. The water level measuring points are depicted in
Figure 3b. The canal system has a zero-bed slope and the bed level of the canals is −1.0 m MSL (meters above Mean Sea Level).
Figure 3c shows the schematic diagram of the canal system. There are three main marshy lands acting as retention areas for floods which are named as Kotte Ela marsh, Heen Ela marsh and Kolonnawa Ela marsh. Also, there are few detention ponds and lakes in the upper catchment area which can store flood water such as; Parliament Lake, Diyawanna Lake, Thalawathugoda Lake, Rampalawatta Lake, etc. The Metro Colombo basin, which is in the mostly urbanized area of Colombo, has an extent of 105 km
2. It is spread over seven DSDs named as Colombo, Thimbirigasyaya, Dehiwela, Kolonnawa, Sri Jayawardanapura Kotte, Maharagama and Kaduwela (
Figure 3d).
The Metro Colombo area is subject to frequent floods during heavy rainfalls which causes economic losses and causalities. The situation is much worse when the water level of the Kelani River rises due to rainfall in the upper catchment. The geographical terrain of the Metro Colombo basin varies from 0 m MSL to 35 m MSL and a larger percentage of the basin sits below 3 m MSL. Therefore, it is difficult to have a proper gradient in the channel bed towards the outfalls to drain out the floods from the canal basin. Primary reasons for recent floods are increased surface runoff due to urbanization, diminishing of retention areas, growing trend for rainfall intensity and inadequate conveyance capacities of canals, structures and outfalls.
The Metro Colombo area has experienced severe floods in the recent past. On 14 May 2010 heavy monsoon rain caused floods in the area submerging roads and interrupting transportation. 94,000 people of about 15,000 families were affected due to the flood [
8]. Again, between 10 November and 11 of 2010, about 440 mm of rainfall fell within 14 h. Almost all of the social and commercial activities were interrupted. The most severe consequences include the submergence of Sri Lankan Parliament premises, the closure of schools in the city, 123,000 people of 26,850 affected families, and the damage of approximately 257 households can be highlighted as the primary impacts [
8]. Similar situations have occurred in 2014 and 2016 as well. Therefore, all the affected groups urged to study and understand the nature of floods in the Metro Colombo area.
3. Hydrological Modelling with MIKE FLOOD
3.1. Data Used for the Study
The catchment area of the Metro Colombo basin is 105 km
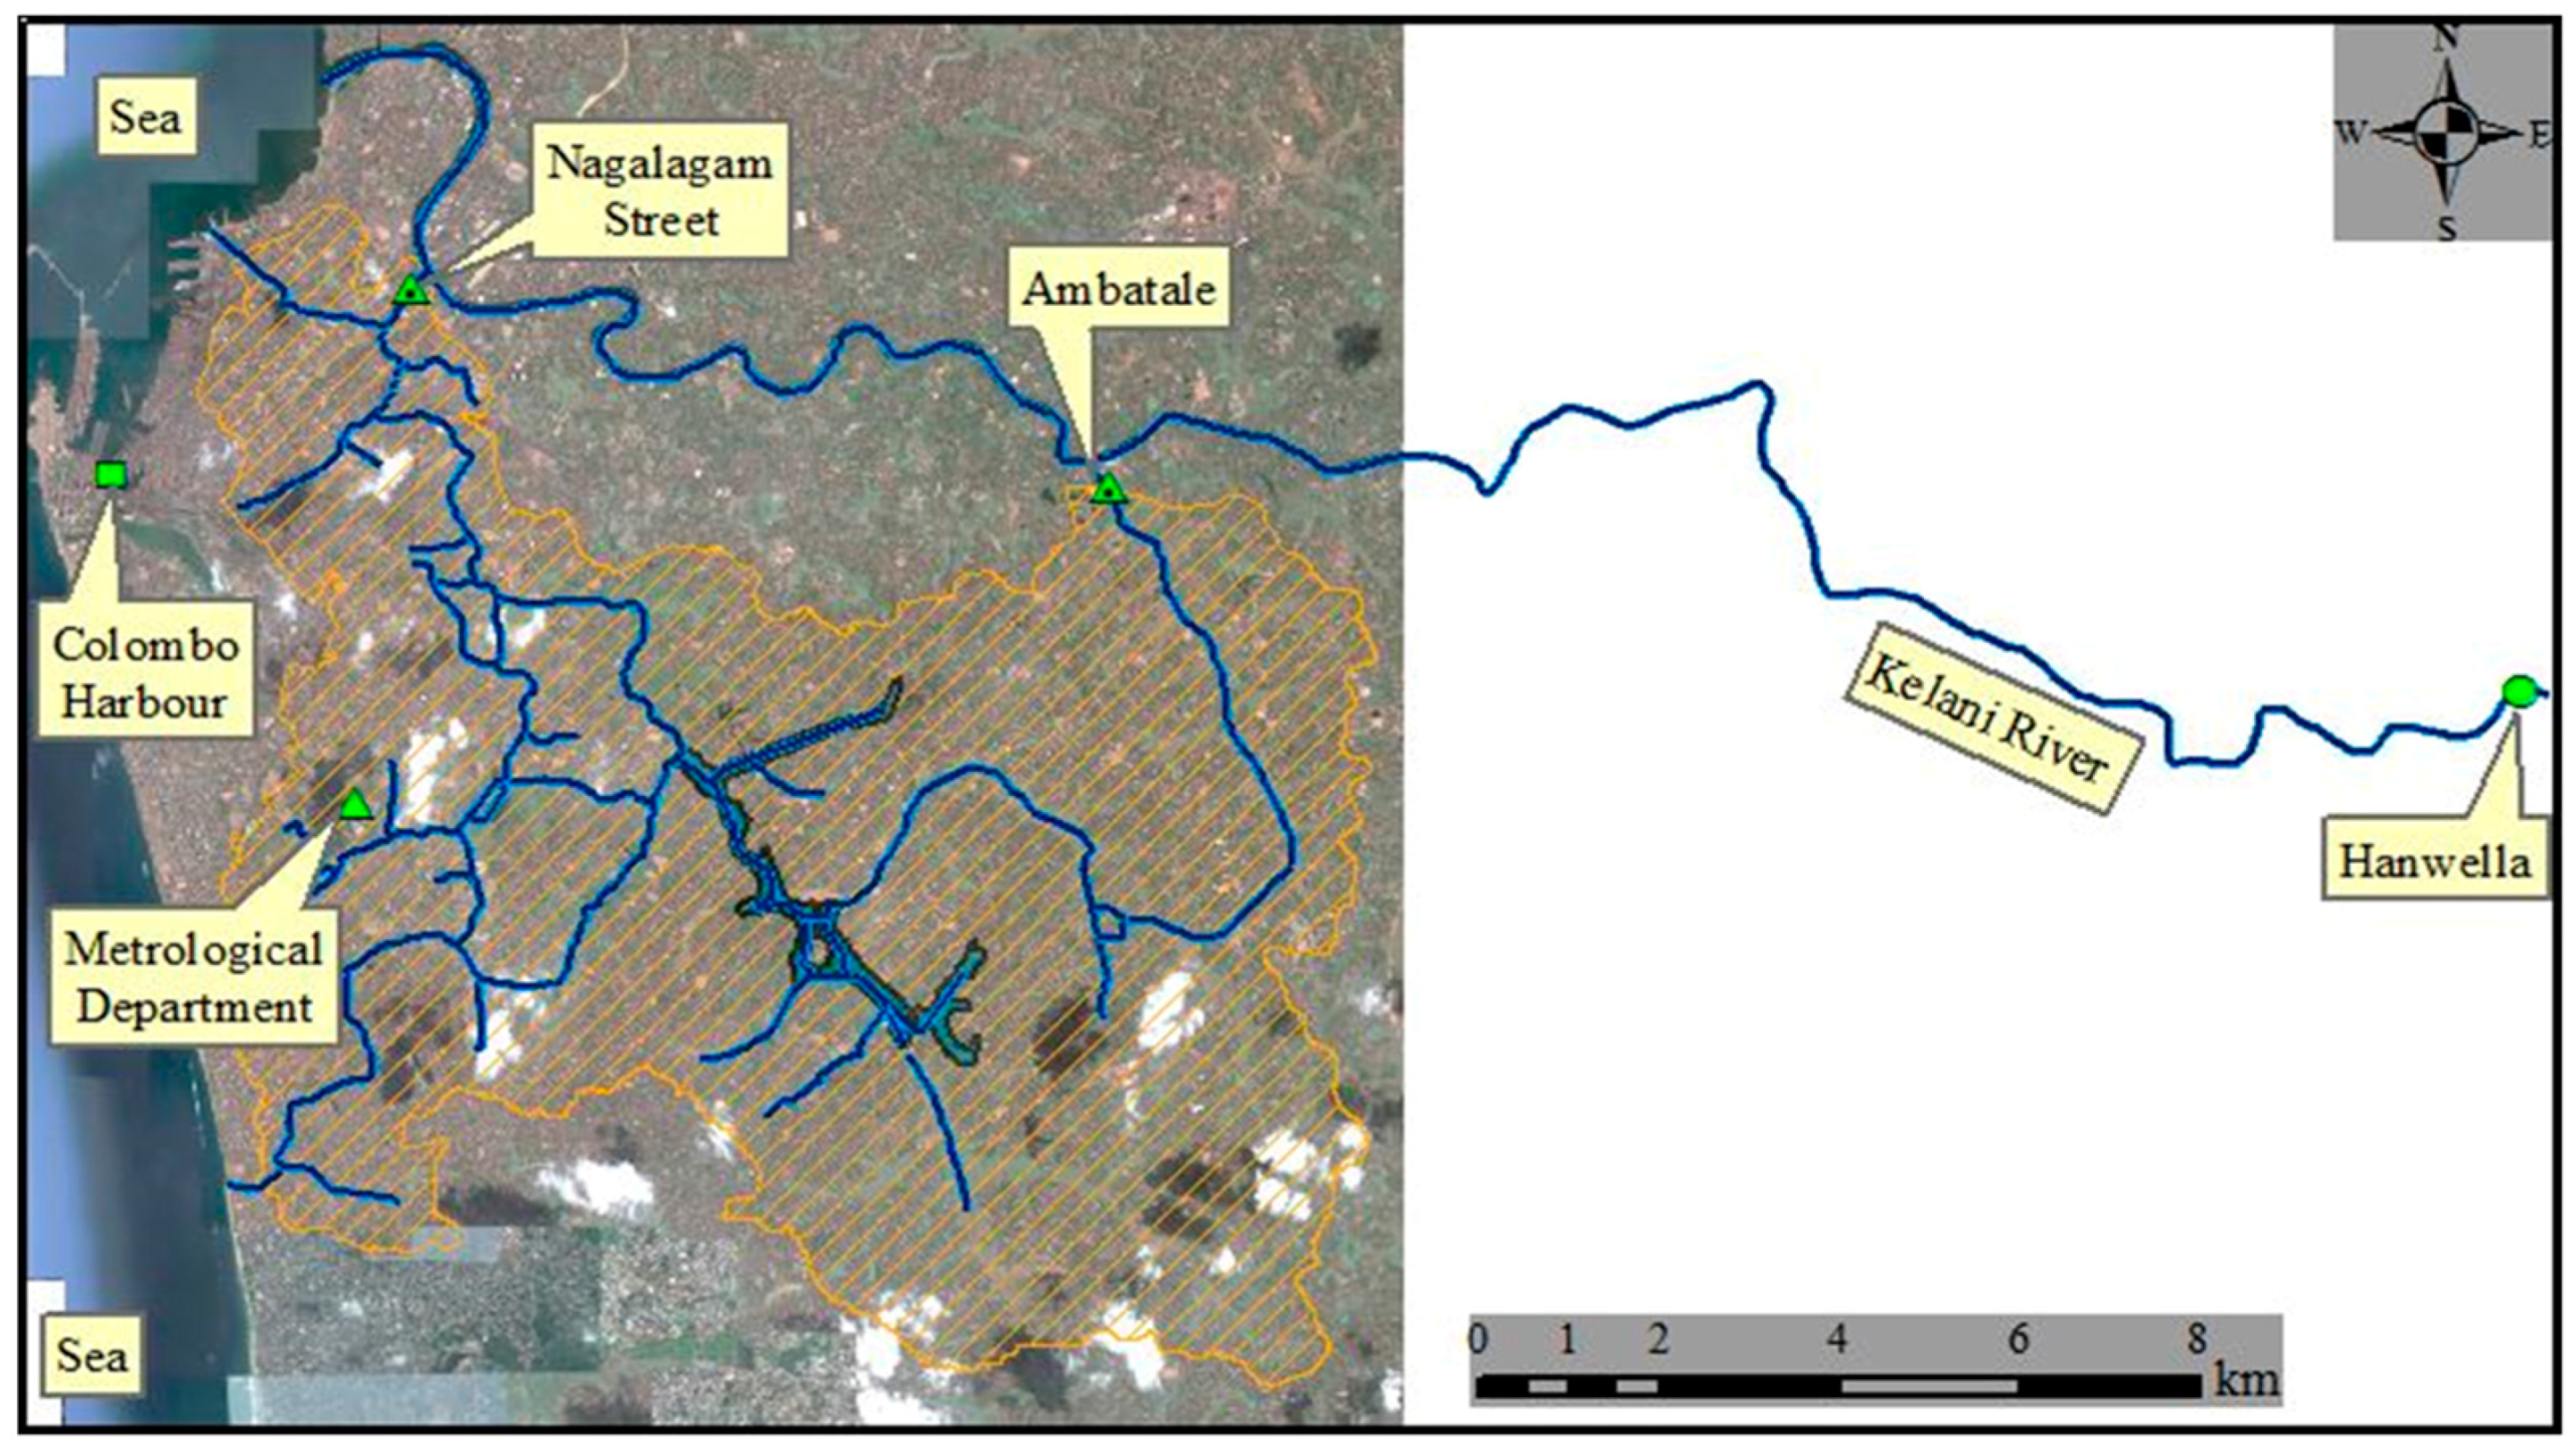
2 and there is only one rainfall gauging station located within the basin on the premises of the Metrological Department, Sri Lanka. The sea tide is measured at the gauging station located in the Colombo harbour. The flow discharge of Kelani River at Hanwella and the water levels at Nagalagam Street and Ambatale are measured by the Irrigation Department of Sri Lanka.
Figure 4 shows the locations of gauging stations where rainfall, sea tide and river discharge are measured. The rainfall data of 15 min is available at the gauging station which is maintained by the Department of Metrology, Sri Lanka. Water level data from five gauging stations which had continuous data were used for model calibration and validation in this study.
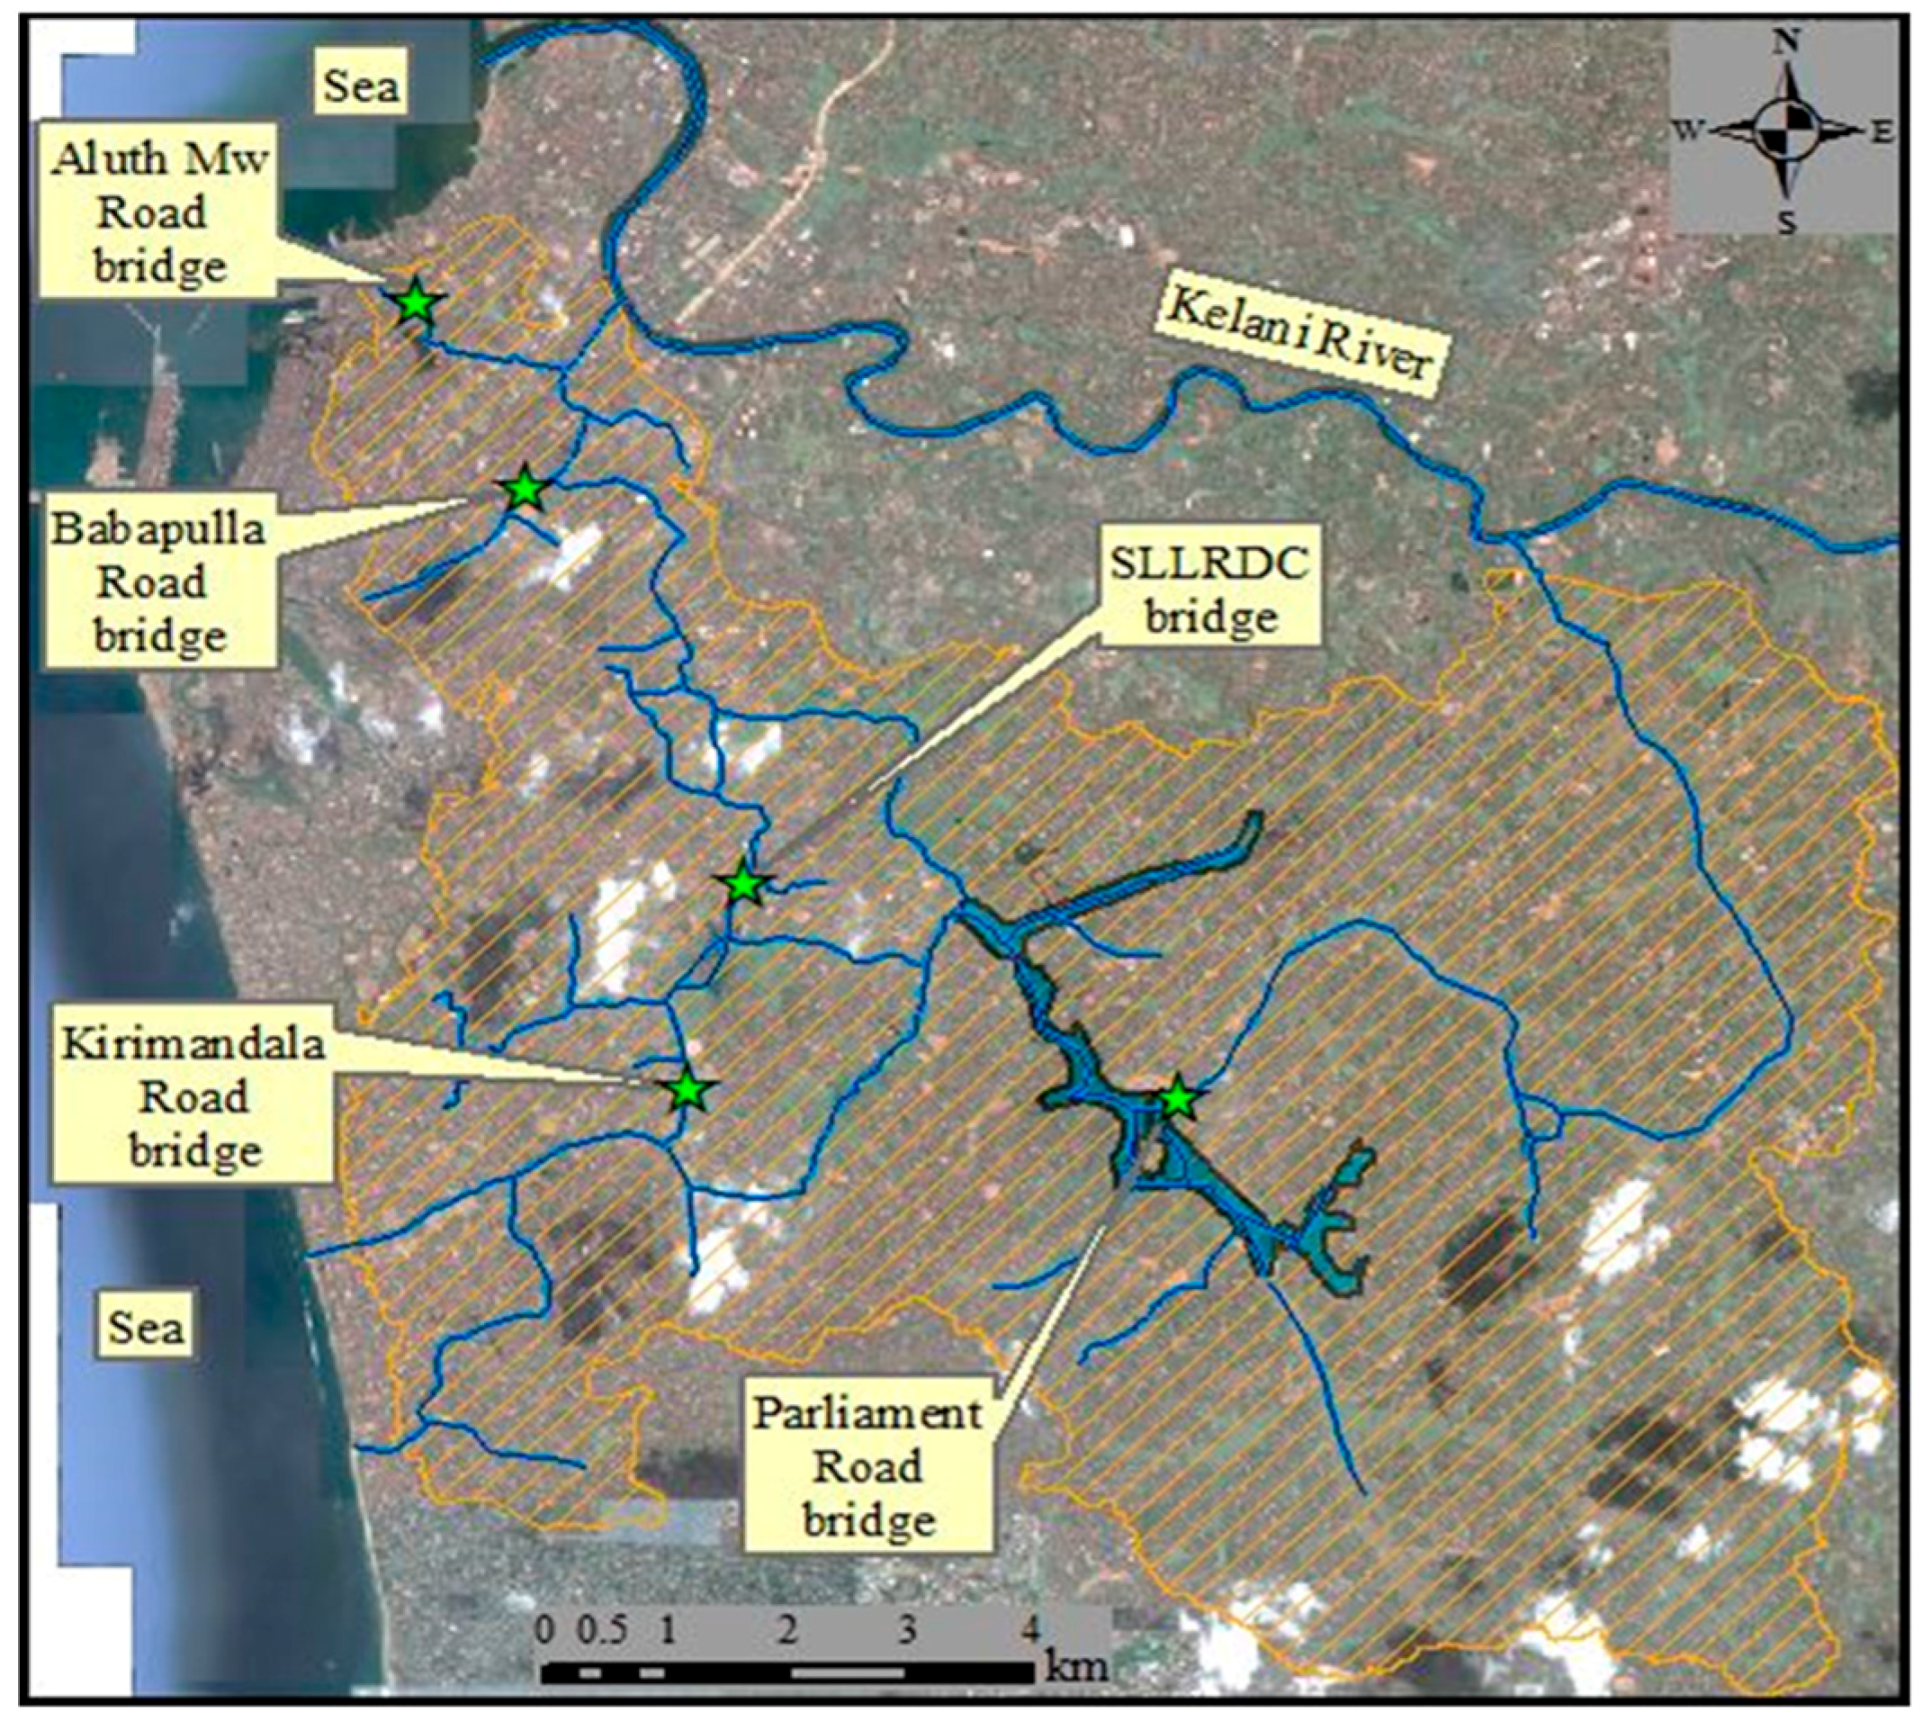
Figure 5 shows the locations of water level gauging stations. Design rainfalls for 5-year, 10-year, 25-year, 50-year and 100-year return periods were assessed using the records from the past 30 years (
Table 1). In the analysis of design rainfalls, Generalized Extreme Value (GEV) distribution was employed by fitting the annual maximum of observed rainfall.
3.2. MIKE Models
MIKE FLOOD is a hydrodynamic model, which consists of two sub-models: named as MIKE11and MIKE21 [
9]. MIKE FLOOD is the coupling model that links MIKE11 and MIKE21. The MIKE FLOOD model combines best features and strengths of both MIKE11 and MIKE21 while minimizing the limitations of each model. The 1-D modelling tool, MIKE11 solves the one-dimensional form of the Saint-Venant equations along the channel [
10]. The two-dimensional model MIKE21 is based on the two-dimensional solution of the Saint-Venant equations along the floodplain. The MIKE21 flow model is a fully dynamic general numerical modelling system, used for the simulation of hydraulic and environmental phenomenon in coastal areas, bays, lakes, etc. The mass conservation equation and momentum conservation equation describe the flow and water level variation in the MIKE21 model [
11]. The MIKE11 model represents the conveyance along the channel while MIKE 21 exactly represents the 2D effects in out-of-bank flows in a floodplain. The model allows dynamic exchange internally in both directions between the 1D channel and 2D floodplain flow components [
12].
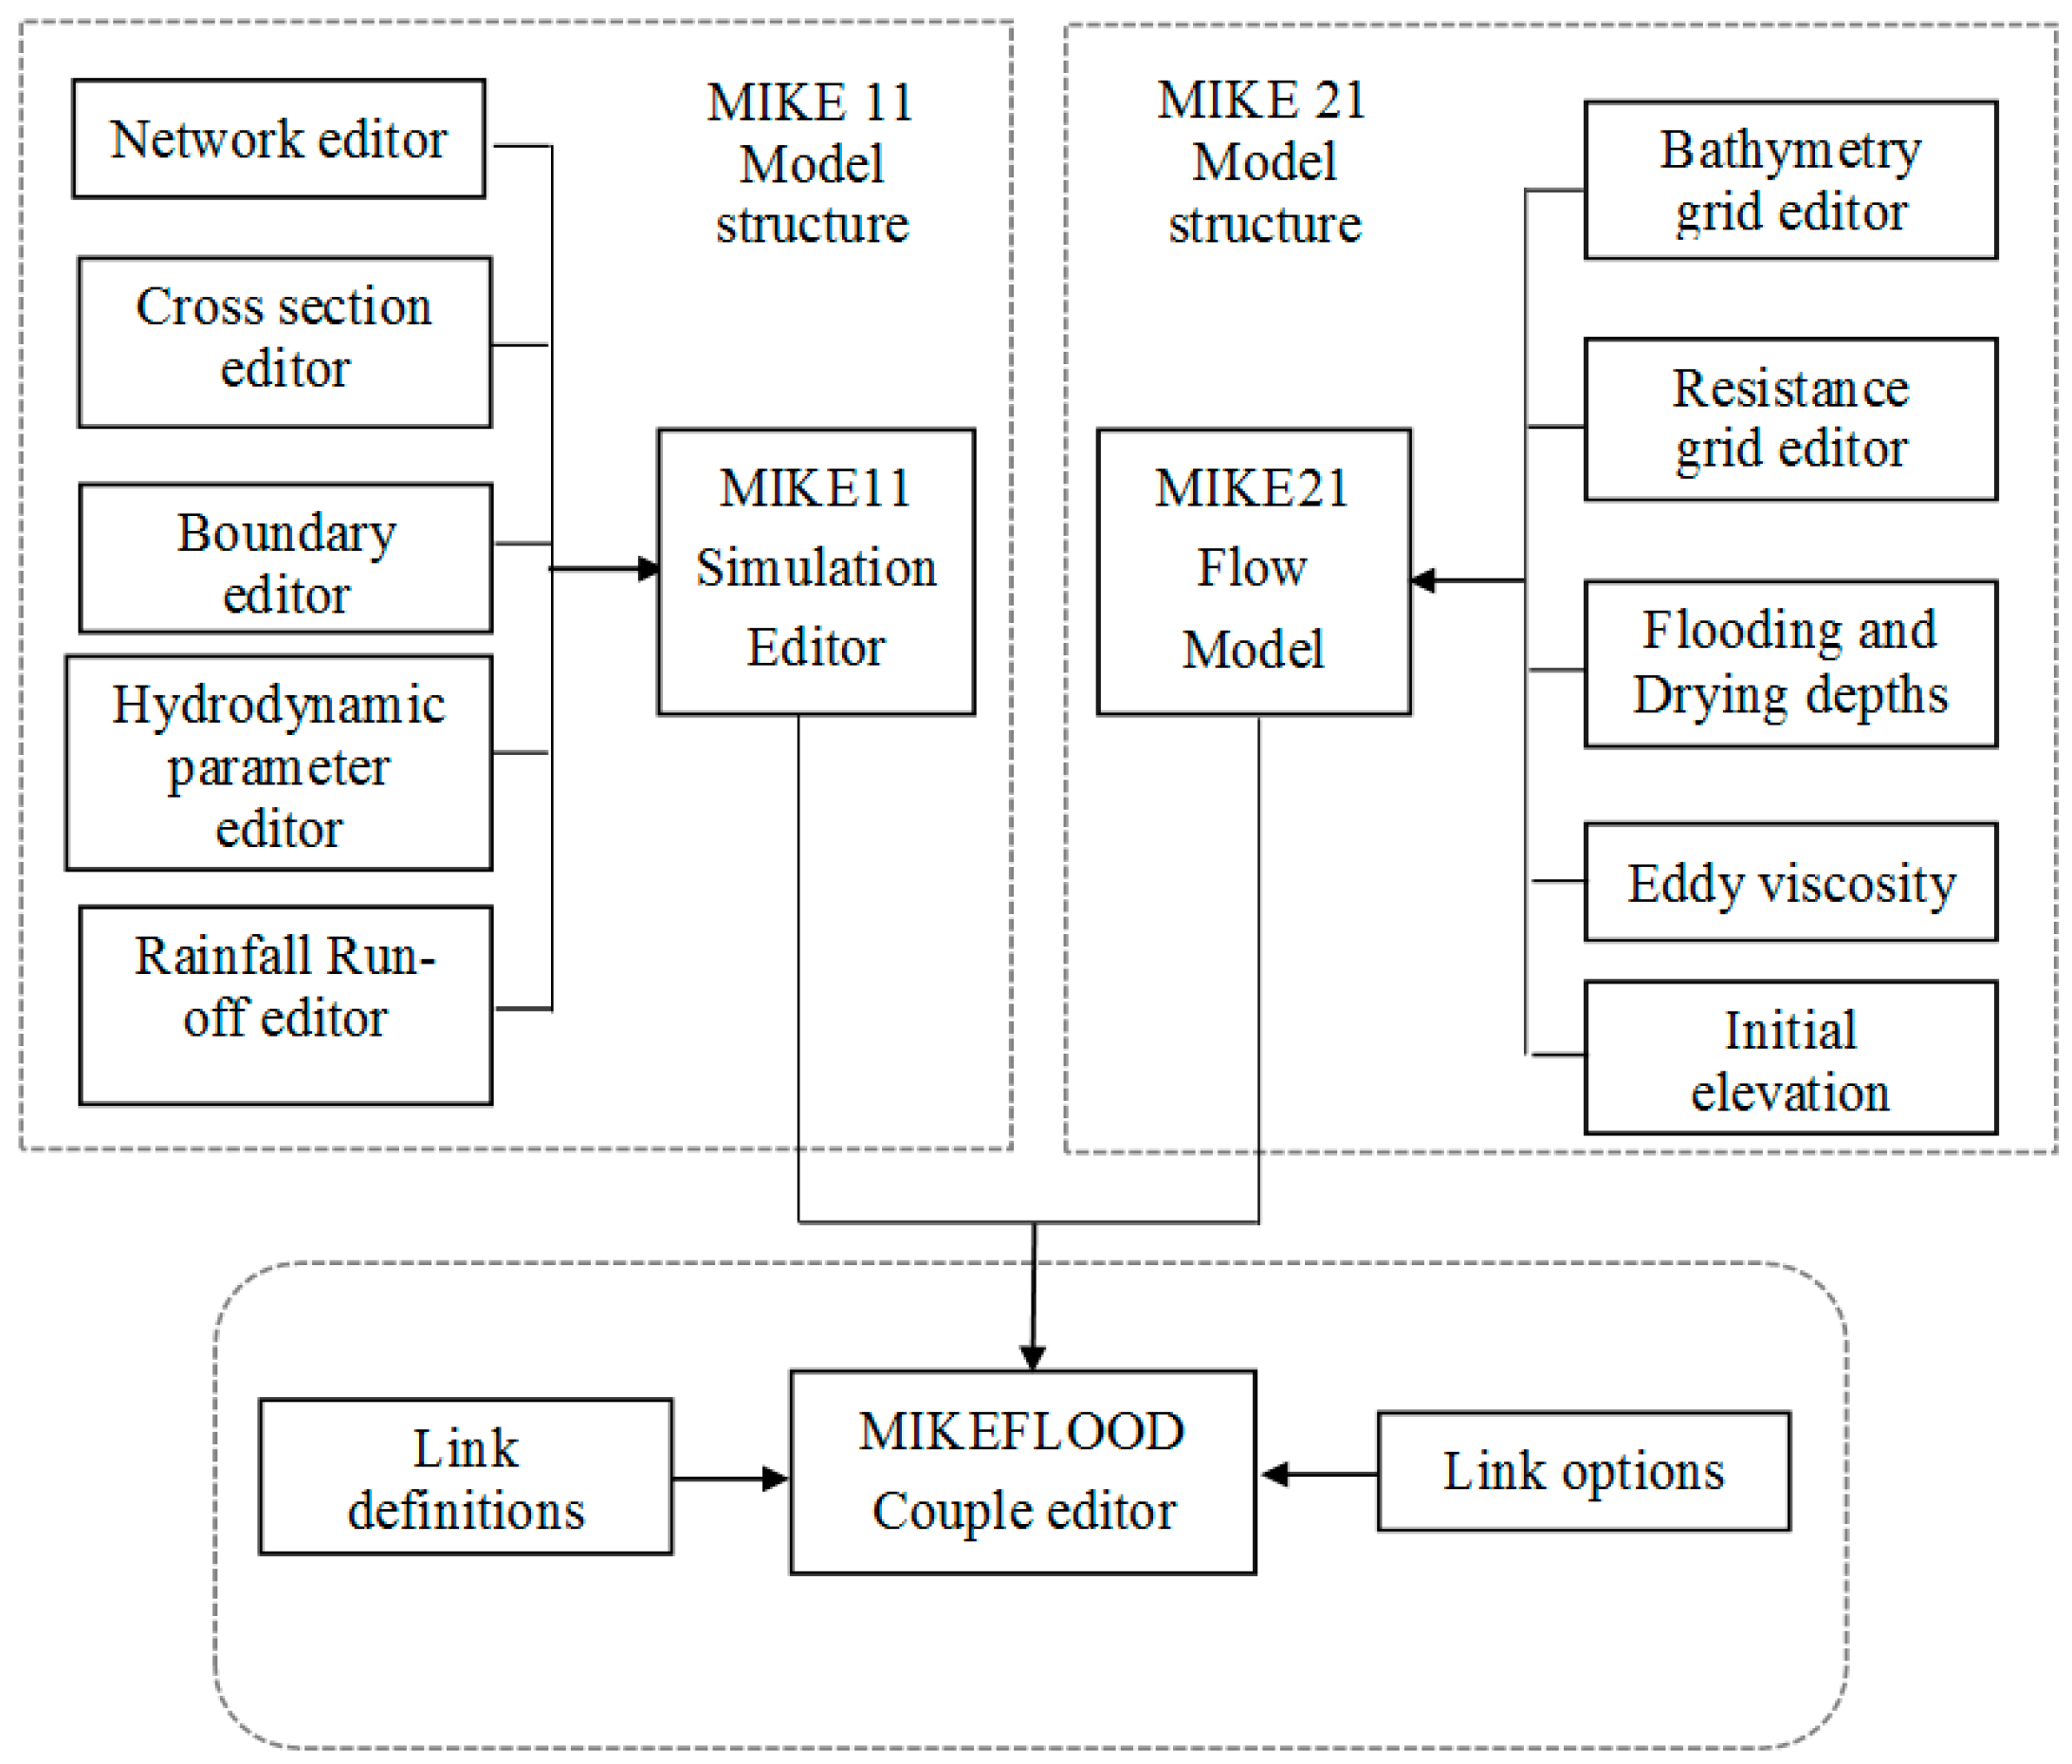
Figure 6 illustrates the coupling of MIKE11 and MIKE21 models. The MIKE model applies the fully dynamic descriptions and solves vertically integrated equations such as the continuity equation (conservation of mass) and momentum equation (Saint-Venant equations) as shown in Equations (1) and (2) respectively [
10].
where
Q = Discharge in m
3/s,
A = Wetted area in m
2,
x = Longitudinal distance in m,
t = Time in s,
h = Water depth in m,
g = Gravitational acceleration in m
2/s,
R = Hydraulic radius in m,
C = Chézy coefficient in m
½/s.
4. Methodology
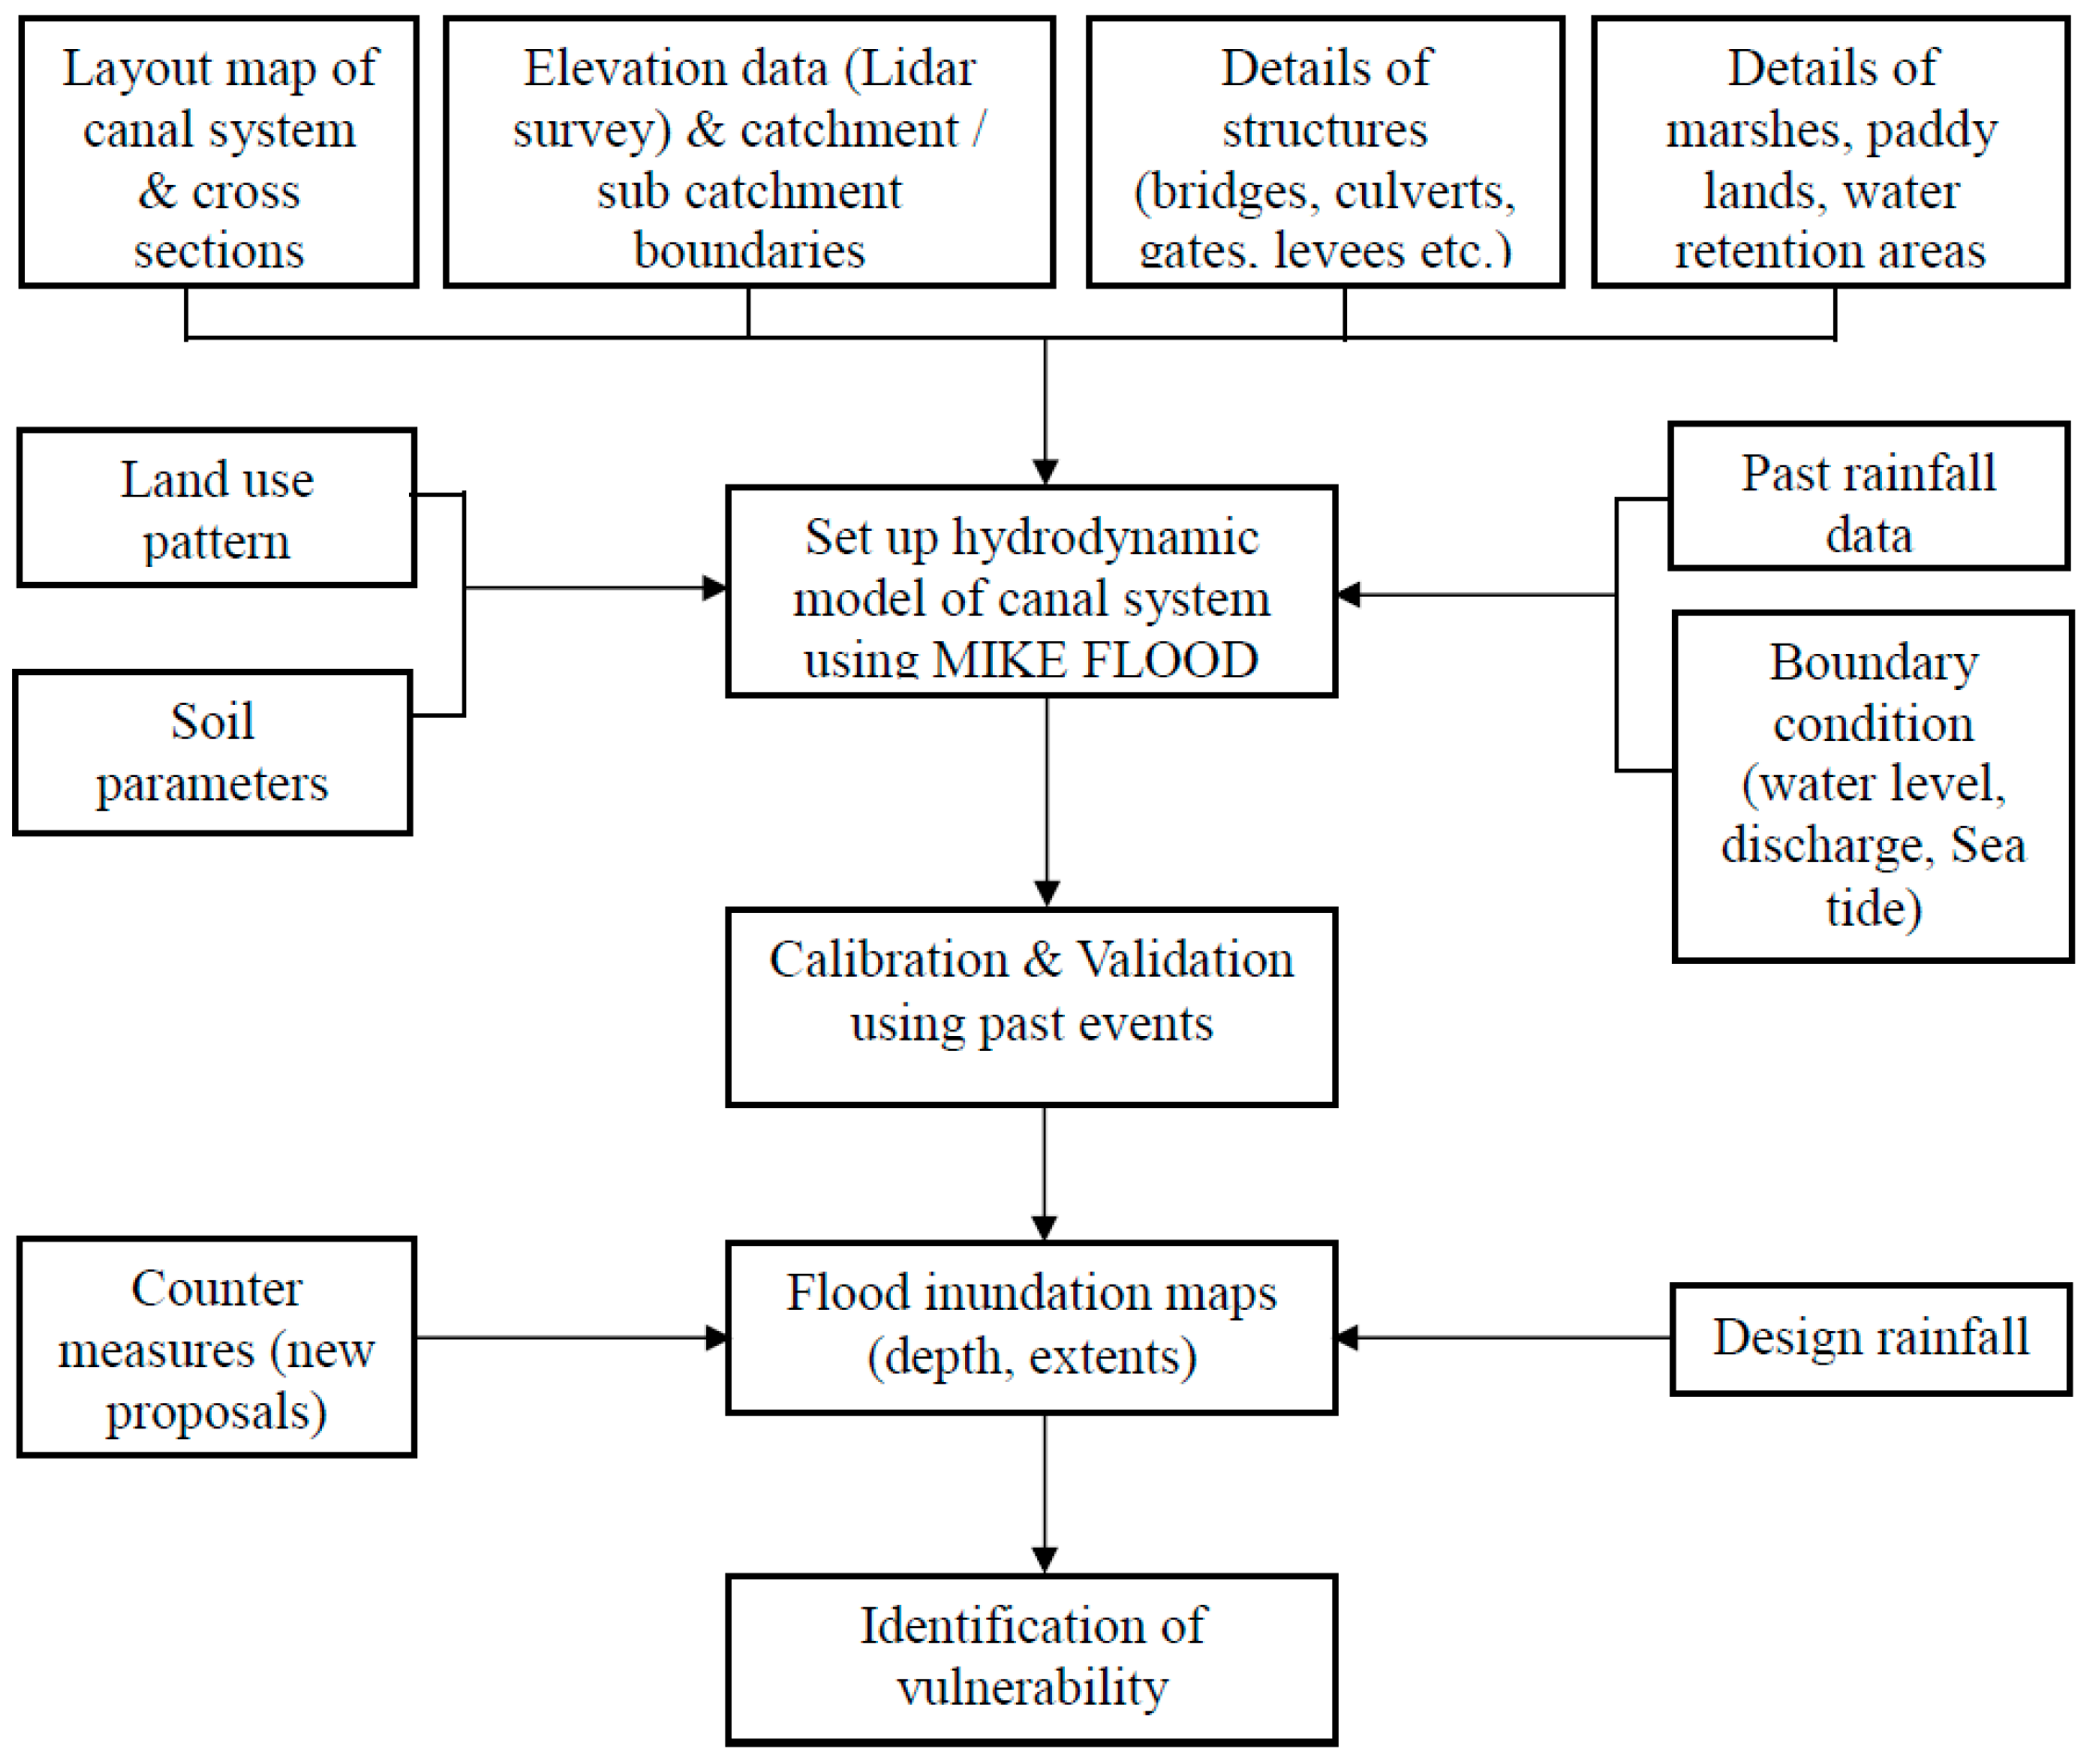
The main goal of this study was to develop flood inundation maps showing flooded areas and flood depths for several rainfall events within the Metro Colombo area. Also, to check the effectiveness of selected countermeasures which were proposed to be introduced to the canal system. To achieve these goals several steps were adopted.
Figure 7 systematically explains the steps followed in the study.
5. Results and Discussion
5.1. Model Calibration for the Flood Event in November 2010
The set-up model for the Metro Colombo basin was calibrated for the flood event in November 2010 considering the measured water levels. The Metro Colombo area experienced heavy rainfall of 440 mm within 14 h between 10 November and 11 of 2010. The maximum hourly rainfall of the event was 116 mm. A grid file of Manning numbers, M (inversely proportional to the Manning coefficient, n) in the range of 15–25 m
1/3/s were used for the resistance over the floodplain in the model. The model was calibrated considering the simulated water levels and observed water levels at five gauging stations along the canal system as shown in
Figure 5.
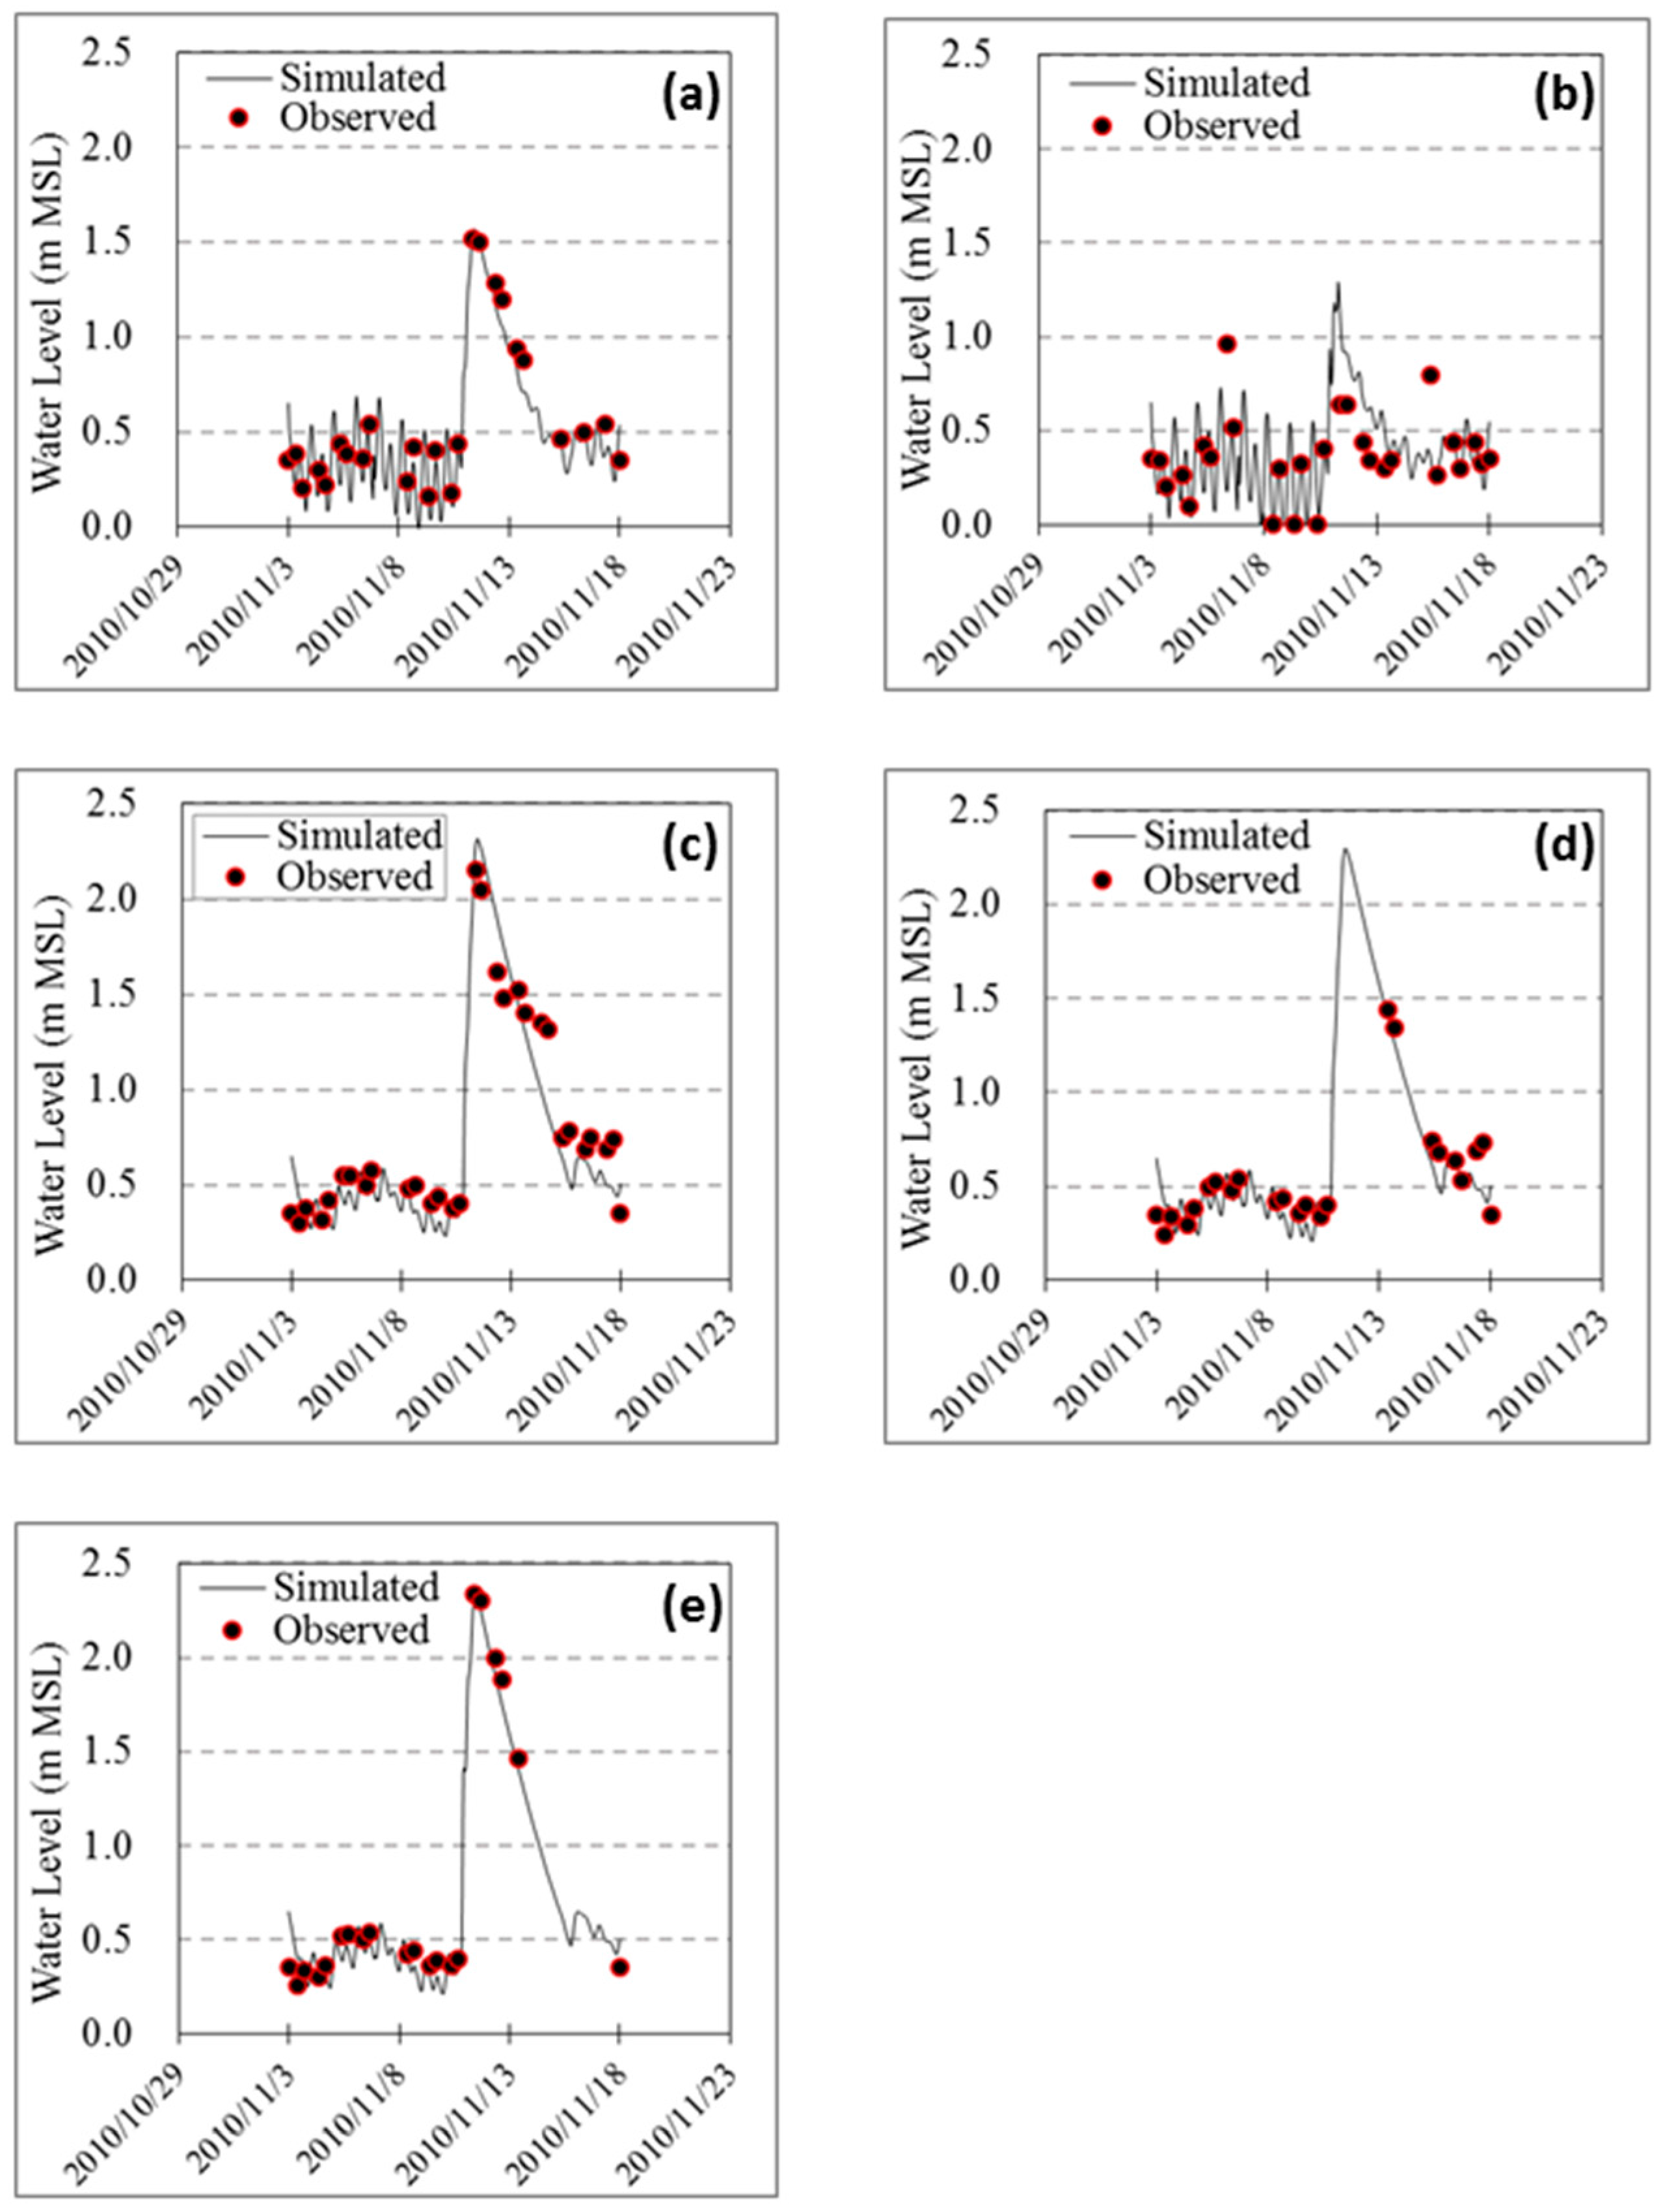
Figure 8 shows the calibration results of simulated and observed water levels at the five gauging locations.
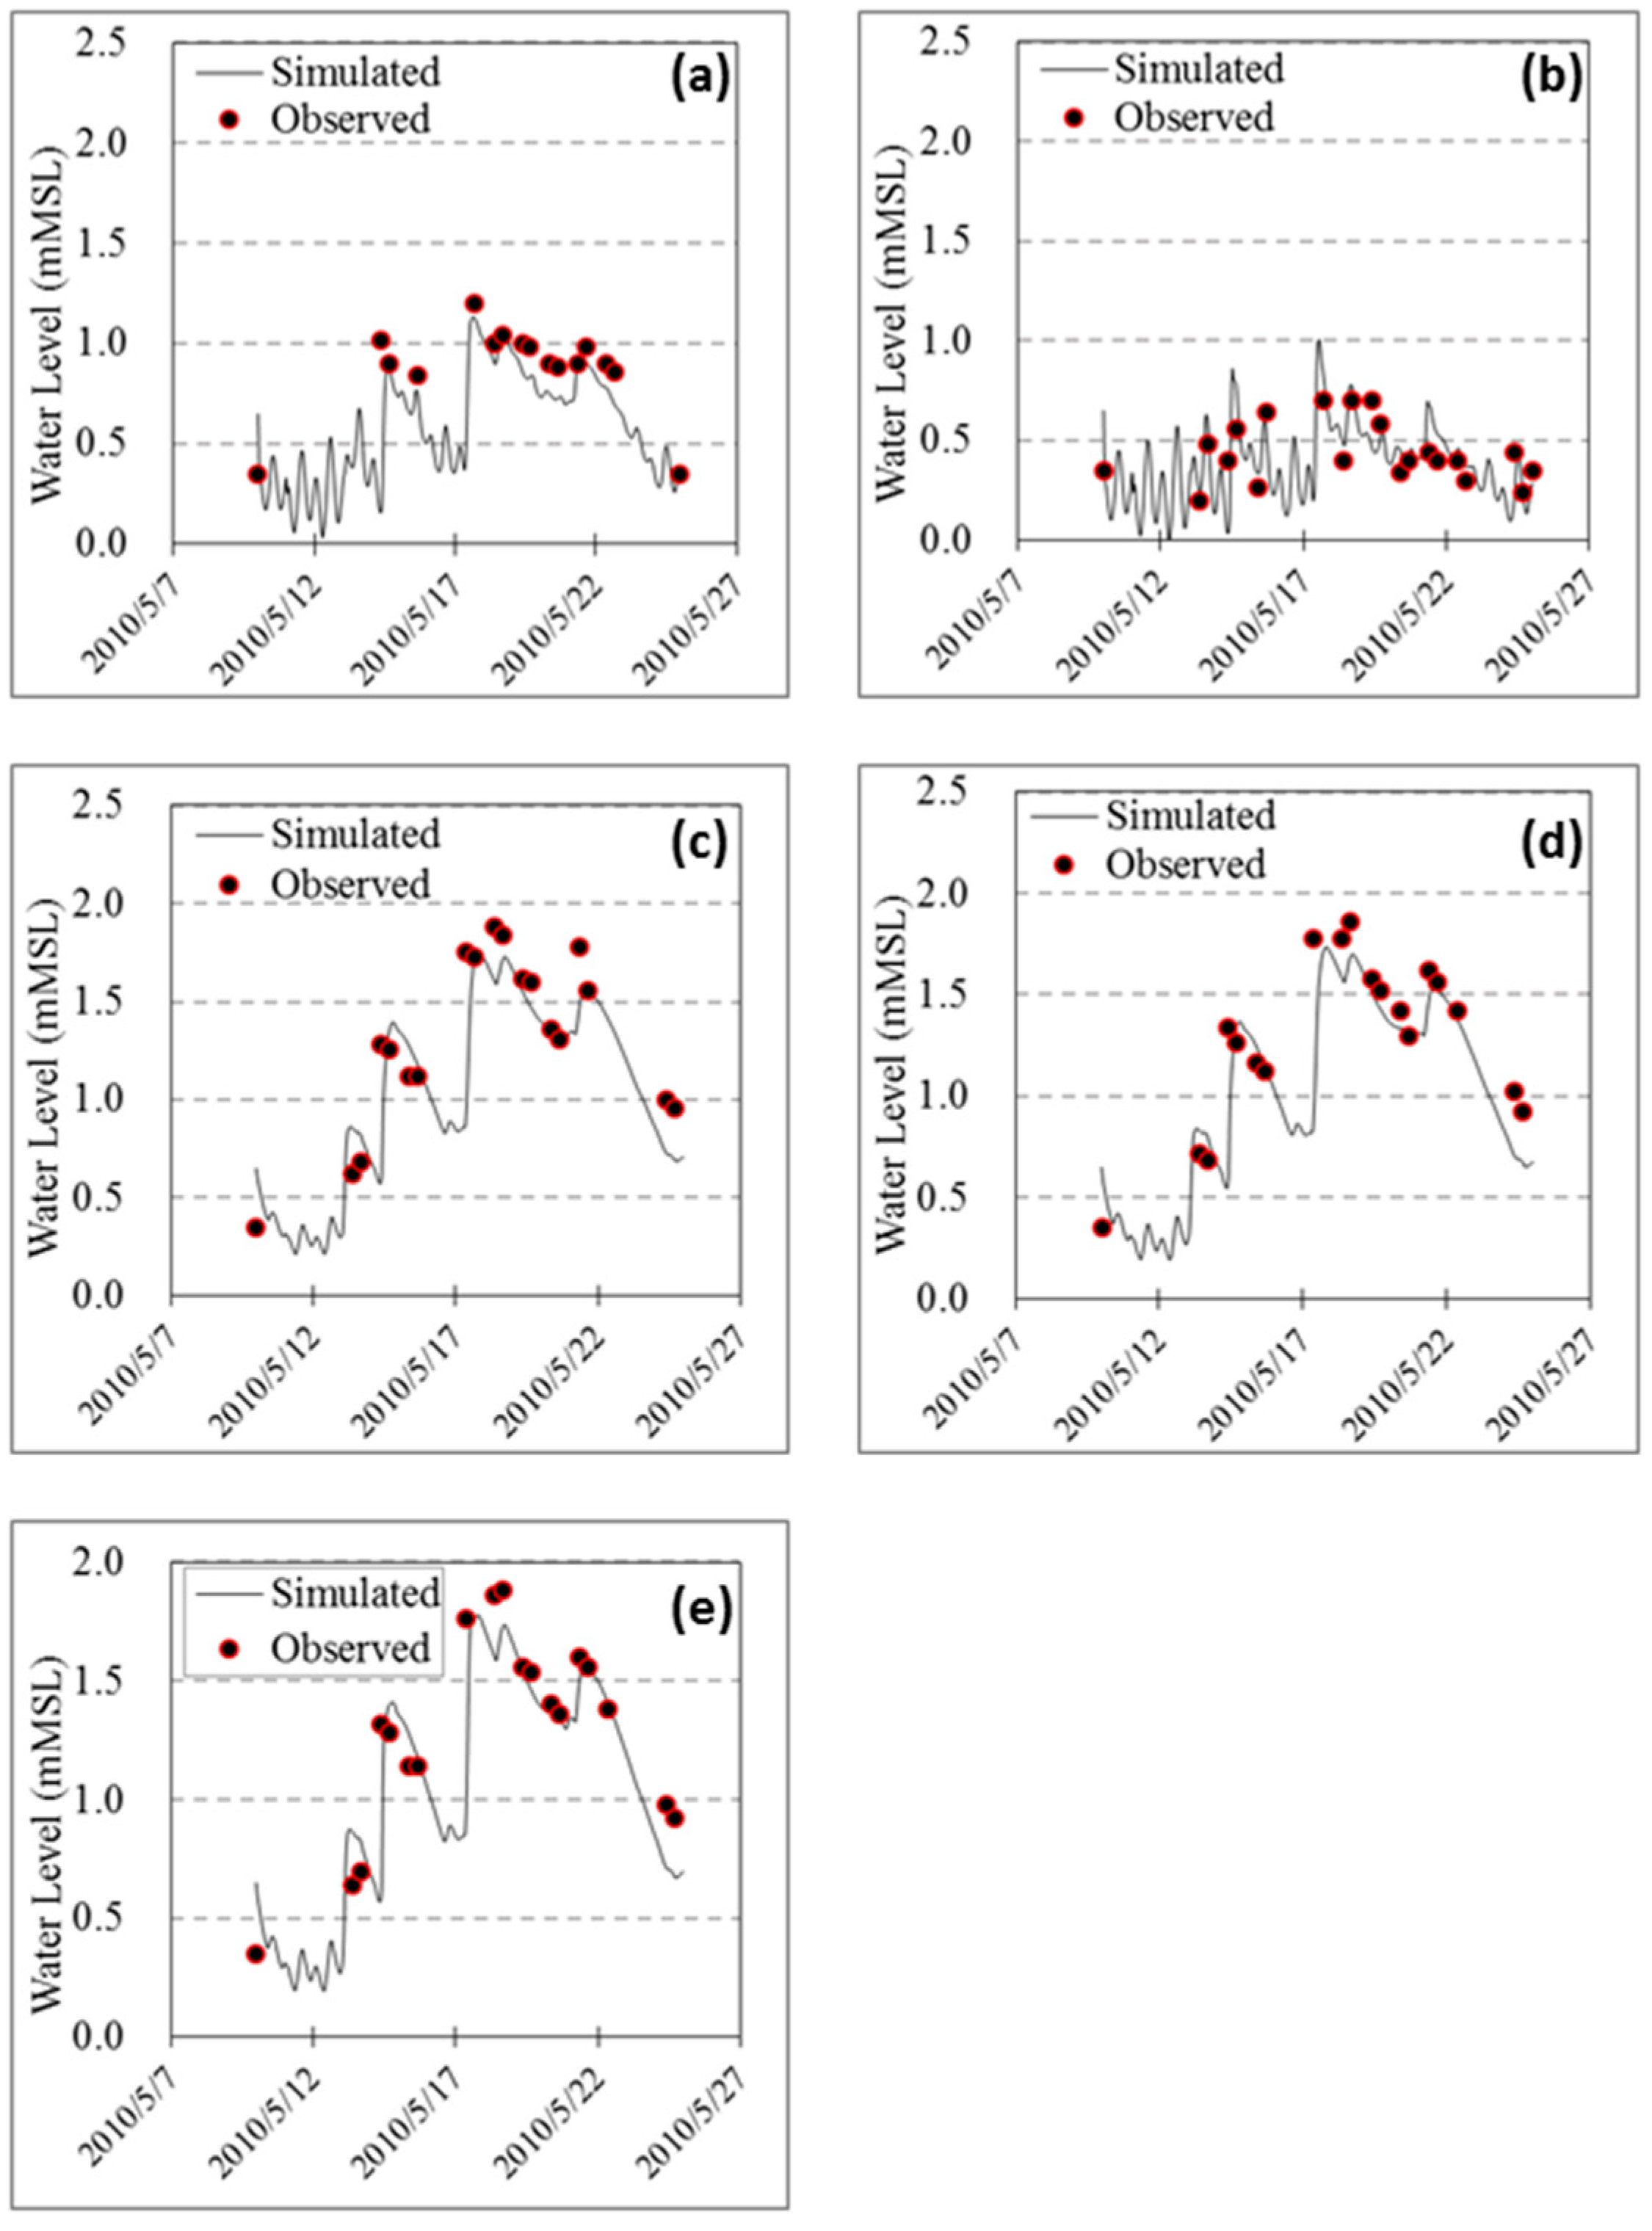
Table 2 describes the estimated error indicators for simulated results at these locations. The error estimations indicate reasonably acceptable values for the simulation results. The model was validated for the flood event that occurred in May 2010 between the 14 and 18. A prolonged rainfall event was experienced in the Metro Colombo basin from the 13 of May 2010 up to the end of the month. The hourly maximum rainfall that occurred during this event was 76 mm. The validation results of simulated and observed water levels at the same five gauging locations are shown in
Figure 9. The flood inundation maps for the selected events of calibration and validation are depicted in
Figure 10. The non-availability of observed flood maps for the calibration and validation flood events was a limitation of the study since there was not a direct way to justify the inundation distributions. However, with the fact that the model showed accurate results for the water levels at five locations distributed across the basin, it was assumed that the calibrated MIKE FLOOD model produced agreeable inundations based on the given rainfalls and other boundary conditions.
5.2. Simulation of Design Rainfall Floods
The calibrated model was employed to study the inundation distributions for different scenarios of rainfall and discharge boundary conditions. Frequency analysis was conducted, and design rainfalls were determined as shown in
Table 1. In this study, we selected 10-, 25- and 50-year return period rainfall events for the scenario analysis. The rainfall patterns for each design rainfall were determined by the Alternating Block Method [
13]. Two types of simulations were conducted with the design rainfall considering two discharge boundary conditions at the Hanwella gauging station of the Kelani River (
Figure 4). Those two types were categorized as favourable and least favorable conditions. In both cases, considered rainfall was same, however the discharge boundary conditions at the Hanwella gauging station were different. In the favourable condition, a 30-year average river discharge (100 m
3/s) was used and for the least favorable case, a 30-year maximum discharge of 2000 m
3/s was used as the river boundary condition at Hanwella. The favourable condition represented the situation where the local rainfall in the Colombo city was dominant while the upstream of the Kelani basin was not experiencing considerable rain. The least favorable case represented the high rainfall in the upstream of Kelani basin as well as in the Metro Colombo area. The favourable condition gave a more relax boundary conditions at river outfalls of the canal system. There was a considerable backflow to the canal system from Kelani River in the least favorable condition due to high river discharge and therefore the outfalls to the river did not function in this situation. The model was simulated for several design scenarios considering the design rainfalls and boundary conditions as follows and the respective flood inundation maps were obtained.
Favourable/least favorable conditions with 10-year design rainfall.
Favourable/least favorable conditions with 25-year design rainfall.
Favourable/least favorable conditions with 50-year design rainfall.
Also, for each design scenario, the simulated water levels in the canal system at five important locations were obtained and a comparison was made between favourable and least favorable conditions. Those five locations are shown in
Figure 5.
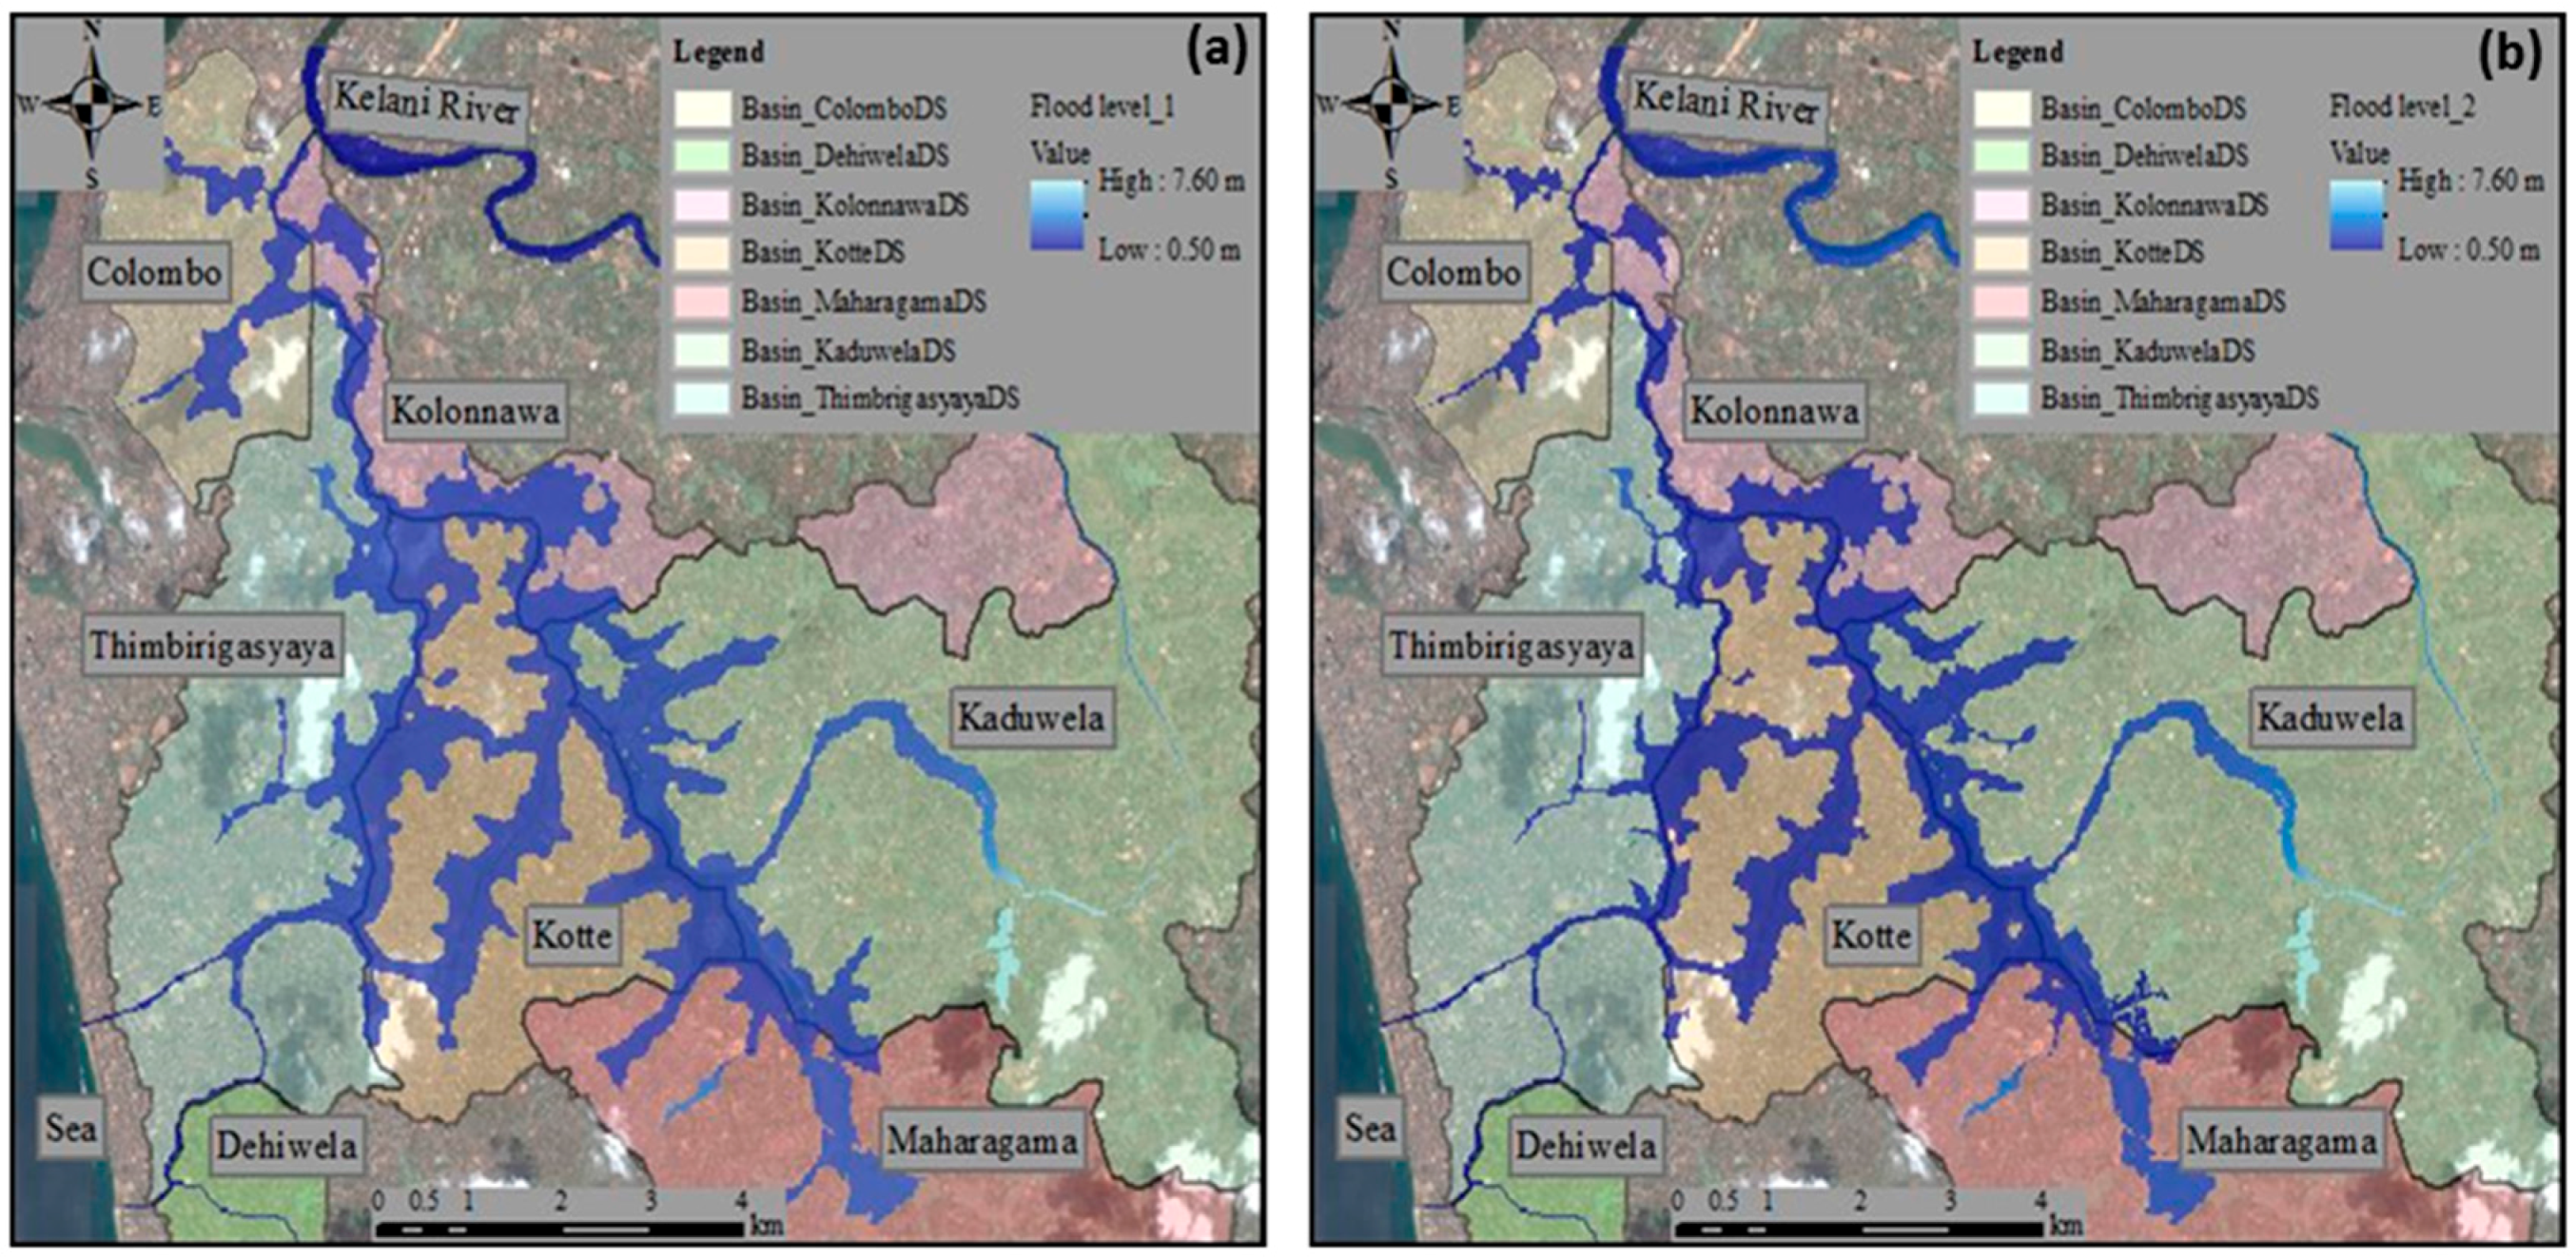
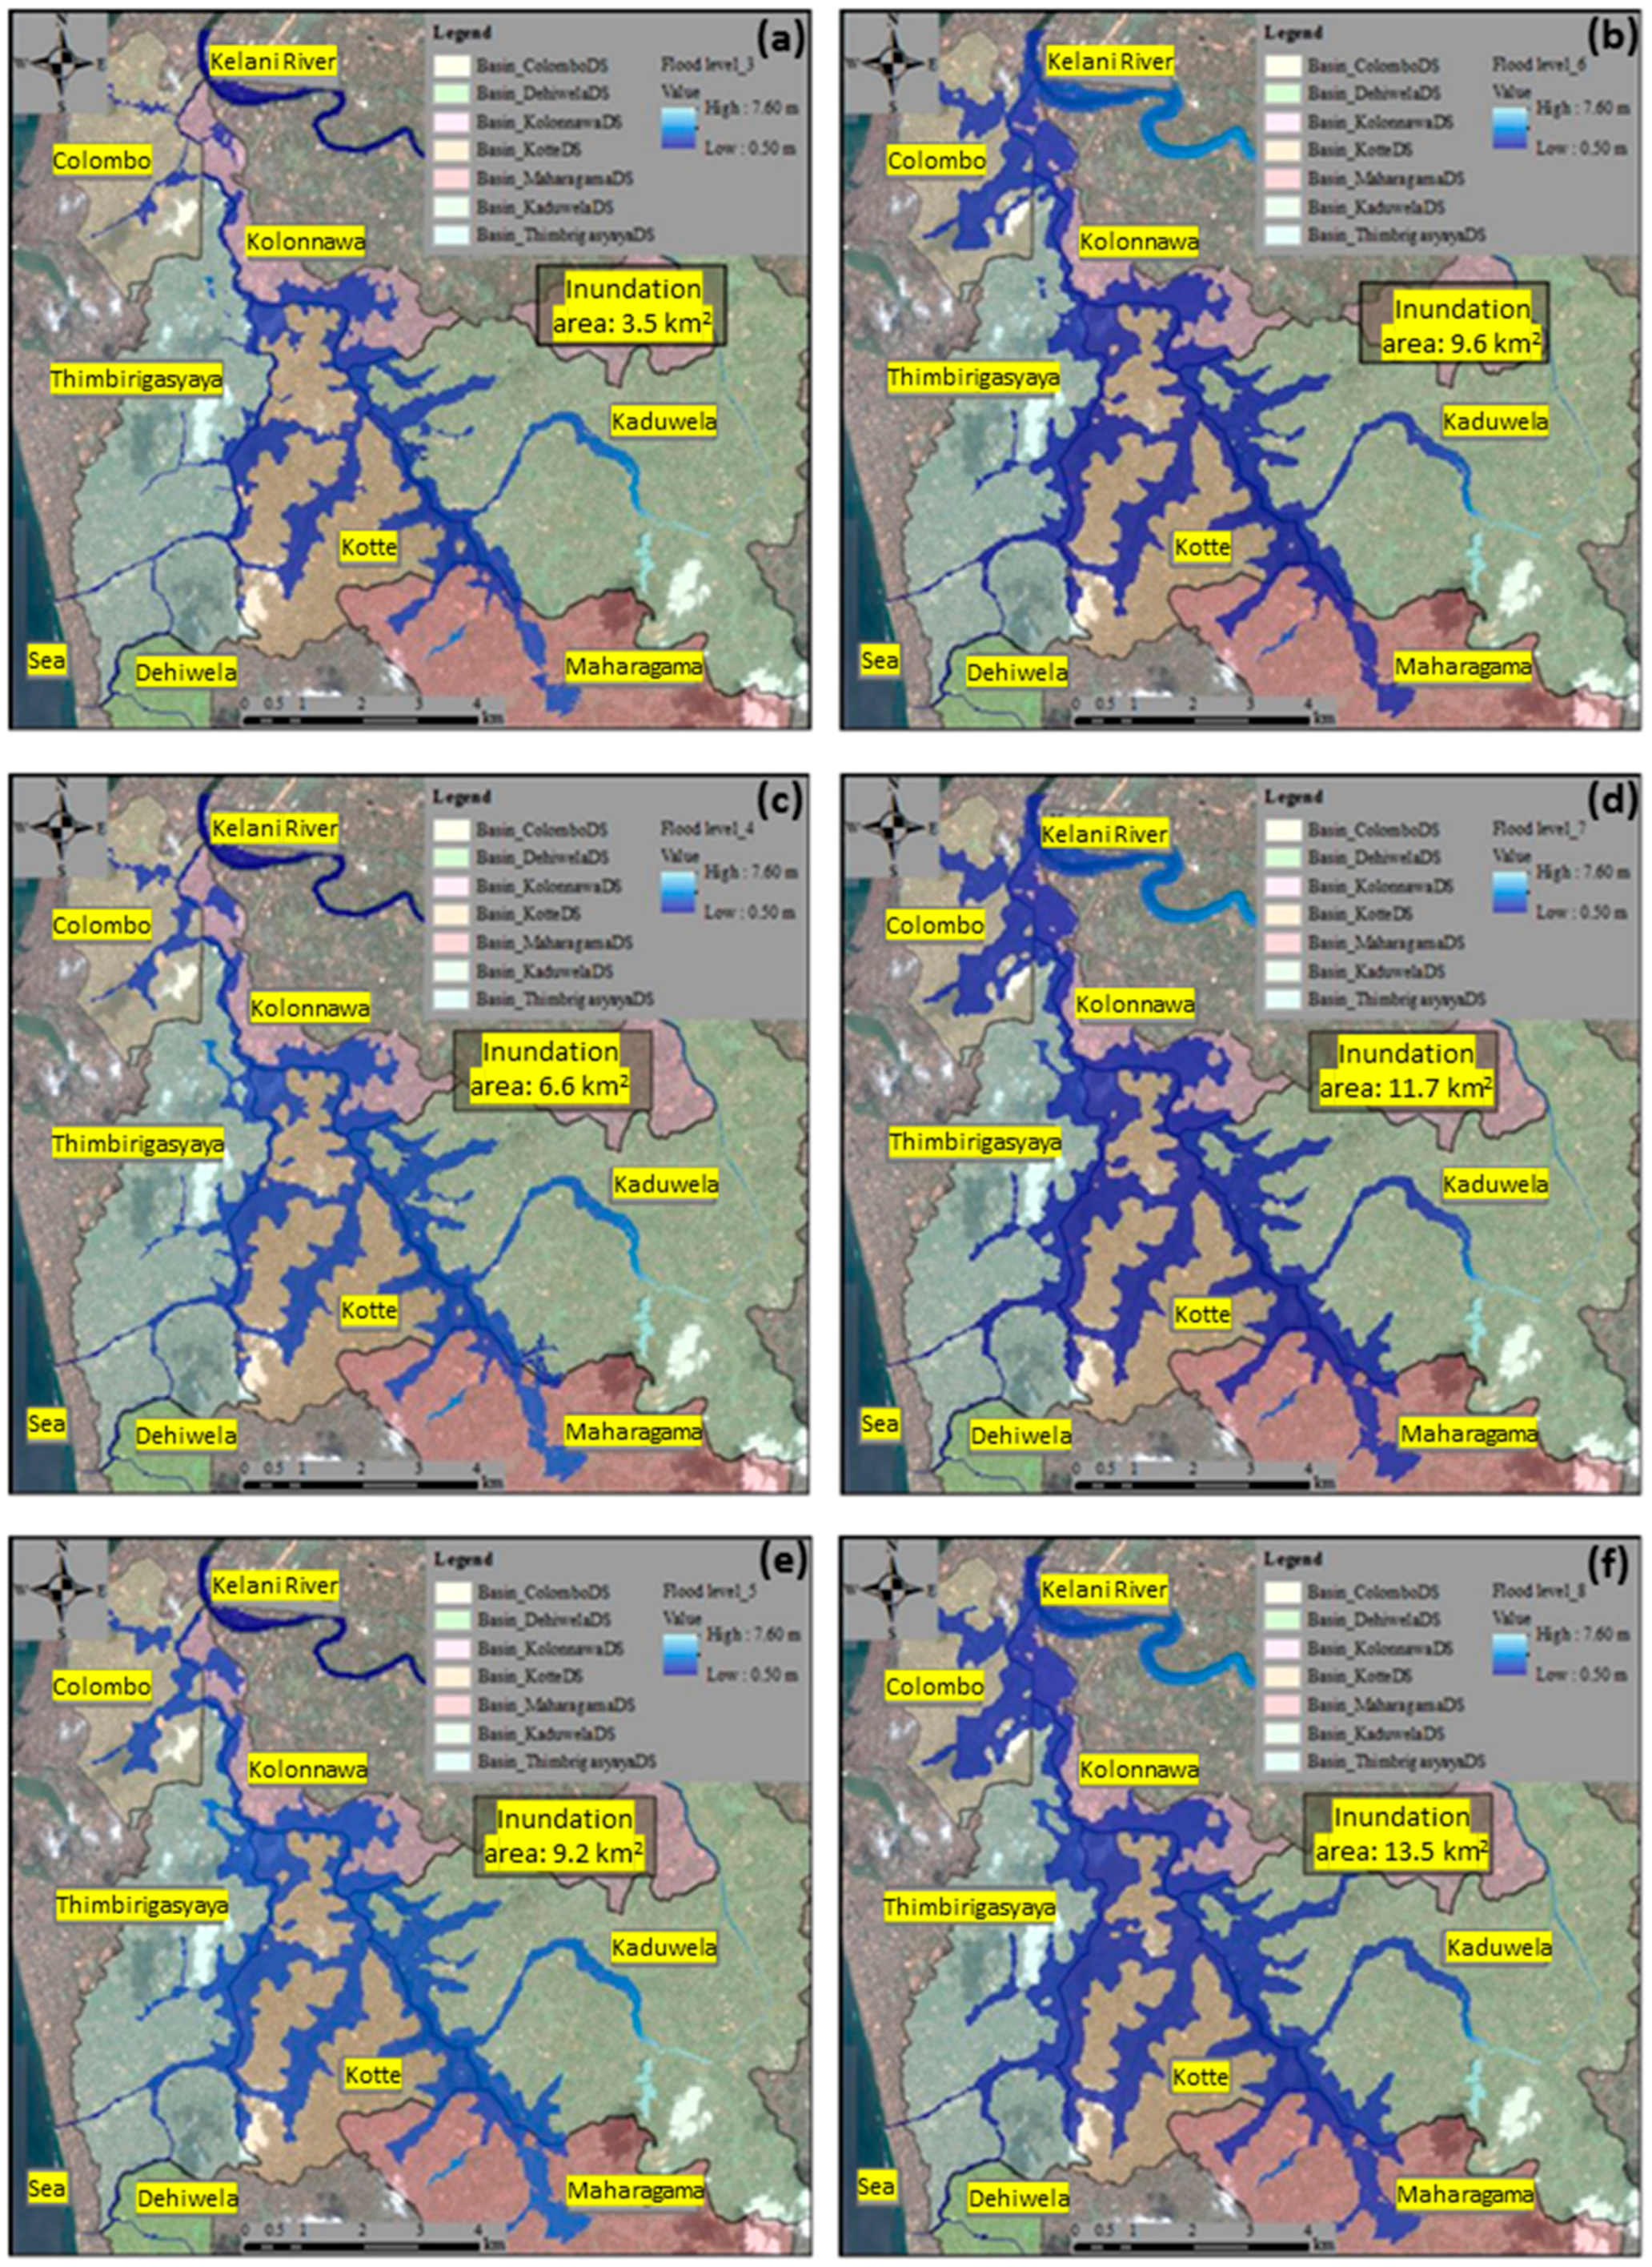
Figure 11 compares the inundation distributions for the favourable and least favorable conditions for the 10, 25 and 50-year design rainfalls. In all cases, higher flood inundation areas were shown in the least favorable condition cases than the favourable conditions due to a high discharge boundary condition applied at the Hanwella gauging station.
Table 3 compares the inundated areas for the considered cases. The Sri Jayawardenapura Kotte DSD showed the highest inundated area among all the cases according to the obtained results. The Sri Jayawardenapura Kotte city is the official capital of Sri Lanka and various governmental institutions are in this DSD including the Sri Lanka Parliament. Maharagama, Kaduwela, Kolonnawa and Thimbirigasyaya DSDs showed moderate inundations in all cases while the Colombo and Dehiwela DSDs showed a mild impact according to the inundation area comparisons. Inundation area increment ratios for the 25 and 50-year rainfalls for the favourable condition relative to the 10-year rainfall were 1.88 and 2.63. In the case of the least favorable case, the same increment ratios relative to the 10-year rainfall were 1.22 and 1.41.
Table 4 compares the water levels at the five locations under different cases. According to the results shown in
Table 4, the Parliament Road Bridge showed the highest water levels. In the case of the 50-year rainfall, above 2 m water levels resulted in both favourable and least favorable cases. In the 50-year least favorable case scenario, the water levels in all five locations exceeded 2.5 m, increasing the risk of high floods in the canal basin.
The affected residents in the seven DSDs under the considered cases are summarized in
Table 5. Calculation of the affected people was carried out assuming an equal distribution of the population in each DSD area. The Dehiwela DSD showed a minimum impact due to its location in the Metro Colombo basin and it experienced minor floods according to the simulation results. All other DSDs showed high vulnerability for floods. The residents of the Sri Jayawardenapura Kotte, Kolonnawa and Colombo DSDs had high vulnerabilities to the floods in all cases compared to other DSDs. Under the favourable conditions, Sri Jayawardenapura Kotte DSD had the highest potential to be in the highly vulnerable area since the number of affected people in that DSD showed high in number. However, in the least favorable case, the Colombo DSD showed the highest number of affected people. As far as the total number of affected people was concerned, increments relative to the 10-year rainfall under favourable conditions, for 25-year and 50-year cases, were 1.65 and 2.35. Similar ratios for the least favorable cases for 25-year and 50-year were 1.17 and 1.32.
5.3. Flood Inundation Analysis with Countermeasures
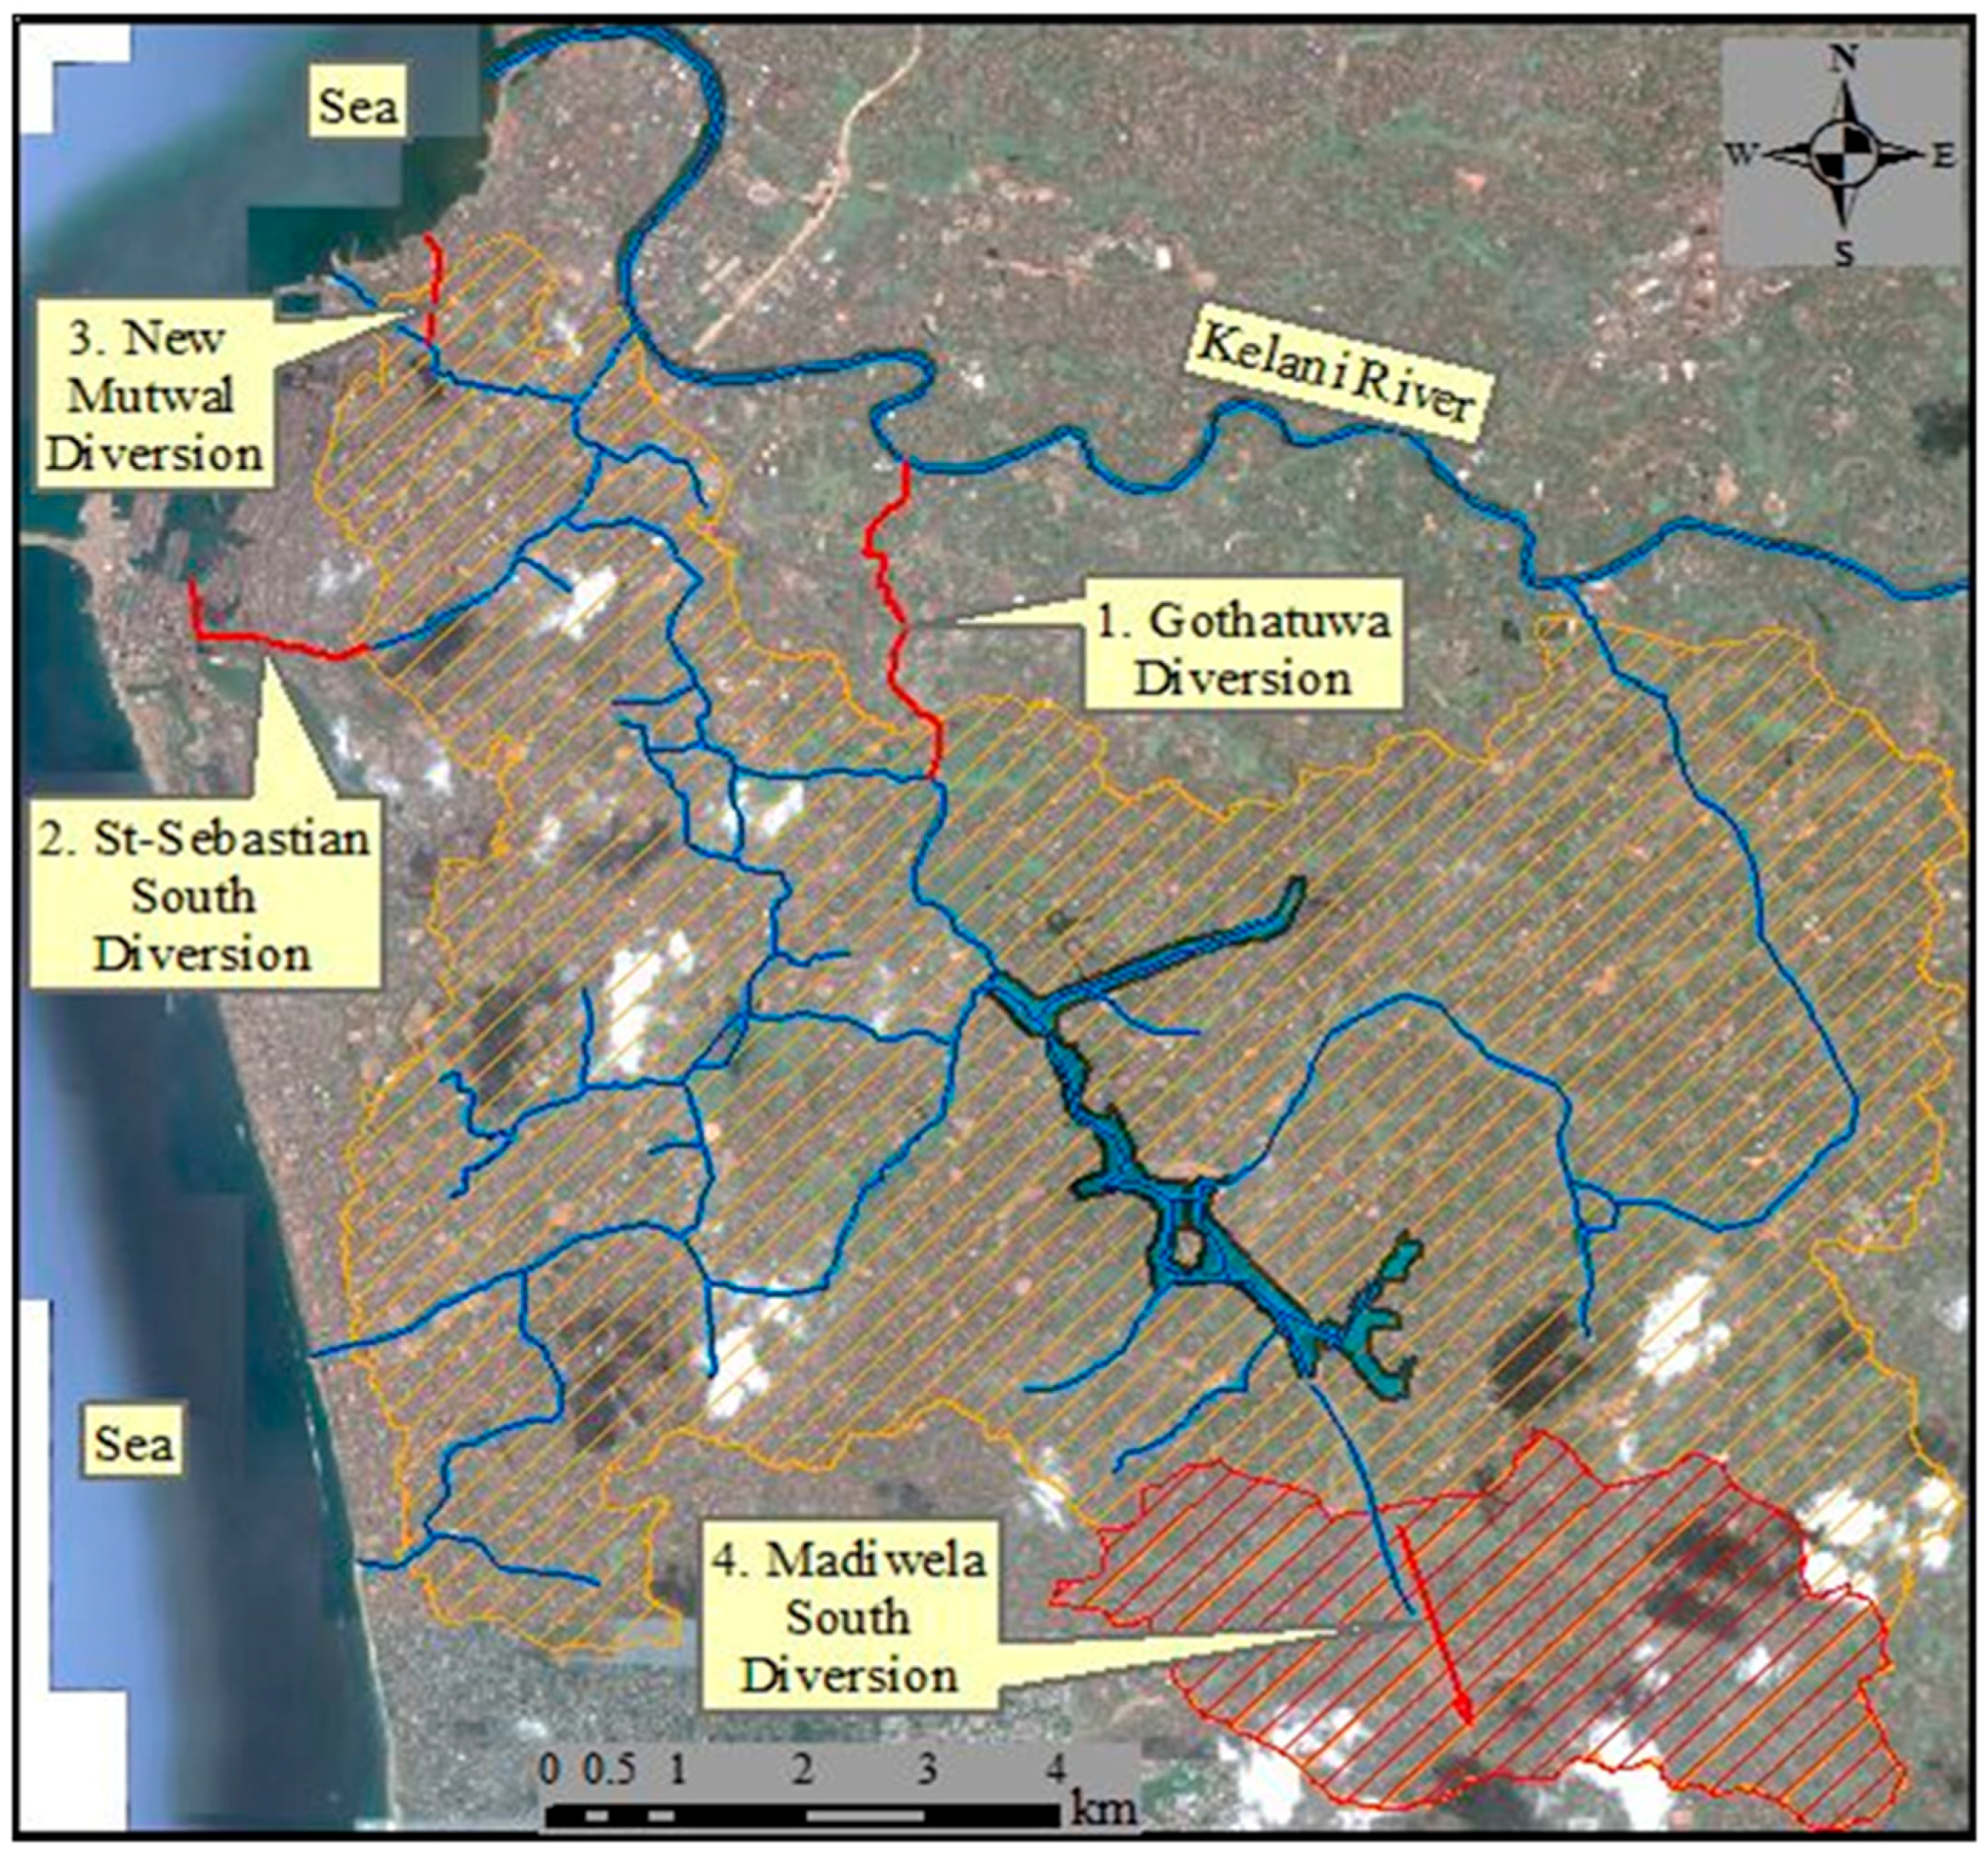
The floods can be minimized by introducing feasible countermeasures to the canal system such as diversions, lakes, tunnels, gates and pumps. Four feasible countermeasures as listed below were proposed to the Metro Colombo canal system in this study to understand their effectiveness in reducing the floods (
Figure 12).
The Gothatuwa diversion canal was introduced to the model as an open rectangular canal of 50 m wide to the centre part of the canal system. This diversion canal was connected to the main canal at Kolonnawa at its upstream and discharged water to the Kelani River. The bed level of the Gothatuwa diversion canal was set up to −1.0 m MSL as same as the entire canal system and the total length of the canal was 2.9 km approximately.
The St-Sebastian south diversion canal was introduced to the model as covered box drain of 8 m wide which connected the upstream end of the St-Sebastian South canal to the sea through Colombo harbour. The total length of the diversion canal was around 1.5 km and the bed level was set to −1.0 m MSL. The St-Sebastian South canal would flow through many commercial areas and residential areas as well.
The New Mutwal diversion was modelled with 3.0 m diameter underground tunnel and open rectangular canal of 6.0 m wide at both ends. The total length of this diversion canal was 900 m and carried water from the main canal to the sea. The length of the tunnel was 700 m and the invert levels were −1.5 m MSL and −2.0 m MSL at the upstream and downstream ends respectively. The invert level at the sea outfall of the downstream rectangular canal was −1.0 m MSL and therefore the water would flow from the underground tunnel through the rectangular canal with syphon action.
The Madiwela south diversion scheme: The sub-catchment in the upstream of Parliament Lake was divided from the Metro Colombo basin as shown in
Figure 12 and the flood water of that particular sub-catchment was diverted to the southern part. The area of this sub-catchment was 14 km
2 and the model was reconstructed by removing this sub-catchment. The point where this sub-catchment was divided from the main basin was much closer to the Parliament and therefore by eliminating this sub-catchment, it was possible to reduce a certain amount of flow towards Parliament Lake.
The above countermeasures were introduced to the model separately and the model was simulated for the 50-year design rainfall under the favourable condition (when the Kelani River water level was low) since the favourable condition was the most probable scenario. The flood inundation area which was obtained using model results after the introduction of each countermeasure were compared with the model results of existing canal system. Then the model was set up by introducing all countermeasures together and the flooded area and flood levels were compared with the results of the existing condition.
Table 6 summarizes the reduction of water levels at the five gauging stations with the introduction of countermeasures to the model while
Table 7 explains the efficiency of the countermeasures in reducing the inundation area. The impact to the people in the basin with the introduction of countermeasures is shown in
Table 8. The inundations maps for the peak flood distribution for each scenario are illustrated in
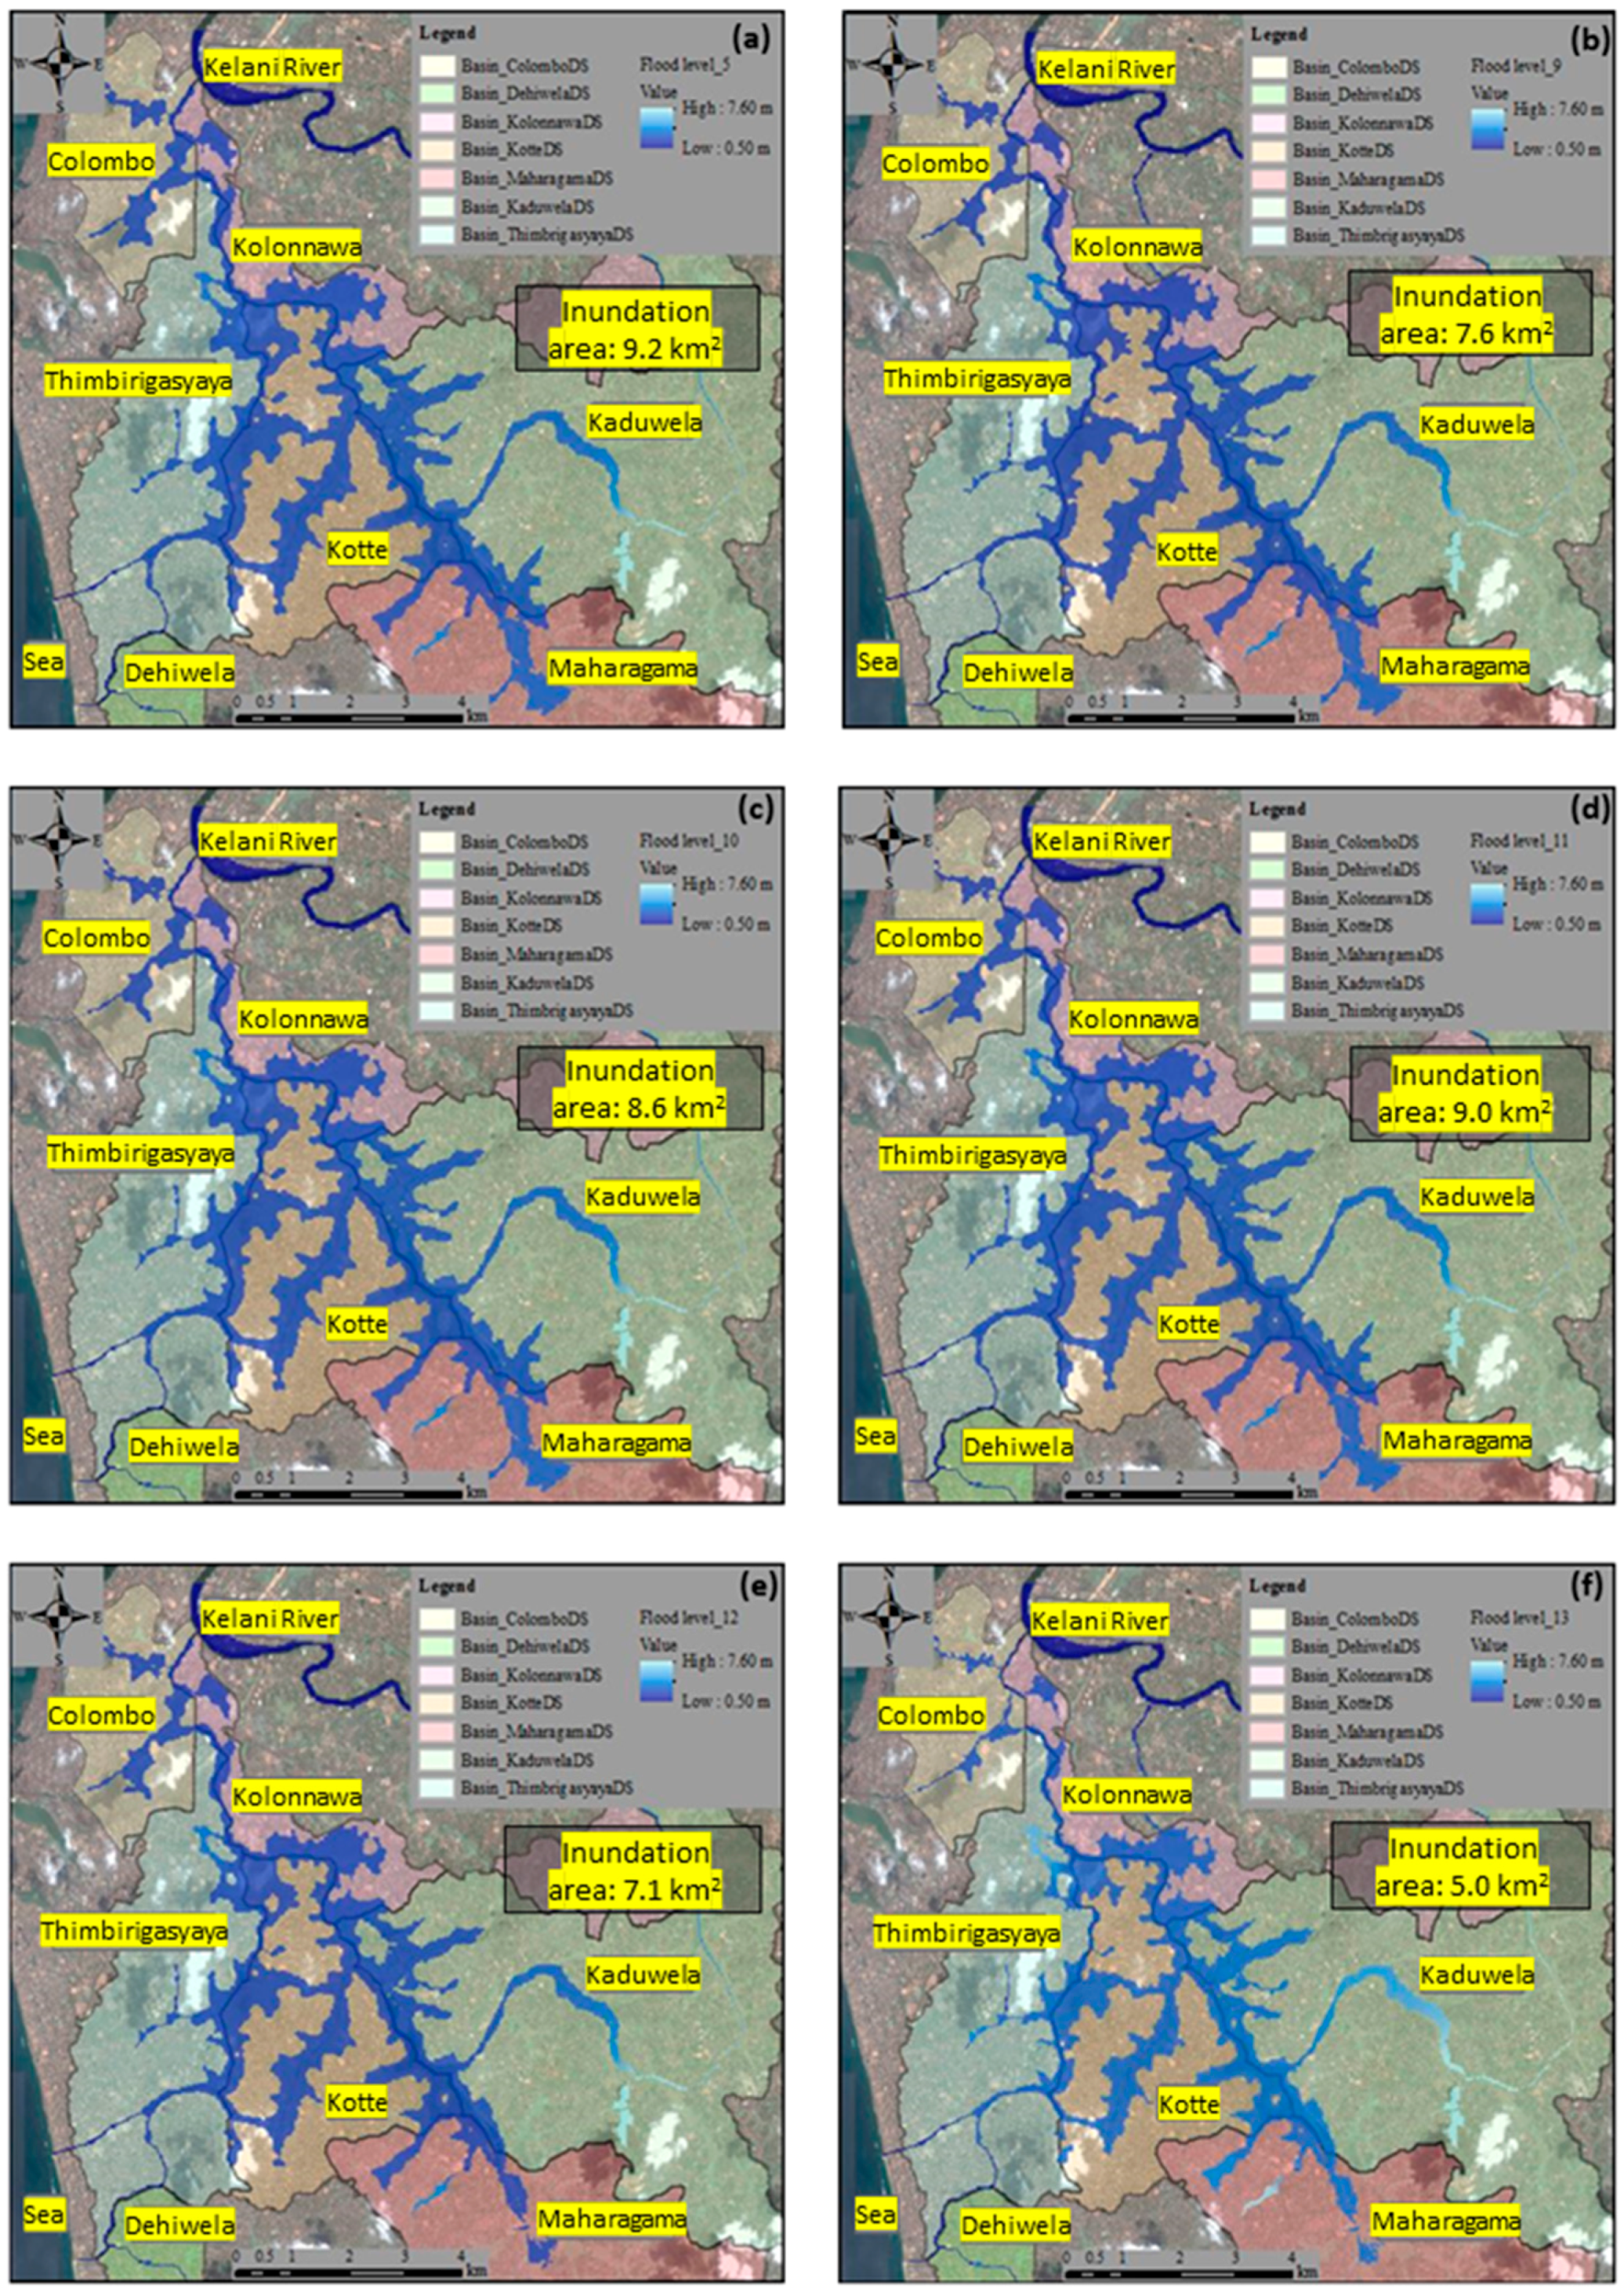
Figure 13.
5.3.1. Introduction of the Gothatuwa Diversion Canal
The model was first simulated without the Gothatuwa diversion canal (with existing canal system) for 50-year design rainfall with the favourable condition and the inundated area was obtained as 9.2 km
2 (
Figure 13). After introducing the Gothatuwa Diversion canal, the inundated area reduced to 7.6 km
2 and there was a 17% reduction in inundated area due to the introduction of this diversion canal. Inundation area and the affected people in each DSD for a 50-year rainfall without and with the Gothatuwa diversion are shown in
Table 8. There was a reduction of 21.1% in affected people within the entire basin with the introduction of Gothatuwa diversion. There were about 17.6%, 28% and 28.5% reductions in the numbers of affected people in Sri Jayawardenapura Kotte, Colombo and Thimbirigasyaya DSDs which were highly urbanized DSDs in the Metro Colombo area. The flood water level in the canal system was lowered by a considerable level due to the introduction of the Gothatuwa diversion canal. Approximately 11% of the reduction in water levels were achieved at the Kirimandala Road Bridge, SLLRDC Bridge and the Babapulle Road Bridge water level gauging stations after introducing the Gothatuwa diversion canal. These three locations are much closer to several administrative, state and commercial institutes and flood safety level of these areas are around 2.0 m MSL. Introduction of the Gothatuwa diversion would reduce the water level very close to the flood safety level and thereby the area would be safer against floods.
5.3.2. Introduction of the St-Sebastian South Diversion Canal
The St-Sebastian South diversion canal was connected to the main canal system at the most western part of the Metro Colombo basin and therefore the effectiveness of this diversion canal was higher in the surrounding area of the diversion canal than other areas. Therefore, the total reduction in the inundated area, considering the entire basin, was only 8%. However, a 30% local reduction of the inundation area was achieved in the Colombo DSD with the introduction of the St-Sebastian South diversion canal. The decrease in the number of affected people in the Colombo DSD showed a high percentage (23%) while other DSDs did not show a significant decrease. As far as the water level was concerned, the Babapulla Road bridge showed an 8.8% reduction while others did not show significant reductions. The Babapulla Road Bridge is located very close to the connection point of the St-Sebastian diversion canal. The surrounding area of the Babapulla Road Bridge is highly developed with several commercial activities and there are some settlements of low-income people in the vicinity of this location. The flood safety level of commercial places is around 2.0 m MSL while the flood safety level of few settlements is 1.8 m MSL.
5.3.3. Introduction of the New Mutwal Diversion
According to the results shown in
Table 7 and
Table 8, there was no significant reduction in inundation area and affected people locally or in the entire basin due to the introduction of the New Mutwal diversion. The New Mutwal diversion tunnel was connected to the Main drain canal of the Metro Colombo canal system and the connection point was very near to the Aluth Mawatha Road Bridge. Some low-level areas in the sides of the main drain canal are highly packed with houses and shanties and these settlements are more vulnerable to floods. The flood safety level of some of the houses and shanties is 1.5 m MSL. The flood level near the Aluth Mawatha Road Bridge was 2.04 m MSL for the design event of 50-year return period with the favourable condition and was reduced to 1.48 m MSL with the introduction of the New Mutwal Tunnel. The reduction in water level, therefore, was 27% in this area and it can be said that the introduction of the New Mutwal diversion would reduce the flood risk of this area enormously even though its influence on the other areas was less.
5.3.4. Implementation of the Madiwela South Diversion Scheme
The model was simulated by eliminating the sub-catchment area of 14 km2 from the Metro Colombo basin in the upstream of Parliament Lake, where sub-catchment was entitled to the Madiwela south diversion scheme. By eliminating this sub-catchment, the flood inundation area was reduced to 7.1 km2 from its original area of 9.2 km2. The percentage of the reduction in flood inundation area was 23% with the implementation of the Madiwela south diversion scheme. There was a 20% reduction of affected people within the entire Colombo basin with the implementation of the Madiwela south diversion scheme. The flood water level in the Parliament Lake was reduced by around 8.9% while the reduction of water levels near the Kirimandala Road Bridge and SLLRDC Bridge were around 7.8%. Flood safety levels of Parliament and the area near the Kirimandala Road Bridge and SLLRDC Bridge is 2.0 m MSL. However, this countermeasure did not reduce the water level up to the flood safety level. The flood level could be further reduced up to the flood safety level by adding few more countermeasures with the implementation of the Madiwela south diversion scheme.
5.3.5. Introduction of All Four Countermeasures
The model was simulated by introducing all four countermeasures together (Gothatuwa diversion, St-Sebastian south diversion, New Mutwal diversion and Madiwela south diversion) for the design rainfall of 50-year under the favourable condition. The inundation area reduced to 5.0 km2 from 9.2 km2 (existing condition) and the percentage of reduction was around 46%. There was a reduction of 49% of affected people within the entire Colombo basin with the introduction of all four countermeasures. Also, it showed considerable reductions in inundation areas and affected people in each DSD with the introduction of all four countermeasures.
Table 6 explains the flood levels for the existing condition, with the introduction of all four countermeasures at selected locations and the percentage reduction in flood levels. The flood water level in Parliament Lake was reduced to 2.07 m MSL from 2.48 m MSL (16.5% reduction) with the introduction of all countermeasures. However, the flood safety level near the Parliament area is 2.0 m MSL and therefore, it is still at risk from flooding with a 50-year rainfall event. There was a 20% reduction in flood water levels near the Kirimandala Road Bridge (2.31 m MSL was reduced to 1.85 m MSL) and the SLLRDC Bridge (2.33 m MSL was reduced to 1.86 m MSL) with the introduction of all countermeasures. The surroundings of the Kirimandala Road Bridge and the SLLRDC Bridge are more commercialized areas and would be much safer for floods with a 50-year design rainfall since the flood levels were lower than the flood safety level of 2.0 m MSL. The area near to Babapulla Road Bridge is highly commercialized and compacted with some residential settlements. The flood water level near this area was reduced to 1.56 m MSL from 2.17 m MSL (28% reduction) with the introduction of all countermeasures. The flood safety level of some housing settlements in this area is 1.80 m MSL and therefore the area would be safer against the floods of a 50-year rainfall event with the favourable condition.
With the introduction of all countermeasures, the flood water level near the Aluth Mw Road Bridge was reduced to 1.13 m MSL from 2.04 m MSL (45% of the reduction in water level) for a 50-year rainfall event. The surroundings of the Aluth Mw Road bridge are a highly residential area with some settlements in low lying areas and therefore the flood safety level in this area is 1.50 m MSL. Since the flood level was much reduced than the flood safety level with the introduction of all countermeasures, the area would be safer against floods where rainfall would have a 50-year return period and favourable condition in the Kelani River.
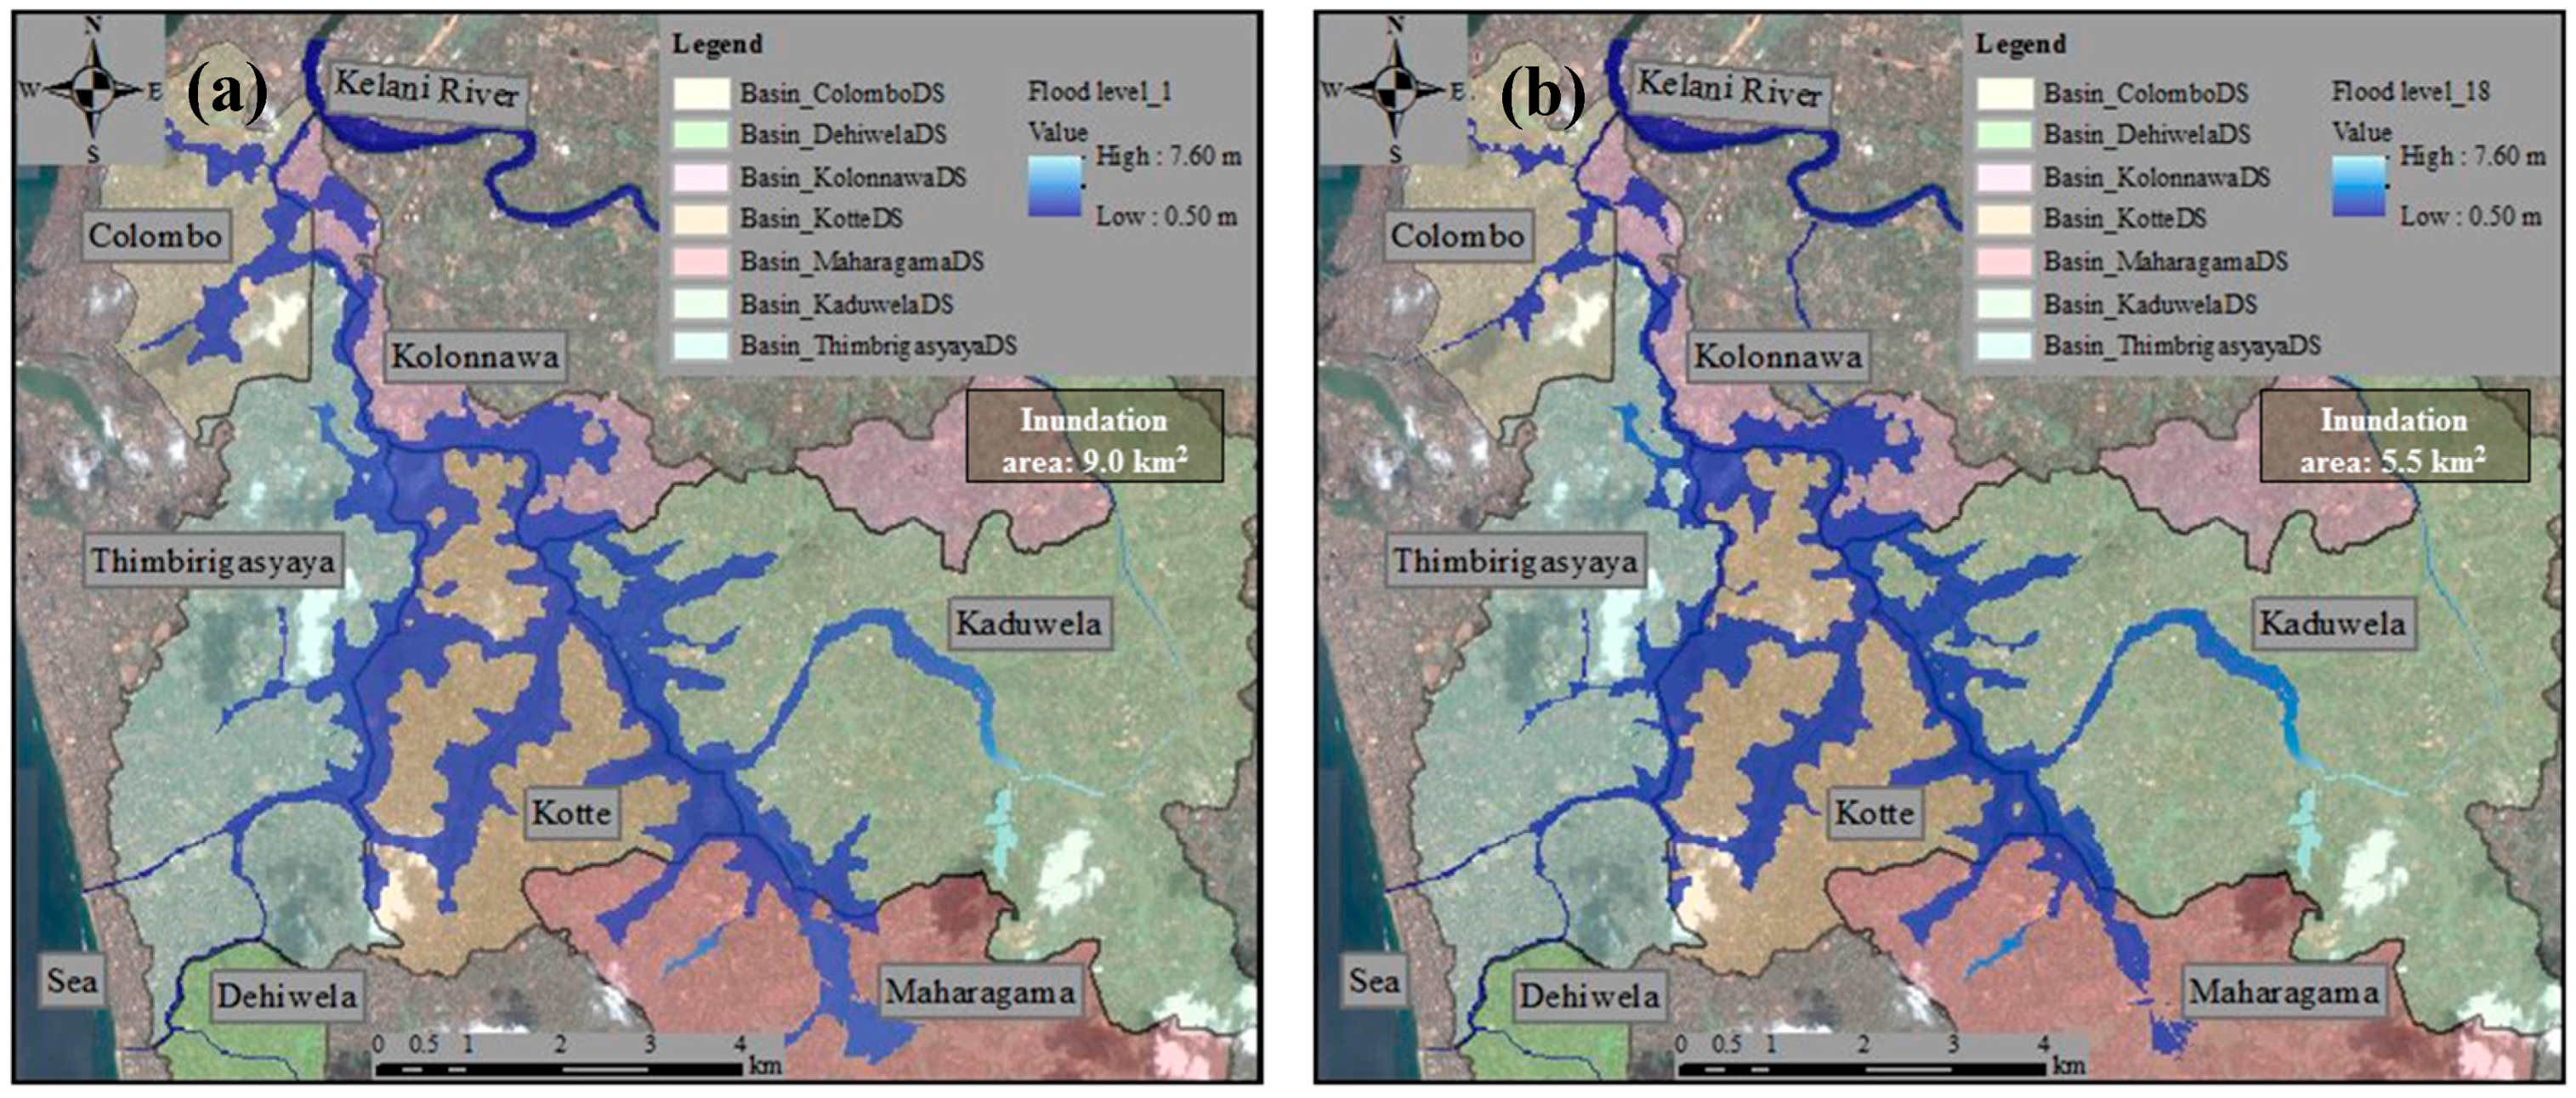
5.4. Introduction of All Countermeasures for the 2010 November High Rainfall Event
The Metro Colombo basin experienced heavy rainfall in a short period of time between the 10 and 11 of November 2010. The total rainfall amounted 440 mm and poured into the basin within 14 h. The total rainfall amount can be compared with a design rainfall with a 35-year return period. The maximum hourly rainfall of the event was 116 mm. The model simulated the rainfall event of November 2010 for the existing conditions and the flood inundation area was estimated as 9.0 km
2. The flood inundation area reduced to 5.5 km
2 after introducing all four countermeasures to the canal system for the event of November 2010.
Figure 14 compares the inundations for the November 2010 rainfall under existing conditions and with countermeasures.
Table 9 shows the inundation area and the number of affected people in each DSD division under the existing conditions and with all four countermeasures for the past rainfall event of November 2010. There was a reduction of 41.2% of affected people within the entire Colombo basin with the introduction of all four countermeasures. Also, it shows considerable reductions in inundation areas and affected people in each DSDs with the introduction of all four countermeasures. With the introduction of all four countermeasures to the canal system, the flood level at selected locations were significantly lowered as shown in
Table 10. Therefore, it can be expressed that, if all four countermeasures had been implemented before November 2010, a reasonable part of the basin would not have flooded to the extend that it did.
6. Conclusions
The Metro Colombo canal system was modelled using the one-dimensional MIKE 11 and the terrain of the entire basin was modelled using MIKE 21, the two-dimensional hydrodynamic model. Then both the 1-D and 2-D models were coupled using MIKE FLOOD by defining the links between them. The model was calibrated and validated against observed water levels at five gauging stations located in the Metro Colombo canal basin for the rainfall events in 2010. The coupled model was simulated for several scenarios considering rainfalls of 10-year, 25-year and 50-year return periods. Sea level and river discharge boundary conditions were employed for the aforementioned scenarios.
The safety flood level in the basin is 2.0 m MSL and was satisfied only with the 10-year rainfall event under the favourable condition according to the obtained results. In all the least favorable-case simulations, the water levels at the observation locations exceeded the 2.0 m MSL. The most vulnerable DSDs in the basin were Sri Jayawardenapura Kotte, Colombo and Thimbirigasyaya since the number of affected people in those DSDs were significantly high according to the obtained results. Sri Jayawardenapura Kotte could be ranked as the most vulnerable DSD in the context of the inundated area. Dehiwela DSD was the least affected DSD in the basin according to the obtained results. In all the considered cases, least favorable cases showed high impacts due to extremeness of the considered boundary condition. Since the water level of Kelani River was high in the least favorable condition, the river outfalls at Nagalagam Street and Ambatale did not discharge water at their full capacity due to the backwater effect. Therefore, the extent of the inundation areas were greater in least favorable condition than in the favourable condition in all the scenarios. Flood inundation maps expressed that more areas were inundated closer to the river outfall in least favorable condition than the favourable condition. Also, the flood water levels were higher in least favorable condition than the favourable condition in all five locations considered, and it was higher especially at the locations closer to river outfall. The flood water levels for several scenarios at different locations were compared and it was expressed that the existing canal system was only capable of carrying the flood water of a 10-year rainfall event (favourable condition) without any inundation in the area.
To investigate the feasible countermeasures to mitigate the floods in the Metro Colombo basin, four measures were tested in the study. The flood water level at different selected locations was reduced when the countermeasures were introduced to the canal system. Each countermeasure gave a clear reduction in water level at the location where that particular countermeasure had been introduced and a limited reduction in other places. There was an estimated 11% reduction in flood water level at the Kirimandala Road Bridge, the SLLRDC Bridge and the Babapulla Road Bridge with the introduction of the Gothatuwa diversion, however in the other two locations (such as Parliament Road Bridge and Aluth Mawatha Road Bridge) the reduction was relatively small. The introduction of the St-Sebastian South diversion was a better proposal to lower the flood water level in the surrounding area of the Babapulla Road Bridge while the introduction of the New Mutwal diversion reduces the flood water level in the surroundings of the Aluth Mawatha Road Bridge. Implementation of the Madiwela South diversion scheme was a feasible proposal to lower the flood water level in the Parliament area, surroundings of the Kirimandala Road Bridge and the SLLRDC Bridge and there was a reduction in floodwater levels of around 9% due to this countermeasure. However, countermeasures mentioned above were not strong enough to reduce the water level lower than their respective flood safety levels at five different locations when they were introduced individually. When all four countermeasures were introduced together in the model, the outcomes were preferable, and the flood water levels were lower than their respective flood safety levels. At the Aluth Mw Bridge, the reduction of water level was about 44.6% while the other four locations also reductions were greater than 16%.
The reduction of inundated area was significant in the case of applying all four countermeasures together. In that case, a 46% area reduction was achieved. In the case of individual effectiveness, the Gothatuwa diversion showed a 17% reduction of inundation and the Madiwela south diversion showed a 23% reduction while the other two countermeasures were able to achieve less than a 10% area reduction. When the countermeasures were applied for the 2010 flood event, there was a 5.5% reduction of inundated area and a 41.2% reduction of affected people was achieved.
In the present simulations, we used the available 30 m DEM and tested a limited number of scenarios. Since the Metro Colombo basin is an urbanised area, with a fine resolution DEM with detailed land use data and hydrological data, we would have achieved more accurate results than the obtained results. Applying finer DEM, several patterns of rainfall and boundary conditions at the Kelani River and seaside, the uncertainties would have been minimized. Another limitation of the study was the lack of opportunity to verify the inundation areas with the simulated inundations. In future, flood distribution observations should be conducted and utilised in these kind of studies to validate flood models. However, despite the uncertainties, we were able to produce essential information for the Metro Colombo canal basin to identify the vulnerable areas and communities. The results of the study will provide a baseline for future studies.


