Article

Integrated Flood Risk Assessment of Rural Communities in the Oti River Basin, West Africa

1
Graduate Research Program on Climate Change and Water Resources, West African Science Service Center on Climate Change and Adapted Land Use (WASCAL), University of Abomey-Calavi, Cotonou, Abomey-Calavi BP 2008, Benin
2
CSIR-Water Research Institute, Accra, P.O. Box M 32, Ghana
3
Department of Geography, University of Bonn, Bonn 53115, Germany
*
Author to whom correspondence should be addressed.
Hydrology 2016, 3(4), 42; https://doi.org/10.3390/hydrology3040042
Submission received: 3 March 2016 / Revised: 3 November 2016 / Accepted: 15 November 2016 / Published: 22 November 2016

Abstract

:
Flood damage in West Africa has increased appreciably during the last two decades. Poor communities are more at risk due to the vulnerability of their livelihoods, especially in rural areas where access to services and infrastructures is limited. The aim of this paper is to identify the main factors that contribute to flood risk of rural communities in the Oti River Basin, Togo. A community-based disaster risk index model is applied. The analyses use primary data collected through questionnaires during fieldwork, the analytic hierarchy process (AHP) method, population and housing census data and flood hazard mapping of the study area. The results showed a moderate level of flood risk despite a high level of hazard and vulnerability for all investigated communities. In addition, the results suggest that decreasing vulnerability through creation of new income-generating opportunities and increasing capacity of communities to manage their own flood risk should be paramount in order to reduce flood risk in the study area. The results of this work contribute to the understanding of flood risk and can be used to identify, assess, and compare flood-prone areas, as well as simulating the impacts of flood management measures in the Oti River Basin.

1. Introduction

In many parts of the world, extreme floods have been observed and grave consequences on ecosystems, human life and socio-economic activities have been reported. In the last two decades, floods have caused extensive economic damage and loss of life throughout the world. For instance, floods in September 2007 in West Africa caused 23, 46 and 56 deaths in Togo, Burkina Faso and Ghana, respectively [1] and extraordinary floods occurred in 2010 in Pakistan and China [2]. Apart from the effects of human-induced climate change, which is expected to exacerbate this dire situation, many factors contribute to Africa’s high vulnerability to disasters, including a high rate of population growth, high levels of poverty, inappropriate use of natural resources, and failures of policy and institutional frameworks [3]. In addition, the main features that characterize an area vulnerable to flood hazards are the flat topography, the geological conditions, urbanization and poor draining networks [4]. Managing flood risk is important to reduce the damage and adapt to the combined effects of climate and land use changes. With risk defined herein as the probability of harmful consequences, or expected losses and resulting from the interactions between natural or human-induced hazards and vulnerable conditions [5], flood risk can then be managed by reducing the hazard (probability or magnitude) or by reducing the vulnerability of the exposed population.
This approach to managing flood risk is based on the knowledge of the hazards and the physical, social, economic and environmental vulnerabilities to floods that a population faces. Consequently, efficient flood risk management is reliant on a priori assessment of flood hazards. Such assessments give insights into what can be expected, and therefore open up the discussion on how to tackle such situations [6]. Moreover, flood hazard assessment is indispensable for the development of policies and plans to mitigate flood risk [7]. A risk assessment is a methodology to determine the nature and extent of risk by analyzing potential hazards and evaluating existing conditions of vulnerability that could pose a potential threat or harm to people, property, livelihoods and the environment on which they depend [5]. Depending on data availability, the scale of application and the purpose of the risk assessment, several methods have been used to assess flood risk over the last decades. For instance, Ward et al. [8] developed and validated a model cascade to assess flood risk at the global scale. The cascade included hydrological and hydraulic modelling, extreme value statistics and estimation of annual expected impacts. Because of the small time required for the simulations and the good performance of the model cascade, the authors conclude that it could be used to carry out assessment of changes in flood risk. Remote sensing and Geographic Information System (GIS) were used for the delineation of flood zones for flood risk analysis in Ghana [9]. Musungu et al. [10] proposed a methodology of integration of community-based information into a GIS for flood risk assessment of an informal settlement in Cape Town (Republic of South Africa) and Guarín [11] integrated local knowledge into GIS-based flood risk assessment of Triangulo and Mabolo communities in Naga city (Philippines). A Community-Based Disaster Risk Index (CBDRI) approach, developed by Bollin et al. [12], was applied by Adeloye et al. [13] to assess flood risk and vulnerability of rural communities in Malawi (South Africa) and the German Technical Cooperation Agency (GTZ) to assess disaster risks in Africa, Asia, Caribbean, Central America and South America [14]. The CBDRI model was chosen in this study because it can be applied in data sparse areas where data for conventional flood risk assessment are missing.
Traditionally, flood risk is expressed in terms of expected damages and likelihood of occurrence. The flood damage is combined with information on the probability of the flood event and then plotted as return period-damage curve [15,16]. However, the results obtained using this method would provide neither sufficient information nor the required level of detail for input into flood risk reduction strategies. In addition, the use of damages to assess flood risk suffers from data scarcity, particularly in developing countries where data are usually scarce. The reason is that disaster-related damage figures are not systematically recorded and are often under-recorded, even in developed countries [17,18]. According to Birkmann [17], highly exposed regions, with high poverty levels and subject to repeated and catastrophic floods, may not necessarily register significant deaths or damage, although these factors make such places highly risky. Moreover, since mortality and damage figures are obtained from actual events, the use of damage assesses actual vulnerability but potential vulnerability is ignored [18].
This study aims at assessing fluvial flood risk of seven rural communities in the study area. Specifically, three research questions are investigated: (i) what are the major factors that contribute to flood in the studied communities? (ii) what are the level of flood risk in the Oti River Basin? and (iii) what type of measures are required to reduce flood risk in the basin?
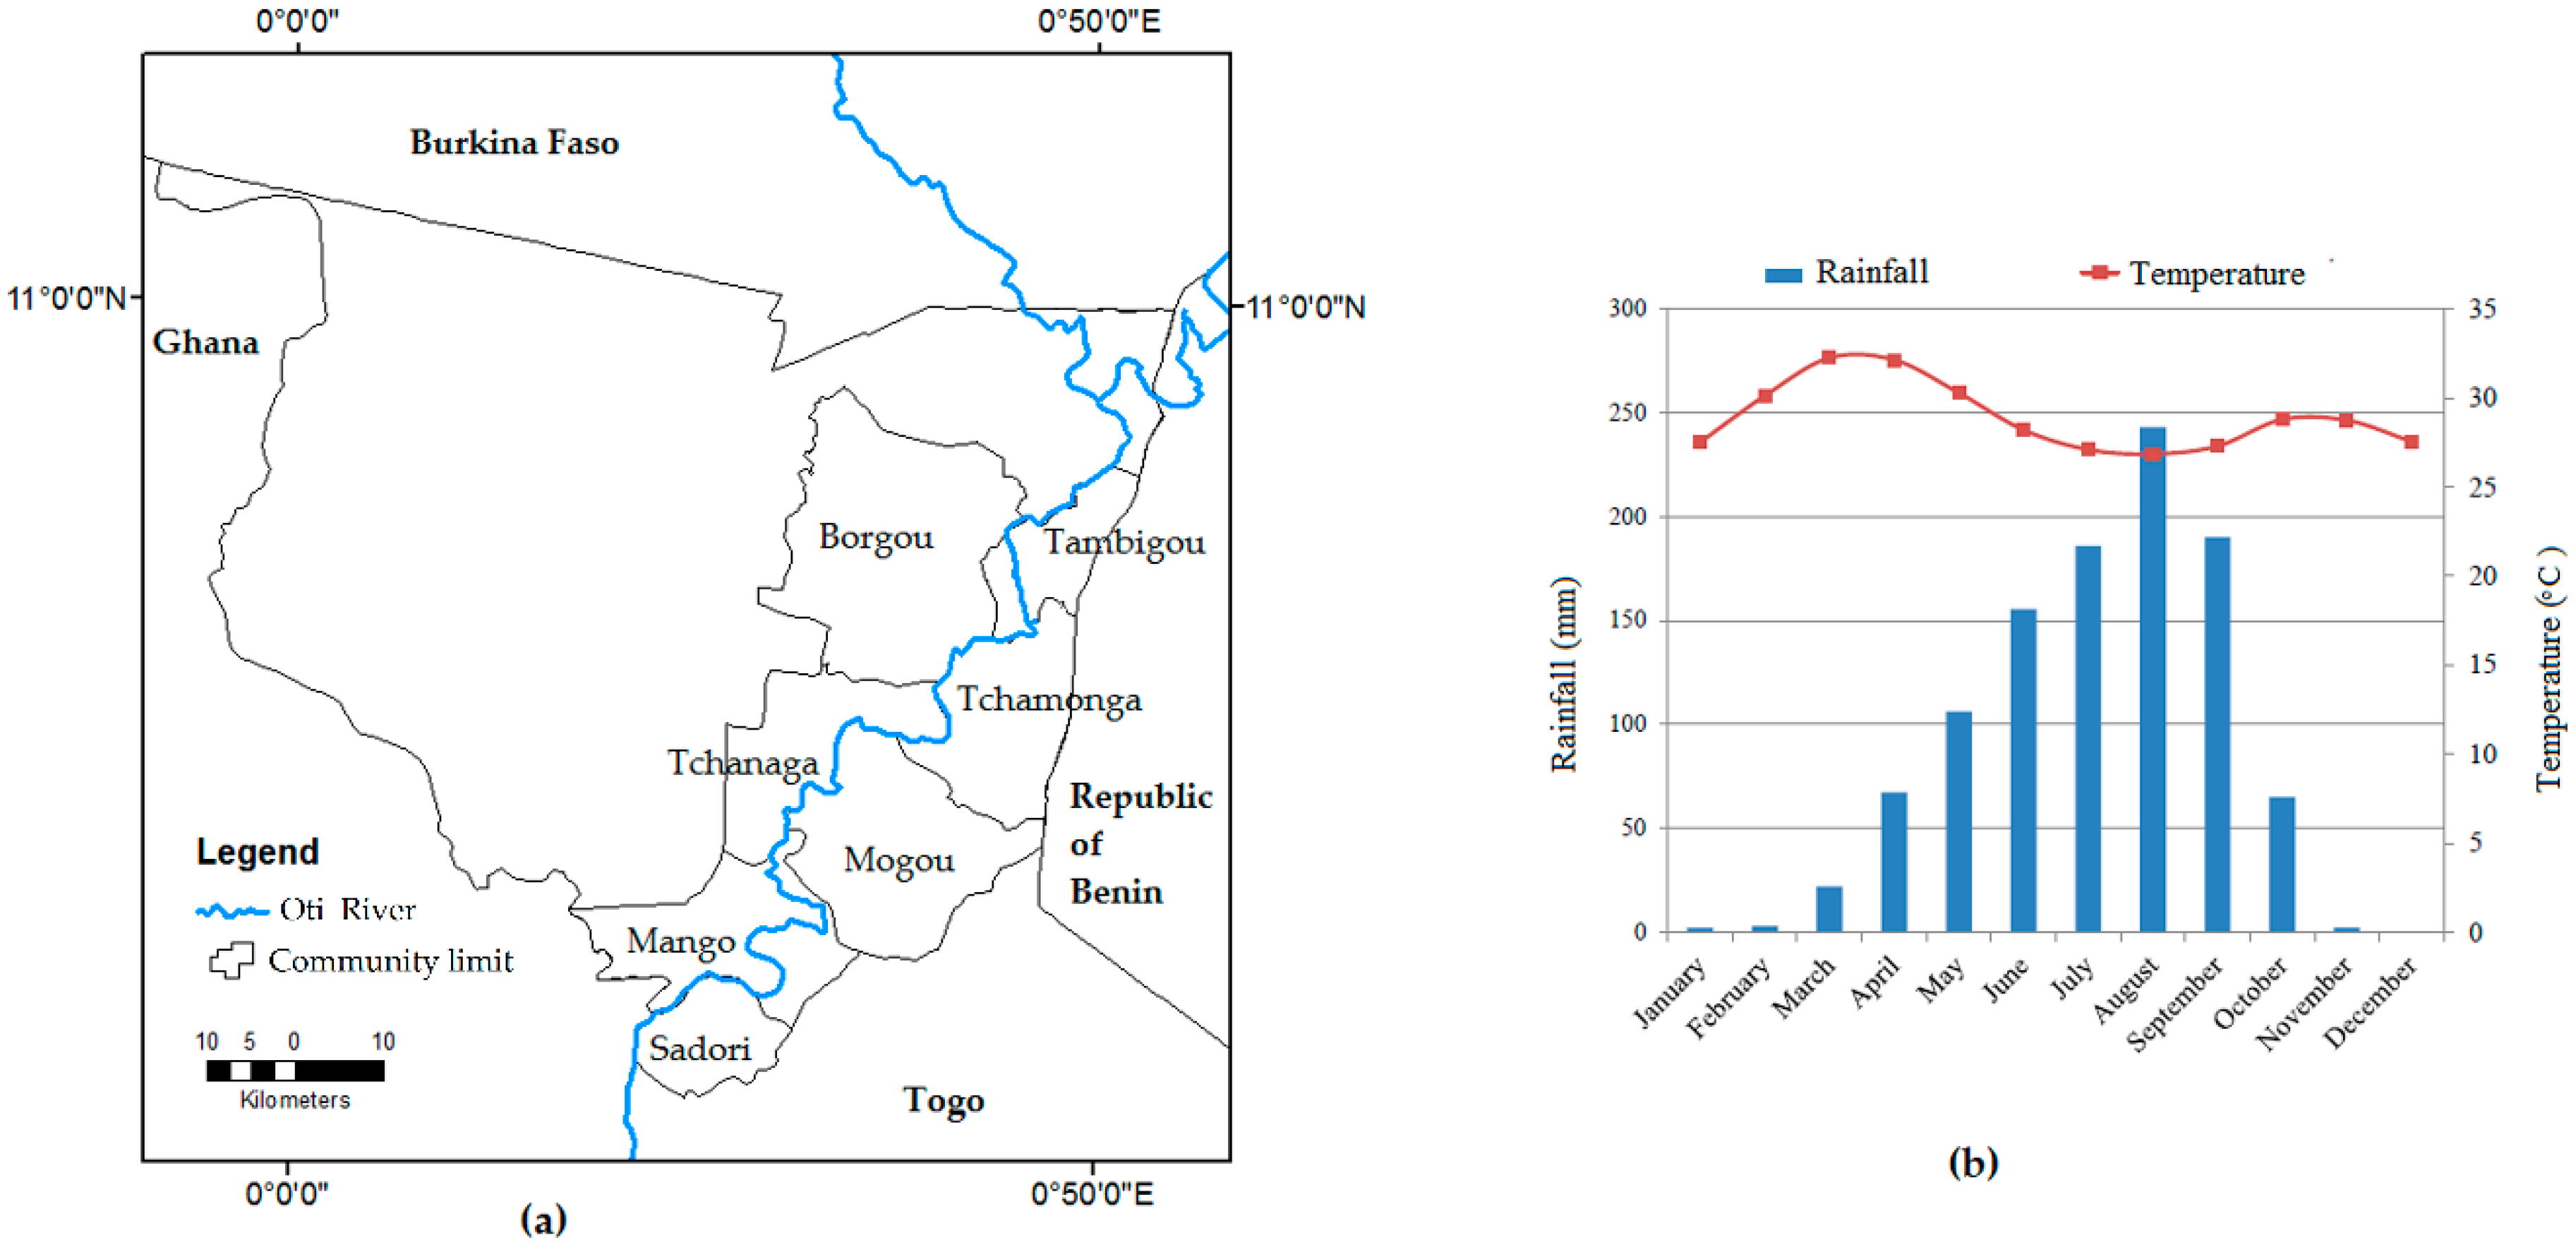
This study performs an integrated flood risk assessment for rural communities of the Oti River Basin in Togo, West Africa. This is important because this basin is subject to frequent flooding, and it is the first time to analyze flood risk in this area. This methodology can be used to support decision-making on possible measures that can be taken and to prioritize areas where actions are required.

2. Materials and Methods

2.1. Study Area

In this study, seven communities of the Oti River Basin in Togo (Figure 1a) are investigated. The climate of this area is tropical semi-arid and is characterized by a rainy season starting from April to October with the maximum rainfall occurring in August (Figure 1b) and a dry season from November to March. With a poverty rate of more than 90% (Table 1), these communities are the poorest in the country. Their livelihoods are derived from subsistence farming, animal husbandry and informal labor, all of which are threatened by the impacts of climate change. Most of the dwellings in the studied area are informal self-housing units, poorly planned and made of mud walls, wooden doors and windows. Consequently, many buildings collapse from the force of the flood water.
Heavy rainfall in September 2007 caused the worst flood that Oti River Basin had ever faced. According to the International Federation of Red Cross and Red Crescent Societies (IFRCRCS), by September 2007, 25 people were killed and 97 people were critically injured [19]. In recent years, the most damaging floods were experienced in 2008, 2010 and 2012.

2.2. Conceptual Framework of the Study

This study applies the CBDRI system, which characterizes the risk of natural disaster via four factors, namely: hazard, exposure, vulnerability, as well as capacity and measures (Equation (1)):
R = f (H,V,E,C),
where R is the flood risk index and H, V, E, C are indices for hazard, vulnerability, exposure as well as coping capacity, and f denotes the function. In this study, a set of 37 indicators are used to quantify the risk index for a given community (Table 2). All indicators for each of the four factors are integrated into one index (e.g., hazard index).

2.3. Data Collection

The application of CBDRI method requires a questionnaire (Table S1) to be administrated at the commune level. In total, seven communities—Sadori, Mango, Mogou, Tchamonga, Tchanaga, Tambigou and Borgou (Figure 1a) in the Oti and Kpendjal prefectures of Togo—were selected for this study because of their proximity to the Oti River. In each community, one questionnaire was completed. In order to get reliable information, only knowledgeable people (members of the local development committee, formal community leader, teacher, etc.) were contacted to fill out the questionnaire. However, some data such as population density (V1), population growth rate (V2), number of housing units (E1) access to basic services (V4) and literacy levels (V6) were obtained from Population and Housing Census data of 2010 [20] and literature. In addition, the percentages of forested area for each community area and flood-prone areas were derived from the FAO (Food and Agriculture Organization) land cover database [22] and NASA MODIS data, respectively. Since the data regarding the hazard factor should be obtained from scientific sources [12], the information on the experienced flood hazards was obtained from the literature while the probability and severity of the possible flood hazard (H2 and H4 ) were obtained through flood hazard mapping of the Oti River Basin.

2.4. Estimation of the Vulnerability, Exposure, Capacity and Measure Indices

To assess the vulnerability, exposure, as well as capacity and measures indices of a risk index for a given community, many steps were followed. The first step consisted of making the different measurement of each indicator (e.g., 10,000 residents, 10% literacy level) comparable using a scale. The scaling was done by assigning a score (S) of one, two or three according to the level of the indicator—low, medium, or high, respectively. A zero value was given if the indicator does not apply for a commune. In a second step, the scores are multiplied by a specific weight (W) of each indicator. The CBDRI model was developed in such a way that the total sum of weights for each of the four factors is equal to 3, so that the factor indices range between 0 and 10. Finally, separate indices were calculated for each factor using the following linear Equations (2)–(5):
V = WV1SV1 + WV2SV2 + WV3SV3 + ...... + WV4SV4,
E = WE1SE1 + WE2SE2 + WE3SE3 + WE4SE4,
C = WC1SC1 + WC2SC2 + ... + WC23SC23,
H = WH1SH1 + WH2SH2 + WH3SH3 + WH4SH4,
where V, E, C and H are the values of the vulnerability, exposure, capacity and measures indices and hazard, respectively; Sxi refers to the scaled value of the indicator for Xi, and Wxi is the weight applied to the indicator Xi.

2.5. Estimation of the Indicator Weight

In the present study, the analytical hierarchy process (AHP) method was employed to compute weights for the different indicators considered in the CBDRI model. The AHP method, which was developed by Saaty [23], is a multi-criteria, mathematically based method which uses a set of pairwise comparison matrices to estimate the relative importance of different criteria and alternatives, among which the best decision is made. Saaty’s AHP model has attracted the interest of many researchers (e.g., [7,24,25,26,27,28,29]) because it has the advantage of incorporating a test for checking the consistency of a choice, thus reducing the uncertainty in the evaluation process.
In order to compute the weights for each indicator, the AHP starts creating a pairwise comparison matrix M = ( B i j ) . Each numerical value B i j of M represents the relative importance of the ith indicator in comparison with the jth indicator. If B i j > 1, then the ith indicator is more important than the jth indicator, whereas if B i j < 1, then the ith indicator is less important than the jth indicator. If two indicators have the same importance, then B i j = 1. The numerical values satisfy the condition given in Equation (6) [23]:
B i j B j i = 1 .
Moreover, the relative importance between two criteria was measured based on a numerical scale from 1 to 9 as follows: 1 = i and j are equally important, 3 = i is slightly more important than j, 5 = i is strongly important than j, 7 = i is very strongly more important than j, 9 = i is extremely more important than j, and 2, 4, 6, 8 are intermediate values between the previous scales [23]. After building the matrix M, a normalized pairwise comparison matrix was derived by dividing each value B i j by the sum of all values of that column. Finally, the relative weight ( W A H P ) vector was estimated by averaging the values on each row of the normalized pairwise comparison matrix. The AHP method requires all indicator weights to satisfy the condition shown in Equation (7) [30]:
i = 1 n W A H P = 1 .
The AHP method provides the possibility to check consistency of the estimated weights. This is done with the consistency ratio (CR), which is shown in Equation (8) [30]:
C R = C I / R I ,
where CI is the consistency index which is obtained by first computing the scalar λ m a x as the average of the elements of the vector whose ith element is the ratio of the ith element of the vector (M* W A H P ) to the corresponding element of the vector W A H P [30]. Then, CI is calculated using the Equation (9):
C I = λ m a x n n 1 ,
where λ m a x is the largest eigenvalue of the matrix and n is the number of indicators. RI is a constant that depends on n. When CR < 0.1, the evaluation is consistent, and reliable results can be expected from the AHP model [23].
In this study, four pairwise comparison matrices (Table 3, Table 4, Table 5 and Table 6) were constructed for the weight estimations of the different indicators used in the CBDRI model. Furthermore, W A H P was multiplied by three to get the final weights ( W x i ) of each indicator.

2.6. Estimation of the Flood Hazard Index

In this study, the indicators of the experienced hazard (H1 and H3) were assessed by answering the corresponding questions based on the literature (e.g., [31,32]). In contrast, the possible hazard components (H2 and H4) of the risk index were characterized in terms of the floodplain inundation level of the 50-year flood, which were obtained through hydraulic modelling with the sub-grid model of LISFLOOD-FP hydraulic model [33] and regional flood frequency analysis performed by Komi et al. [34]. The 50-year flood was chosen because it provides a plausible measure of flood-affected populations [35]. The application of the sub-grid solver of LISFLOOD-FP requires the specification of the streamlines of the river, floodplain topography, river widths, river bank elevation, inflow hydrographs and downstream boundary conditions. In addition, the sub grid channel solver of LISFLOOD-FP has four parameters, namely: the Manning’s friction coefficient separately for channel and floodplain, the exponent (p), and coefficient (r) of the hydraulic geometry. Due to the lack of detailed hydrological data, tributaries of the Oti River Basin were not considered in the flood inundation modelling. For further details on the calibration of LISFLOOD-FP hydraulic model, the reader is referred to Bates et al. [36]. Finally, the flood hazard severity was estimated based on the categorization proposed by Dinh et al. [37] as shown in Table 7. Since each community area has many flood severity classes (FC) to a particular extent, an average flood severity index (FSI) was used to estimate the average flood severity of a given community area. The FSI takes into account the areal extent of a flood’s depth and was calculated using Equation (10) [13]:
FSI = i = 1 n ( F C ) i A i i = 1 n A i ,
where Ai is the areal extent of the flood severity class i, n is the number of flood severity classes and ( F C ) i was represented by the mean depth of the flood severity class (Table 7). Then, the flood hazard index (H) was estimated using Equation (5).

2.7. Estimation of the Flood Risk Index

To calculate the overall flood risk index (R) in the community based system, Equation (11) was used [38]. In this equation, a constant coefficient of 0.03 was multiplied by each factor in order to maintain the same scale between 0 and 10 as for the individual factor indices [12]:
R = 0.03 { H V E [ 0.1 ( 1 a ) C + a ] } ,
where a is a constant ( 0 a 1 ) used to reduce the total flood risk value and it is assumed to be 0.75 [38]. In addition, this equation is based on the conventional mathematical expression of risk as a convolution of hazard, vulnerability and exposure. The coping capacity (C) was added as a reduction factor [38]. Finally, the values of the risk index were grouped into five categories (very low, low, moderate, high and very high) as shown in Table 8.

3. Results

3.1. Scores of the Indicators

As it is expected, there are differences in the scores assigned to some of the indicators in this case study. For example, 57.15%, 28.57% and 14.29% of the studied communities score, respectively, low, medium and high levels for ‘lifelines’ indicator and 14.29%, 57.15% and 28.57% of the communities score, respectively, low, medium and high levels for the ‘area under forest indicator’ (V14). However, these communities have almost the same scores for many indicators, for instance those which characterize the hazard and the social vulnerability. Moreover, the scores obtained for most of the capacity and measures indicators are relatively low and consequently high for the vulnerability indicators. All communities score low levels for many indicators of the ‘coping capacity factor (e.g., C2, C7, C9, C10, C11 and C12) and high levels for many indicators of the vulnerability factor such as poverty level and literacy rate. The low scores for the capacity and measures indicators highlight the insufficiency of social, economic and institutional capacities to cope with extreme floods in the Oti River Basin (Togo).

3.2. Possible Flood Hazardousness

Figure 2 shows the 50-year flood hazard map simulated by the hydraulic model (LISFLOOD-FP). This result is used to estimate the severity of the possible flood hazard (H4). When the set of thresholds applied in Table 7 are considered, all community areas fall in the high flood severity category. Sadori has the highest flood depth while Mango has the lowest (Table 9). This difference in simulated flood depth can be explained by the spatial variability in the local topography and the soil property (permeability) of the studied villages. In addition, it is worth noting that the flood depth in the communities may be higher than simulated, given that flooding from tributaries was not considered in this study.

3.3. Indices of the Risk Factors

Figure 3 shows the indices of the four factors that contribute to the risk in the CBDRI model. The high level of hazard index can be explained by the repeated and catastrophic floods that have impacted the communities of the Oti River Basin during the last two decades (1998, 2007, 2008 and 2010) and the high level of simulated flood depth, while the observed elevated vulnerability index (V) is mainly due, for instance, to the high poverty level of the communities, insufficiency of access to safe drinking water and the little awareness of the majority of the community members regarding their own flood risk.

3.4. Flood Risk Index

As it is shown in Table 10, flood risk in all studied communities is moderate when we consider the classification shown in Table 8. This moderate level of flood risk is associated with a combination of high indices of flood hazard and vulnerability and low indices of capacities and exposure. In addition, Mango has the highest flood risk index (5.01), while the lowest flood risk index is estimated at Tambigou and Tchanaga (4.36). The small difference (0.65) between the highest and lowest flood risk indices is an indication of the relative homogeneity of flood risk across these communities.

4. Discussion

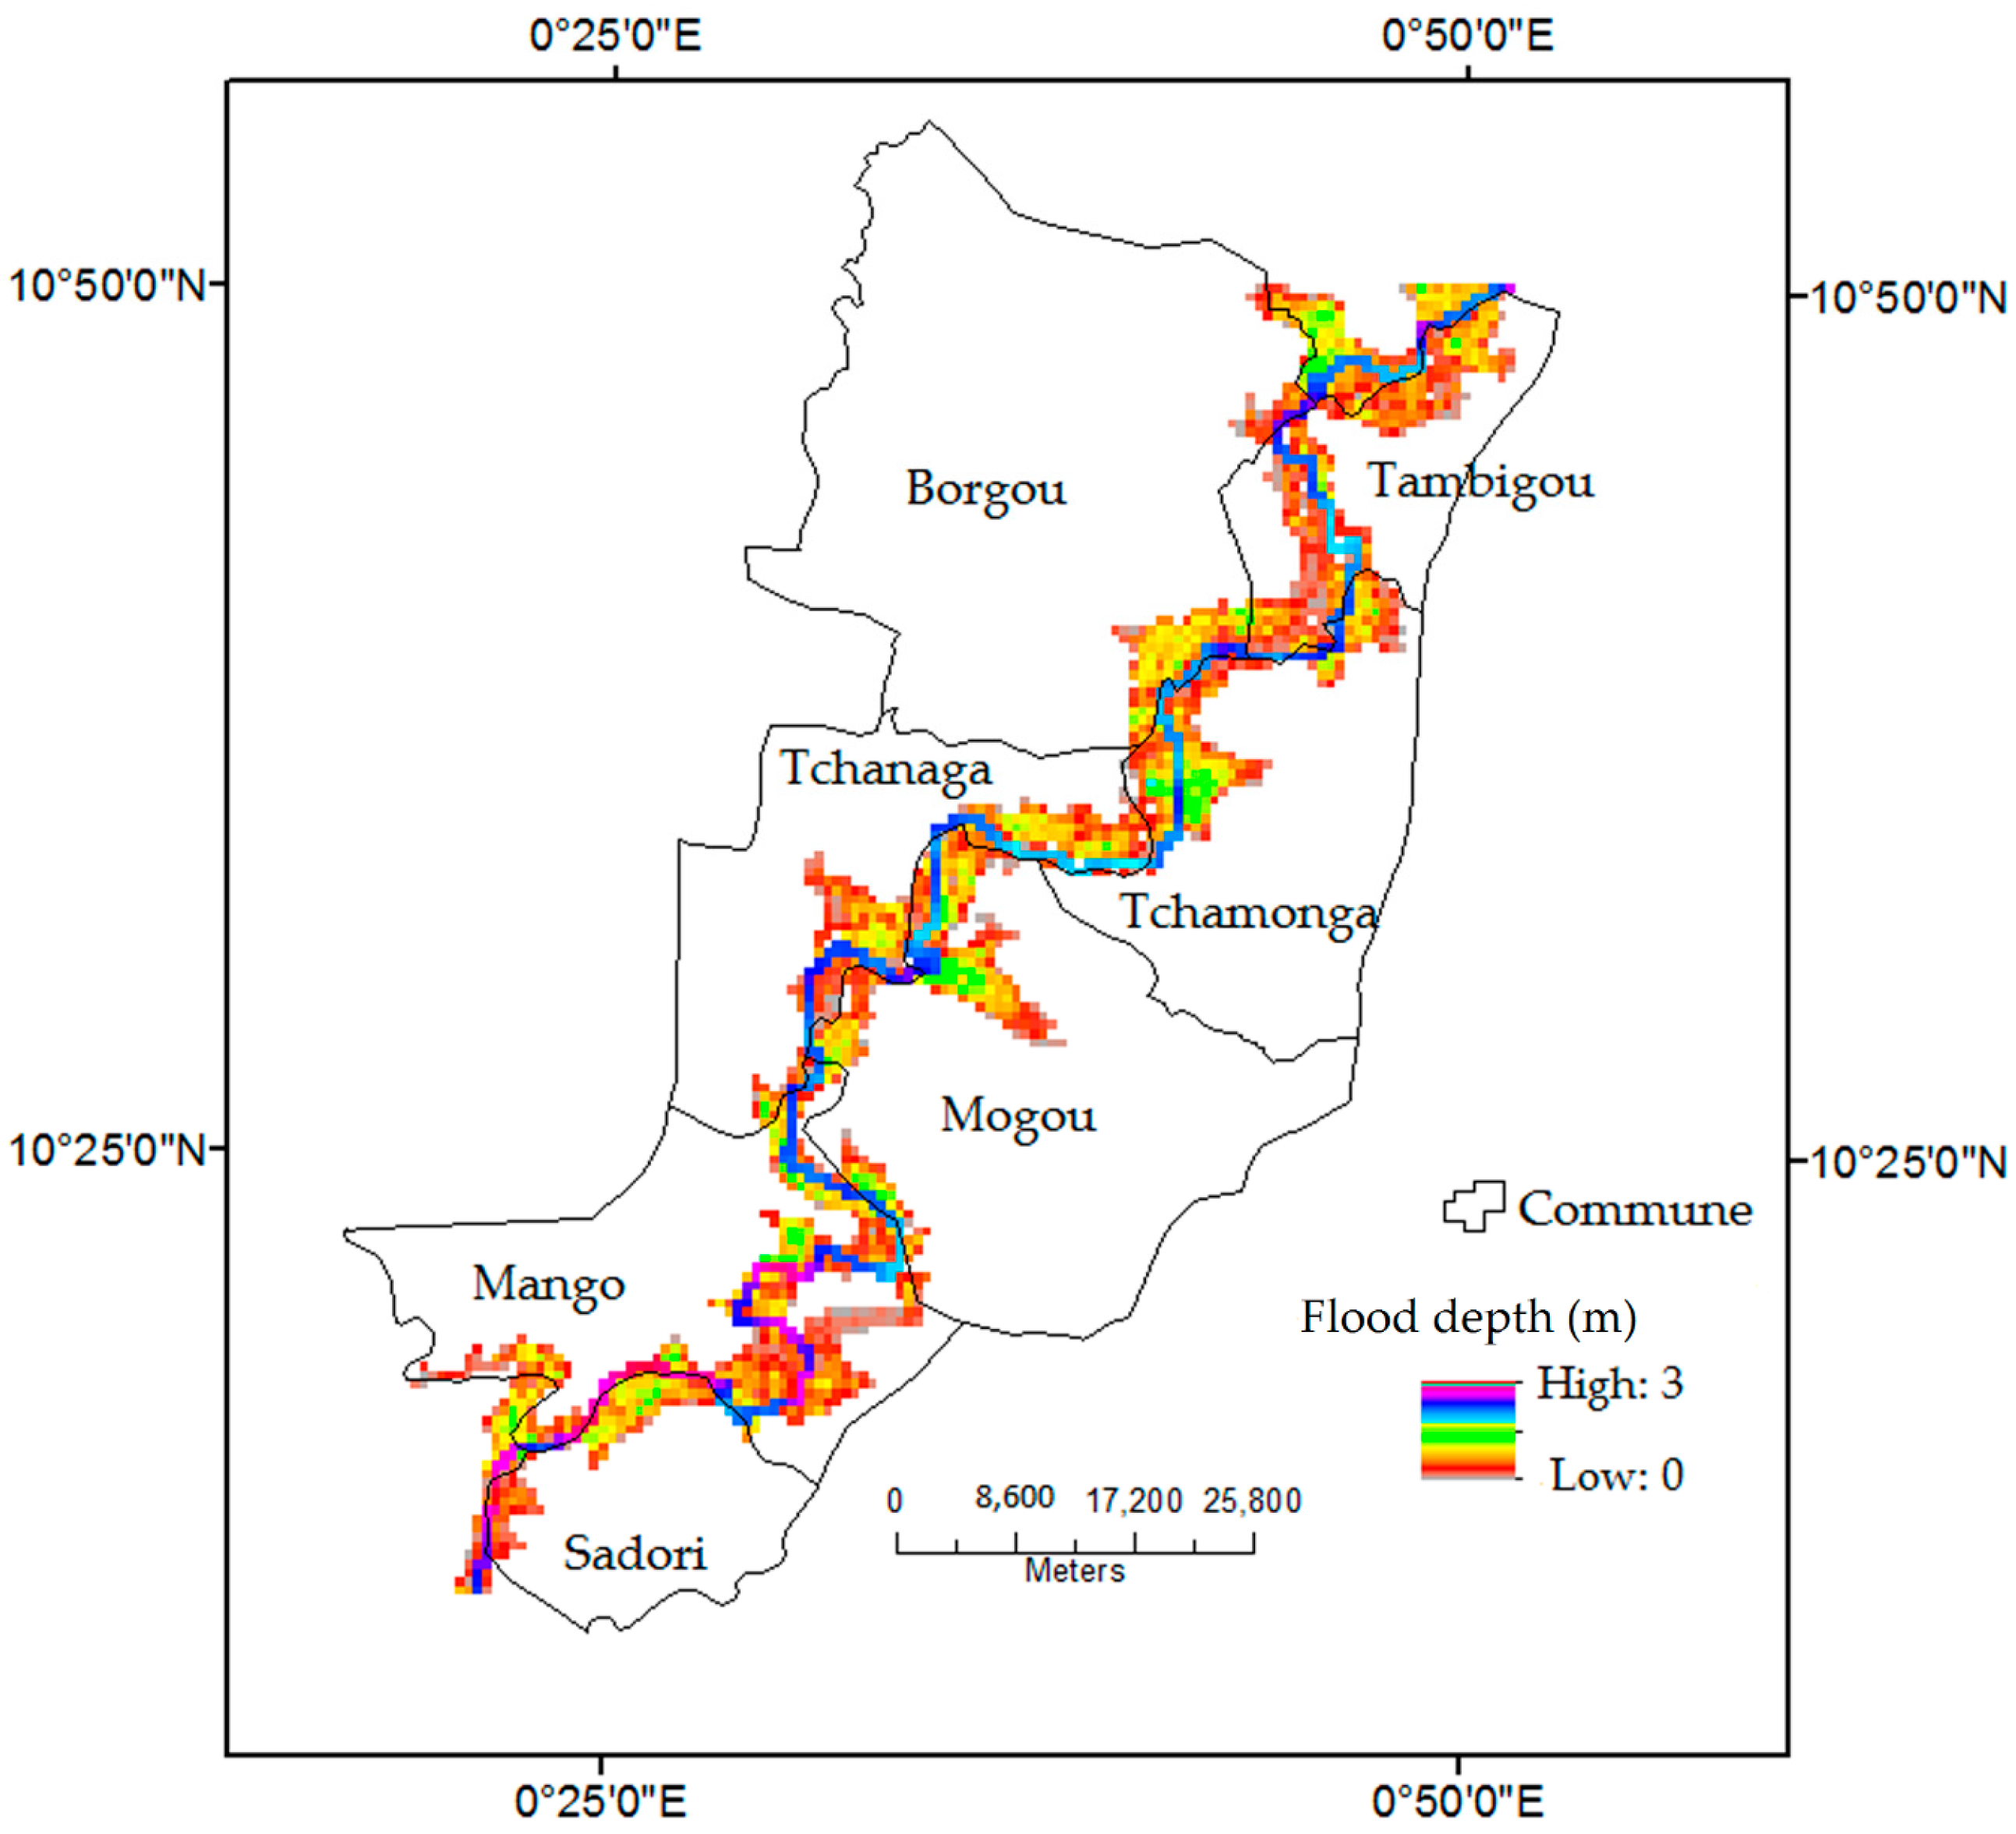
In the present work, a community based disaster risk index system and a simulated 50-year flood hazard map were used to assess quantitatively and qualitatively flood risk for rural communities of the Oti River Basin in Togo (West Africa). Thirty seven (37) indicators of flood risk were considered for the analysis and Saaty’s AHP (analytical hierarchy process) method was applied to estimate the weights of the indicators.
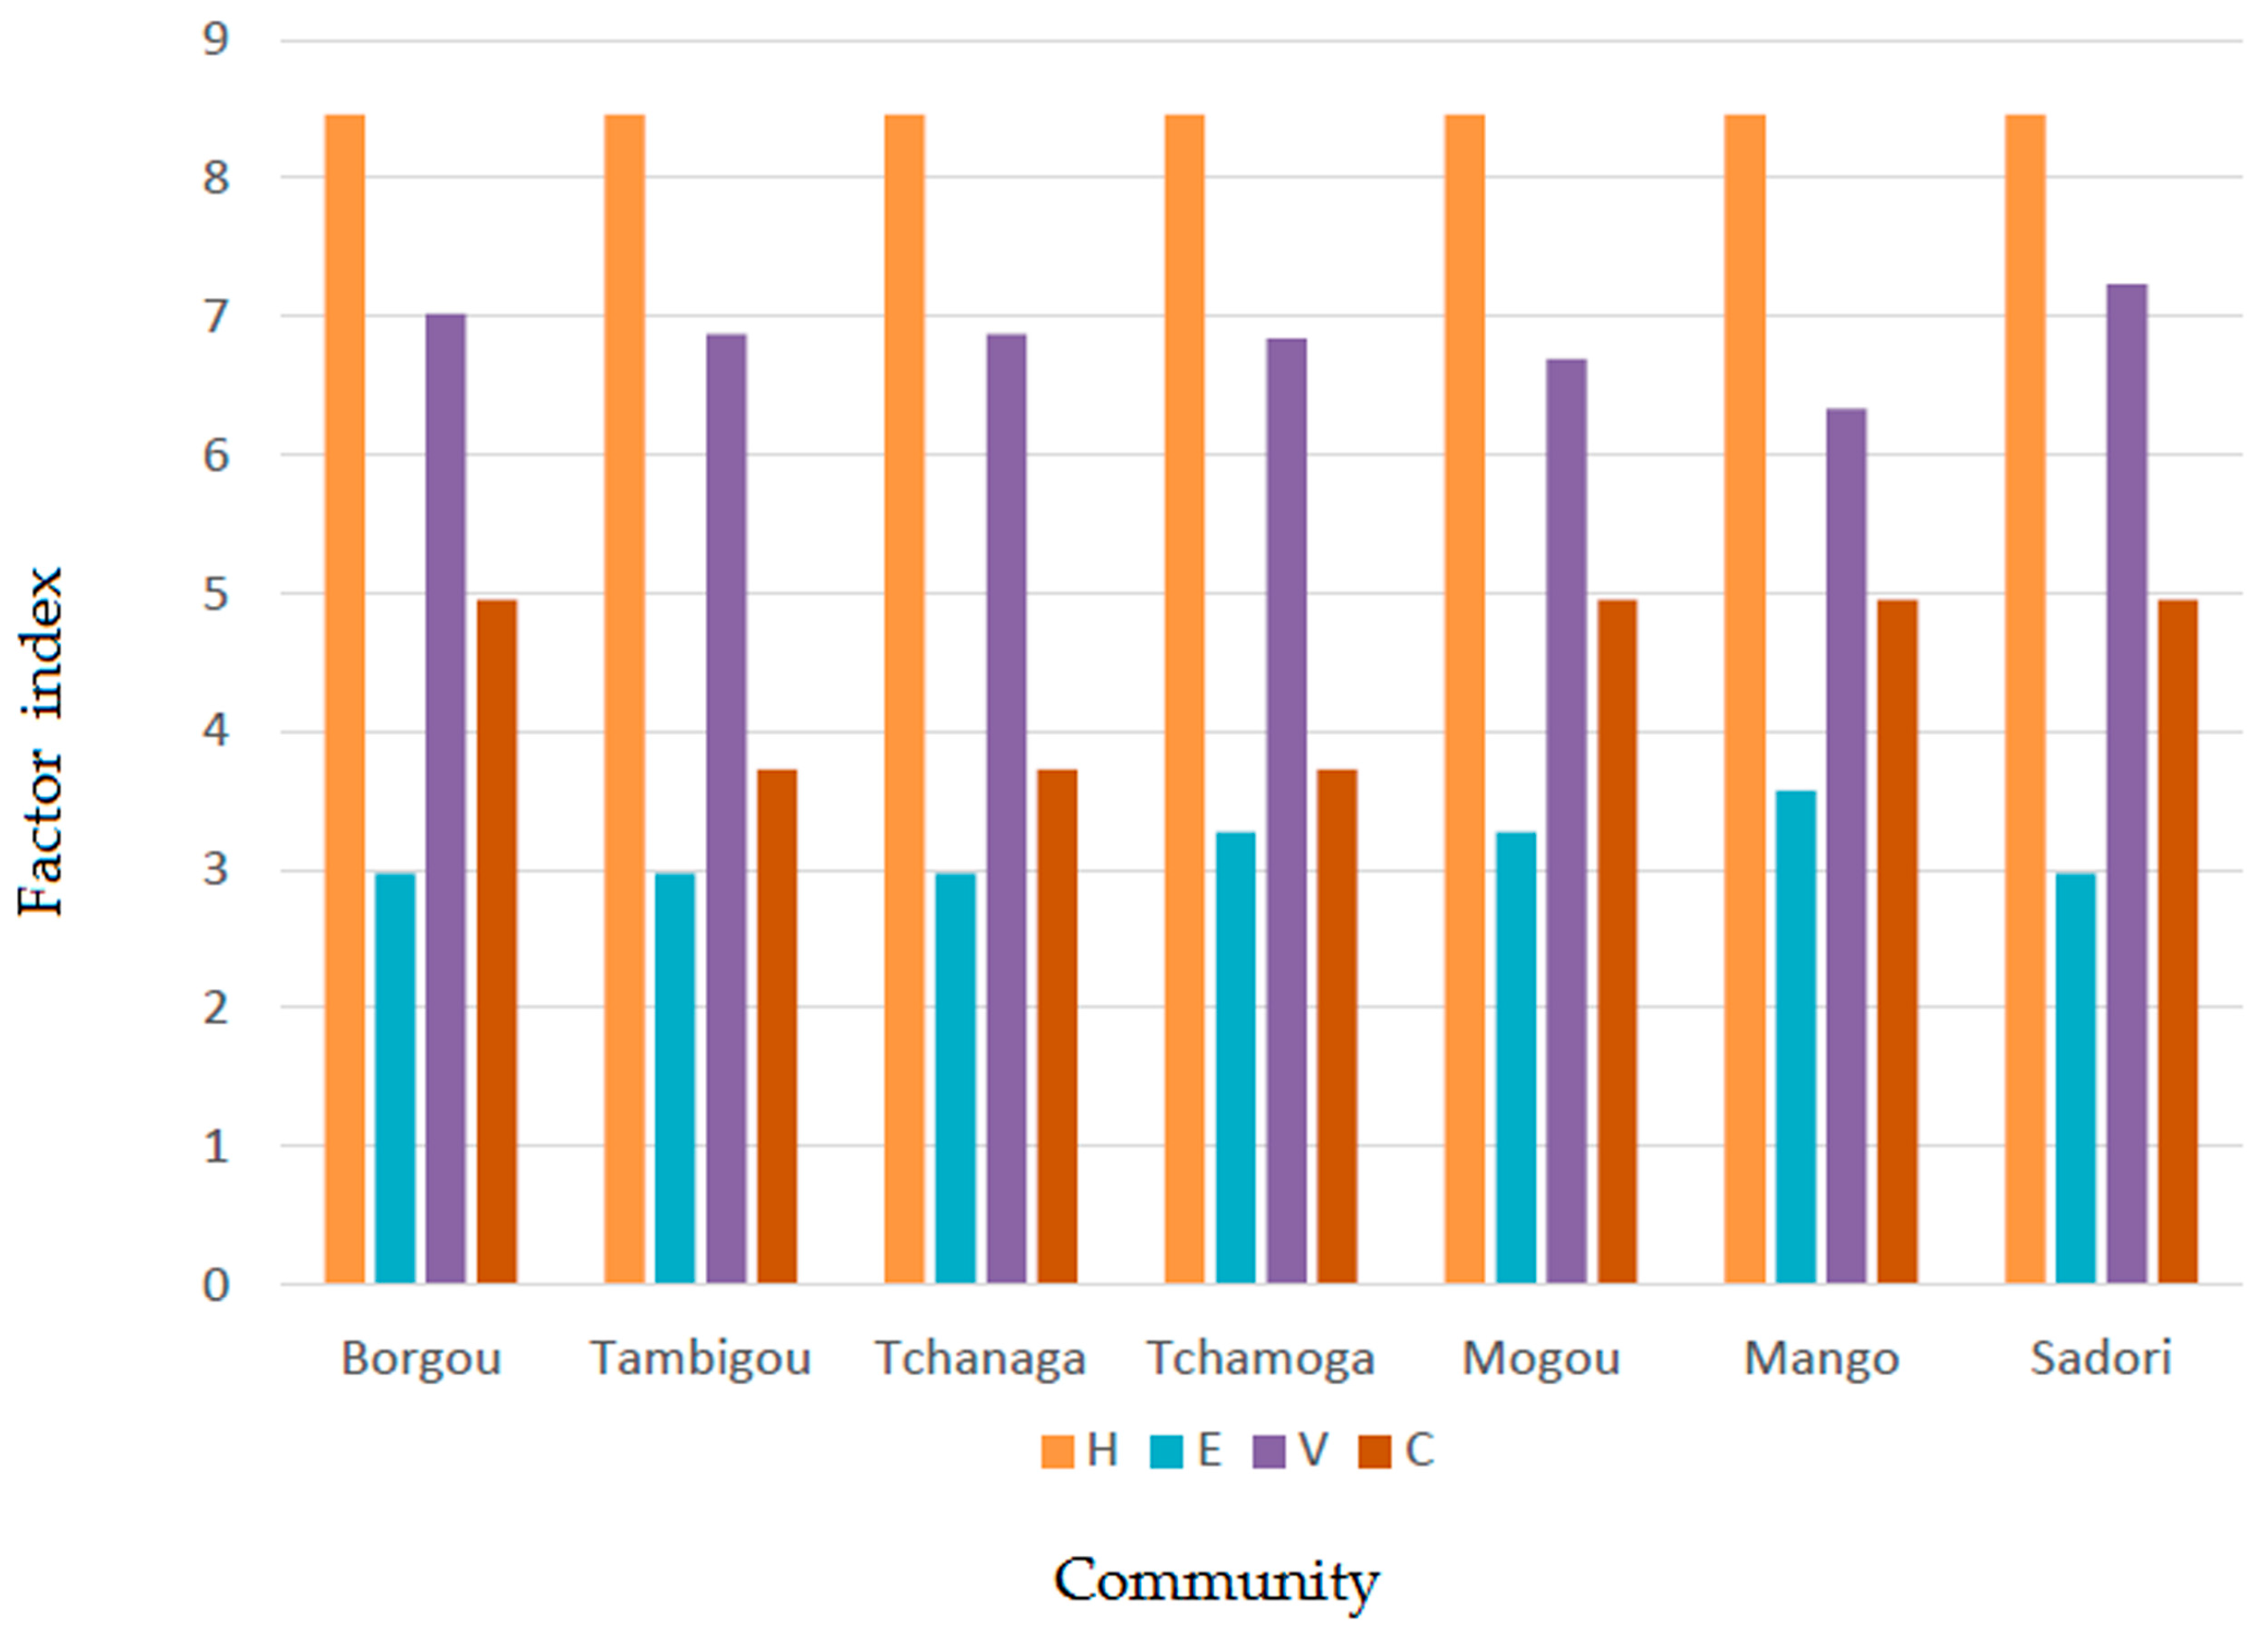
The results showed that the hazard, vulnerability, coping capacity factors are the most important factors in increasing flood risk in the study area. For instance, as shown in Figure 3, the hazard and vulnerability indices are high in all the studied communities. The low index of capacity and measures factor is associated with the insufficiency of the strategies and capacity to mitigate flood risk. For instance, the people interviewed pointed out the absence of flood risk management committees at the village level, non-access to local emergency funds and insurances for house owners. In addition, education and culture of flood risk management are not part of the school curricula. Apart from Sadori, Mango and Borgou, the investigated communities lack early warning systems and emergency plans for floods, although advanced warning systems for floods are very helpful in reducing flood risk and providing emergency response personnel time to prepare for and mitigate damages [39,40]. Consequently, decreasing vulnerability and increasing capacity of the communities to manage their own flood risk should be paramount in order to mitigate flood risk in the study area. For instance, due to the high poverty level in the majority of the community areas (Table 1), creating diverse income-generating opportunities could be essential to reduce the vulnerability of the local population. The results of this study showed the need for non-structural measures to reduce the negative consequences of floods in the study area. These measures include the implementation of advanced early flood warning systems for all the flood-prone communes and public education about flood risk, real involvement of wide range of local actors in national efforts to manage flood risks so that they can contribute as much as possible to the reduction of flood risks in their own localities, and a creation of a culture of awareness in which the population realises the negative impacts of floods on development. Moreover, actions to discourage settlements in flood-prone areas and building codes to make houses more resilient to flooding are useful to mitigate flood risk in the Oti River Basin.
Furthermore, the relative homogeneity observed in the majority of the vulnerability and coping capacity is reasonable because the studied communities are almost the same in their social and economic profiles as shown by their poverty levels (Table 1). In addition, their economic capacities for disaster risk management are also the same: all are funded by non-governmental organisation in the case of flood disasters. They are managed at the top by a central government (lack of decentralization). For this reason, a large difference in vulnerability and capacities in the Oti River Basin at the village scale is unexpected.
The presented flood risk indices summarize complex information about flood risk in a simple way that is easy for non-experts to understand and use in flood risk management policies [12]. However, there are some issues that need to be considered. First, the majority of the data are subjective as they were collected from selected local residents. In addition, the results are dependent on the selected indicators, their categorization, the set of thresholds and the spatial scale of application. Second, the selected indicators are only a simplification of key elements of flood risks and vulnerabilities that we wanted to measure. They are not real measures of these elements themselves. Finally, the return period associated with the simulated flood hazard severity is 50 years. Given the significant contribution of the hazard factor to the total flood risk, the results will differ if floods with lower or higher return periods than 50 years are considered.

5. Conclusions

The risk of riverine flood to community facilities in the Oti River Basin is expected to increase due to the combined effects of climate change and land use changes, economic development and population growth. In 2005, the World Conference on Disaster Reduction emphasized the necessity to incorporate disaster risk assessment into rural planning and management in order to mitigate disaster risk [41]. This study performed a comprehensive flood risk assessment of rural communities in the Oti River Basin of Togo and identified the relative contributions of hazard, exposure, vulnerability, as well as capacity and measure factors to flood risk. While the flood risk for all communities studied is moderate, there were high levels of hazards, vulnerability and a lack of capacity and measures, whereas the exposure is relatively low. The outcomes of this study provide community members as well as government officials with empirical risks and vulnerability evidence. Consequently, the information provided by the community-based disaster risk index system can be used to support decision-makers at local and national levels in order to analyze and understand the flood risk to which a community is exposed. In addition, periodic application of the proposed method can be a measure to examine the projects undertaken to manage flood risks. In order to reduce flood risk in the Oti River Basin, decreasing vulnerability through creation of new income-generating opportunities and increasing capacity of communities to manage their own flood risk should be paramount.

Supplementary Materials

The following are available online at www.mdpi.com/2306-5338/3/4/42/s1, Table S1: questionnaire used in the Community-based Disaster Risk Index, modified from Bollin et al. [12].

Acknowledgments

This work is part of the West African Science Service Center on Climate Change and Adapted Land Use project (WASCAL; www.wascal.org), which is funded by the German Ministry of Education and Research (BMBF). The authors would like to thank the editors and the two anonymous reviewers for the relevant comments and suggestions, which significantly improved the quality of the manuscript.

Author Contributions

Kossi Komi conducted this research as a part of his Ph.D. thesis. Kossi Komi wrote the initial version of the manuscript. Bernd Diekkrüger and Barnabas A. Amisigo supervised the work and helped in improving the manuscript.

Conflicts of Interest

The authors declare no conflict of interest.

Abbreviations

The following abbreviations are used in this manuscript:
AHPAnalytical Hierarchy Process
CBDRICommunity-Based Disaster Risk Index.
DGSCNDirection Générale de la Statistique et de la Comptabilité Nationale (Togo).
FAOFood and Agriculture Organization.
GTZGerman Technical Cooperation Agency.
IFRCRCSInternational Federation of Red Cross and Red Crescent Societies
IPCCIntergovernmental Panel on Climate Change.
ISDRInternational Strategy for Disaster Reduction.
NASANational Aeronautics and Space Administration (United State of America).

References

  1. Tschakert, P.; Sagoe, R.; Ofori-Darko, G.; Codjoe, S.N. Floods in the Sahel: An analysis of anomalies, memory, and anticipatory learning. Clim. Chang. 2010, 103, 471–502. [Google Scholar] [CrossRef]
  2. Guha-Sapir, D.; Vos, F.; Below, R.; Ponserre, S. Annual Disaster Statistical Review 2010: The Numbers and Trends; CRED: Brussels, Belgium, 2011. [Google Scholar]
  3. Mulugeta, G.; Ayonghe, S.; Daby, D.; Dube, O.; Gudyanga, F.; Lucio, F.; Durrheim, R. Natural and Human-Induced Hazards and Disasters in Sub-Saharan Africa; ICSU Regional Office for Africa: Pretoria, South Africa, 2007. [Google Scholar]
  4. Skilodimou, H.; Livaditis, G.; Bathrellos, G.; Verikiou–Papaspiridakou, E. Investigating the flooding events of the urban regions of Glyfada and Voula, Attica, Greece: A contribution to Urban Geomorphology. Geogr. Ann. A 2003, 85, 197–204. [Google Scholar] [CrossRef]
  5. International Strategy for Disaster Reduction (ISDR). Living with Risk: A Global Review of Disaster Reduction Initiatives; United Nations: New York, NY, USA; Geneva, Switzerland, 2004. [Google Scholar]
  6. Moel de, H.; Jongman, B.; Kreibich, H.; Merz, B.; Penning-Rowsell, E.; Ward, J.P. Flood risk assessments at different spatial scales. Mitig. Adapt. Strateg. Glob. Chang. 2015, 20, 865–890. [Google Scholar] [CrossRef]
  7. Bathrellos, G.D.; Karymbalis, E.; Skilodimou, H.D.; Gaki-Papanastassiou, K.; Baltas, E.A. Urban flood hazard assessment in the basin of Athens Metropolitan city, Greece. Environ. Earth Sci. 2016, 75, 319. [Google Scholar] [CrossRef]
  8. Ward, J.P.; Jongman, B.; Weiland, S.F.; Bouwman, A.; van Beek, R.; Bierkens, P.F.M.; Ligtvoet, W.; Winsemius, C.H. Assessing flood risk at the global scale: Model setup, results, and sensitivity. Environ. Res. Lett. 2013, 8, 044019. [Google Scholar] [CrossRef] [Green Version]
  9. Forkuo, E.K. Flood hazard mapping using Aster image data with GIS. Int. J. Geomat. Geosci. 2011, 1, 932–950. [Google Scholar]
  10. Musungu, K.; Motala, S.; Smit, J. Using Multi-criteria Evaluation and GIS for Flood Risk Analysis in Informal Settlements of Cape Town: The Case of Graveyard Pond. S. Afr. J. Geomat. 2012, 1, 92–108. [Google Scholar]
  11. Guarín, P.G. Integrated Local Knowledge into GIS-Based Flood Risk Assessment. The Case of Triangulo and Mabolo Communities in Naga City (Philippines). Ph.D. Thesis, International Institute for Geo-Information Science and Earth Observation (ITC), Enschede, The Netherlands, 2008. [Google Scholar]
  12. Bollin, C.; Cardenas, C.; Hahn, H.; Vasta, K.S. Natural Disasters Network: Comprehensive Risk Management by Communities and Local Governments; Inter-American Development Bank: Washington, DC, USA, 2003. [Google Scholar]
  13. Adeloye, J.A.; Mwale, D.F.; Dulanya, Z. A metric-based assessment of flood risk and vulnerability of rural communities in the Lower Shire Valley, Malawi. Proc. IAHS 2015, 370, 139–145. [Google Scholar] [CrossRef]
  14. Gesellschaft für Technische Zusammenarbeit. Community-Based Disaster Risk Management Approach: Experience Gained in Central America; Deutsche Gesellschaft für Technische Zusammenarbeit (GTZ): Eschborn, Germany, 2003. [Google Scholar]
  15. Meyer, V.; Scheuer, S.; Haase, D. A multicriteria approach for flood risk mapping exemplified at the Mulde River, Germany. Nat. Hazards 2009, 48, 17–39. [Google Scholar] [CrossRef]
  16. Apel, H.; Thieken, H.A.; Merz, B.; Blӧschl, G. Flood risk assessment and associated uncertainty. Nat. Hazards Earth Syst. Sci. 2004, 4, 295–308. [Google Scholar] [CrossRef]
  17. Birkmann, J. Risk and vulnerability indicators at different scales: Applicability, usefulness and policy implications. Environ. Hazards 2007, 7, 20–31. [Google Scholar] [CrossRef]
  18. Gall, M. Indices of Social Vulnerability to National Hazards: A Comparative Evaluation. Ph.D. Thesis, University of South Carolina, Columbia, SC, USA, 2007. [Google Scholar]
  19. International Federation of Red Cross and Red Crescent Societies (IFRCRCS). West Africa: Flood in Ghana and Togo, Emergency Appeal No MDR61002; IFRCRCS: Geneva, Switzerland, 2007. [Google Scholar]
  20. Direction Générale de la Statistique et de la Comptabilité Nationale (DGSCN). Fourth Population and Housing Census in Togo, Republic of Togo; DGSCN: Lomé, Togo, 2010. (In French) [Google Scholar]
  21. Coulombe, H.; Gentry, A.; Amouzouvi, K. TOGO: Mapping of Poverty 2011, Beyond Productions, Lomé, Togo, 2011. (In French). Available online: http://www.togoinfo.tg/publications-togoinfo-tg/finish/7-quibb/12-cartographie-de-pauvrete-2011/0 (accessed on 1 December 2015).
  22. Food and Agriculture Organization of the United Nations (FAO). Land Cover Map of Togo. 2013. Available online: http://data.fao.org/map?entryId=3af5c4ff-865e-4274-af69-4283cf41d41b (accessed on 30 September 2015).
  23. Saaty, T.L. A scaling method for priorities in hierarchical structures. J. Math. Psychol. 1977, 15, 234–281. [Google Scholar] [CrossRef]
  24. Saaty, T.L. How to make a decision: The Analytic Hierarchy Process. Eur. J. Oper. Res. 1990, 48, 2–26. [Google Scholar] [CrossRef]
  25. Marinoni, O. Implementation of the analytical hierarchy process with VBA in ArcGIS. Comput. Geosci. 2004, 30, 637–646. [Google Scholar] [CrossRef]
  26. Omkarprasad, V.; Sushil, K. Analytic hierarchy process: An overview of applications. Eur. J. Oper. Res. 2006, 169, 1–29. [Google Scholar]
  27. Bathrellos, G.D.; Gaki-Papanastassiou, K.; Skilodimou, H.D.; Papanastassiou, D.; Chousianitis, K.G. Potential suitability for urban planning and industry development by using natural hazard maps and geological—Geomorphological parameters. Environ. Earth Sci. 2012, 66, 537–548. [Google Scholar] [CrossRef]
  28. Bathrellos, G.D.; Gaki-Papanastassiou, K.; Skilodimou, H.D.; Skianis, G.A.; Chousianitis, K.G. Assessment of rural community and agricultural development using geomorphological-geological factors and GIS in the Trikala prefecture (Central Greece). Stoch. Environ. Res. Risk Assess. 2013, 27, 573–588. [Google Scholar] [CrossRef]
  29. Danumah, H.J.; Odui, N.S.; Saley, M.B.; Srarzynski, J.; Thiel, M.; Kwaku, A.; Kwame, K.F.; Akpa, Y.L. Flood risk assessment and mapping in Abidjan district using multi-criteria analysis (AHP) model et geoinformation techniques, (Cote d’ivoire). Geoenviron. Dis. 2016, 3, 10. [Google Scholar] [CrossRef]
  30. Saaty, L.T. Decision making with the analytic hierarchy process. Int. J. Serv. Sci. 2008, 1, 83–98. [Google Scholar] [CrossRef]
  31. Ministry of Environment and Forestal Resources. National Adaptation Strategies to Climate Change; Ministry of Environment and Forestal Resources: Lomé, Togo, 2009. (In French)
  32. Paeth, H.; Fink, H.A.; Pohle, S.; Keis, F.; Mächel, H.; Samimi, C. Meteorological characteristics and potential causes of the 2007 flood in sub-Saharan Africa. Int. J. Climatol. 2011, 31, 1908–1926. [Google Scholar] [CrossRef]
  33. Neal, J.; Schumann, G.; Bates, P. A subgrid channel model for simulating river hydraulics and floodplain inundation over large and data sparse areas. Water Resour. Res. 2012, 48, W11506. [Google Scholar] [CrossRef]
  34. Komi, K.; Amisigo, A.B.; Diekkrüger, B.; Hountondji, C.C.F. Regional Flood Frequency Analysis in the Volta River Basin, West Africa. Hydrology 2016, 3, 5. [Google Scholar] [CrossRef]
  35. Hirabayashi, Y.; Kanae, S. First estimate of the future global population at risk of flooding. Hydrol. Res. Lett. 2009, 3, 6–9. [Google Scholar] [CrossRef]
  36. Bates, P.D.; Trigg, M.; Neal, J.; Dabrowa, A. LISFLOOD-FP: User Manual, Code Release 6.0.4; School of Geographical Sciences, University of Bristol: Bristol, UK, 2013. [Google Scholar]
  37. Dinh, Q.; Balica, S.; Popescu, I.; Jonoski, A. Climate Change Impact on Flood Hazard, Vulnerability and Risk of the Long XuyenQuadrangle in the Mekong Delta. Int. J. River Basin Manag. 2012, 10, 103–120. [Google Scholar] [CrossRef]
  38. Davidson, R.; Lambert, K. Comparing the Hurricane Disaster Risk of U.S. Coastal Counties. Nat. Hazards Rev. 2001, 2, 132–142. [Google Scholar] [CrossRef]
  39. Givati, A.; Gochis, D.; Rummler, T.; Kunstmann, H. Comparing One-Way and Two-Way Coupled Hydrometeorological Forecasting Systems for Flood Forecasting in the Mediterranean Region. Hydrology 2016, 3, 19. [Google Scholar] [CrossRef]
  40. Massari, C.; Brocca, L.; Ciabatta, L.; Moramarco, T.; Gabellani, S.; Albergel, C.; De Rosnay, P.; Puca, S.; Wagner, W. The Use of H-SAF Soil Moisture Products for Operational Hydrology: Flood Modelling over Italy. Hydrology 2015, 2, 2–22. [Google Scholar] [CrossRef]
  41. International Strategy for Disaster Reduction (ISDR). Hyogo Framework for Action 2005–2015: Building the Resilience of Nations and Communities to Disasters. In Proceedings of the World Conference on Disaster Reduction, Kobe, Hyogo, Japan, 18–22 January 2005.
Figure 1. (a) location of the study area; and (b) climate diagram at Mango from 1980 to 2010.
Hydrology 03 00042 g001
Figure 2. Simulated 50-year flood map of the Oti River Basin in Togo.
Hydrology 03 00042 g002
Figure 3. Computed indices of the four risk factors for the different communities. C, H, V and E stand for capacities, hazard, vulnerability and exposure indices.
Hydrology 03 00042 g003
Table 1. Socio-economic characteristics of the selected communities.
CharacteristicsTambigouBorgouTchamongaTchanagaMangoMogouSadori
Density 1 (habitants per km2)1617118291712
Area (km2)164630298267342432156
Literacy level (%) 2*25211831812231
Poverty level (%) 296.796.395.995.840.896.296.5
Area under forest (% of total area)219824301871
Rate of access to safe drinking water (%) 27.810.842.61.584.139.12.3
Area prone to flood (% of total area)25121924291838
Number of housing units 18183441103158228082309459
1 Source: DGSCN [20]; 2 Source: Coulombe et al. [21]; * Literacy level is defined as the percentage of adult population that can read.
Table 2. The selected factors and indicators used in the analysis (modified from Bollin et al. [12]).
Factor ComponentIndicator NameIndicator
HAZARD
Probability(H1) Occurrence (experienced events)Frequency of events in the past 30 years
(H2) Occurrence (possible events)Probability of possible events. Chances per year
Severity(H3) Intensity (experienced events)Intensity of the worst event in the past 30 years
(H4) Intensity (possible events)Expected intensity of possible events
EXPOSURE
Structures(E1) Number of housing unitsNumber of housing units (Living quarter)
(E2) Lifelines% of homes with piped drinking water
Population(E3) Local gross domestic productTotal locally generated GDP in constant currency
Economy(E4) Total resident populationTotal resident population
VULNERABILITY
Physical/
Demographic
(V1) DensityPeople per km2
(V2) Demographic pressurePopulation growth rate
(V3) Unsafe settlementHomes in hazard prone area (ravines, river banks, etc.)
(V4) Access to basic services% of homes with piped drinking water
Social(V5) Poverty level% of population below poverty level
(V6) Literacy rate% of adult population that can read and write
(V7) AttitudePriority of a population to protect against a hazard
(V8) DecentralisationPortion of self-generated revenues of the total budget
(V9) Community participation% of voter turnout at last commune election
Economic(V10) Local resource baseTotal available local budget in USS
(V11) DiversificationEconomic sector mix for employees
(V12) Stability% of businesses with fewer than 20 employees
(V13) AccessibilityNumber of interruption of road access in last 5 years
Environmental(V14) Area under forest% Area of the commune covered with forest
CAPACITY and MEASURES
Physical planning and engineering(C1) Land use planningEnforced land use plan or zoning regulation
(C2) Preventive structureExpected effect of impact-limiting structures
(C3) Environmental managementMeasures that promote and enforce nature preservation
Societal capacity Economic capacity(C4) Public awareness programsFrequency of public awareness programmes
(C5) School curriculaScope of relevant topics taught at school
(C6) Public participationEmergency committee with public representatives
(C7) Access to local emergency fundsRelease period of national emergency funds
(C8) Access to international emergency fundsAccess to international emergency funds
(C9) Insurance marketAvailability of insurance for buildings
Management and institutional capacity(C10) Risk management committeeMeeting frequency of a commune committee
(C11) Risk mapAvailability and circulation of risk maps
(C12) Emergency planAvailability and circulation of emergency plans
(C13) Early warning systemEffectiveness of early warning system
(C14) Institutional capacity buildingFrequency of training for local institutions
(C15) CommunicationFrequency of contact with district level risk institutions
Table 3. The weights estimated from the analytical hierarchy process model and the final weights for the indicators of the hazard factor. For the definition of H1, H2, H3 and H4, see Table 2.
H1H2H3H4 W A H P W x i
H1111/320.20.6
H21/21 20.180.54
H333120.471.41
H41/21/21/210.150.45
CR = 0.01
Table 4. The weights estimated from the analytical hierarchy process model and the final weights for the indicators of the exposure factor. For the definition of E1, E2, E3 and E4, see Table 2.
E1E2E3E4 W A H P W x i
E11221/30.220.66
E21/211/21/50.10.3
E31/2211/30.150.45
E435310.521.56
CR = 0.02
Table 5. The weights estimated from the analytical hierarchy process model and the final weight for the indicators of the vulnerability factor. For the definition of V1, V2…V14, see Table 2.
V1V2V3V4V5V6V7V8V9V10V11V12V13V14 W A H P W x i
V1111/221/23232123220.100.3
V2 11/221/23232123220.100.3
V3 1325353235330.170.51
V4 11/22121212110.060.18
V5 13232223220.120.36
V6 11/211/21/31/211/21/20.030.09
V7 1211/212110.050.15
V8 111/31/211/21/20.030.09
V9 11/212110.050.15
V10 123220.090.27
V11 12110.050.15
V12 11/21/20.030.09
V13 110.050.15
V14 10.050.15
CR = 0.01
Table 6. The weights estimated from the analytical hierarchy process model and the final weights for the indicators of the capacity and measure factor. For the definition of C1, C2…C15, see Table 2.
C1C2C3C4C5C6C7C8C9C10C11C12C13C14C15 W A H P W x i
C11232231123221/3220.100.3
C2 121221/21/212111/3110.060.18
C3 11/21/211/31/31/211/21/21/51/21/20.030.09
C4 1121/21/211/2111/3110.050.15
C5 121/21/212111/3110.050.15
C6 11/31/31/211/21/21/51/21/20.030.09
C7 1123221/3220.100.3
C8 123221/3220.100.3
C9 12111/3110.050.15
C10 11/21/21/51/21/20.030.09
C11 111/3110.050.15
C12 11/3110.050.15
C13 1330.180.54
C14 110.050.15
C15 10.050.15
CR = 0
Table 7. Categorization of flood hazard severity [36].
Flood Depth (m)HazardseverityDefinition of Hazard Severity
0–0.2Very lowThe damage to property is expected to be very low
0.2–0.5LowThe number of casualties due to floods, in terms of death or injuries, is insignificant, and the damage to property is expected to be relatively low
0.5–1.0MediumCausalities, in terms of death and injuries are considerable, relative to the number of people living in the area under study.
1.0–2.0HighDamage to property is extensive and the probability of having dead and injured people is high.
Table 8. Categorization of the flood risk index used in this study.
Range of the Flood Risk IndexRisk Zone
0–2Very low
2–4Low
4–6Moderate
6–8High
8–10Very high
Table 9. Averaged flood depth for the 50-year flood at the different communities in the Oti River Basin.
CommunityAveraged Flood Depth (m)Severity
Borgou1.57High
Tambigou1.53High
Tchanaga1.56High
Tchamonga1.54High
Mogou1.60High
Mango1.52High
Sadori1.62High
Table 10. Flood risk index of the different communities.
CommunitiesBorgouTambigouTchanagaTchamogaMogouMangoSadori
Risk index4.624.364.364.784.855.014.76

