Article

Spatiotemporal and Future Changes in Water Use Efficiency in the Agro-Pastoral Ecotone of Northern China Under Climate Warming and Vegetation Greening


1
Department of Municipal and Environmental Engineering, Hebei University of Architecture, Zhangjiakou 075000, China
2
Hebei Key Laboratory of Water Quality Engineering and Comprehensive Utilization of Water Resources, Hebei University of Architecture, Zhangjiakou 075000, China
3
Center for Agricultural Resources Research, Institute of Genetics and Developmental Biology, Chinese Academy of Sciences, Shijiazhuang 050022, China
4
School of Instrumentation Science and Opto-electronics Engineering, Beijing Information Science & Technology University, Beijing 100092, China
*
Author to whom correspondence should be addressed.
Hydrology 2026, 13(8), 205; https://doi.org/10.3390/hydrology13080205
Submission received: 22 May 2026 / Revised: 24 July 2026 / Accepted: 26 July 2026 / Published: 28 July 2026

Abstract

The water use efficiency (WUE) in North China is undergoing rapid changes due to climate warming and vegetation “greening”, significantly impacting the ecosystem’s carbon and water cycles. Existing research lacks quantitative analysis of WUE or an understanding of future trends. This study selected the rapidly greening Agro-Pastoral Ecotone of Northern China (APENC) as a case study, utilizing linear regression, Hurst index analysis, and residual analysis to analyze the past and future changes and driving mechanisms of WUE. The results indicated that: (1) The multi-year (2001–2023) annual mean WUE in the APENC spatially ranged from 0.32 to 2.50 g C kg−1 H2O. (2) Gross primary productivity (GPP), evapotranspiration (ET), and WUE showed significant increasing trends of 10.22 g C m−2 yr−2, 5.62 kg H2O m−2 yr−2, and 0.01 g C kg−1 H2O yr−1, respectively. (3) Precipitation had highly positive impacts on GPP and ET, while non-climatic factors (land use, human activities, etc.) explained 62% of WUE variations in the APENC, and energy conditions (air temperature and solar radiation) were not the decisive factor of WUE. (4) The Hurst exponent of WUE indicates that WUE in the APENC region generally exhibits anti-persistent behavior. In terms of future trends, WUE is projected to shift from rising to declining in 58.9% of the region, while 28.5% is expected to continue increasing.

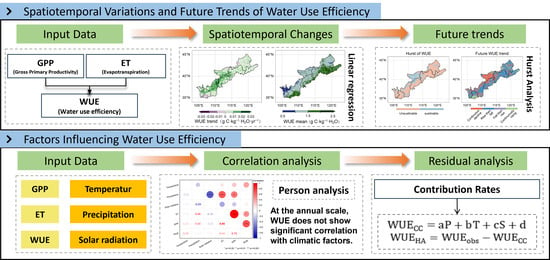
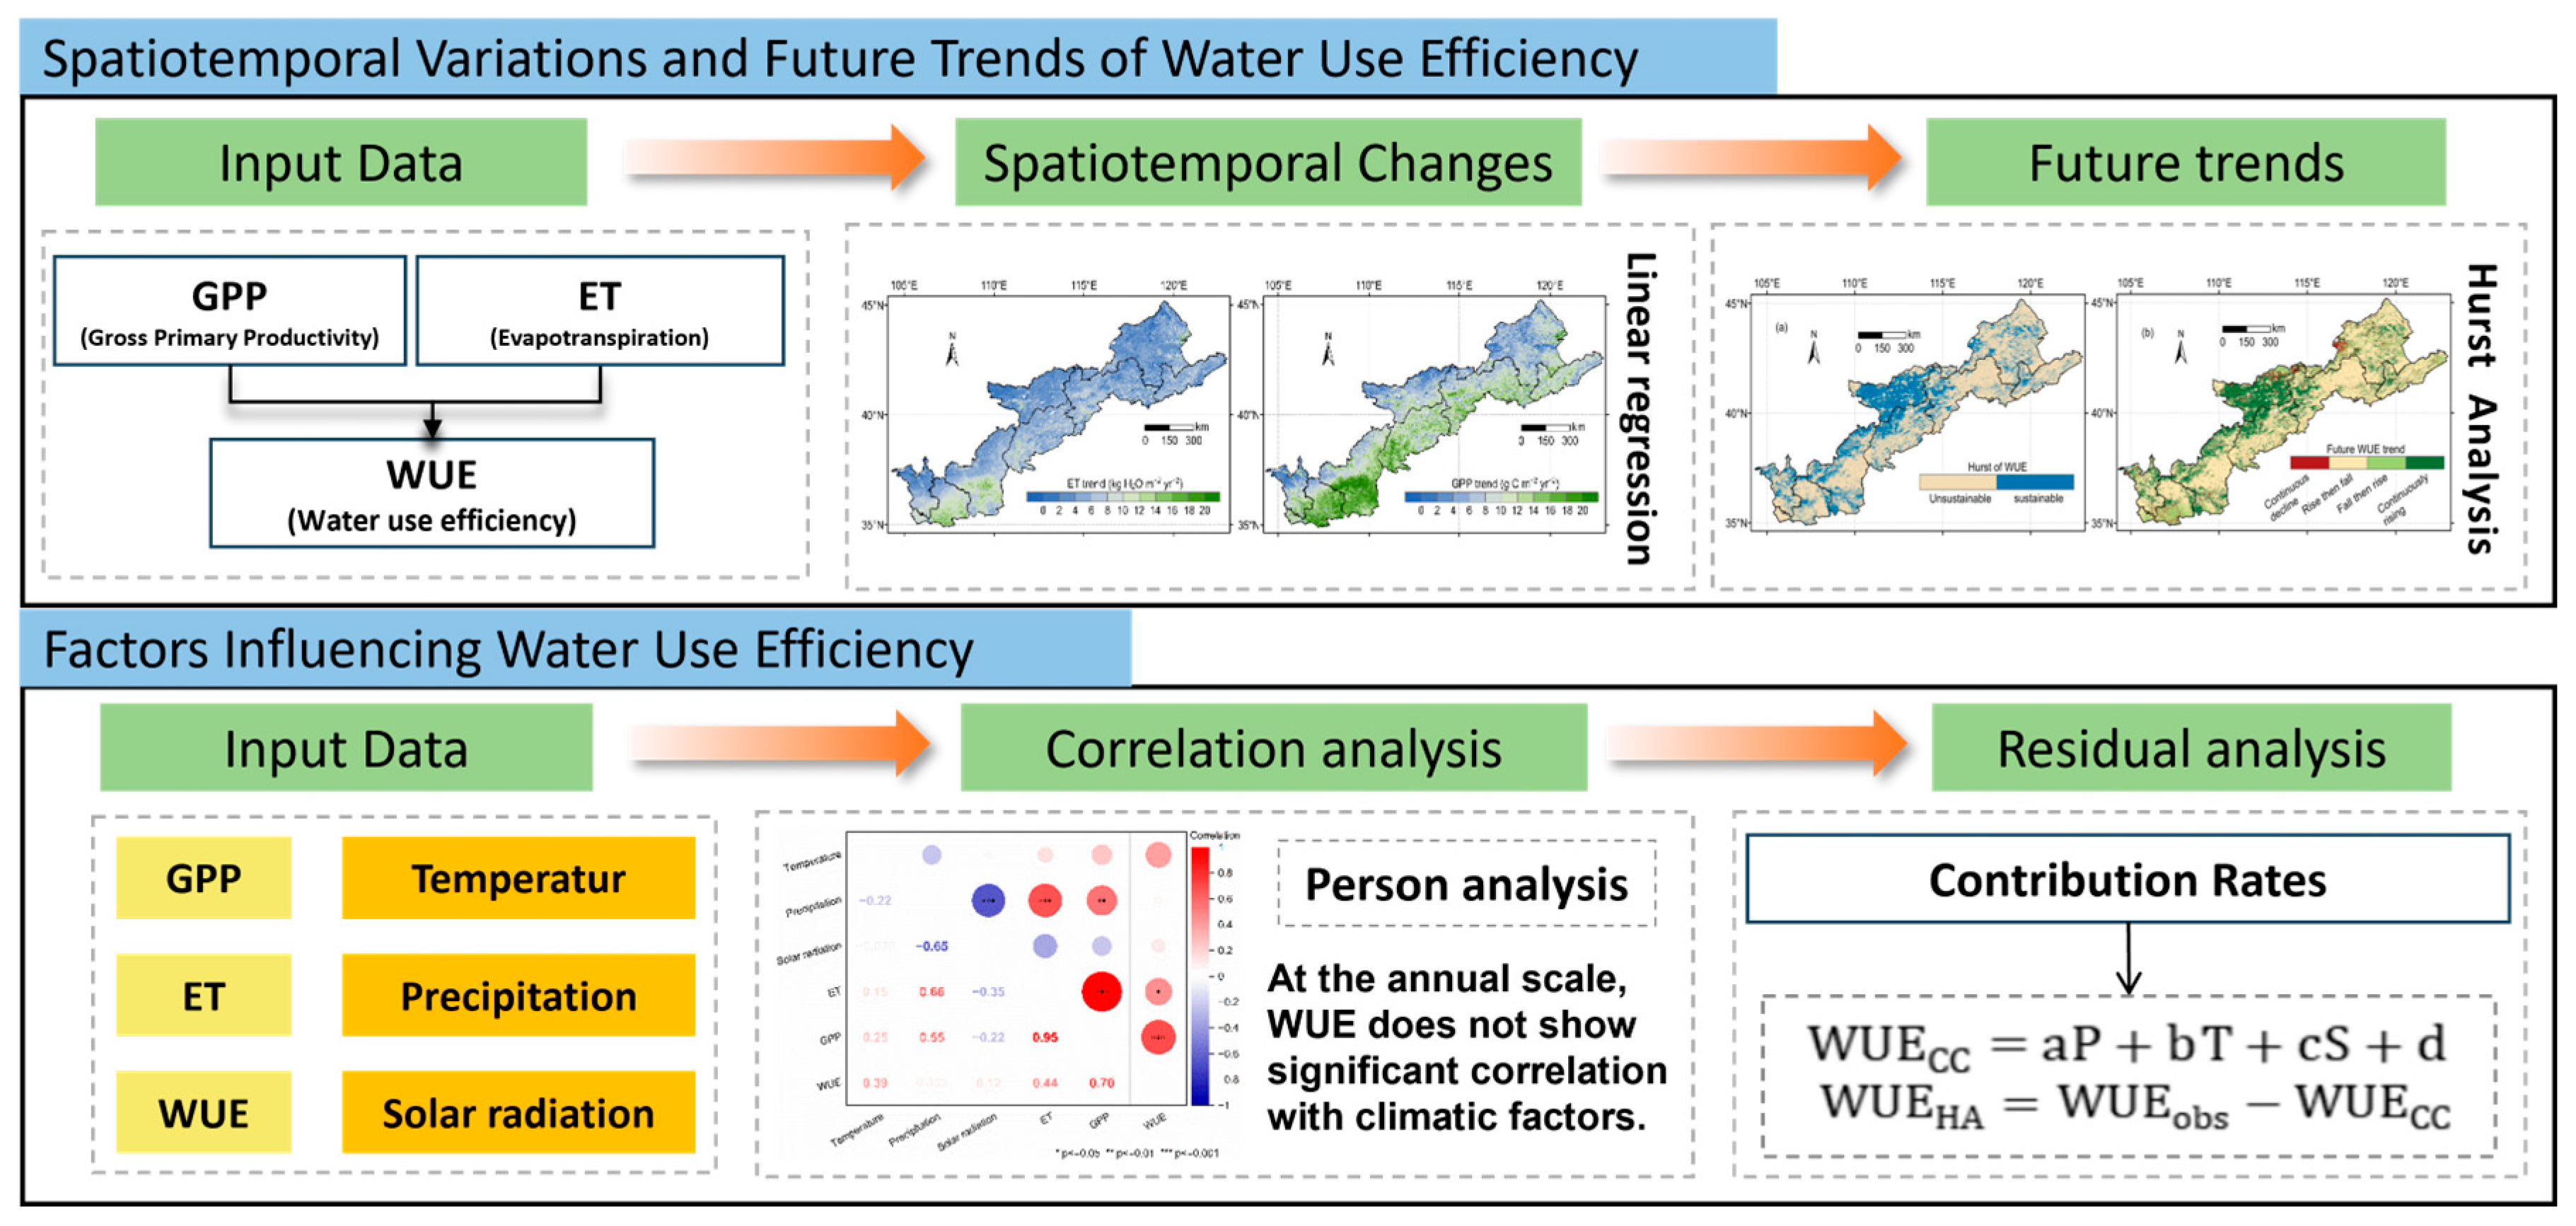
Graphical Abstract

1. Introduction

Water use efficiency (WUE) measures the amount of carbon fixed by plant water consumed during photosynthesis [1] and therefore is an important indicator for evaluating the carbon–water coupling processes in ecosystems [2]. The amount of carbon fixed corresponds to the gross primary productivity (GPP), and the water consumption is represented by evapotranspiration (ET). WUE not only reflects the ability of plants to utilize water but also reveals the effects of different vegetation types, climate conditions, and land use practices on water resource utilization [3,4]. A high WUE value indicates that vegetation can fix more carbon per unit of water used, and therefore, determining how to improve WUE is a key to efficient water management in arid and semi-arid ecosystems [5,6].
Early research on WUE primarily focused on the leaf scale [7,8,9,10,11], making it challenging to generalize findings to regional or ecosystem scales. In recent years, remote sensing technology has enabled large-scale estimates of WUE [12,13,14,15]. Current studies have focused more on the spatiotemporal patterns and attribution analysis of WUE in different regions based on remote sensing products such as MODIS, GLASS, and PML [16,17]. However, due to the high spatial heterogeneity of vegetation changes [18], WUE also exhibits significant differences across different environmental types [19,20]. This study assesses the spatiotemporal variations in WUE in an ecologically fragile area and analyzes the correlation between WUE and climatic and non-climatic factors, which will provide scientific guidance for ecological restoration projects.
Existing studies have focused largely on depicting the historical changes and attribution of WUE [21]. For instance, one study examined the spatiotemporal changes and controlling factors of WUE in major basins [22], climate zones, and land cover in India during the period 2002–2015, evaluating past changes in WUE in India. Similarly, the spatiotemporal patterns of WUE in the Amazon region were assessed using MODIS data [23]. However, these studies lack an evaluation of the future sustainability of WUE. Currently, increasingly severe climates significantly impact water security [24]. Therefore, conducting regional trend prediction research is essential; it not only serves as an early warning system for ecological risks but also provides critical evidence for scientific decision-making and subsequent research [25].
The Agro-Pastoral Ecotone of Northern China (APENC), a special zone with a transition from agriculture and animal husbandry, is an important ecological barrier and water conservation zone in Northern China [26]. Ecosystem functions within the APENC are complex, diverse, and strongly influenced by the dry climate, thus leading to instability in the ecosystem [27]. In recent decades, human activities such as overgrazing and land reclamation have posed significant challenges to the ecological environment of this region, resulting in grassland degradation, land desertification [28], and water scarcity [29]. In recent years, ecological restoration policies such as the Grain-for-Green program have substantially altered land use patterns in this region, characterized by marked reductions in cropland and grassland areas, alongside extensive expansions of forestland and built-up land. Moreover, considerable mutual conversions have occurred between cropland and grassland [30]. Regional carbon cycling is primarily manifested through the gross primary productivity (GPP) of grasslands, croplands, and forestlands. Although afforestation and farmland conversion have increased carbon uptake by increasing vegetation cover, the persistent decline in grasslands and the proliferation of built-up land may induce shifts in water consumption dynamics, thereby partially offsetting the carbon gains. To date, systematic investigations into coupled carbon–water responses to the combined effects of land use change, climate variability, and ecological restoration within the APENC region remain scarce.
Water use efficiency (WUE) serves as a key metric linking carbon sequestration capacity to water consumption. Taking the APENC as the study area, this research utilizes remote sensing data spanning 2001–2023 to accomplish the following objectives: (1) delineating the spatiotemporal trends of GPP, ET, WUE, and associated climatic drivers; (2) identifying whether WUE variations are predominantly governed by GPP or ET through correlation analyses and examining the climatic factors most closely related to WUE; (3) evaluating the future persistence of WUE evolutionary trends using the Hurst exponent; and (4) partitioning the relative contributions of climatic versus non-climatic factors via residual analysis. This study aims to elucidate the trajectory of carbon–water coupling processes in ecologically fragile zones under the interactive pressures of climate warming and ecological rehabilitation, thereby providing scientific support for the formulation of regional water resource management strategies.

2. Materials and Methods

2.1. Description of the Study Area

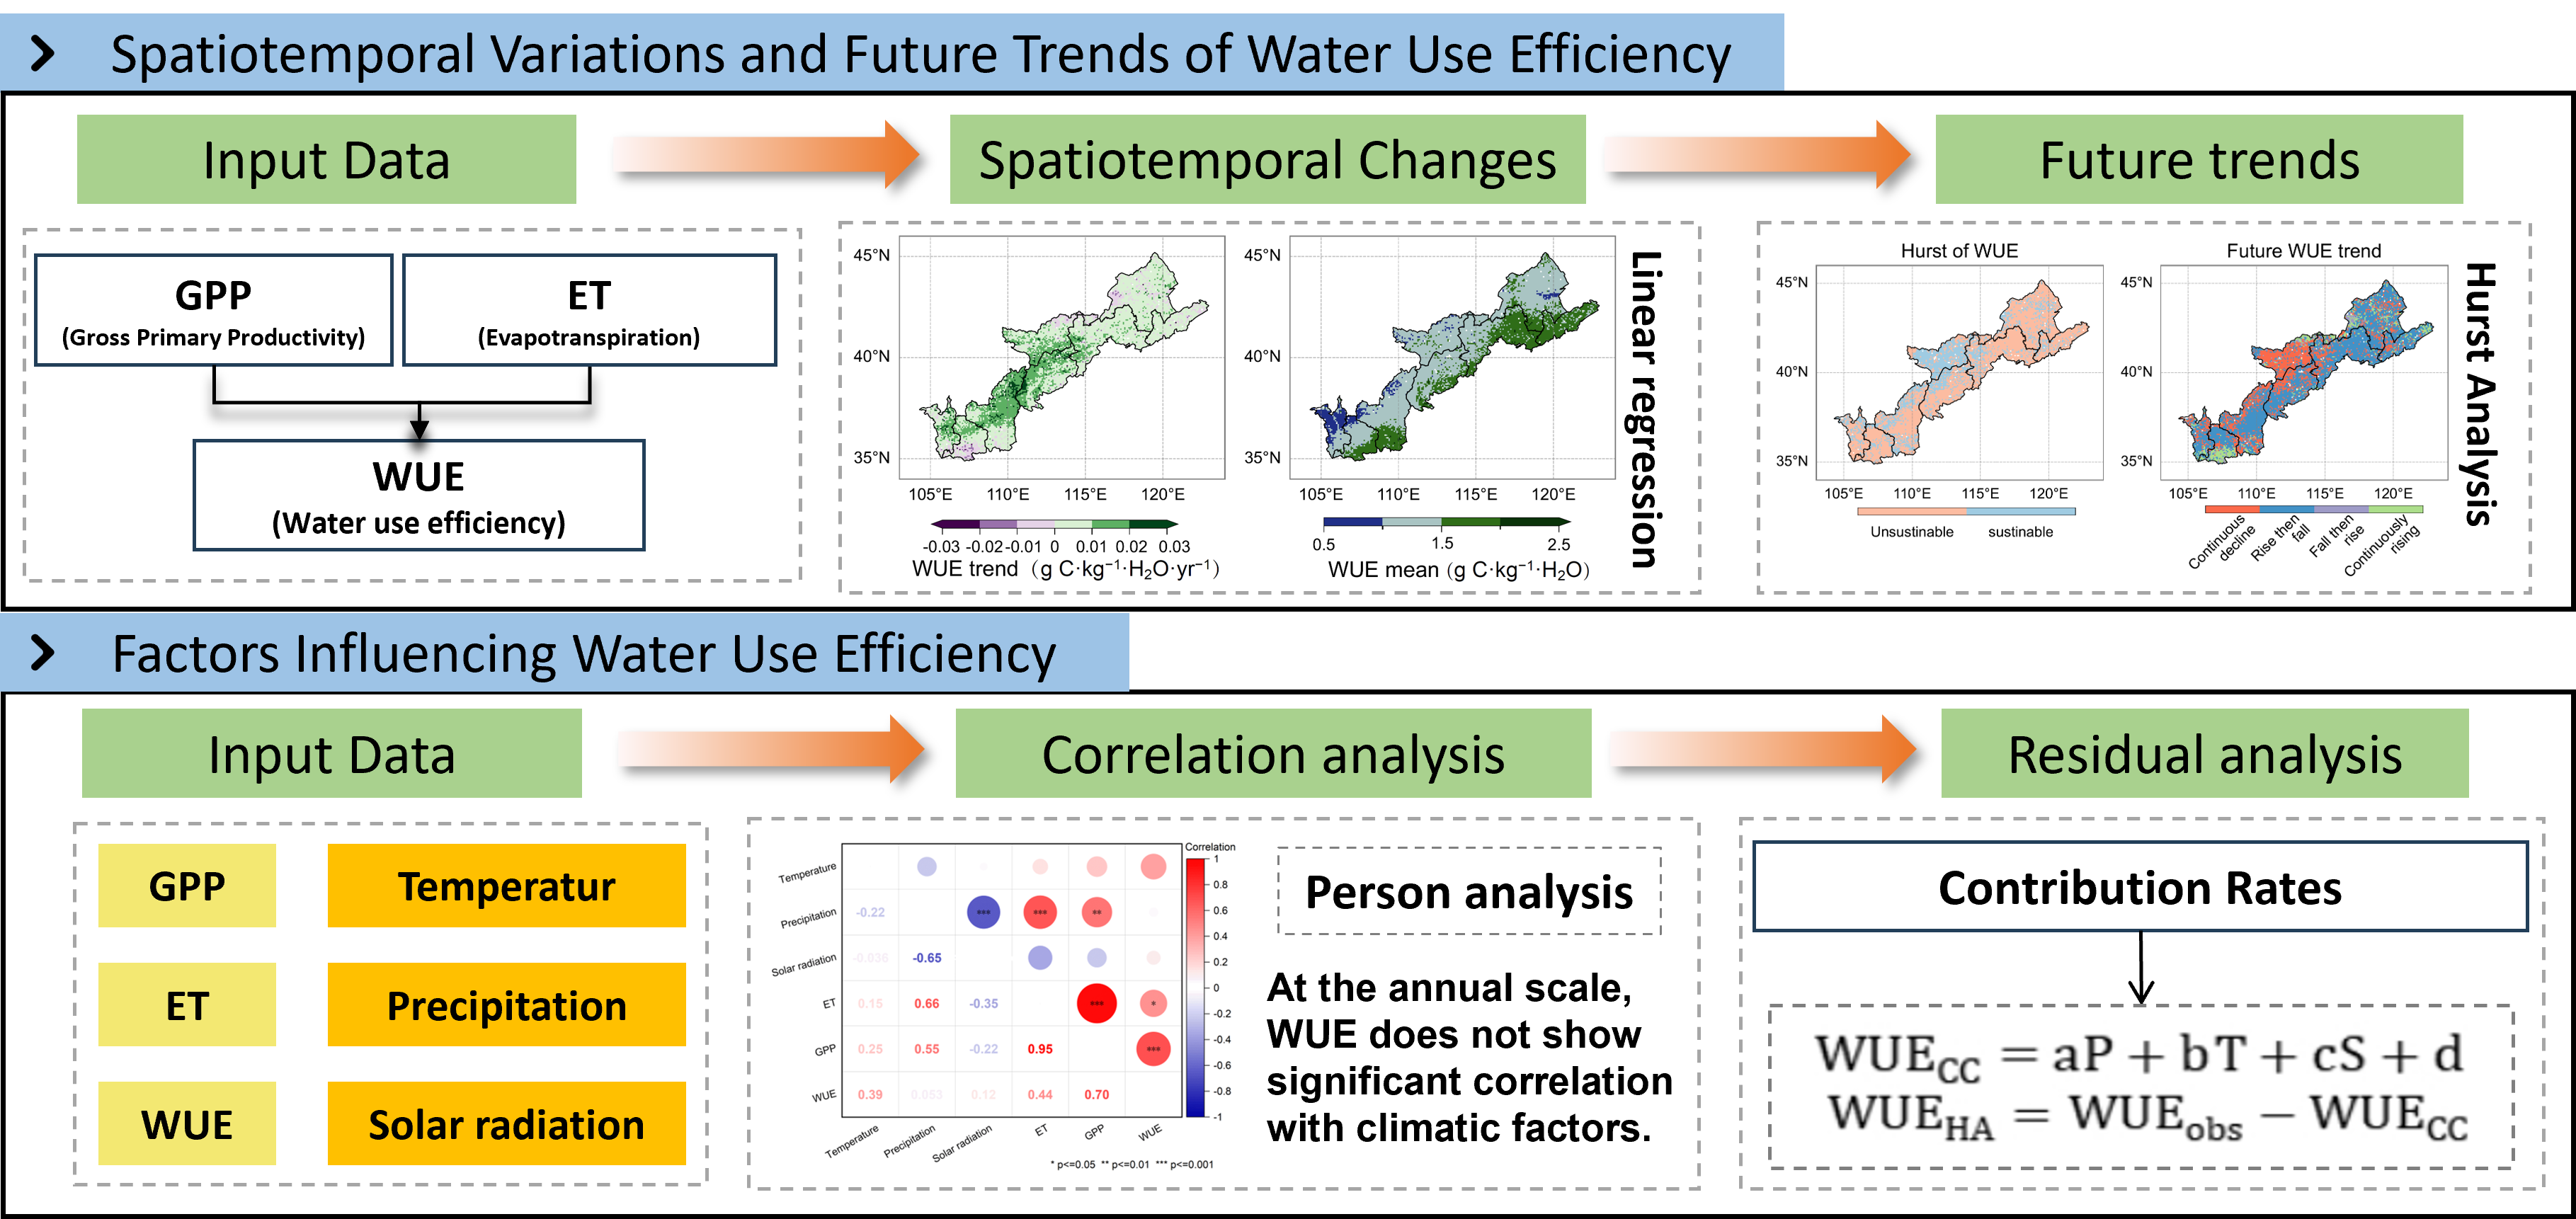
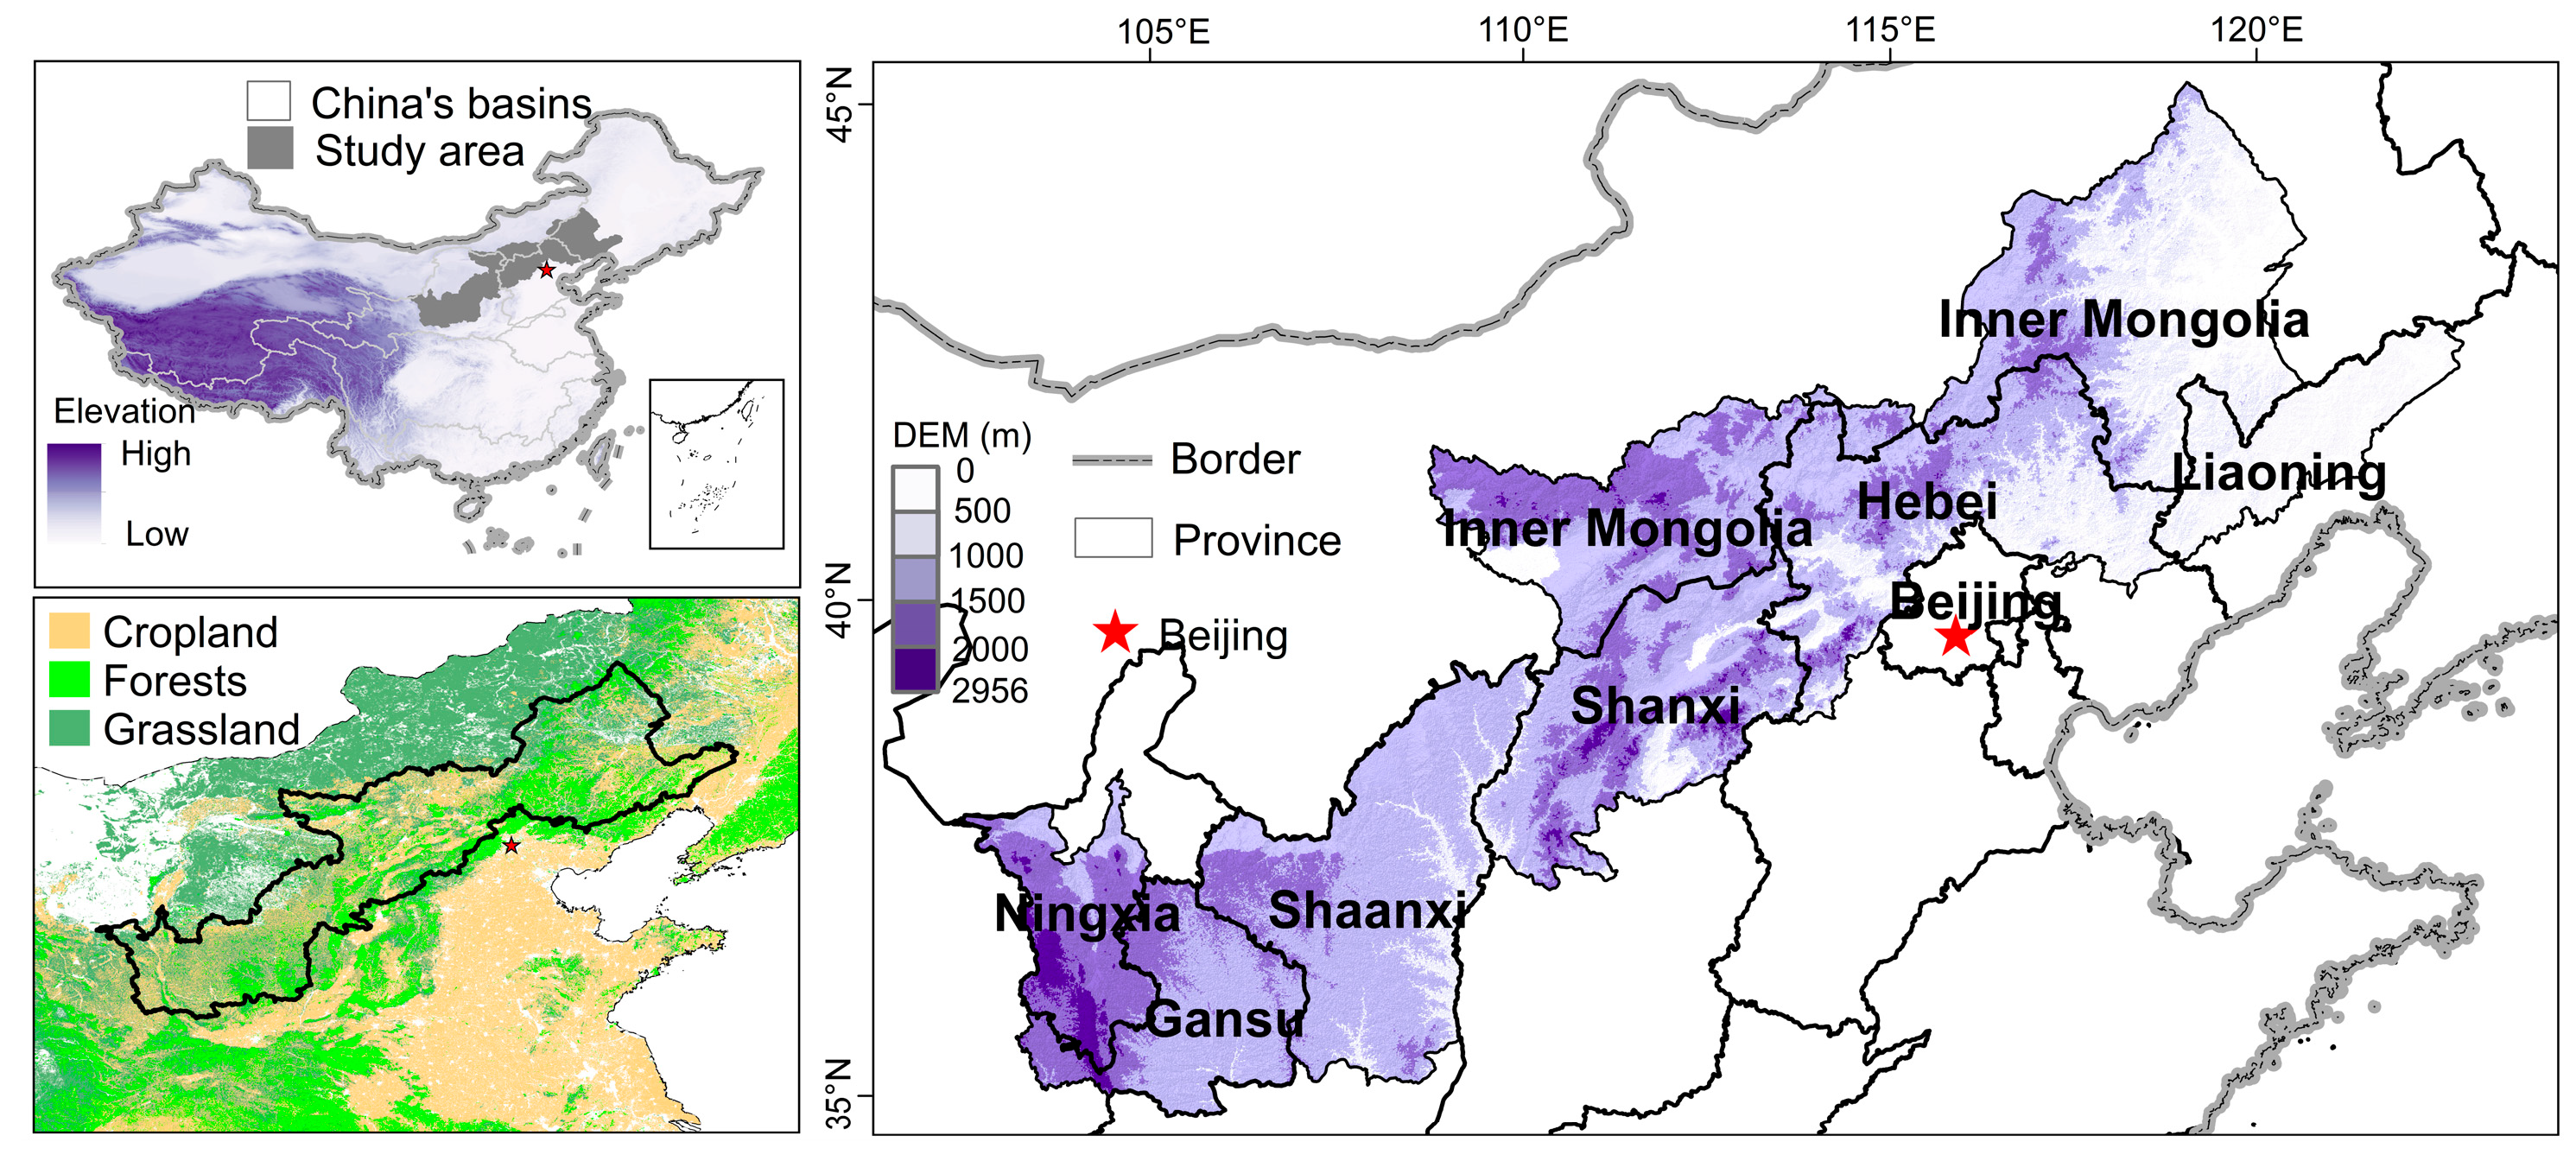
Created by the Ministry of Agriculture and Rural Affairs of the People’s Republic of China [31], the APENC partially covers the Loess Plateau, the Inner Mongolia Plateau, the Taihang Mountains and the Liao River Plain (34°35′–45°30′ N,102°55′–123°28′ E), with a total area of approximately 4.7 × 10⁵ km2 and pronounced elevational differences ranging from 30 to 2956 m (Figure 1). This zone stretches along the 400 mm annual precipitation isohyet in a northeast–southwest direction, spanning 146 counties across seven provinces: Liaoning, Inner Mongolia, Hebei, Shanxi, Shaanxi, Gansu, and Ningxia. APENC lies in the transition zone from semi-humid to arid and semi-arid climates, belonging to the temperate continental monsoon climate. Based on climatic data from the National Earth System Science Data Center, we directly acquired gridded datasets for the study area over the past 23 years. The mean annual precipitation is approximately 426 mm, with rainfall predominantly concentrated from May to September, accounting for 80% of the annual total, and interannual variability ranging from 359 to 507 mm. Spatially, precipitation exhibits a decreasing gradient from south to north. The mean annual temperature is about 7.2 °C, displaying a unimodal intra-annual pattern, with monthly mean temperatures ranging from a minimum of −13.59 °C to a maximum of 23.15 °C, and annual means fluctuating between 6.7 °C and 8.0 °C. Temperature also shows a south-to-north decreasing trend. Land use in the region is diverse, comprising cropland (33.6%), grassland (38.9%), forestland (19.2%), and other types (8.3%) [32]. The workflow of this study is shown in Figure 2.

2.2. Data Sources and Preprocessing

The GPP and ET datasets used in this study are sourced from the MODIS products provided by the United States National Aeronautics and Space Administration (https://lpdaac.usgs.gov/, accessed on 26 May 2025), with an 8-day time interval and a spatial resolution of 1 km. In this study, MODIS data for the APENC from 2001 to 2023 were preprocessed. Pixels flagged as cloudy, of poor quality, or as fill values were excluded. Following format conversion, reprojection, and clipping, all valid 8-day composite tif images were aggregated annually to derive yearly GPP and ET. To ensure the reliability of annual estimates, only pixels with at least 90% valid observations within the year were retained; otherwise, the annual value was set to missing. Precipitation and temperature data were obtained from the National Earth System Science Data Center of the National Science and Technology Resources Sharing Service Platform (https://www.geodata.cn/main/, accessed on 26 May 2025), with a spatial resolution of 1 km. This study selected precipitation and temperature datasets for APENC from 2001 to 2023, which were validated using data from 496 independent meteorological stations. Solar radiation data were provided by the ERA5 dataset on the Google Earth Engine platform. This study selected solar radiation data for APENC from 2001 to 2023, which were processed through data clipping, summing, etc., to obtain annual cumulative data for analysis.

2.3. Research Methods

2.3.1. Water Use Efficiency

WUE is calculated as the ratio of GPP to actual ET. It reflects the amount of dry matter produced by plants per unit of water consumed over a given time and spatial scale. WUE is an important indicator of how effectively plants or ecosystems utilize water resources. The calculation formula is as follows [33]:
W U E = G P P / E T ,
where WUE (g C kg−1 H2O) represents water use efficiency; GPP (g C m−2) is the gross primary productivity, which is the total amount of carbon fixed by plants through photosynthesis; ET (kg H2O m−2) is the actual evapotranspiration, which is the total amount of water lost by vegetation and soil through transpiration and evaporation.

2.3.2. Trend Analysis

This study is based on a MODIS remote sensing dataset from 2001 to 2023 and used the ArcGIS 10.8 software to perform projection transformation and summation of the original 8-day composite products to obtain the annual cumulative ET values. Annual cumulative WUE was calculated pixel by pixel, and linear regression, along with statistical significance tests, was employed to analyze its spatiotemporal variation trends. Specifically, linear regression using Ordinary Least Squares (OLS) was applied to fit the interannual linear equations for GPP, ET, WUE, temperature, precipitation, and solar radiation (y = β0 + β1t), where the slope β1 represents the rate of change. The significance level of the interannual variations for GPP, ET, WUE, temperature, precipitation, and solar radiation from 2001 to 2023 was determined by the p-value. The coefficient of determination (R2) was used to quantify the explanatory power of the linear model for the observed data [34,35].
R 2 = 1 i = 1 n y i y ^ i 2 i = 1 n y i y - i 2 ,
where n represents the sample size, Yi is the annual cumulative value for the i year, Ŷi is the predicted value for the i year from the model, and  Y ¯ is the multi-year mean. R2 ∈ [0, 1], with a value closer to 1, indicates a higher model fit.

2.3.3. Hurst Exponent

The Hurst exponent is a statistical measure used to assess the long-term memory or persistence of a time series. In this study, the Hurst exponent is analyzed using the R/S method to investigate the sustainability and future trends of WUE in APENC. The calculation steps are as follows: The WUE time series of length N is divided into n consecutive subsequences. For each subsequence WUEi, where i = 1, 2, 3, …, n, the following calculations are performed [36,37]:
Mean   sequence :   W U E τ ¯ = 1 τ 1 τ W U E τ     τ = 1 , 2 , , n ,
Cumulative   deviation :   D t = t = 1 τ W U E t W U E τ ¯ 1 t τ ,
Range :   R τ = max 1 t τ D t min 1 t τ D t     τ = 1 , 2 , , n ,
Standard   deviation :   S τ = 1 τ t = 1 τ W U E t W U E τ ¯     τ = 1 , 2 , , n ,
Rescaled   range :   R S τ = R τ S τ         τ = 1 , 2 , , n ,
A scatter plot of log(R/S)n versus log(n) is generated, and the slope, H, is fitted using the least squares method.
If a significant slope exists, it indicates that the time series WUEi(i = 1,2,...,n) exhibits the Hurst phenomenon, and the value of H is the Hurst exponent, which ranges from 0 to 1. When 0 < H < 0.5, it suggests that WUE has anti-persistence, meaning the past trend is opposite to the future trend; when H = 0.5, it indicates that WUE follows a random walk, with no long-term memory, and the past trend is unrelated to the future trend; when 0.5 < H < 1, it indicates long-term persistence, meaning the past trend is similar to the future trend. The Hurst exponent has been extensively applied in hydrological sequence forecasting, assessment of vegetation dynamics persistence [38], and trend analysis of WUE variations. Unlike process-based models or statistical forecasting models (e.g., ARIMA and random forest) that rely on future scenario assumptions of driving factors, the Hurst exponent infers future evolutionary tendencies based solely on the long-range dependence inherent in the time series itself, without requiring pre-specified external driving conditions. It is therefore particularly well suited for diagnosing the sustainability of long-term remote sensing datasets.

2.3.4. Correlation Analysis

Pearson correlation analysis is used to measure the linear relationship between two variables. In this study, Pearson correlation analysis is applied to calculate the correlation coefficients between GPP, ET, temperature, precipitation, solar radiation, and WUE. The larger the absolute value of R, the stronger the correlation, and the sign of R indicates the direction of the correlation between the two variables. The Pearson correlation coefficient R is the ratio of covariance to the standard deviation, as shown in the following formula [39]:
R = i = 1 n x i x ¯ y i y ¯ i = 1 n y i y ¯ i = 1 n x i x ¯ ,
where n is the sample size, and R is the correlation coefficient between variables x and y. When R > 0, it indicates a positive correlation between the two variables, meaning that as the value of one variable increases, the value of the other variable also increases. When R approaches 0, it suggests no correlation between the two variables. When R < 0, it indicates a negative correlation, meaning that as the value of one variable increases, the value of the other variable decreases.

2.3.5. Residual Analysis

Residual analysis of multivariate linear regression is used to exclude the influence of climate factors from long-term time series data, with the residuals representing the impact of non-climate factors on the variation in water use efficiency. In this study, temperature, precipitation, and solar radiation from 2001 to 2023 in the APENC are selected as independent variables, and the actual WUE values (WUEobs) are taken as the dependent variable. A regression model is established to obtain the predicted WUE values (WUEcc). The difference between the observed and predicted values is then taken as the WUE residual value (WUEHA), which is used to represent the influence of non-climate factors on WUE. The calculation formula is as follows [40]:
W U E C C = a P + b T + c S + d ,
W U E H A = W U E o b s W U E C C ,
Here, WUEcc is the predicted water use efficiency value from the multivariate linear regression model [41]; P is the annual precipitation (mm); T is the annual average temperature (°C); S is the annual solar radiation (MJ/m2); WUEHA is the residual value of water use efficiency; WUEobs is the observed water use efficiency value; a, b, and c are the parameters of the mode [42].
Based on the derived residual values of WUE (Sr), we classify the impact of non-climatic factors on water use efficiency into six levels and analyze the contribution rates of climatic and non-climatic factors to WUE.

3. Results

3.1. Trends in GPP, ET, Temperature, Precipitation, and Solar Radiation from 2001 to 2023

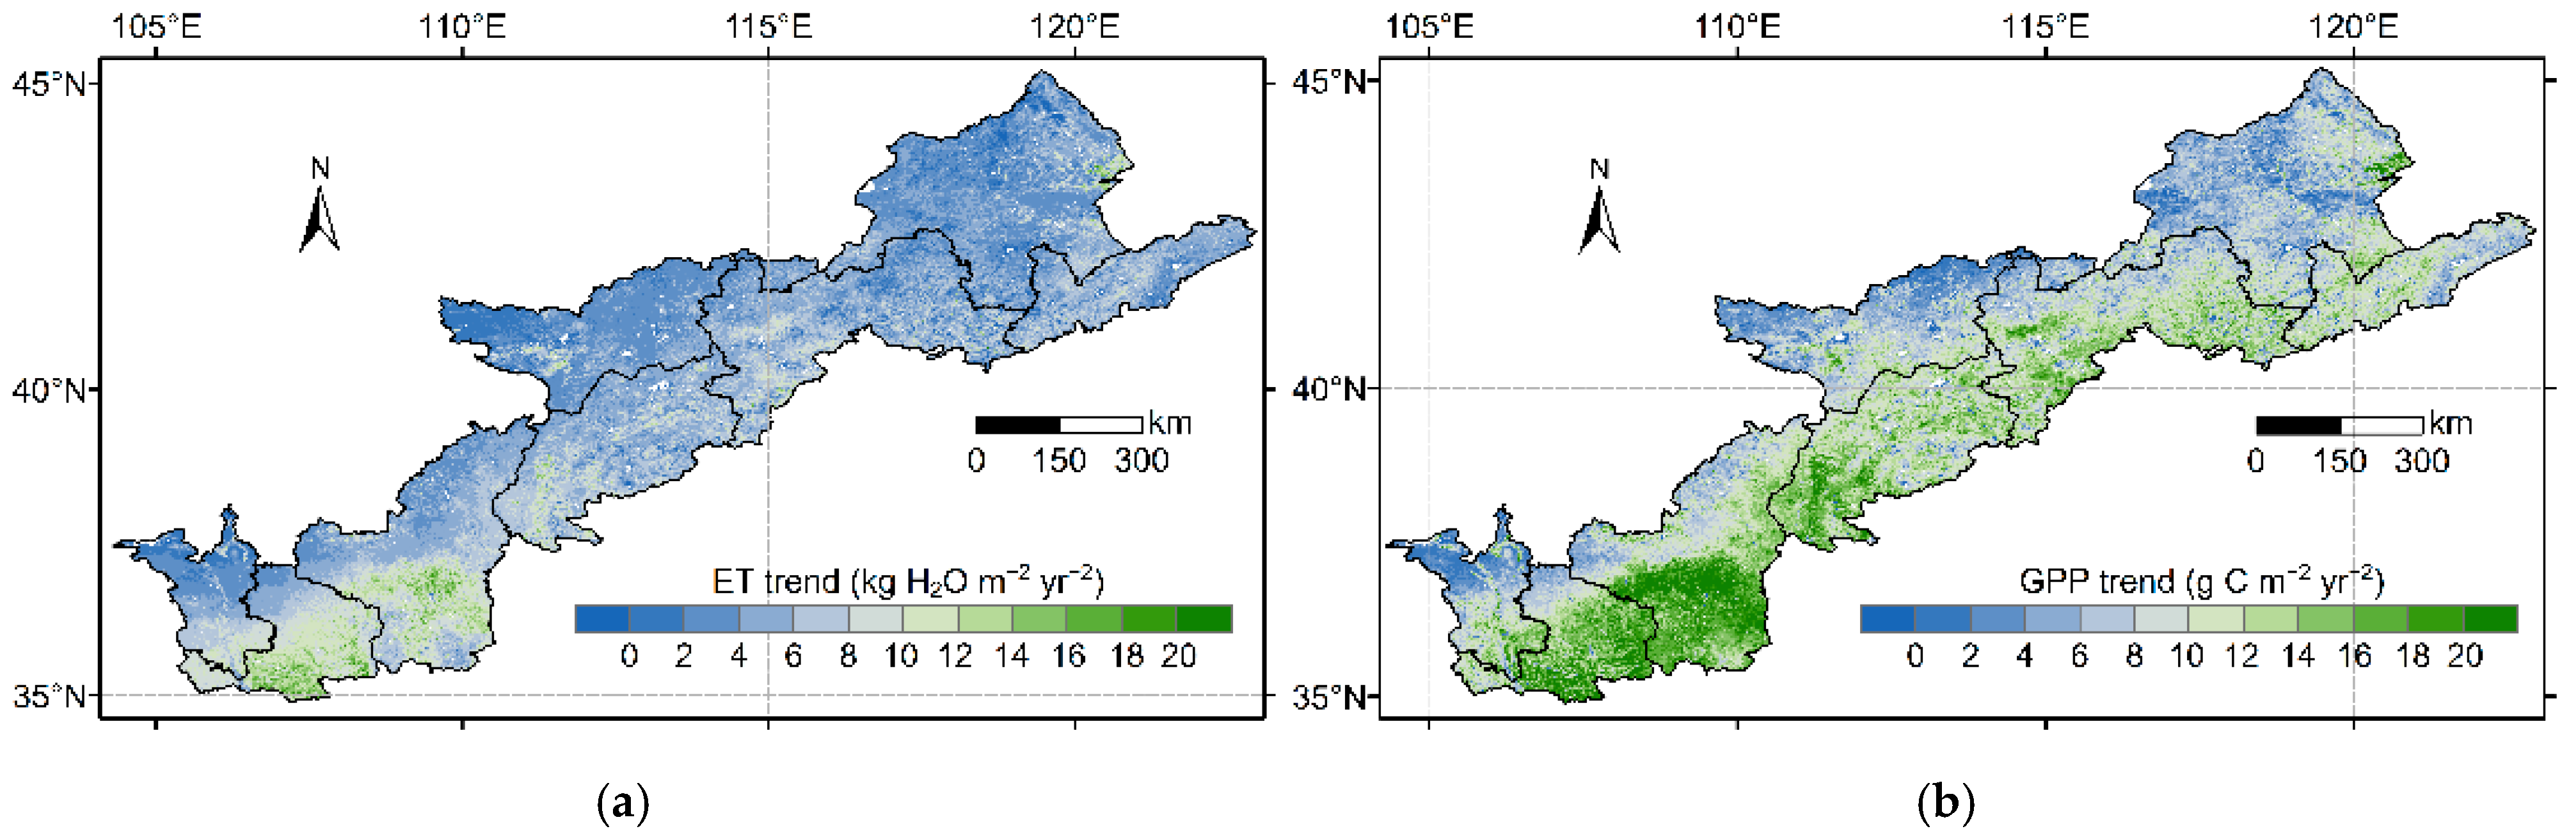
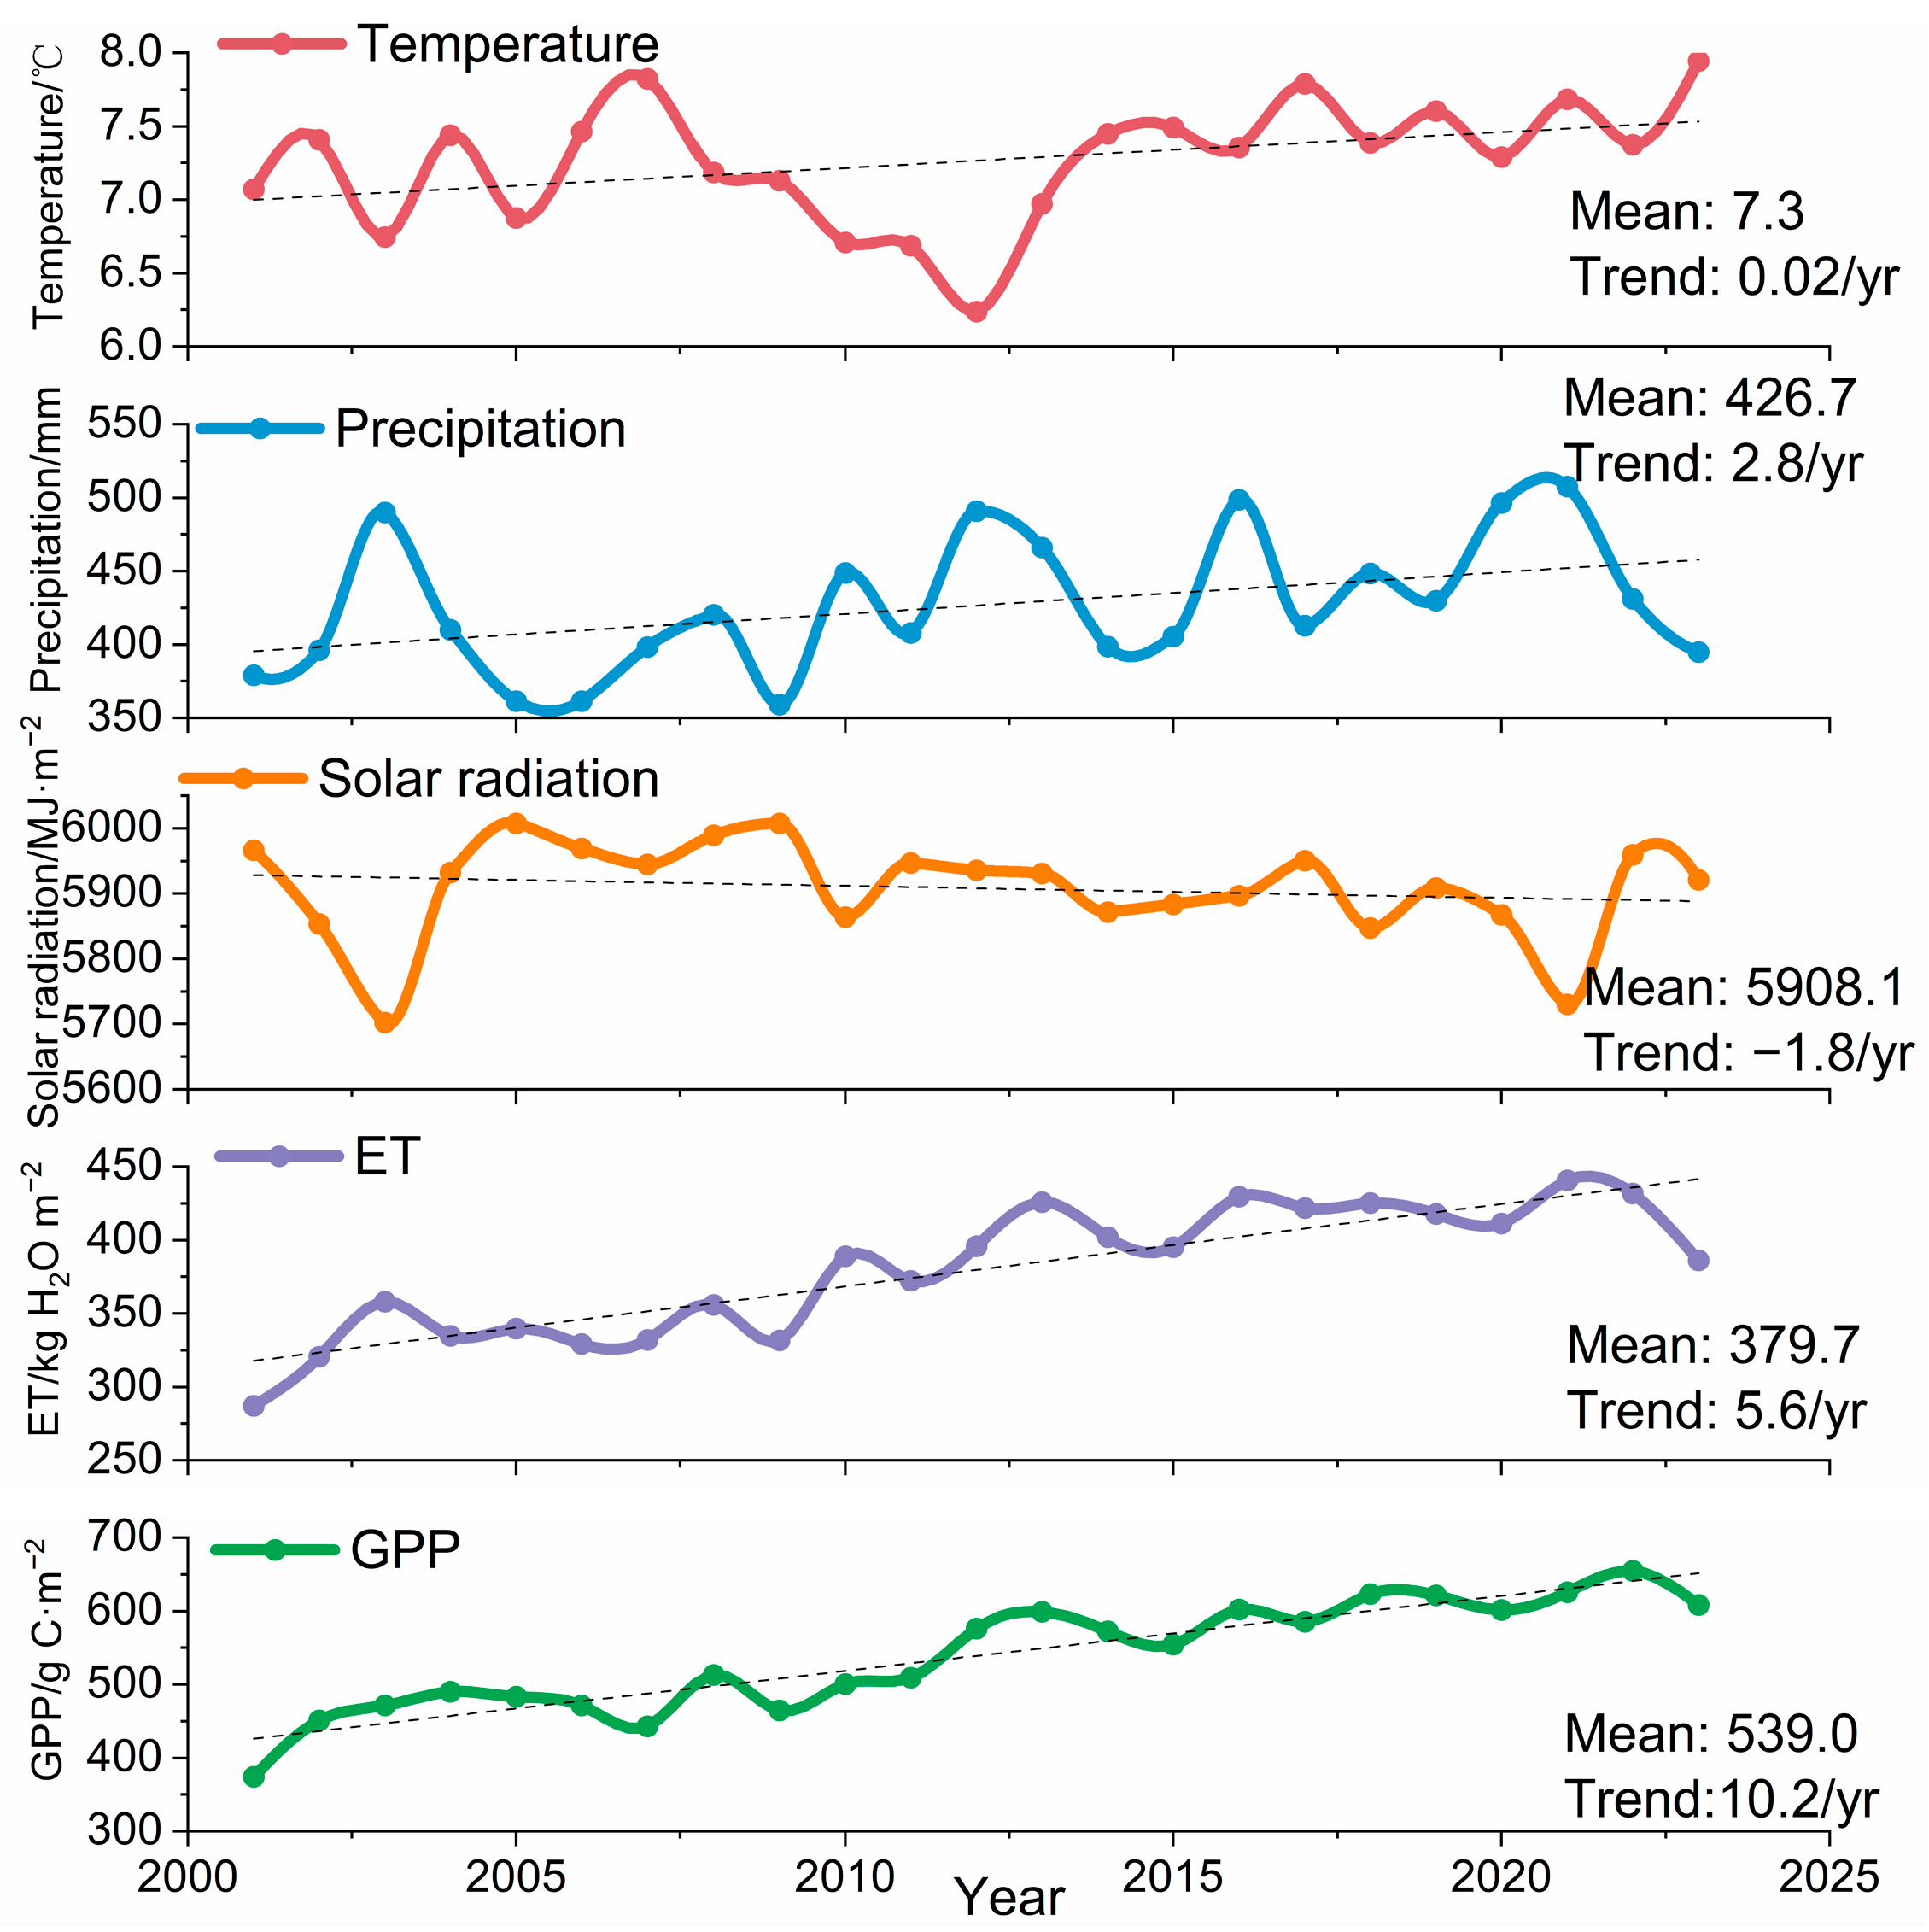
Between 2001 and 2023, both GPP and ET in APENC exhibited significant interannual fluctuations (Figure 3). The multi-year average GPP was 539.01 g C m−2 yr−1, with the maximum value of 654.63 g C m−2 yr−1 in 2022 and the minimum value recorded in 2001 at 374.18 g C m−2 yr−1. The standard deviation of the GPP time series is 74.98, and the coefficient of variation is 13.90%, indicating that the data exhibits significant volatility. Overall, GPP showed a significant increasing trend (p < 0.05), with an average annual growth rate of 10.22 g C m−2 yr−2; this indicates that the afforestation policies in this area have had a positive effect, increasing the overall carbon sequestration capacity of the vegetation (Figure 4b), and 99% of the region showed an increasing GPP trend, with only 1% of the region exhibiting a decline in GPP. The regions with declining GPP are mainly concentrated in built-up areas. The GPP growth rate gradually decreased from southwest to northeast, with northern Shaanxi being the fastest-growing area, while some parts of Inner Mongolia showed a declining trend in GPP.
The multi-year average ET was 379.73 kg H2O m−2 yr−1; the maximum value was recorded in 2021 at 440.62 kg H2O m−2 yr−1, and the minimum value was recorded in 2001 at 287.19 kg H2O m−2 yr−1. The overall trend of ET also showed a significant increase (p < 0.05), indicating an overall increase in water consumption in the region over the past 20 years, with an average annual growth rate of 5.62 kg H2O m−2 yr−2. The standard deviation is 43.86, and the coefficient of variation is 11.55%. Overall, it exhibits considerable volatility. Over the past 23 years, 99% of the region showed an increasing ET trend, with only 1% of the region showing a decreasing trend (Figure 4a). The growth rate gradually slows down from southwest to northeast, with the fastest-growing areas being northern Gansu and northern Shaanxi.
Temperature and precipitation generally showed an upward trend (Figure 3), but the changes were statistically insignificant (p > 0.05). Temperature, precipitation, and solar radiation all exhibited interannual fluctuations, with coefficients of variation of 5.73%, 10.89%, and 1.3%, respectively, the highest temperature (7.95 °C) in 2023 and the lowest in 2012 (6.71 °C), the highest precipitation in 2021 (507 mm) and the lowest in 2009 (359 mm), and the highest solar radiation in 2005 (6007 MJ/m2) and the lowest in 2003 (5702 MJ/m2).

3.2. Variations in WUE

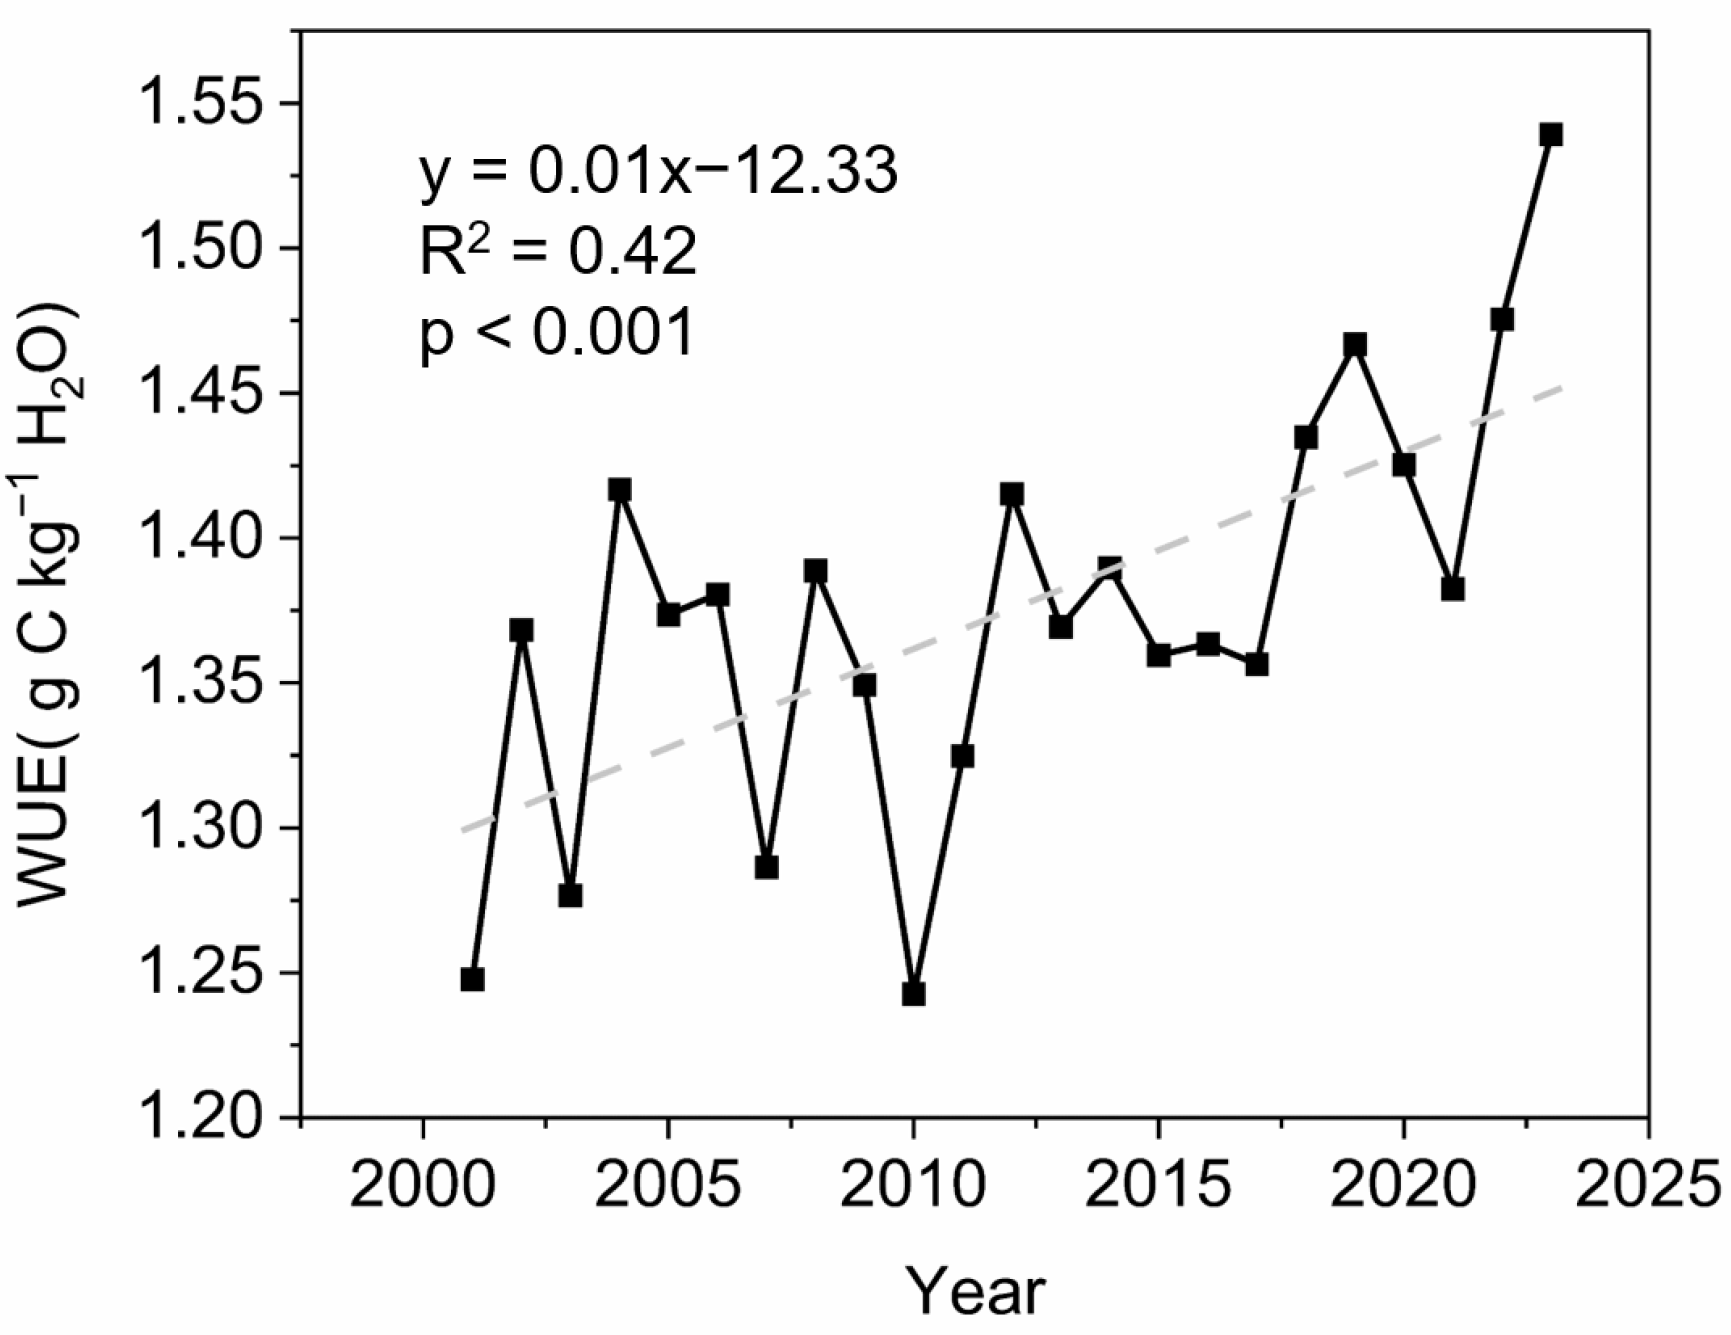
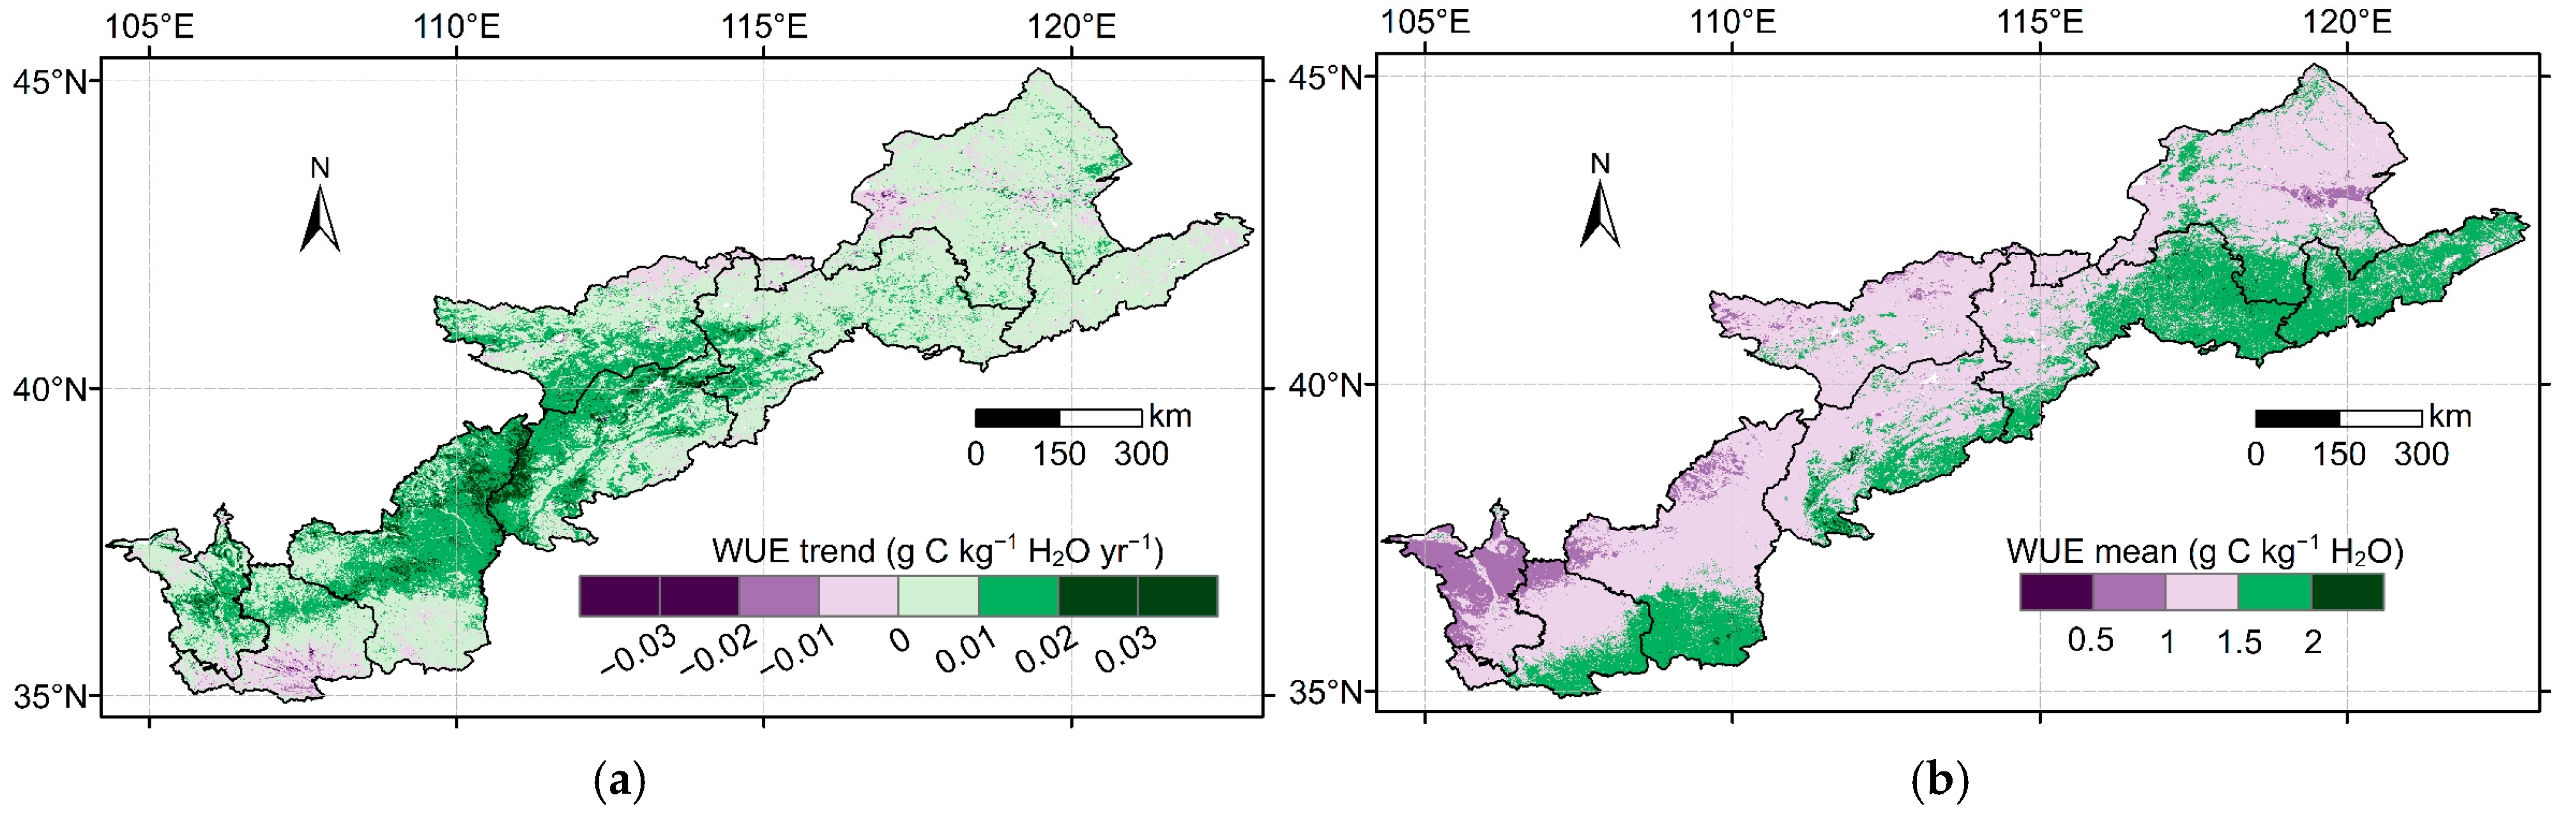
From 2001 to 2023, the annual average WUE in the APENC was 1.37 g C kg−1 H2O (Figure 5), with insignificant interannual fluctuations, a standard deviation of 0.07, and a coefficient of variation of 5.15%. The highest WUE occurred in 2023 at 1.54 g C kg−1 H2O, and the lowest value was in 2010 at 1.24 g C kg−1 H2O. Both ET and GPP showed an overall upward trend, but the growth rate of GPP exceeded that of ET, leading to a significant increase in WUE (p < 0.001). The increase rate of WUE was 0.01 g C kg−1 H2O yr−1. In total, 87.41% (approximately 4 × 10⁵ km2) of the APENC exhibited an increasing WUE trend, while 12.59% of the region showed a decreasing trend. The increase in WUE is higher in the middle and lower in the east and west, with the highest values found at the Shaanxi–Shanxi provincial border, while the southeastern Inner Mongolia Plateau and northern Gansu showed slower growth rates. Annual average WUE is higher in the south and lower in the north (Figure 6a). Areas with high WUE were concentrated at the transition zone between Gansu and Shaanxi, where the Grain-for-Green program has significantly increased forest coverage, combined with a warm temperate semi-humid climate that promotes the synergistic optimization of photosynthesis and evapotranspiration. In contrast, low WUE areas were mainly located in southern Ningxia and the border between Ningxia and Gansu.
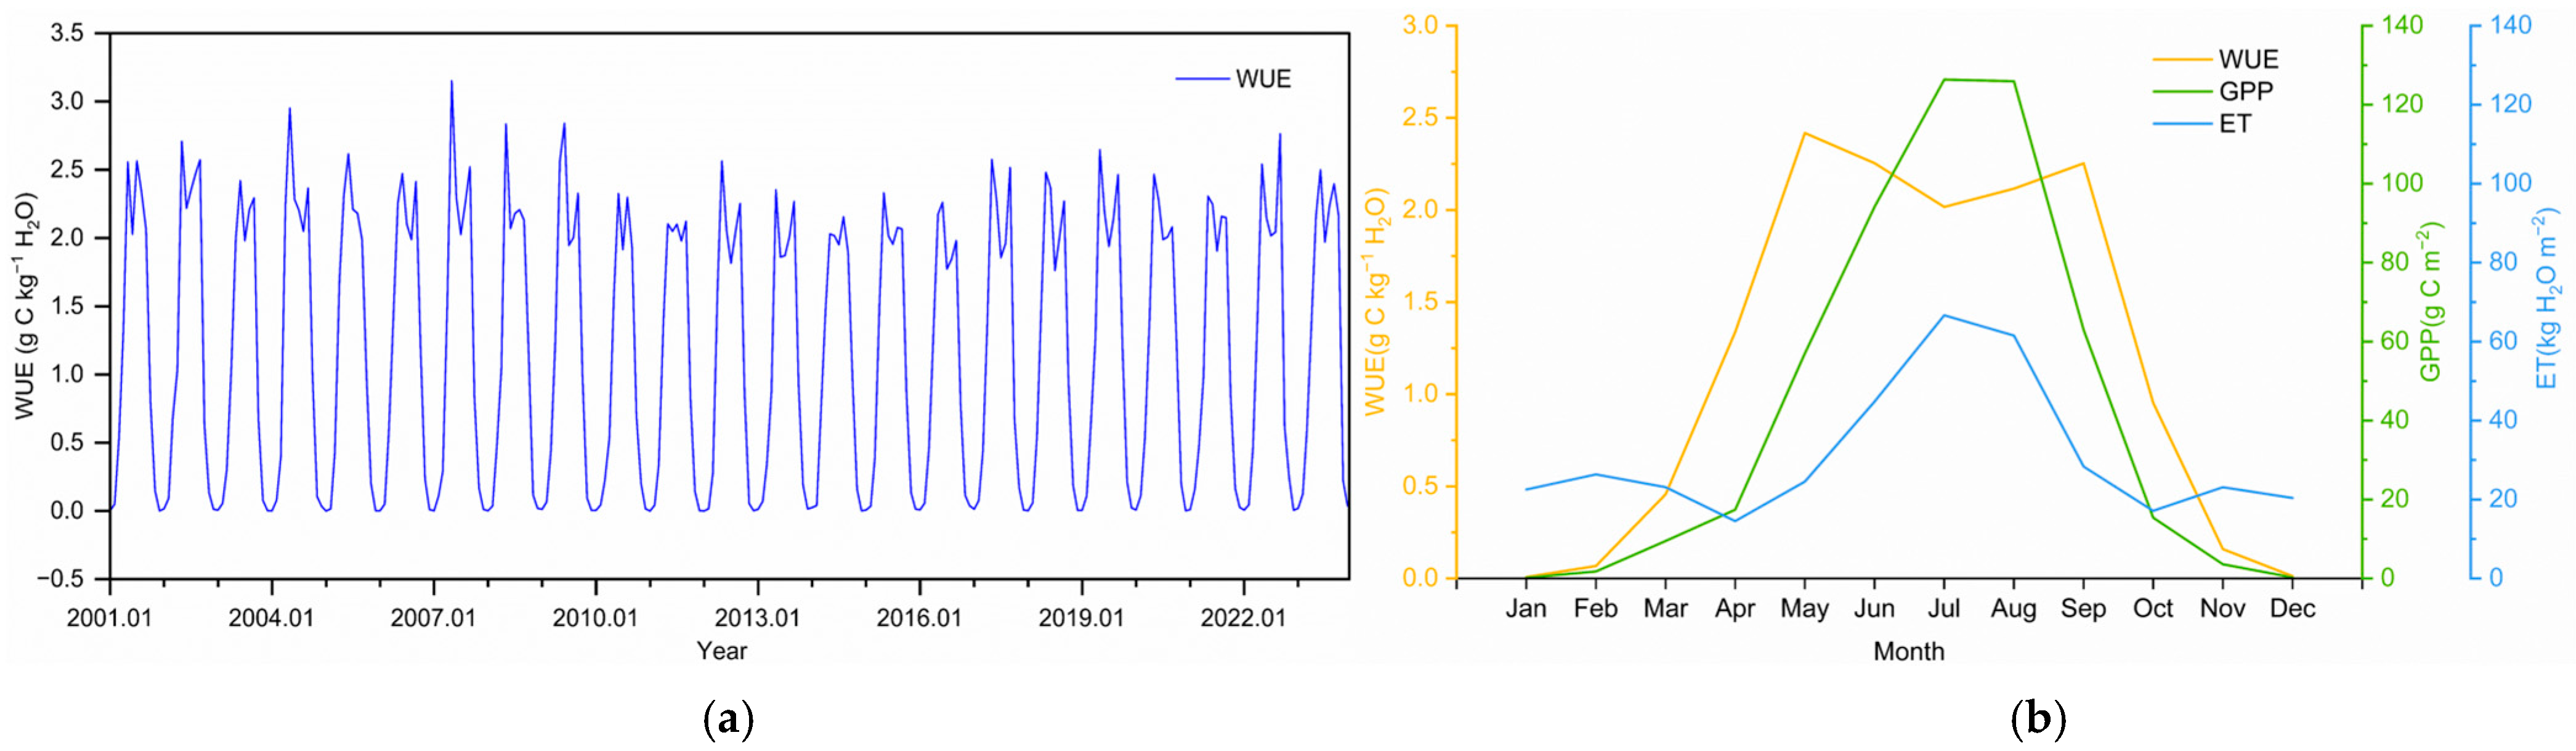
Figure 7 shows significant seasonal variations in WUE throughout the year. Notably, there are two peaks each year: the first peak occurs in May, followed by a slight decline in July, and the second peak is reached in September. Prior to May, ET rose slowly, while GPP increased rapidly, leading to the first peak in WUE. From July to September, the decline rate of ET exceeds that of GPP, resulting in the second peak in WUE in September. This indicates that a proper decrease in temperature and an increase in precipitation enhance the water use efficiency of plants again.

3.3. Persistence and Future Trends of WUE

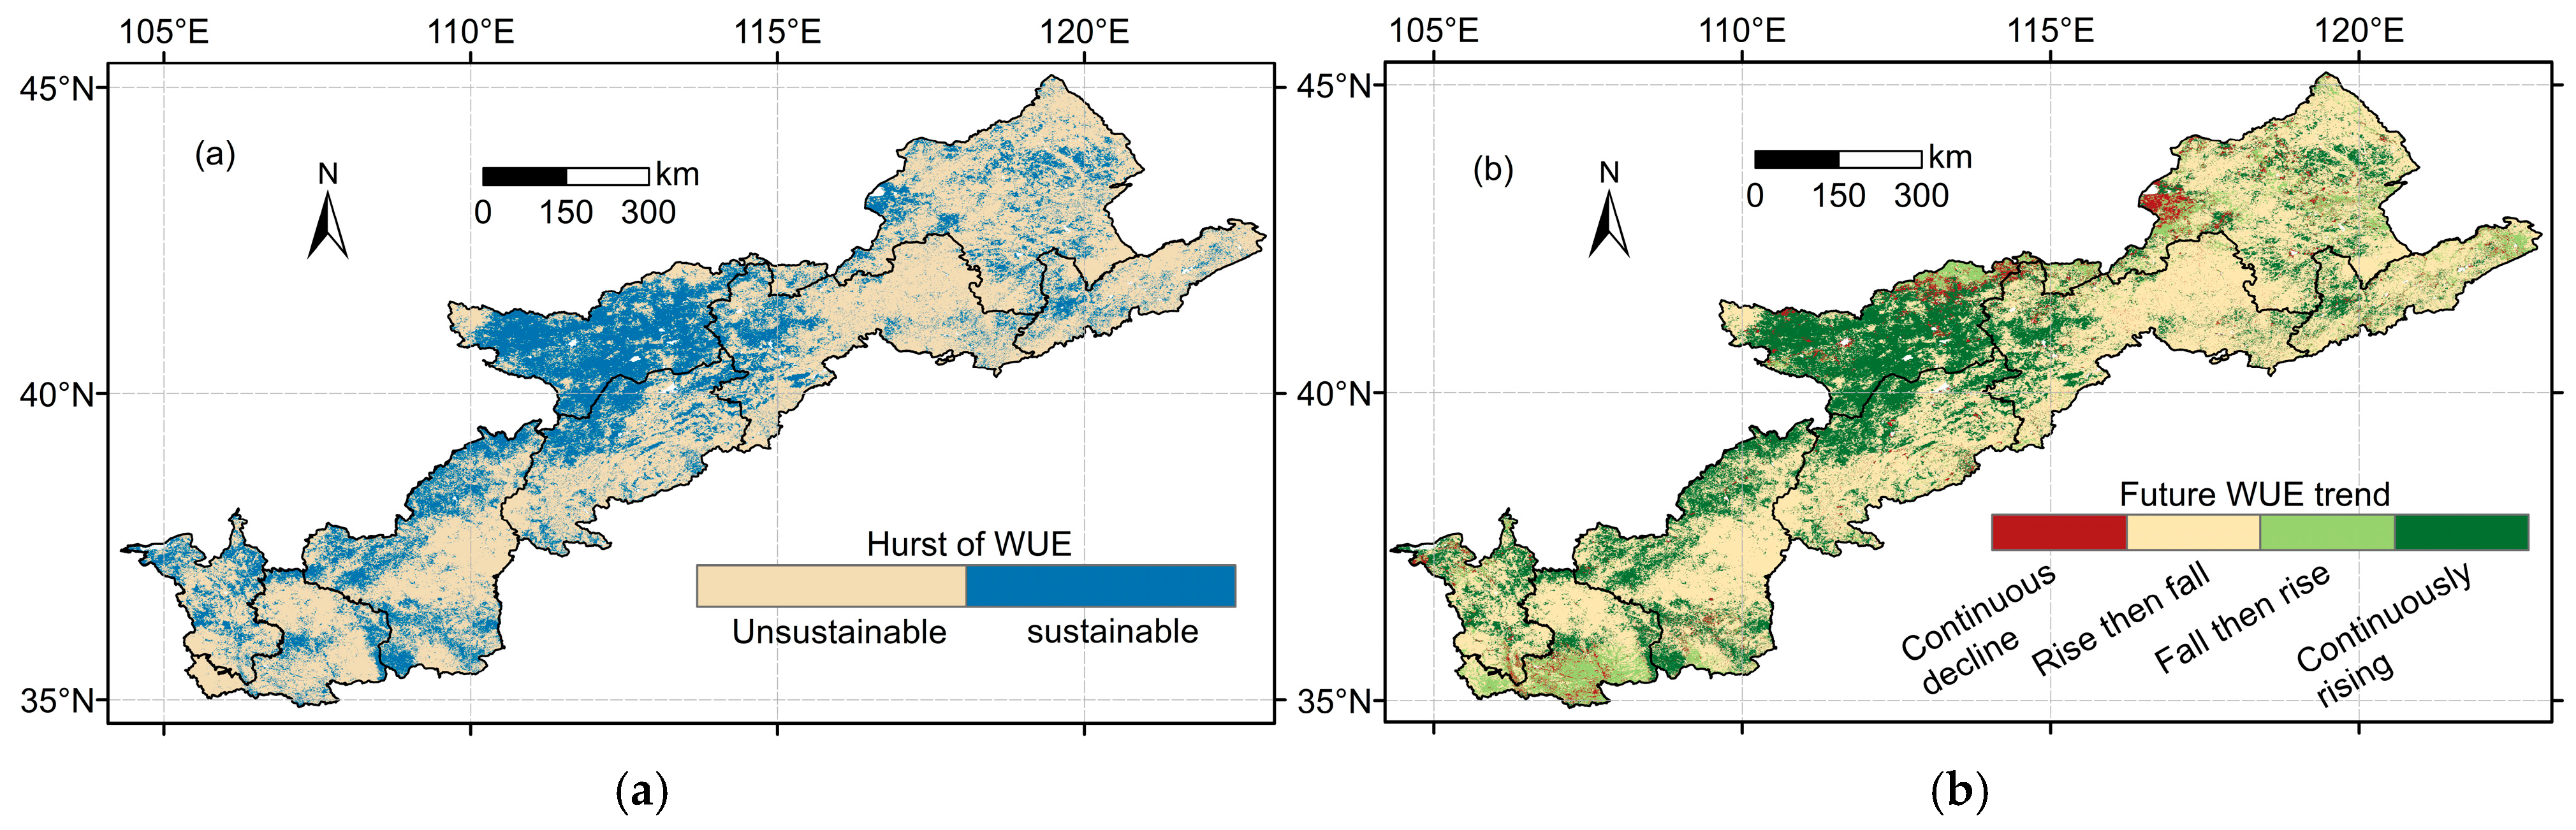
Figure 8 shows that the range of the Hurst index is from 0.12 to 0.94, with an average value of 0.46. The WUE changes in the region are dominated by anti-persistence, indicating a high likelihood that the current increasing trend will reverse in the future. The persistent areas (H > 0.5) account for 32.38% of the total pixels, mainly distributed in Hohhot and Ulanqab, suggesting that the current WUE trend will continue for a long period. The anti-persistent areas (H < 0.5) account for 67.62% (approximately 3.1 × 10⁵ km2) of the total pixels, indicating that WUE in these regions may reverse the current trend in the future. Combining the Hurst index with the WUE trend (Figure 8b), in 58.9% (approximately 2.7 × 10⁵ km2) of the APENC, the future WUE trend may shift from an increase to a decrease, and these areas should be prioritized for adjustments. In 28.5% of the region, WUE will continue to rise, maintaining a good water use efficiency, mainly in Hohhot and Ulanqab. In 3.7% of the region, WUE will exhibit a continuous downward trend, mainly in the western part of Chifeng.

3.4. Main Drivers of WUE

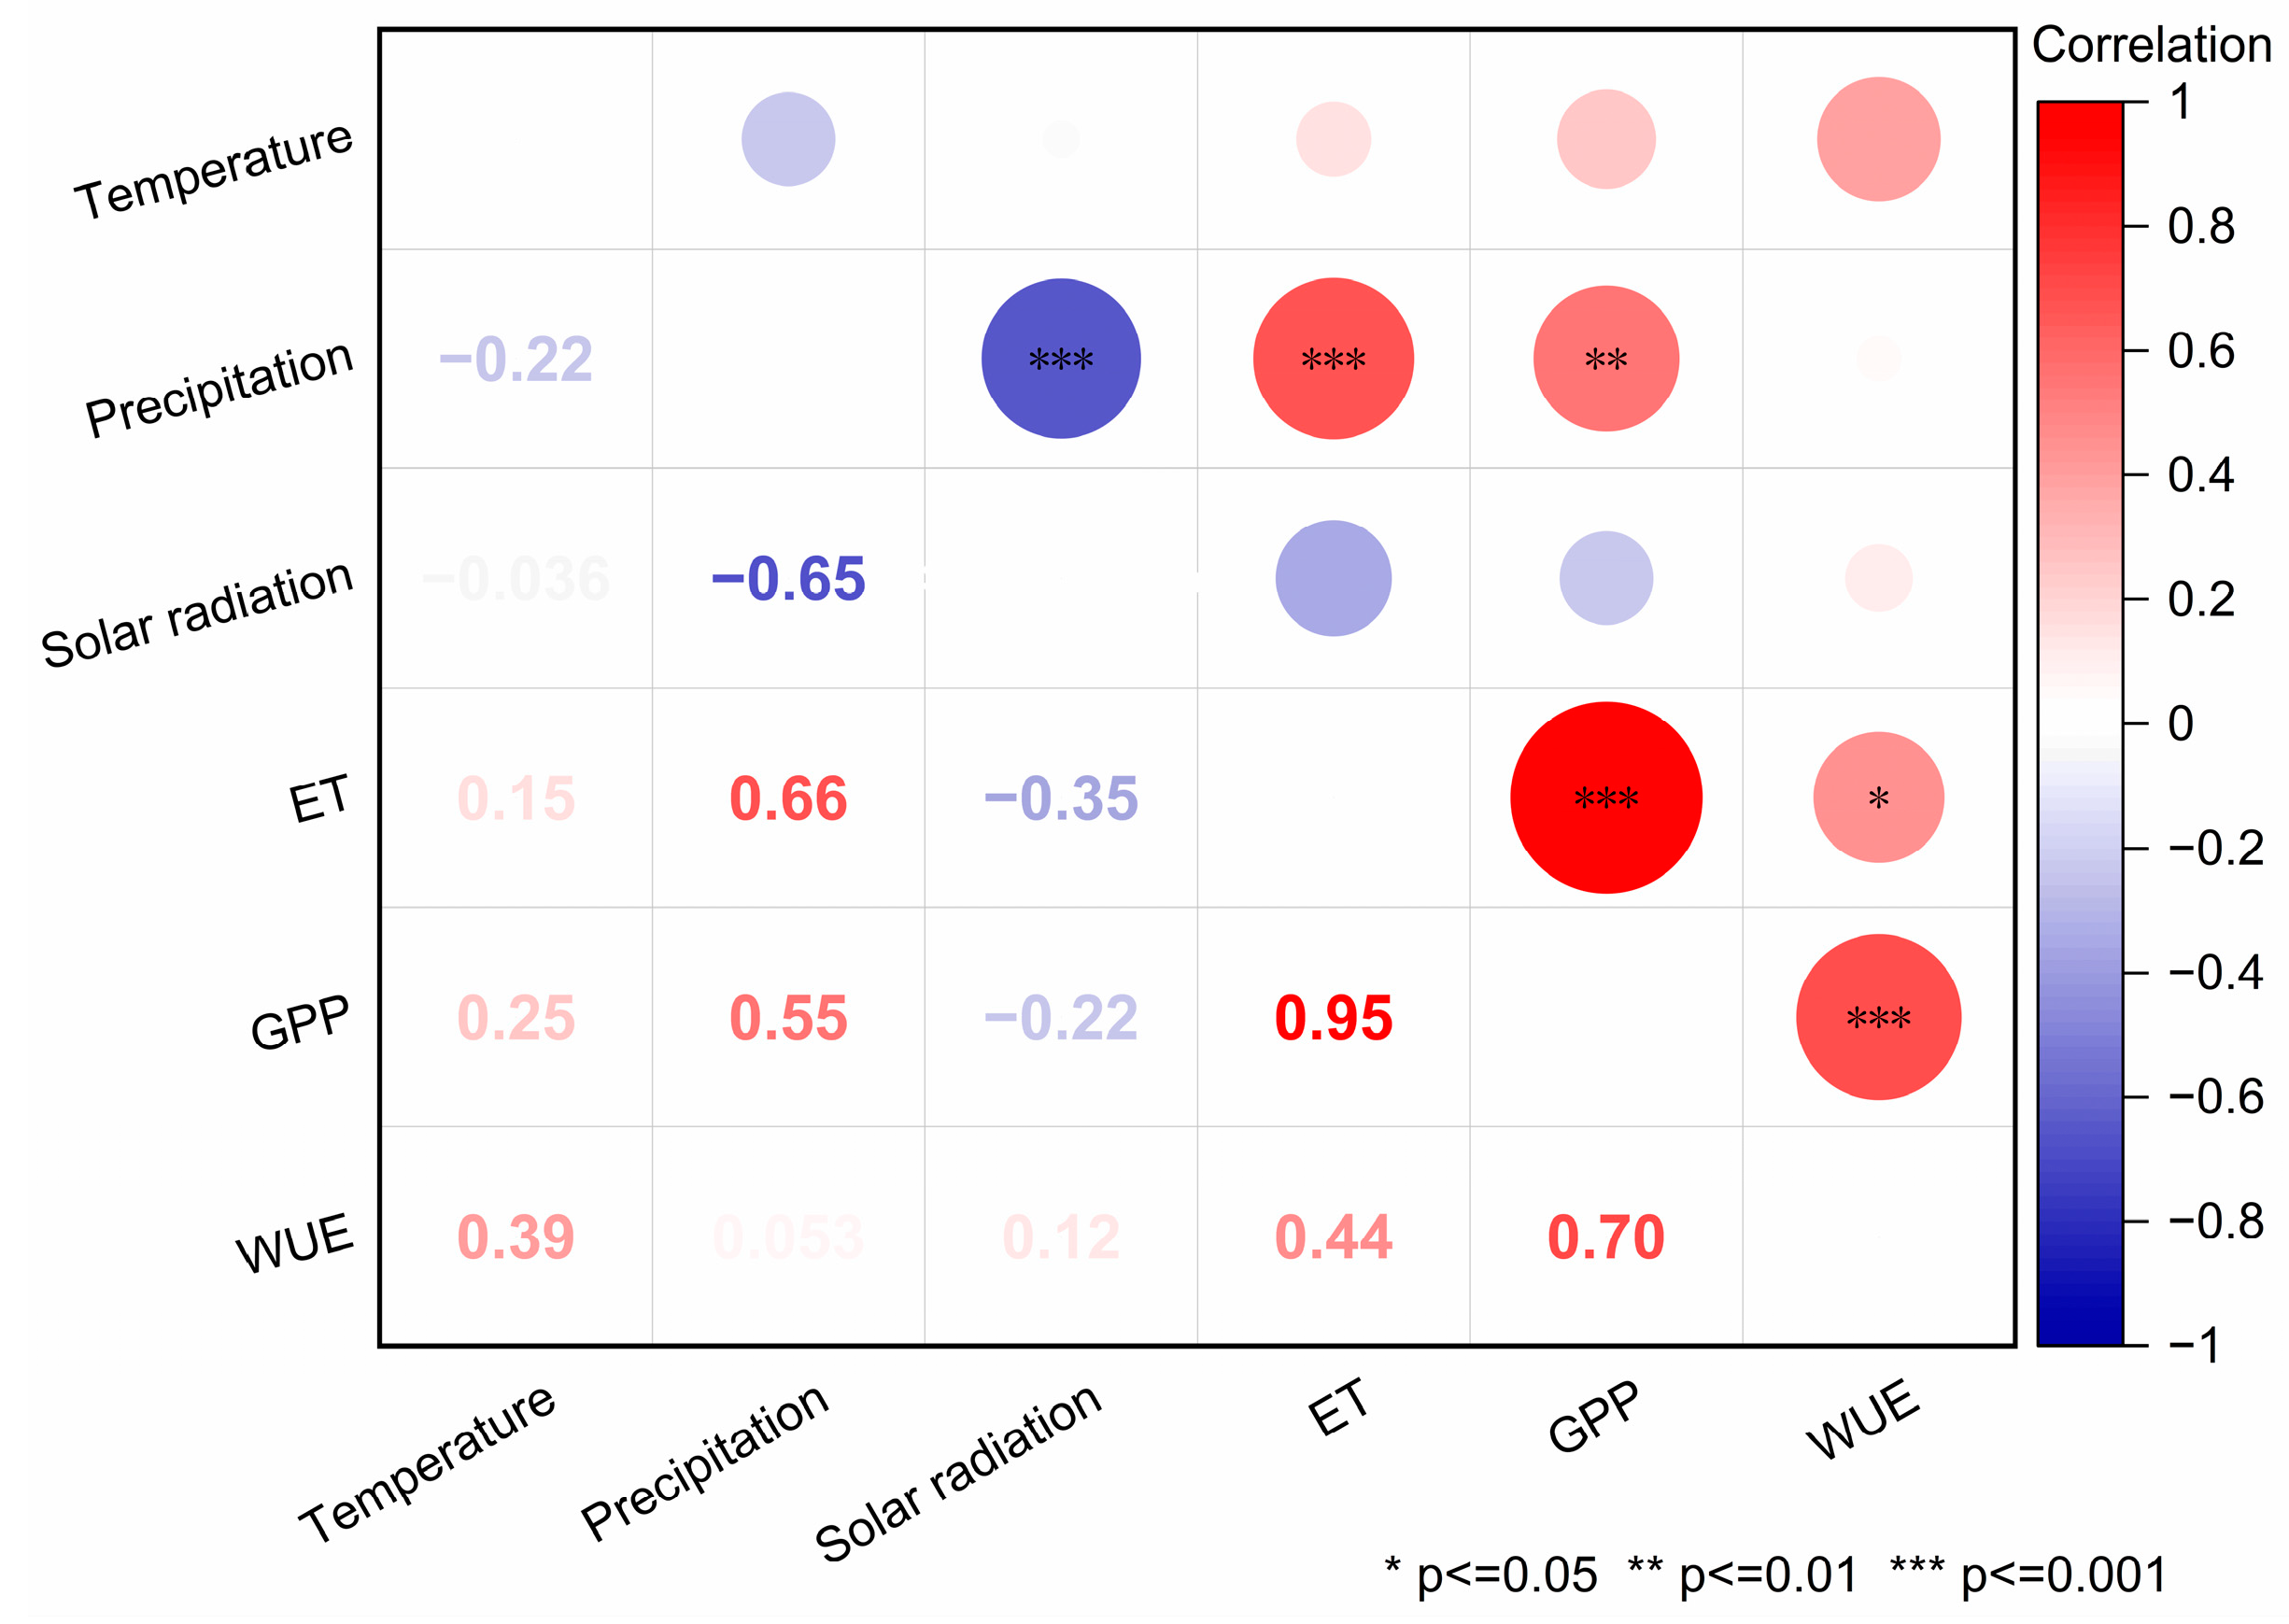
The correlation of temperature, precipitation, solar radiation, GPP, ET, and WUE in the APENC (Figure 9) shows that WUE is positively correlated with ET, and the correlation is statistically significant (p < 0.05). WUE is also significantly positively correlated with GPP (p < 0.001). Therefore, GPP is the main controlling factor of WUE in APENC on an interannual scale. It is worth noting that ET and GPP are strongly positively correlated (R = 0.95, p < 0.001), indicating that evapotranspiration increases significantly with the growth of vegetation productivity. Temperature does not show a significant correlation with ET, GPP, or WUE (R < 0.4). Precipitation is not correlated with WUE (R < 0.4), but it is significantly correlated with ET and GPP (R > 0.4, p < 0.05), indicating that adequate precipitation in the region can significantly promote plant evapotranspiration and productivity. Solar radiation shows an insignificant negative correlation with GPP and ET.

3.5. Driving Mechanism of WUE

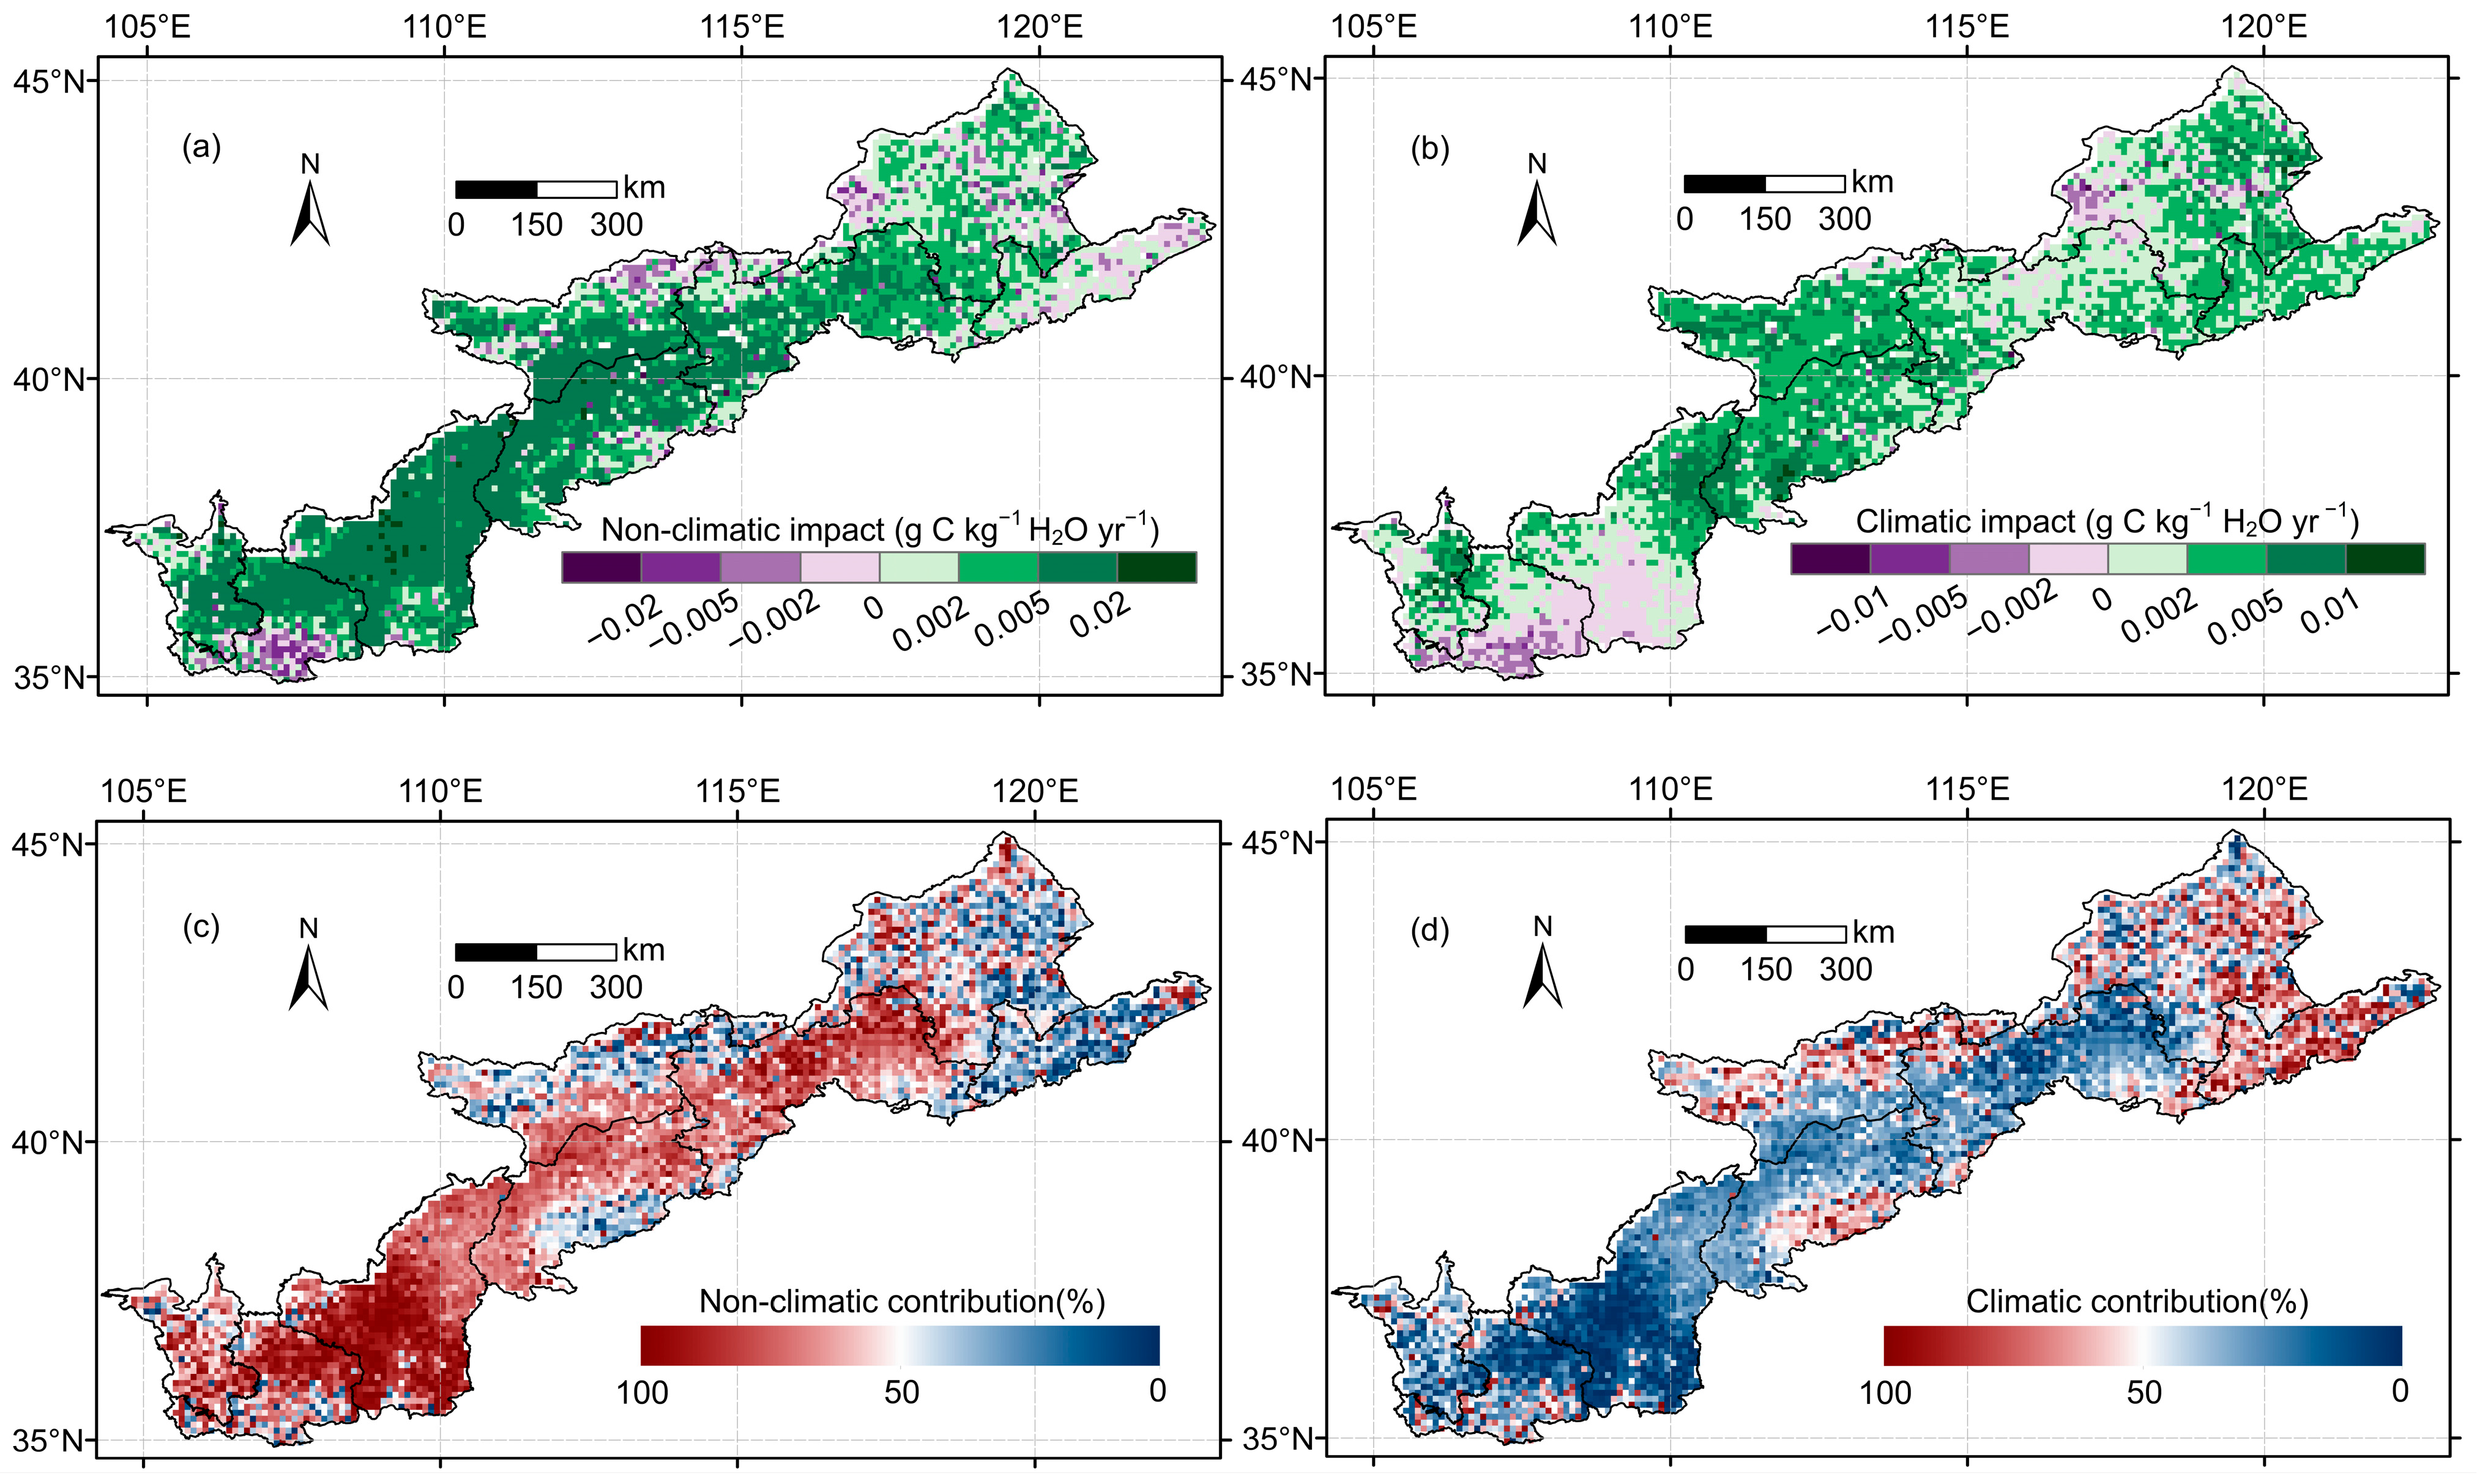
WUE is influenced not only by climatic factors but also by non-climatic factors (Figure 10). From 2001 to 2023, non-climatic factors had a positive impact on WUE in most areas of the APENC. In 41.69% (approximately 1.9 × 10⁵ km2) of the region (WUEHA > 0.005), non-climatic factors significantly promoted WUE; only 1.76% (approximately 0.8 × 10⁵ km2) of the area (WUEHA < −0.005) experienced significant suppression from non-climatic factors. The promoting effect of non-climatic factors was particularly significant in the southwestern region, while a notable suppressive effect was observed in northeastern Gansu. According to the calculation of the contribution rates of driving factors, over the past 20 years, non-climatic factors and climate change accounted for 62% (approximately 2.9 × 10⁵ km2) and 38% of the changes in WUE, respectively. Non-climatic factors make a relatively large contribution to the southwestern part of the APENC, with the highest contribution concentrated in the border region of Gansu and Ningxia. The contribution of climatic factors is primarily concentrated in the border area between Inner Mongolia and Liaoning. Improving water use efficiency requires not only better climatic conditions but also the reinforcement of the positive impacts of non-climatic factors through scientific management and technological measures.

4. Discussion

In this study, the WUE values for the APENC from 2001 to 2023 ranged from 0.32 to 2.5 g C kg−1 H2O, which is consistent with the WUE range found in research conducted in Yanchi County, Ningxia [43], and the Yellow River Basin [44] (a neighboring region of APENC). The mean WUE of the APENC (1.37 g C kg−1 H2O) is also close to the long-term mean of global semi-arid ecosystems (1.60 g C kg−1 H2O), indicating that the estimates in this study fall within a reasonable range [45]. From 2001 to 2023, both GPP and ET increased in the APENC; however, the rate of increase in GPP was faster, leading to a continuous rise in WUE. This finding aligns with the results of [46], which noted a significant improvement in water use efficiency in temperate regions and northern forests of the Northern Hemisphere. Therefore, the WUE derived from this study is credible and reasonable. WUE was significantly positively correlated with GPP, while its correlation with ET was relatively weak, indicating that the increasing trend in annual WUE was primarily driven by the increase in GPP; that is, the carbon–water coupling process was governed by changes in carbon sequestration capacity. Therefore, the increase in WUE during the afforestation and farmland-to-forest conversion in the APENC can be largely attributed to increased carbon sequestration rather than reduced water consumption.
In addition, precipitation was positively correlated with both GPP and ET, suggesting that precipitation indirectly regulated WUE through its effects on GPP and ET, which is consistent with the findings of Ma et al. [43]. At the annual scale, temperature was not significantly correlated with WUE, which differs from the results of Wang et al. [35,47], who reported a significant negative correlation between WUE and temperature, with marked monthly-scale response differences: WUE was positively correlated with temperature from September to March but negatively correlated from April to August. This discrepancy arises because our study employed annual-scale data for correlation analysis, whereas Wang et al. used monthly-scale data. At the monthly scale, temperature was the primary limiting factor for photosynthesis from September to November, where increasing temperature significantly increased GPP, but the increase in ET was relatively small under low-temperature conditions, resulting in a positive temperature and WUE correlation during this period. From April to August, high temperatures increased ET and vapor pressure deficit, leading to stomatal closure, which blocked CO2 entry into leaves and reduced GPP, thus yielding a negative WUE and temperature relationship. However, at the annual scale, the seasonal responses of WUE to temperature may offset each other, leading to no apparent overall correlation. Nevertheless, the annual-scale relationship between WUE and temperature may better reflect their long-term association.
Although this study observed a significant increasing trend in WUE over the APENC from 2001 to 2023, a major turning point in future WUE trends may occur. It is projected that approximately 60% of the APENC will exhibit a decreasing trend in WUE, which is consistent with studies conducted in the Qingshuihe River basin [48] and Inner Mongolia [49]. This is attributable to the long-term implementation of the Grain-for-Green program, under which vegetation in most parts of the APENC has approached maturity [50]. As a result, GPP has neared its threshold [51], and its growth rate will continue to decline slowly, whereas ET reaches its peak at the mature stage of vegetation and will continue to rise under climate warming. Consequently, WUE is expected to decrease across much of the APENC in the future. This is consistent with the findings of studies conducted on the Loess Plateau [50]. This result serves as a wake-up call for ecological restoration and sustainable development in the APENC region. Against the backdrop of global warming and frequent extreme drought events [52], the projected decline in WUE implies that the amount of carbon fixed per unit of water consumed is decreasing. Once prolonged drought or abrupt drought–flood alternation events occur, water supply shortages may emerge, potentially leading to large-scale vegetation degradation and severely challenging the resilience of the regional ecosystem. In the future, planting structures should be adjusted according to varying climatic and land conditions to increase WUE, and there is an urgent need to establish a “water–carbon synergistic management” mechanism to ensure the long-term stability and sustainability of the regional ecosystem.
This study primarily focused on the quantitative impact of climatic factors on changes in WUE, but it did not separately distinguish the individual effects of non-climatic factors. However, based on land use changes documented in other studies within this region [32], the non-climatic factors primarily include the increase in WUE attributed to vegetation restoration facilitated by ecological restoration projects—such as the Grain-for-Green program and grazing bans—as well as the decrease in WUE resulting from reduced vegetation cover due to built-up land expansion, among other things. It should be noted that the residual analysis method has inherent limitations: the residual term not only encompasses the effects of human activities but also incorporates observation errors in MODIS remote sensing products and uncertainties associated with the climatic regression model. Given the complex topography, extensive geographical range, and diverse vegetation types in the APENC region, future research and practice should further explore the mechanisms of non-climatic factors, such as different vegetation types and human activities. Additionally, the analysis of climatic factors should consider more driving forces that influence vegetation changes, such as wind speed, soil moisture and carbon dioxide emissions. Therefore, integrating more influencing factors into a single research model for quantitative analysis in subsequent studies is a worthwhile and effective approach to explore.
Moreover, this study relies on data such as GPP and ET obtained through remote sensing technology, which has inherent accuracy limitations. This may lead to biases in the research results and affect our deeper understanding of the dynamic changes in vegetation WUE. Therefore, it is particularly important to adopt more advanced methods or models in future research to improve the accuracy of the study.

5. Conclusions

This study analyzes the spatiotemporal variations in WUE in the APENC using remote sensing data, evaluates the future trend of WUE by combining the Hurst index and past trends, and examines the correlation between climate and non-climate factors and WUE. The results show the following: (1) From 2001 to 2023, GPP, ET, and WUE in the APENC statistically increased (GPP and ET: p < 0.05; WUE: p < 0.001), with growth rates of 10.22 g C m−2 yr−2, 5.62 kg H2O m−2 yr−2, and 0.01 g C kg−1 H2O yr−1, respectively. The uptrend of WUE in 87.41% of the region emphasizes a climatic positive effect on WUE, and the fastest growth of WUE at the border of Shaanxi and Shanxi provinces reflected the effects of anthropogenic revegetation on improving WUE. (2) The overall trend of WUE in the APENC is characterized by reverse persistence, with 32.38% of the area showing persistence (H > 0.5). WUE in 58.9% of the region is expected to reverse from an upward trend to a downward trend, while 28.5% will continue to rise. There is a larger probability of a downward trend in WUE in the future, and regions with potential declines should be closely monitored. (3) The increasing trend of WUE is determined by the rise in GPP outpacing the increase in ET, and rainfall is the dominant factor influencing the interannual variability of both GPP and ET. Non-climatic factors have played a significant role in promoting the changes in WUE in APENC. These results enhance our understanding of the water-carbon coupling mechanism in APENC and provide valuable information for future ecological restoration and management in the region.

Author Contributions

Conceptualization, Y.L. and H.P.; Methodology, Y.L. and H.P.; Software, Y.L.; Validation, M.L. and B.L.; Formal Analysis, Y.L.; Investigation, Y.L.; Data Curation, Y.L.; Writing—Original Draft Preparation, Y.L.; Writing—Review and Editing, M.L.; Supervision, H.P.; Project Administration, H.P.; Funding Acquisition, H.P. All authors have read and agreed to the published version of the manuscript.

Funding

This research was funded by the National Natural Science Foundation of China (grant number 42571052), the Fundamental Research Funds for Hebei Provincial Universities (grant number 25ZDTD03) and the Hebei Provincial Water Conservancy Science and Technology Program (grant number HBSL2025-35).

Data Availability Statement

The GPP and ET datasets used in this study are available from the MODIS products provided by the United States National Aeronautics and Space Administration (https://lpdaac.usgs.gov/, accessed on 26 May 2025). Precipitation and temperature data were obtained from the National Earth System Science Data Center of the National Science and Technology Resources Sharing Service Platform (https://www.geodata.cn/main/, accessed on 26 May 2025). Solar radiation data were provided by the ERA5 dataset on the Google Earth Engine platform. These data can be accessed directly from their respective sources.

Acknowledgments

The authors thank the Hebei University of Architecture for its academic support. The authors also thank the editor and the anonymous reviewers for their valuable and insightful comments, which helped improve the quality of this paper.

Conflicts of Interest

The authors declare no conflicts of interest.

References

  1. Hatfield, J.L.; Dold, C. Water-Use Efficiency: Advances and Challenges in a Changing Climate. Front. Plant Sci. 2019, 10, 103. [Google Scholar] [CrossRef] [PubMed]
  2. Gentine, P.; Green, J.K.; Guérin, M.; Humphrey, V.; Seneviratne, S.I.; Zhang, Y.; Zhou, S. Coupling between the Terrestrial Carbon and Water Cycles—A Review. Environ. Res. Lett. 2019, 14, 83003. [Google Scholar] [CrossRef]
  3. Green, T.; Salvucci, G.; Friedl, M.A. Climate Change Is Altering Ecosystem Water Use Efficiency in Water-limited Ecosystems. Glob. Change Biol. 2025, 31, e70459. [Google Scholar] [CrossRef] [PubMed]
  4. Xiao, G.; Zheng, F.; Qiu, Z.; Yao, Y. Impact of Climate Change on Water Use Efficiency by Wheat, Potato and Corn in Semiarid Areas of China. Agric. Ecosyst. Environ. 2013, 181, 108–114. [Google Scholar] [CrossRef]
  5. Li, J.; Qin, F.; Wang, Y.; Zhao, X.; Yu, M.; Chen, S.; Jiang, J.; Wang, L.; Yan, J. Spatiotemporal Variation of Water Use Efficiency and Its Responses to Climate Change in the Yellow River Basin from 1982 to 2018. Remote Sens. 2025, 17, 316. [Google Scholar] [CrossRef]
  6. Yang, Y.; Guan, H.; Batelaan, O.; McVicar, T.R.; Long, D.; Piao, S.; Liang, W.; Liu, B.; Jin, Z.; Simmons, C.T. Contrasting Responses of Water Use Efficiency to Drought across Global Terrestrial Ecosystems. Sci. Rep. 2016, 6, 23284. [Google Scholar] [CrossRef] [PubMed]
  7. Li, H.; Li, L.; Liu, N.; Chen, S.; Shao, L.; Sekiya, N.; Zhang, X. Root Efficiency and Water Use Regulation Relating to Rooting Depth of Winter Wheat. Agric. Water Manag. 2022, 269, 107710. [Google Scholar] [CrossRef]
  8. Pan, L.; George-Jaeggli, B.; Borrell, A.; Jordan, D.; Koller, F.; Al-Salman, Y.; Ghannoum, O.; Cano, F.J. Coordination of Stomata and Vein Patterns with Leaf Width Underpins Water-Use Efficiency in a C4 Crop. Plant Cell Environ. 2022, 45, 1612–1630. [Google Scholar] [CrossRef] [PubMed]
  9. Samuelson, L.J.; Kane, M.B.; Markewitz, D.; Teskey, R.O.; Akers, M.K.; Stokes, T.A.; Pell, C.J.; Qi, J. Fertilization Increased Leaf Water Use Efficiency and Growth of Pinus Taeda Subjected to Five Years of Throughfall Reduction. Can. J. For. Res. 2018, 48, 227–236. [Google Scholar] [CrossRef]
  10. Schymanski, S.J.; Dani, O. Wind Increases Leaf Water Use Efficiency. Plant Cell Environ. 2016, 39, 1448–1459. [Google Scholar] [CrossRef] [PubMed]
  11. Zhang, X.; Chen, S.; Sun, H.; Wang, Y.; Shao, L. Water Use Efficiency and Associated Traits in Winter Wheat Cultivars in the North China Plain. Agric. Water Manag. 2010, 97, 1117–1125. [Google Scholar] [CrossRef]
  12. Cai, W.; Ullah, S.; Yan, L.; Lin, Y. Remote Sensing of Ecosystem Water Use Efficiency: A Review of Direct and Indirect Estimation Methods. Remote Sens. 2021, 13, 2393. [Google Scholar] [CrossRef]
  13. He, Y.; Piao, S.; Li, X.; Chen, A.; Qin, D. Global Patterns of Vegetation Carbon Use Efficiency and Their Climate Drivers Deduced from MODIS Satellite Data and Process-Based Models. Agric. For. Meteorol. 2018, 256, 150–158. [Google Scholar] [CrossRef]
  14. Heinsch, F.A.; Zhao, M.; Running, S.W.; Kimball, J.S.; Nemani, R.R.; Davis, K.J.; Bolstad, P.V.; Cook, B.D.; Desai, A.R.; Ricciuto, D.M.; et al. Evaluation of Remote Sensing Based Terrestrial Productivity from MODIS Using Regional Tower Eddy Flux Network Observations. IEEE Trans. Geosci. Remote Sens. 2006, 44, 1908–1925. [Google Scholar] [CrossRef]
  15. Huang, M.; Piao, S.; Sun, Y.; Ciais, P.; Cheng, L.; Mao, J.; Poulter, B.; Shi, X.; Zeng, Z.; Wang, Y. Change in Terrestrial Ecosystem Water-use Efficiency over the Last Three Decades. Glob. Change Biol. 2015, 21, 2366–2378. [Google Scholar] [CrossRef] [PubMed]
  16. Nandy, S.; Saranya, M.; Srinet, R. Spatio-Temporal Variability of Water Use Efficiency and Its Drivers in Major Forest Formations in India. Remote Sens. Environ. 2022, 269, 112791. [Google Scholar] [CrossRef]
  17. Zou, J.; Ding, J.; Welp, M.; Huang, S.; Liu, B. Using MODIS Data to Analyse the Ecosystem Water Use Efficiency Spatial-Temporal Variations across Central Asia from 2000 to 2014. Environ. Res. 2020, 182, 108985. [Google Scholar] [CrossRef] [PubMed]
  18. Feng, X.; Fu, B.; Zhang, Y.; Pan, N.; Zeng, Z.; Tian, H.; Lyu, Y.; Chen, Y.; Ciais, P.; Wang, Y.; et al. Recent Leveling off of Vegetation Greenness and Primary Production Reveals the Increasing Soil Water Limitations on the Greening Earth. Sci. Bull. 2021, 66, 1462–1471. [Google Scholar] [CrossRef] [PubMed]
  19. Chen, J.; Cao, L. Spatiotemporal Variability in Water-Use Efficiency in Tianshan Mountains (Xinjiang, China) and the Influencing Factors. Sustainability 2022, 14, 8191. [Google Scholar] [CrossRef]
  20. Liu, X.; Lai, Q.; Yin, S.; Bao, Y.; Qing, S.; Bayarsaikhan, S.; Bu, L.; Mei, L.; Li, Z.; Niu, J.; et al. Exploring Grassland Ecosystem Water Use Efficiency Using Indicators of Precipitation and Soil Moisture across the Mongolian Plateau. Ecol. Indic. 2022, 142, 109207. [Google Scholar] [CrossRef]
  21. Naeem, S.; Zhang, Y.; Zhang, X.; Rehman, A.U.; Tang, Z.; Xu, Z.; Li, C.; Azeem, T. Recent Change in Ecosystem Water Use Efficiency in China Mainly Dominated by Vegetation Greening and Increased CO2. Remote Sens. Environ. 2023, 298, 113811. [Google Scholar] [CrossRef]
  22. Bejagam, V.; Singh, A.; Sharma, A. Spatiotemporal Variability and Controlling Factors of Ecosystem Water Use Efficiency in India. Theor. Appl. Climatol. 2023, 152, 813–827. [Google Scholar] [CrossRef]
  23. de Oliveira, G.; Brunsell, N.A.; Moraes, E.C.; Shimabukuro, Y.E.; Bertani, G.; dos Santos, T.V.; Aragao, L.E.O.C. Evaluation of MODIS-Based Estimates of Water-Use Efficiency in Amazonia. Int. J. Remote Sens. 2017, 38, 5291–5309. [Google Scholar] [CrossRef]
  24. Trenberth, K.E.; Dai, A.; van der Schrier, G.; Jones, P.D.; Barichivich, J.; Briffa, K.R.; Sheffield, J. Global Warming and Changes in Drought. Nat. Clim. Change 2014, 4, 17–22. [Google Scholar] [CrossRef]
  25. Zhao, H.; Cao, S.; Lei, Y.; Chen, L.; Li, W.; Kang, L. Spatial and Temporal Characteristics and Driving Analysis of Ecosystem Water Use Efficiency in the Qinghai Lake Basin. Acta Agrestia Sin. 2024, 32, 3554–3566. [Google Scholar]
  26. Bai, Y.; Liu, Y.; Yuan, X. Tracing the Agro-Pastoral Ecotone Transition in Northern China from the Human-Earth System Perspective. J. Geogr. Sci. 2025, 35, 783–799. [Google Scholar] [CrossRef]
  27. Yang, Y.; Wang, K.; Liu, D.; Zhao, X.; Fan, J.; Li, J.; Zhai, X.; Zhang, C.; Zhan, R. Spatiotemporal Variation Characteristics of Ecosystem Service Losses in the Agro-Pastoral Ecotone of Northern China. Int. J. Environ. Res. Public Health 2019, 16, 1199. [Google Scholar] [CrossRef] [PubMed]
  28. He, L.; Dong, G.; Wang, W.; Ming, Z. Ecosystem Status and Change Assessment of Agro-Pastoral Ecotone of North China in 2000–2010. Environ. Monit. China 2014, 30, 63–68. [Google Scholar] [CrossRef]
  29. Li, S.; An, P.; Pan, Z.; Wang, F.; Li, X.; Liu, Y. Farmers’ Initiative on Adaptation to Climate Change in the Northern Agro-Pastoral Ecotone. Int. J. Disaster Risk Reduct. 2015, 12, 278–284. [Google Scholar] [CrossRef]
  30. Liu, M.; Zhang, H.; Pei, H. Characteristics of Habitat Quality in the Agro-pastoral Ecotone of Northern China Based on Land Uses. Res. Soil Water Conserv. 2020, 38, 71–75. [Google Scholar] [CrossRef]
  31. MARAC. Ministry of Agriculture and Rural Affairs of the People’s Republic of China. Available online: https://www.moa.gov.cn/gk/tzgg_1/tz/201611/t20161130_5383030.htm (accessed on 14 October 2025).
  32. Liu, M.; Jia, Y.; Zhao, J.; Shen, Y.; Pei, H.; Zhang, H.; Li, Y. Revegetation Projects Significantly Improved Ecosystem Service Values in the Agro-Pastoral Ecotone of Northern China in Recent 20 Years. Sci. Total Environ. 2021, 788, 147756. [Google Scholar] [CrossRef] [PubMed]
  33. Reichstein, M.; Tenhunen, J.D.; Roupsard, O.; Ourcival, J.; Rambal, S.; Miglietta, F.; Peressotti, A.; Pecchiari, M.; Tirone, G.; Valentini, R. Severe Drought Effects on Ecosystem CO2 and H2O Fluxes at Three Mediterranean Evergreen Sites: Revision of Current Hypotheses? Glob. Change Biol. 2002, 8, 999–1017. [Google Scholar] [CrossRef]
  34. Fensholt, R.; Proud, S.R. Evaluation of Earth Observation Based Global Long Term Vegetation Trends—Comparing GIMMS and MODIS Global NDVI Time Series. Remote Sens. Environ. 2012, 119, 131–147. [Google Scholar] [CrossRef]
  35. Wang, D.; Zhao, C.; Zhang, Y.; Jia, D.; Yu, H.; Gao, J.; Han, F.; Li, L. The Lag and Cumulative Response of Water Use Efficiency to the Climate on the Shiyang River Basin, Northwest of China. Sci. Rep. 2025, 15, 23659. [Google Scholar] [CrossRef] [PubMed]
  36. Peng, J.; Liu, Z.; Liu, Y.; Wu, J.; Han, Y. Trend Analysis of Vegetation Dynamics in Qinghai-Tibet Plateau Using Hurst Exponent. Ecol. Indic. 2012, 14, 28–39. [Google Scholar] [CrossRef]
  37. Xu, N.; Dang, G.; Yang, T.; Zhang, K.; Zhen, B.; Wang, L.; Hu, J. Spatial and Temporal Patterns of Vegetation Water Use Efficiency and Its Response to Climatic and Environmental Factors in Gansu Province. Sustainability 2024, 16, 8578. [Google Scholar] [CrossRef]
  38. Chang, J.; Liu, Q.; Wang, S.; Huang, C. Vegetation Dynamics and Their Influencing Factors in China from 1998 to 2019. Remote Sens. 2022, 14, 3390. [Google Scholar] [CrossRef]
  39. Wei, Z.; Wan, X. Spatial and Temporal Characteristics of NDVI in the Weihe River Basin and Its Correlation with Terrestrial Water Storage. Remote Sens. 2022, 14, 5532. [Google Scholar] [CrossRef]
  40. Xu, Y.; Dai, Q.; Lu, Y.; Zhao, C.; Huang, W.; Xu, M.; Feng, Y. Identification of Ecologically Sensitive Zones Affected by Climate Change and Anthropogenic Activities in Southwest China through a NDVI-Based Spatial-Temporal Model. Ecol. Indic. 2024, 158, 111482. [Google Scholar] [CrossRef]
  41. Gao, M.; Liu, Q.; Liu, Y.; Yang, N.; Wang, Y.; Li, X. Spatial and Temporal Variations of Vegetation Water Use Efficiency and Its Response to Climate Change and Human Activities in the West Liao River Plain, China. Front. Ecol. Evol. 2023, 11, 1176131. [Google Scholar] [CrossRef]
  42. Gao, Y.; Yang, T.; Ye, Z.; Lin, J.; Yan, K.; Bi, J. Global Vegetation Greenness Interannual Variability and Its Evolvement in Recent Decades. Environ. Res. Commun. 2023, 5, 51011. [Google Scholar] [CrossRef]
  43. Ma, L.; Yi, Z.; Wei, C.; Zhou, F.; Li, M.; Qiao, C.; Du, L. Temporal and Spatial Characteristics of Ecosystem Water Use Efficiency and Influencing Factors in Yanchi County, Ningxia, China. Arid Zone Res. 2024, 41, 650–660. [Google Scholar] [CrossRef]
  44. Liu, S.; Xue, L.; Xiao, Y.; Yang, M.; Liu, Y.; Han, Q.; Ma, J. Dynamic Process of Ecosystem Water Use Efficiency and Response to Drought in the Yellow River Basin, China. Sci. Total Environ. 2024, 934, 173339. [Google Scholar] [CrossRef] [PubMed]
  45. Zhang, L.; Xiao, J.; Zheng, Y.; Li, S.; Zhou, Y. Increased Carbon Uptake and Water Use Efficiency in Global Semi-Arid Ecosystems. Environ. Res. Lett. 2020, 15, 034022. [Google Scholar] [CrossRef]
  46. Liu, Y.; Xiao, J.; Ju, W.; Zhou, Y.; Wang, S.; Wu, X. Water Use Efficiency of China’s Terrestrial Ecosystems and Responses to Drought. Sci. Rep. 2015, 5, 13799. [Google Scholar] [CrossRef] [PubMed]
  47. Guo, X.; Zhang, X.; Zhang, Z.; Yang, H.; Zhu, W.; Feng, S. The Non-Uniform Time-Lag and Cumulative Responses of Terrestrial Ecosystem Water Use Efficiency to Climate Change in Lake Victoria Basin, East Africa. J. Hydrol. 2023, 625, 130081. [Google Scholar] [CrossRef]
  48. Yan, X.; Yu, X.; Peng, Y. Spatiotemporal variations and influencing factors of vegetation water use efficiency in Qingshui River basin. Bull. Soil Water Conserv. 2025, 45, 372–383. [Google Scholar] [CrossRef]
  49. Li, H.; Liu, T.; Wang, S.; Liu, D. Spatial and temporal variation of water use efficiency and its influencing factors in desert steppe of Inner Mongolia from 2001 to 2021. Arid Land Geogr. 2024, 47, 993–1003. [Google Scholar]
  50. Feng, X.; Fu, B.; Piao, S.; Wang, S.; Ciais, P.; Zeng, Z.; Lü, Y.; Zeng, Y.; Li, Y.; Jiang, X.; et al. Revegetation in China’s Loess Plateau Is Approaching Sustainable Water Resource Limits. Nat. Clim. Change 2016, 6, 1019–1022. [Google Scholar] [CrossRef]
  51. Luyssaert, S.; Schulze, E.-D.; Boerner, A.; Knohl, A.; Hessenmoeller, D.; Law, B.E.; Ciais, P.; Grace, J. Old-Growth Forests as Global Carbon Sinks. Nature 2008, 455, 213–215. [Google Scholar] [CrossRef] [PubMed]
  52. Disasa, K.N.; Yan, H.; Zhang, J.; Wang, G.; Zhang, C.; Zhang, D.; Wang, B.; Hao, B. Comprehensive Review of Drought Characteristics and Intensification under Climate Change: Implications for Agriculture and Water Resources. J. Hydrol. 2026, 664, 134571. [Google Scholar] [CrossRef]
Figure 1. Location, land use, and elevation of the Agro-Pastoral Ecotone of Northern China (APENC).
Hydrology 13 00205 g001
Figure 2. Methodological framework diagram of this study.
Hydrology 13 00205 g002
Figure 3. Variations in annual evapotranspiration (ET), gross primary productivity (GPP), air temperature, precipitation, and solar radiation from 2001 to 2023 in the APENC. The dashed line represents the linear regression fitted by ordinary least squares (OLS).
Hydrology 13 00205 g003
Figure 4. Time series of annual (a) ET and (b) GPP from 2001 to 2023. The multi-year averages are 379.73 kg H2O m−2 for ET and 539.01 g C m−2 for GPP.
Hydrology 13 00205 g004
Figure 5. Variations in annual WUE from 2001 to 2023. The dashed line represents the linear regression fitted by ordinary least squares (OLS).
Hydrology 13 00205 g005
Figure 6. (a) Temporal trend of WUE from 2001 to 2023 and (b) spatial distribution of its multi-year average. The multi-year average was 1.37 g C kg−1 H2O.
Hydrology 13 00205 g006
Figure 7. Monthly WUE variations from 2001 to 2023 (a); monthly average WUE across the 23-year period (b).
Hydrology 13 00205 g007
Figure 8. (a) Sustainability of the annual WUE variation from 2001 to 2023 based on the Hurst index; (b) future WUE dynamic trends.
Hydrology 13 00205 g008
Figure 9. Correlation of temperature, precipitation, solar radiation, ET, GPP, and WUE. Larger circles represent stronger correlations.
Hydrology 13 00205 g009
Figure 10. (a) Non-climatic impact and (c) its contribution to WUE variations, as well as (b) the climatic impact and (d) its contribution to WUE variations in the APENC.
Hydrology 13 00205 g010
Disclaimer/Publisher’s Note: The statements, opinions and data contained in all publications are solely those of the individual author(s) and contributor(s) and not of MDPI and/or the editor(s). MDPI and/or the editor(s) disclaim responsibility for any injury to people or property resulting from any ideas, methods, instructions or products referred to in the content.