Article

Multivariate Characterization of Hydrochemically Similar Groundwaters: Resolving Hydrochemical Structure and Process-Related Variability

1
Department of Molecular Biotechnology and Health Sciences, University of Turin, 10126 Turin, Italy
2
Department of Chemistry, University of Turin, 10126 Turin, Italy
*
Author to whom correspondence should be addressed.
Hydrology 2026, 13(8), 204; https://doi.org/10.3390/hydrology13080204
Submission received: 25 May 2026 / Revised: 29 June 2026 / Accepted: 22 July 2026 / Published: 28 July 2026
(This article belongs to the Topic Advances in Groundwater Science and Engineering)

Abstract

Groundwater systems sharing similar major-ion facies may still differ in their hydrochemical organization and mineralization pathways, particularly in structurally complex aquifer settings. This study evaluated multivariate chemometric approaches for investigating two hydrochemically similar groundwater systems (MAJA and MAJA2) examined within the regulatory framework for natural mineral water recognition. The dataset consisted of a 13-month monitoring campaign complemented by an independent multi-year validation dataset. Hydrochemical variables were organized into chemical and process-related blocks, including major ions, physicochemical parameters, D’Amore indices, and mineral saturation indices. SIMCA was applied to evaluate the intra-class hydrochemical structure, and OPLS-DA was used to investigate predictive and orthogonal sources of variability. Model robustness and parameter reproducibility were assessed using jackknife resampling, Leave-One-Month-Out cross-validation, repeated double cross-validation, and permutation testing. SIMCA identified PC1 as the only consistently reproducible latent component across resampling iterations. An exploratory Structural Response Coefficient ( R j ) was introduced as a model-derived descriptor integrating explained and residual variance within the SIMCA model. OPLS-DA models showed stable class-related latent structures under nested validation conditions. Electrical conductivity, sulphate, potassium, SI_gypsum, SI_halite, and D’Amore index A were the variables most consistently associated with discriminant variability. Stable isotope data indicated a common meteoric origin and similar recharge conditions for both systems. The results illustrate how multivariate chemometric analysis, combined with stability-oriented validation procedures, may aid the interpretation of hydrochemical variability in compositionally similar groundwater systems.

1. Introduction

The recognition of natural mineral water requires the demonstration of a stable and distinctive hydrogeological identity, supported by the long-term constancy of its chemical composition and a well-defined origin within a specific aquifer system. According to European legislation, natural mineral water is defined as water originating from an underground water table or deposit, emerging from a spring and protected from contamination, the composition of which must remain stable within natural fluctuations [1]. This regulatory context implies that groundwater characterization must be interpreted within a comprehensive hydrogeological context. Groundwater chemistry is primarily controlled by lithology, groundwater flow paths, residence time, and water–rock interaction processes occurring during aquifer circulation [2,3,4,5]. These processes reflect the interaction between water and the geological matrix and are essential for defining the origin and identity of mineral waters [6]. Traditional hydrogeochemical approaches, based on the analysis of major ions and their graphical representation through diagrams such as Piper, Schoeller, and Gibbs plots, provide a robust and widely accepted framework for first-order interpretation and for defining the general geochemical signature of groundwater systems [7,8,9]. However, in complex hydrogeological settings, waters that share the same hydrochemical facies may originate from different circulation depths, flow systems, or geochemical evolution pathways [10]. In this context, multivariate statistical analysis provides a complementary approach for evaluating complex hydrochemical datasets while preserving their multivariate structure. Techniques such as PCA, cluster analysis, and Partial Least Squares-based methods have been widely applied to groundwater classification, hydrochemical evolution, and regional geochemical variability [5,11,12,13,14,15]. A process-oriented perspective is further provided by derived hydrogeochemical parameters, such as the indices proposed by D’Amore et al., which are calculated from the relative distribution of major ions expressed in milliequivalents [16]. These indices were developed to emphasize geochemical processes, allowing the identification of carbonate versus sulphate circulation, evaporitic contributions, silicate interactions, and deeper or more evolved groundwater systems. Similarly, saturation indices calculated through geochemical modelling (e.g., PHREEQC) provide additional insight into equilibrium conditions and mineral stability [15]. Their combined use with chemometric techniques can provide a more comprehensive representation of groundwater systems, facilitating the integration between descriptive hydrochemical classification and process-based interpretation. In this study, two groundwater systems (MAJA and MAJA2), characterized by similar hydrochemical facies and potentially different hydrogeological settings, are investigated with the aim of evaluating whether a chemometric approach can support and refine their hydrogeological classification. The two capture points are located a few hundred meters apart and display similar Ca–HCO3 facies. This study evaluates whether multivariate chemometric analysis can support the differentiation of compositionally similar groundwater systems. The novelty lies in the integration of conventional hydrochemical descriptors and process-oriented variables, including D’Amore indices and mineral saturation indices, within complementary SIMCA and OPLS-DA frameworks supported by stability-oriented validation procedures.

2. Materials and Methods

2.1. Study Area and Hydrogeological Setting

The study area is located within the Sulmona intramontane basin (Abruzzo, central Italy), a tectonically controlled depression filled by Quaternary continental and fluvio-lacustrine deposits and bordered by Mesozoic carbonate massifs, particularly the Monte Morrone ridge. The regional hydrogeological framework is characterized by carbonate aquifers hydraulically connected with heterogeneous basin sediments.
The investigated groundwater systems (MAJA and MAJA2) are located within the central sector of the Sulmona basin alluvial plain and are captured from two wells (MAJA: 42.08026° N, 13.91308° E; MAJA2: 42.07950° N, 13.90906° E). The MAJA well was drilled to 435 m below ground level and groundwater abstraction was completed from a depth of approximately 235 m. The MAJA2 well reached a total depth of 221 m. Both wells intercept confined permeable horizons embedded within predominantly low-permeability lacustrine and palustrine deposits. Pumping tests and piezometric observations were performed during well development and regulatory investigation activities. Both waters are conventionally classified as Ca–HCO3-type.

2.2. Sampling Strategy and Datasets

A monitoring campaign was conducted over 13 months with monthly sampling, in accordance with regulatory requirements for natural mineral water recognition. Primary analyses were performed by an accredited laboratory (LAB1), while three monthly duplicate samples were analyzed by our university laboratory (LAB2) to assess inter-laboratory comparability. The training dataset consisted of 26 observations, corresponding to 13 monthly samples collected from MAJA and 13 monthly samples collected from MAJA2 during the 13-month monitoring campaign. The temporal validation dataset consisted of 24 observations collected over a longer period and included all available historical analyses for each groundwater system (14 MAJA samples collected between 2017 and 2025 and 10 MAJA2 samples collected between 2022 and 2025). The validation dataset was used to assess temporal reproducibility of the chemometric models under conditions not included in model calibration. Because the validation samples originated from the same hydrogeological system, the temporal validation strategy was intended to evaluate temporal reproducibility rather than geographical model transferability. Primary analyses were performed by an accredited laboratory (LAB1), while three duplicate samples analyzed by both laboratories were used to assess inter-laboratory consistency. A systematic additive bias, but no concentration-dependent bias, was observed. Therefore, an additive correction factor estimated from these paired samples was applied to harmonize the datasets.

2.3. Chemical and Isotopic Analyses

Physicochemical analyses were performed by an external laboratory accredited according to ISO/IEC 17025, using standardized analytical methods. Major cations (Ca2+, Mg2+, Na+, and K+) were determined by inductively coupled plasma optical emission spectrometry (ICP-OES) using Thermo Fisher Scientific instrumentation (Waltham, MA, USA). Major inorganic anions (SO42−, Cl, and NO3) were determined by ion chromatography using a Thermo Fisher Scientific instrument (Waltham, MA, USA), whereas bicarbonate (HCO3) was determined by acid–base titration. In the historical validation dataset (LAB2), major cations and anions were determined simultaneously by ion chromatography using an integrated two-channel system consisting of a Metrohm 940 IC for cation analysis and a Metrohm 930 IC for anion analysis (Metrohm AG, Herisau, Switzerland). Each chromatographic channel was equipped with an independent conductivity detector cell. Instrument control, data acquisition, and chromatographic data processing were performed using MagIC Net version 3.3 (Metrohm AG, Herisau, Switzerland). Bicarbonate (HCO3) was determined by automated acid–base titration using a Metrohm OMNIS titrator (Metrohm AG, Herisau, Switzerland). Concentrations were expressed in mg L−1 and converted to meq L−1 for hydrochemical calculations. RF (fixed residue at 180 °C) provides a measure of overall dissolved mineral content and was included as a complementary descriptor of total groundwater mineralization. Analytical consistency was evaluated through the ionic balance error (IBE) calculated between total major cations and anions, with values within ±5% considered analytically acceptable [2]. Saturation indices (SI) were calculated using PHREEQC v3 (U.S. Geological Survey, Reston, VA, USA) [15]. PHREEQC calculations were performed using measured concentrations of major ions and pH as model inputs. The wateq4f.dat thermodynamic database was selected because it includes the mineral phases relevant to the investigated hydrogeological setting. Saturation indices were calculated for calcite, dolomite, gypsum, and halite, representing the principal carbonate and evaporite phases potentially controlling groundwater chemistry within the study area. These parameters were used as process-related descriptors of water–rock interactions and mineralization pathways complementary to the information provided by major-ion concentrations. D’Amore indices (A–F) were calculated from major ions (meq L−1) to describe hydrogeochemical processes related to carbonate dissolution, evaporite influence, and cation exchange [16]. Definitions and hydrogeochemical interpretations of D’Amore indices are reported in Table S7 of the Supplementary Materials. Derived parameters were used as complementary descriptors. Stable isotope compositions of water (δ18O and δ2H) were determined by wavelength-scanned cavity ring-down spectroscopy (WS-CRDS) using an L2120-i isotopic water analyser (Picarro, Inc., Santa Clara, CA, USA). Water samples required no pretreatment. Results were expressed in δ notation as ‰ relative to VSMOW2. The reported measurement uncertainties were ±0.2‰ for δ18O and ±1‰ for δ2H. Tritium (3H) was determined by liquid scintillation counting (LSC) after electrolytic enrichment, following method QMA 504-2/1:2011-09, at the external ISO/IEC 17025-accredited laboratory. Tritium results were expressed in Tritium Units (TU), where 1 TU corresponds to one tritium atom per 1018 hydrogen atoms and approximately 0.12 Bq L−1; the analytical uncertainty was reported individually for each measurement. Stable isotope and tritium data were used to investigate groundwater origin, recharge processes, and circulation dynamics [17,18,19]. The isotopic composition of MAJA and MAJA2 was evaluated relative to the meteoric water line to assess recharge conditions and possible evaporation effects. Groundwater regression lines were calculated solely to describe the covariance structure of the isotopic datasets and were not interpreted as local meteoric water lines. The d-excess parameter was additionally used to evaluate potential evaporative modification prior to infiltration. Stable isotope parameters were not included in the chemometric models because isotopic data were available only for the training dataset and not for the temporal validation dataset. Therefore, isotopic variables were used for isotopic characterization and hydrogeological interpretation of the groundwater systems investigated. Summary statistics of hydrochemical parameters, isotopic variables, and process-related descriptors are reported in Tables S5 and S6 of the Supplementary Materials.

2.4. Multivariate Statistical Analysis

Data were autoscaled (mean-centred and scaled to unit variance) prior to modelling. Scaling parameters estimated from the training dataset were applied to the validation samples before projection into the latent-variable space. Chemometric analyses were performed using PLS_Toolbox v9.5 (Eigenvector Research Inc., Manson, WA, USA) implemented in MATLAB R2024a (MathWorks, Natick, MA, USA). Two variable groups were considered: the chemical variable block consisted of directly measured hydrochemical parameters (major ions, EC, and RF), whereas the process variable block consisted of derived descriptors (D’Amore indices and mineral saturation indices) intended to represent hydrogeochemical processes rather than absolute chemical composition. This separation was adopted to distinguish compositional variability from process-related variability and to evaluate their respective contributions to groundwater differentiation. Model interpretation focused primarily on stable latent structures and recurrent variables identified during resampling. SIMCA was used to model class structure through class-specific PCA models, allowing characterization of the intrinsic variability of MAJA and MAJA2 [20]. OPLS-DA was applied to explore hydrochemical differences between the two groundwater systems while separating predictive and orthogonal sources of variability [21,22]. Internal validation was performed using a Leave-One-Month-Out (LOMO) cross-validation scheme combined with jackknife resampling to evaluate latent-structure reproducibility and parameter stability. For OPLS-DA models, robustness was further assessed through repeated double cross-validation (rDCV) and permutation testing [23,24,25,26]. All model parameters were estimated exclusively within the cross-validation loops to avoid data leakage, while an independent temporal validation dataset was used to assess model reproducibility over time. Reported Q 2 values correspond to external predictive estimates ( Q e x t 2 ) calculated exclusively from the independent validation dataset, whereas internal model performance was evaluated using nested cross-validation metrics ( R C V 2 , RMSECV, and MAE). Model robustness was further assessed through jackknife resampling, permutation testing, and FM/CV indicators [23,24,25]. FM% represents the deviation between full-model and jackknife estimates, whereas CV% describes variability across cross-validation iterations. Lower FM% and CV% values indicate greater parameter stability and reproducibility. Because no universally accepted thresholds exist, both metrics were interpreted comparatively to identify the most reproducible latent variables and descriptors.

2.5. Structural Response Coefficient (Rj)

To evaluate variable relevance within the unsupervised SIMCA model, a Structural Response Coefficient (Rj) was introduced as an exploratory descriptor. In PCA-based models, variable importance is commonly evaluated through a loading-based contribution, which reflects the proportion of explained variance associated with each variable but does not account for residual variance. The Structural Response Coefficient (Rj) was defined as follows:
R j = k = 1 A p j k 2 λ k * Q j
where p j k 2 is the squared loading of variable j on component k , and λ k * = λ k k = 1 A λ k is the normalized eigenvalue associated with component k . The residual term Q j was defined as the sample variance of the residuals associated with variable j :
Q j = 1 n 1 i = 1 n ( e i j e ¯ j ) 2
where e i j represents the residual of variable j for observation i , e ¯ j is the mean residual of variable j , and n is the number of observations. Rj represents the balance between explained and residual variance for each variable, providing an exploratory measure of both structural contribution and quality of representation within the latent-variable model. High Rj values indicate variables that contribute strongly to the latent structure while showing limited residual variance, suggesting stable representation within the model. Rj was evaluated through jackknife LOMO resampling, selection frequency analysis, and comparison with loading-based contribution. Variables repeatedly identified across jackknife iterations were considered structurally recurrent descriptors within the SIMCA framework.

3. Results

3.1. Isotopic Data

The isotopic composition of MAJA and MAJA2 waters shows strong overlap for both δ18O and δ2H. MAJA samples exhibit mean values of δ18O = −10.87 ± 0.19‰ and δ2H = −70.98 ± 0.64‰, while MAJA2 shows slightly higher values (δ18O = −11.03 ± 0.15‰; δ2H = −71.77 ± 0.56‰). Summary of isotopic parameters (δ18O, δ2H, tritium, and d-excess) is provided in Table S4, while the isotopic relationships are shown in Figure S3 of the Supplementary Materials. All samples cluster close to the meteoric water line, with no systematic deviation indicative of significant evaporative enrichment. The d-excess values remain relatively high and stable in both datasets (≈16–17‰). Tritium concentrations range between approximately 2 and 4 TU, with mean values of 3.19 ± 0.55 TU for MAJA and 3.12 ± 0.53 TU for MAJA2. MAJA shows slightly greater isotopic variability than MAJA2, while MAJA2 exhibits more stable isotopic behaviour over time.

3.2. SIMCA Models

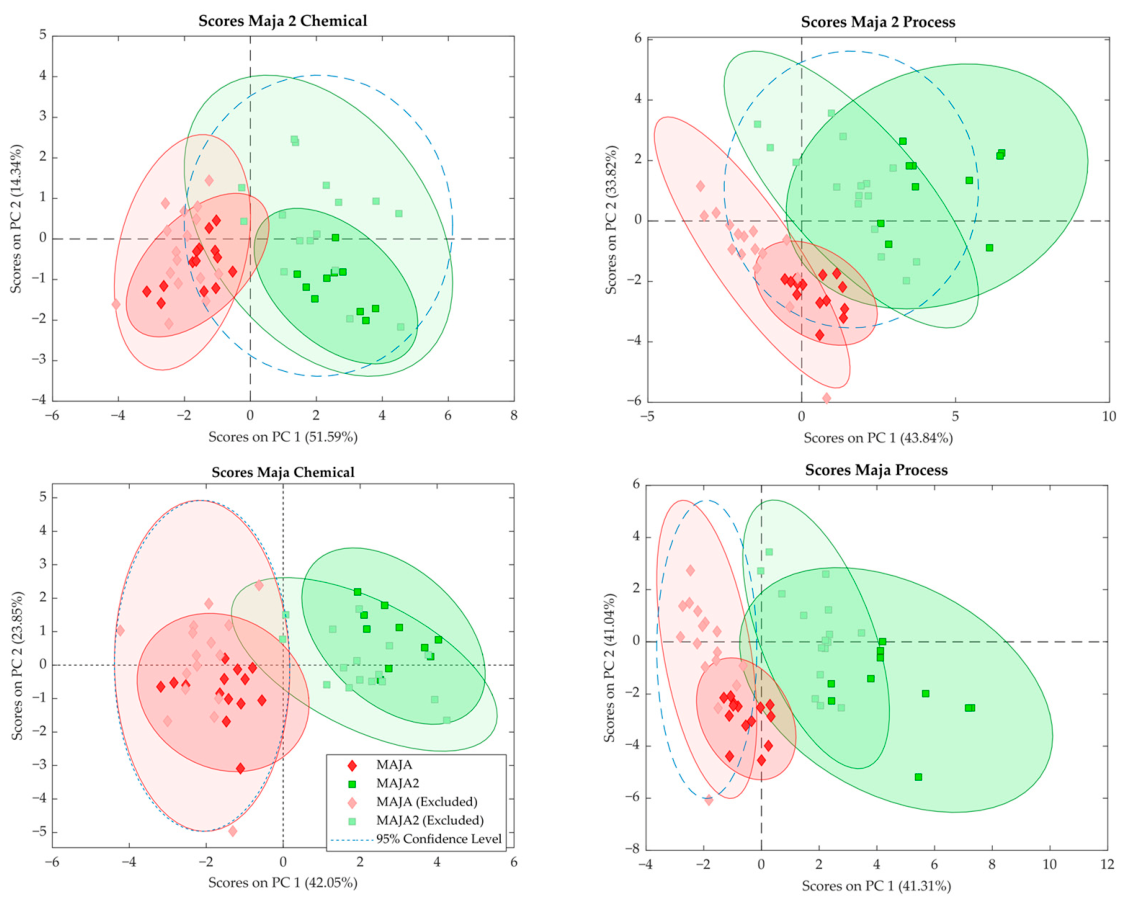
SIMCA models were applied separately to MAJA and MAJA2 datasets using chemical and process variable blocks. For MAJA2, the cumulative explained variance of the retained SIMCA components in the chemical and process variable blocks was 65.9% and 77.7%, respectively, whereas MAJA explained 65.9% and 82.4%. Jackknife resampling identified PC1 as the only reproducible component according to the FM/CV criteria in both datasets. Components showing lower FM% and CV% values were considered more stable across resampling iterations. Although additional components contributed to cumulative explained variance, PC2 and PC3 did not satisfy the reproducibility criteria based on FM/CV indicators and were therefore not considered for variable interpretation. Variable relevance was evaluated using PC1 contribution, Structural Response Coefficient (Rj), associated stability metrics, and recurrence frequency. Complete variable-level results for all chemical and process descriptors are reported in Tables S1 and S2 of the Supplementary Materials. In both datasets, PC1 accounted for the largest proportion of variability within the chemical variable block and described the main compositional gradient observed among groundwater samples. For MAJA, the variables contributing most strongly to PC1 were sulphate, RF, potassium, electrical conductivity (EC), and SiO2, whereas MAJA2 was mainly associated with RF, EC, potassium, sodium, and SiO2 (Table 1). Although SiO2 exhibited a relatively high loading contribution to PC1, its low Rj values and low recurrence frequency indicated limited structural stability across resampling iterations. Therefore, the interpretation of recurrent hydrochemical descriptors was based primarily on variables showing both high PC1 contribution and consistent Rj recurrence. The process variable block showed clearer class separation than the chemical variable block (Figure 1). In MAJA, the dominant variables associated with PC1 were C, E, SI_calcite, and SI_dolomite, while MAJA2 was mainly characterized by D’Amore indices A, D, and F together with SI_gypsum (Table 2). FM% and CV% stability metrics evaluated latent-structure reproducibility.
Table 1 and Table 2 summarize the median SIMCA variable relevance and stability metrics for the MAJA2 chemical-variable and process-variable blocks. The PC1 contribution (%) represents the median loading-based contribution of each variable obtained from jackknife LOMO iterations. FM/CV (%) indicates full-model deviation and cross-validation variability. PC Rec. (%) and Rj Rec. (%) represent recurrence frequency across jackknife iterations.
The SIMCA score plots (Figure 1) show broader confidence regions and greater overlap for MAJA2 compared with MAJA, particularly in the process variable block. This behaviour is consistent with the jackknife results, indicating lower reproducibility and greater structural heterogeneity for MAJA2.

3.3. OPLS-DA Modelling and Validation

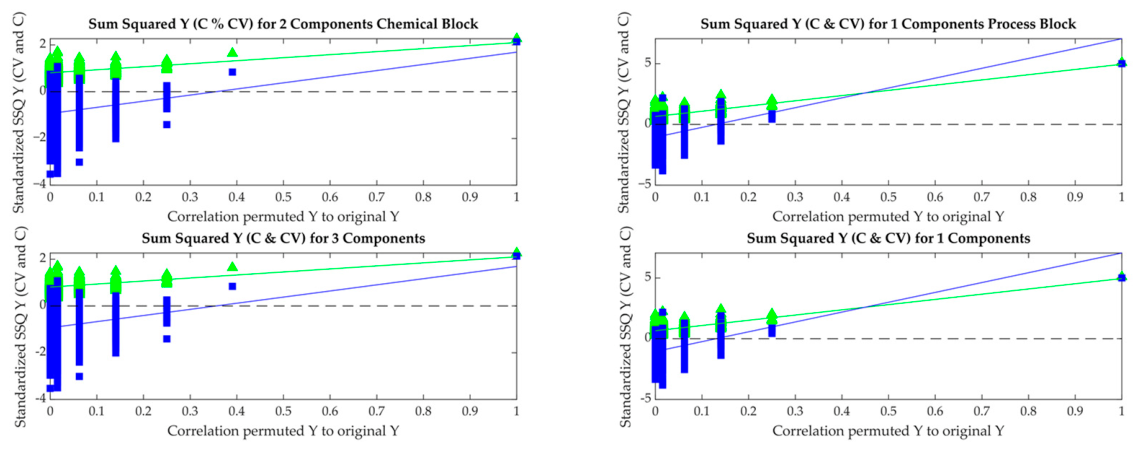
The OPLS-DA models were constructed using three latent variables to describe predictive and orthogonal variability. In the chemical variable block, LV1 explained 48.5% of total variance and LV2 accounted for 13.4%, whereas in the process variable block, LV1 and LV2 explained 29.1% and 34.7%, respectively. Jackknife resampling identified LV1 as the most reproducible component in the chemical block, while the process block showed moderate reproducibility for LV2 despite improved predictive performance under rDCV. Permutation testing (1000 iterations) showed higher R2 and Q2 values for the original models than for permuted models. Negative Q2 intercepts were obtained for both the process-variable model (−0.969) and the chemical-variable model (−1.057), indicating model performance above that which was expected under random class assignment (Figure 2). Permutation-based significance testing further confirmed model significance (Wilcoxon test, p < 0.001; Sign test, p < 0.001; randomization t-test, p = 0.005). Model performance metrics are summarized in Table 3. Complete OPLS-DA loadings, VIP scores, Selectivity Ratios, and stability metrics for all variables are provided in Table S3 of the Supplementary Materials.
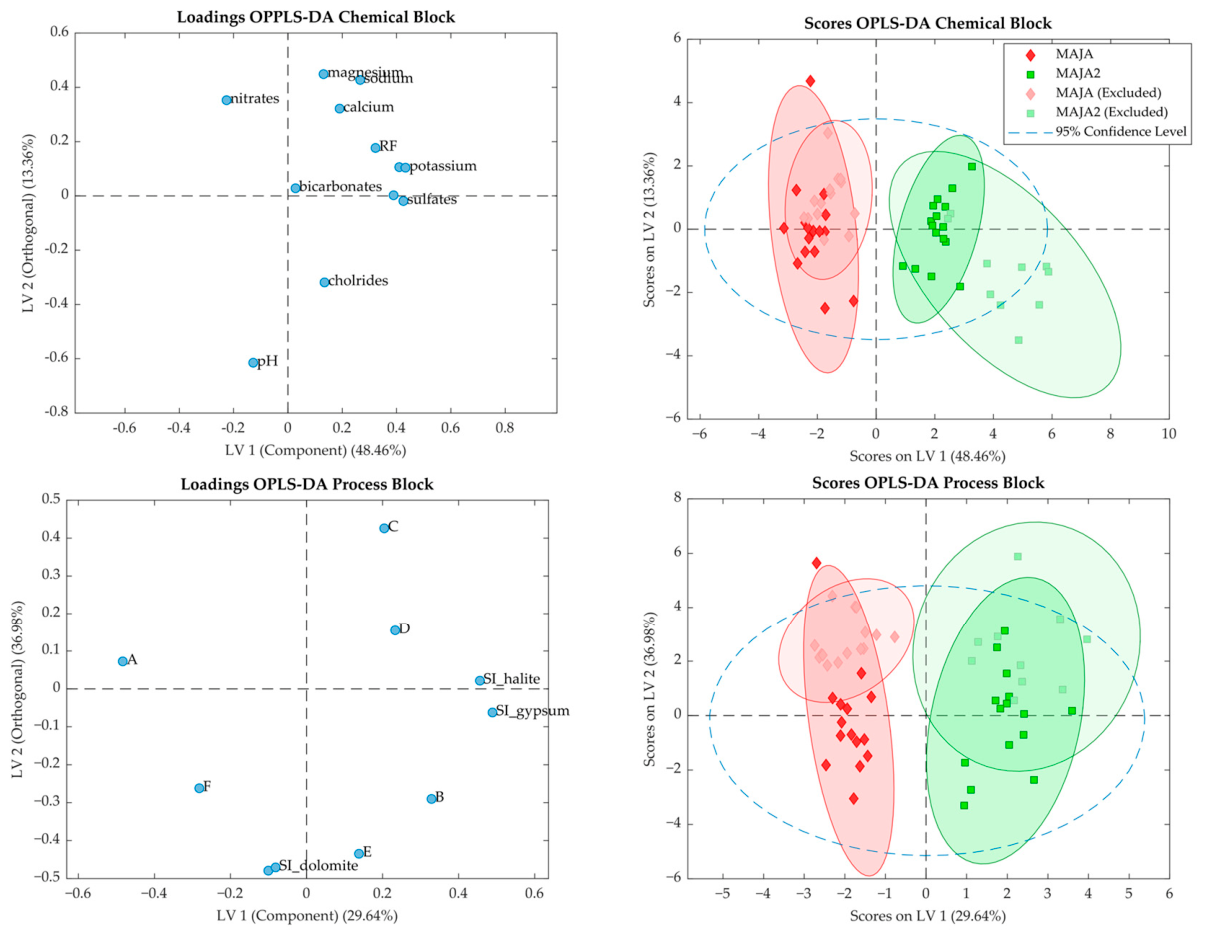
Q2ext values were calculated exclusively from the independent validation dataset, whereas RMSECV and R2CV were obtained through nested cross-validation within the training dataset. RMSEP and R2Pred represent temporal validation performance. Process-variable models showed lower RMSEP and higher R2Pred values than chemical-variable models (Table 3), suggesting that process-related descriptors contributed to class separation beyond major-ion composition alone. In the chemical variable block, class-related separation was primarily associated with LV1 and driven mainly by electrical conductivity, sulphate, potassium, RF, and sodium (Figure 3). VIP and SR analysis identified electrical conductivity, sulphate, and potassium as the dominant discriminant variables, whereas silica and RF showed secondary contributions (Table 4). In the process variable block, LV1 was mainly associated with SI_gypsum, SI_halite, and D’Amore index A, while carbonate-related descriptors contributed predominantly to orthogonal variability. Nested cross-validation showed a stable prediction error across model complexities (Table 4). In the chemical variable block, the lowest MAE values were obtained for LV1, consistent with jackknife results identifying LV1 as the only reproducible latent component. In contrast, the process variable block showed improved MAE values for LV2 despite its comparatively lower structural stability under jackknife resampling, indicating that additional orthogonal variability contributed to predictive performance without equivalent reproducibility across resampling iterations. As shown in Table 5, temporal validation produced higher MAE values than internal cross-validation, particularly for MAJA2, indicating a moderate reduction in predictive accuracy. This behaviour is consistent with temporal hydrochemical variability and the limited size of the calibration dataset. Because MAE values were calculated from the absolute deviation between predicted and binary-encoded class responses (MAJA = 0; MAJA2 = 1), lower MAE values indicate greater agreement between predicted and observed class assignment within the OPLS-DA model.

4. Discussion

The application of multivariate chemometric models to groundwater systems characterized by similar hydrochemical facies may facilitate the identification of differences not readily detectable through conventional hydrochemical approaches alone [12,13,14]. In this study, the combined use of SIMCA and OPLS-DA provided complementary information on both dataset structure and discrimination between MAJA and MAJA2. SIMCA models showed limited stability, with only PC1 providing reproducible information, consistent with the known sensitivity of PCA/SIMCA to sampling variability and model complexity [27,28,29]. The broader dispersion observed for MAJA2 in the score plots, together with jackknife stability metrics, suggests a less reproducible multivariate structure than that observed for MAJA, consistent with greater hydrochemical heterogeneity. Within the SIMCA model, variable relevance was evaluated using the PC1 contribution, Structural Response Coefficient (Rj), and associated stability metrics. Rj combines explained and residual variance and was examined in this study as an exploratory model-derived quantity. Rj has not been formally validated as a variable-importance metric, and no claims regarding its general applicability can be made. Accordingly, Rj should not be interpreted as a statistically validated variable-importance measure, but rather as a model-dependent exploratory descriptor evaluated within the specific SIMCA framework adopted in this study. Unlike Variable Importance in Projection (VIP) and the Selectivity Ratio (SR), which are supervised metrics derived from the relationship between predictor variables (X) and class membership (Y) within OPLS-DA models, Rj is computed exclusively within the unsupervised SIMCA framework. Future studies involving larger datasets and additional groundwater systems will be required to evaluate its behaviour relative to established variable-importance metrics. OPLS-DA further clarified the observed variability by separating class-related variation into predictive and orthogonal components [22]. Class separation was primarily driven by LV1, whereas LV2 mainly captured carbonate-related structured variability not directly associated with class discrimination. Nested cross-validation, jackknife LOMO resampling, and permutation testing supported model stability [23,26]. Internal cross-validation indicated high model consistency (R2CV ≈ 0.82–0.90), while temporal validation produced slightly lower Q2ext values (≈0.78–0.86). Because the validation samples originated from the same hydrogeological system, the temporal validation procedure should be interpreted as an assessment of temporal reproducibility rather than true external generalizability or geographical transferability of the models. Given the limited sample size and the strong covariance among hydrochemical descriptors, the OPLS-DA models should not be interpreted as general-purpose classifiers, but as exploratory latent-variable models supporting process-based hydrochemical interpretation [23,26,28]. The relatively limited sample size relative to the number of descriptors and latent variables represents a limitation of the present study, particularly for supervised OPLS-DA modelling. Although the number of observations per class was below 20, model complexity was constrained through latent-variable selection, nested cross-validation, jackknife resampling, and permutation testing. In this context, the models were interpreted as exploratory latent-variable models rather than fully generalizable predictive classifiers. Several process-related descriptors, including D’Amore indices and saturation indices, were derived from the same major-ion composition used in the chemical variable block. The process-variable block should therefore be interpreted as a process-oriented reparameterization of the original compositional dataset. This transformation facilitates interpretation of the hydrochemical structure in terms of geochemical relationships, mineral equilibrium conditions, and inferred hydrogeochemical evolution that are not directly evident from the absolute concentrations of individual chemical parameters alone. Accordingly, the improved predictive performance observed after inclusion of LV2 likely reflects increased representation of structured process-related variability rather than fully independent hydrochemical information. MAJA waters showed higher MAE values than MAJA2, suggesting greater internal hydrochemical heterogeneity, consistent with the broader hydrochemical and isotopic variability observed for MAJA. A limited subset of variables, including EC, sulphate, potassium, D’Amore index A, SI_gypsum, and SI_halite, showed consistent relevance across both SIMCA and OPLS-DA models. From a hydrogeochemical perspective, the differentiation between MAJA and MAJA2 appears primarily related to mineralization processes rather than major-ion composition alone. Stable isotope data indicate a common meteoric origin and similar recharge conditions for both waters, while minor isotopic differences suggest variability in groundwater circulation dynamics and post-recharge water–rock interaction processes. In the process-variable block, evaporite-related descriptors (SI_gypsum, SI_halite, and D’Amore index A) dominated the discriminant component, indicating a stronger sulphate-related influence in MAJA2 [16,30,31], consistent with the regional geological framework. The combined chemometric and process-oriented interpretation suggests that groundwater systems sharing similar hydrochemical facies may nevertheless reflect different hydrogeological evolution pathways [12,30]. Because the models were developed with limited temporal replication, the results should be interpreted as system-specific exploratory models.

5. Conclusions

This study evaluated the applicability of multivariate chemometric approaches for investigating subtle compositional differences between groundwater systems sharing similar hydrochemical facies. SIMCA and OPLS-DA provided complementary information on both latent structure and class-related variability between MAJA and MAJA2. SIMCA described intra-class organization, although only the first principal component showed sufficient reproducibility for reliable interpretation. OPLS-DA highlighted recurrent discriminant patterns associated mainly with electrical conductivity, sulphate, potassium, SI_gypsum, SI_halite, and D’Amore index A. The recurrent contribution of a limited subset of descriptors across both SIMCA and OPLS-DA indicates that these variables capture persistent aspects of the compositional variability between the two systems [12,31]. Stable isotope data support common meteoric origin and similar recharge conditions, while also indicating differences in groundwater circulation dynamics and post-recharge mineralization processes. From a hydrogeological perspective, the results indicate that waters sharing similar facies may nevertheless reflect distinct circulation pathways and water–rock interaction conditions [5,10,12]. In this context, chemometric analysis does not replace conventional hydrogeological interpretation but may provide a complementary quantitative tool for investigating weak hydrochemical differentiation in compositionally similar groundwater systems. External temporal validation further supported reproducible model behaviour over time, although the proposed models should still be interpreted as system-specific exploratory latent-variable models.

Supplementary Materials

The following supporting information can be downloaded at https://www.mdpi.com/article/10.3390/hydrology13080204/s1. Supplementary Materials S1: Mathematical formulation of the Structural Response Coefficient (Rj) and methodological assumptions. Supplementary Materials S2: Complete SIMCA and OPLS-DA results, including variable-level metrics for chemical and process variable blocks, stability indicators (FM%, CV%), and selection frequency analysis. Figure S1: ROC curves and predicted response threshold plots for the OPLS-DA chemical-variable block classification models. Figure S2: ROC curves and predicted response threshold plots for the OPLS-DA process-variable block classification models. Figure S3: δ2H versus δ18O relationship for rainwater, MAJA, and MAJA2 samples. Table S1: Complete SIMCA results for the MAJA2 dataset. Table S2: Complete SIMCA results for the MAJA dataset. Table S3: Complete OPLS-DA results for chemical and process variable blocks. Table S4: Summary of isotopic parameters (δ18O, δ2H, tritium, and d-excess) for rainwater, MAJA, and MAJA2 samples. Table S5: Summary statistics of hydrochemical parameters for the MAJA and MAJA2 groundwater systems. Table S6: Summary statistics of process-related descriptors (D’Amore indices and saturation indices) for the MAJA and MAJA2 groundwater systems. Table S7: Definition and hydrogeochemical interpretation of D’Amore indices (A–F).

Author Contributions

Conceptualization, R.A. and C.M.; methodology, R.A. and E.A.; software, R.A.; validation, R.A. and E.A.; formal analysis, R.A.; investigation, R.A.; resources, R.A. and C.M.; data curation, R.A.; writing—original draft preparation, R.A.; writing, review and editing, R.A., A.A., E.A. and C.M.; visualization, R.A.; supervision R.A., C.M. and E.A.; project administration, R.A. All authors have read and agreed to the published version of the manuscript.

Funding

This research was funded by Refresco Group within the context of a consultancy agreement with the University of Turin, involving analytical activities commissioned by the company. The APC was funded by Refresco Group.

Data Availability Statement

The data presented in this study are available on request from the corresponding author. The data are not publicly available due to ongoing research activities.

Acknowledgments

The authors acknowledge Refresco Group (Sulmona plant) for supporting and facilitating the groundwater monitoring campaign. The authors also thank the technical staff involved in sample collection and analytical activities for their valuable assistance. During the preparation of this manuscript, the authors used ChatGPT, using the GPT-5 model (OpenAI, San Francisco, CA, USA) for language refinement. The authors have reviewed and edited the output and take full responsibility for the content of this publication.

Conflicts of Interest

The authors declare no conflicts of interest. The funder had no role in the design of the study; in the collection, analyses, or interpretation of the data; in the writing of the manuscript; or in the decision to publish the results.

Abbreviations

The following abbreviations are used in this manuscript:
SIMCASoft Independent Modelling of Class Analogy
OPLS-DAOrthogonal Partial Least Squares Discriminant Analysis
PCAPrincipal Component Analysis
PCPrincipal Component
VIPVariable Importance in Projection
SRSelectivity Ratio
RjStructural Response Coefficient
SISaturation Index
IBEIonic Balance Error
LOMOLeave-One-Month-Out
rDCVRepeated Double Cross-Validation
LVLatent Variable
FM%Full-Model Deviation Percentage
CV%Cross-Validation Variability Percentage
MAEMean Absolute Error
RMSECVRoot Mean Square Error of Cross-Validation
RMSEPRoot Mean Square Error of Prediction
R2CVCross-Validated Coefficient of Determination
R2PredPredictive Coefficient of Determination
R2CalCalibration Coefficient of Determination
Q2extExternal Predictive Q2
RFFixed Residue at 180 °C
ECElectrical Conductivity
ROCReceiver Operating Characteristic
TUTritium Unit
LMWLLocal Meteoric Water Line
GMWLGlobal Meteoric Water Line
PHREEQCPH Geochemical REdox Equilibrium in C Language

References

  1. European Parliament and Council. Directive 2009/54/EC of the European Parliament and of the Council of 18 June 2009 on the exploitation and marketing of natural mineral waters. Off. J. Eur. Union 2009, L164, 45–58. [Google Scholar]
  2. Appelo, C.A.J.; Postma, D. Geochemistry, Groundwater and Pollution, 2nd ed.; CRC Press: Boca Raton, FL, USA, 2005. [Google Scholar] [CrossRef] [Scilit]
  3. Drever, J.I. The Geochemistry of Natural Waters, 3rd ed.; Prentice Hall: Upper Saddle River, NJ, USA, 1997. [Google Scholar]
  4. Hem, J.D. Study and Interpretation of the Chemical Characteristics of Natural Water, 3rd ed.; Water-Supply Paper 2254; U.S. Geological Survey: Reston, VA, USA, 1985. [CrossRef] [Scilit]
  5. Domenico, P.A.; Schwartz, F.W. Physical and Chemical Hydrogeology, 2nd ed.; Wiley: New York, NY, USA, 1998. [Google Scholar]
  6. Birke, M.; Rauch, U.; Harazim, B.; Lorenz, H.; Glatte, W. Major and trace elements in German bottled water. J. Geochem. Explor. 2010, 107, 245–271. [Google Scholar] [CrossRef] [Scilit]
  7. Piper, A.M. A graphic procedure in the geochemical interpretation of water analyses. Eos Trans. Am. Geophys. Union 1944, 25, 914–928. [Google Scholar] [CrossRef] [Scilit]
  8. Schoeller, H. Qualitative evaluation of groundwater resources. In Methods and Techniques of Groundwater Investigation and Development; UNESCO: Paris, France, 1967; pp. 44–52. [Google Scholar]
  9. Gibbs, R.J. Mechanisms controlling world water chemistry. Science 1970, 170, 1088–1090. [Google Scholar] [CrossRef] [Scilit] [PubMed]
  10. Back, W. Hydrochemical Facies and Ground-Water Flow Patterns in Northern Part of Atlantic Coastal Plain; U.S. Geological Survey Professional Paper 498-A.; U.S. Government Printing Office: Washington, DC, USA, 1966; 42p. [Google Scholar]
  11. Güler, C.; Thyne, G.D.; McCray, J.E.; Turner, A.K. Evaluation of graphical and multivariate statistical methods for classification of water chemistry data. J. Hydrol. 2002, 265, 87–100. [Google Scholar] [CrossRef] [Scilit]
  12. Cloutier, V.; Lefebvre, R.; Therrien, R.; Savard, M.M. Multivariate statistical analysis of geochemical data as indicative of the hydrogeochemical evolution of groundwater. J. Hydrol. 2008, 353, 294–313. [Google Scholar] [CrossRef] [Scilit]
  13. Šnuderl, K.; Simonič, M.; Mocak, J.; Brodnjak-Vončina, D. Multivariate data analysis of natural mineral waters. Acta Chim. Slov. 2007, 54, 33–39. [Google Scholar]
  14. Kazakis, N.; Mattas, C.; Pavlou, A.; Patrikaki, O.; Voudouris, K. Multivariate statistical analysis for the assessment of groundwater quality under different hydrogeological regimes. Environ. Earth Sci. 2017, 76, 349. [Google Scholar] [CrossRef] [Scilit]
  15. Parkhurst, D.L.; Appelo, C.A.J. Description of Input and Examples for PHREEQC Version 3—A Computer Program for Speciation, Batch-Reaction, One-Dimensional Transport, and Inverse Geochemical Calculations; U.S. Geological Survey Techniques and Methods, Book 6, Chapter A43; U.S. Geological Survey: Reston, VA, USA, 2013. [CrossRef] [Scilit]
  16. D’Amore, F.; Scandiffio, G.; Panichi, C. Some observations on the chemical classification of groundwaters. Geothermics 1983, 12, 141–148. [Google Scholar] [CrossRef] [Scilit]
  17. Craig, H. Isotopic Variations in Meteoric Waters. Science 1961, 133, 1702–1703. [Google Scholar] [CrossRef] [Scilit] [PubMed]
  18. Gat, J.R. Oxygen and Hydrogen Isotopes in the Hydrologic Cycle. Annu. Rev. Earth Planet. Sci. 1996, 24, 225–262. [Google Scholar] [CrossRef] [Scilit]
  19. Clark, I.; Fritz, P. Environmental Isotopes in Hydrogeology; CRC Press: Boca Raton, FL, USA, 1997. [Google Scholar]
  20. Wold, S.; Sjöström, M.; Eriksson, L. SIMCA. Chemom. Intell. Lab. Syst. 2001, 58, 109–130. [Google Scholar] [CrossRef] [Scilit]
  21. Ballabio, D.; Consonni, V. Classification tools in chemistry. Part 1: Linear models. PLS-DA. Anal. Methods 2013, 5, 3790–3798. [Google Scholar] [CrossRef] [Scilit]
  22. Trygg, J.; Wold, S. Orthogonal projections to latent structures (O-PLS). J. Chemom. 2002, 16, 119–128. [Google Scholar] [CrossRef] [Scilit]
  23. Westerhuis, J.A.; Hoefsloot, H.C.J.; Smit, S.; Vis, D.J.; Smilde, A.K.; van Velzen, E.J.J.; van Duijnhoven, J.P.M.; van Dorsten, F.A. Assessment of PLS-DA cross-validation. Metabolomics 2008, 4, 81–89. [Google Scholar] [CrossRef] [Scilit]
  24. Martens, H.; Martens, M. Modified jack-knife estimation of parameter uncertainty in bilinear modelling. Food Qual. Prefer. 2000, 11, 5–16. [Google Scholar] [CrossRef] [Scilit]
  25. Filzmoser, P.; Liebmann, B.; Varmuza, K. Repeated double cross-validation. J. Chemom. 2009, 23, 160–171. [Google Scholar] [CrossRef] [Scilit]
  26. Brereton, R.G.; Lloyd, G.R. Partial least squares discriminant analysis: Taking the magic away. J. Chemom. 2014, 28, 213–225. [Google Scholar] [CrossRef] [Scilit]
  27. Pomerantsev, A.L.; Rodionova, O.Y. Concept and role of extreme objects in PCA/SIMCA. J. Chemom. 2014, 28, 429–438. [Google Scholar] [CrossRef] [Scilit]
  28. Saccenti, E.; Timmerman, M.E. Sample size considerations in multivariate analysis. J. Proteome Res. 2016, 15, 2379–2393. [Google Scholar] [CrossRef] [Scilit] [PubMed]
  29. Wheelock, Å.M.; Wheelock, C.E. Trials and tribulations of ‘omics data analysis. Mol. Biosyst. 2013, 9, 2589–2596. [Google Scholar] [CrossRef] [Scilit] [PubMed]
  30. Helena, B.; Pardo, R.; Vega, M.; Barrado, E.; Fernández, J.M.; Fernández, L. Temporal evolution of groundwater composition using PCA. Water Res. 2000, 34, 807–816. [Google Scholar] [CrossRef] [Scilit]
  31. Zhu, C.; Schwartz, F.W. Hydrogeochemical Processes; Wiley: Hoboken, NJ, USA, 2011. [Google Scholar] [CrossRef] [Scilit]
Figure 1. SIMCA score plots for MAJA and MAJA2 groundwater systems obtained from chemical and process variable blocks. Ellipsoids represent class models derived from the training dataset.
Hydrology 13 00204 g001
Figure 2. Permutation tests (1000 permutations) for OPLS-DA models of chemical and process variable blocks. Negative Q2 intercepts indicate model performance exceeding that expected under random class assignment.
Hydrology 13 00204 g002
Figure 3. OPLS-DA loadings and score plots for chemical and process variable blocks showing class-related hydrochemical organization between MAJA and MAJA2 groundwater systems.
Hydrology 13 00204 g003
Table 1. Median SIMCA variable relevance and stability metrics for the MAJA2 chemical and process variable blocks.
MAJA 2 Chemical Variable Block
VariablesPC1 (51.6%) PC FM/CV %PC Rec. %RjRj FM/CV %Rj Rec. %
SiO211.3−6.4/11.6100%0.03−6.2/11.88%
RF15.7−19.7/12.4100%0.18−14.8/16.6100%
EC16.6−13.8/2.4100%0.06−4.7/5.9100%
Potassium16.0−4.7/6.3100%0.09−0.3/5.3100%
Sodium4.6134/17.90%0.06−5.1/12.685%
MAJA 2 Process variable block
VariablesPC1 (43.8%)PC FM/CV %PC Rec. %RjRj FM/CV %Rj Rec. %
A10.517.1/53.854%0.5715.9/21.492%
C13.3−5.1/20.477%0.04−9.6/7.40%
D12.46.1/23.385%0.21−6.0/81.838%
F13.61.2/23.977%0.257.6/17.654%
SI_gypsum9.817.1/59.546%0.541.1/20.192%
SI_halite16.37.2/15.8100%0.10−16.1/7.50%
Table 2. Median SIMCA variable relevance and stability metrics for the MAJA chemical and process variable blocks.
MAJA Chemical Variable Block
VariablesPC1 (42.1%) PC FM/CV %PC Rec. %RjRj FM/CV %Rj Rec. %
SiO210.018.9/13.3100%0.04−2.2/14.18%
RF11.229.7/16.9100%0.14−20.4/17.7100%
EC13.123.5/6.6100%0.07−4.0/9.092%
Sulphate10.140.3/18.0100%0.19−9.0/7.5100%
Potassium14.69.5/6.2100%0.11−10.1/7.9100%
Sodium14.0−49.4/11.6100%0.03−4.5/37.38%
MAJA Process variable block
VariablesPC1 (41.3%)PC FM/CV %PC Rec. %RjRj FM/CV %Rj Rec. %
A11.230.8/20.662%0.3218.1/16.777%
C13.5−19.9/18.077%0.22−16.8/13.469%
E17.0−31.4/19.169%0.16−23.6/18.631%
SI_calcite14.7−24.0/16.477%0.32−18.6/43.192%
SI_dolomite14.4−25.1/16.377%0.19−19.4/46.254%
SI_gypsum11.032.5/21.062%0.3522.8/24.377%
Table 3. Internal cross-validation and temporal validation performance metrics for OPLS-DA models.
MetricProcess (Full)Process (Median)Chemical (Full)Chemical (Median)
Q20.8400.7810.8560.842
RMSECV0.1660.1760.1990.218
RMSEP0.1530.1570.2120.204
R2Cal0.9090.8960.8420.834
R2CV0.8970.8760.8200.826
R2Pred0.9060.9010.8420.836
Table 4. Median OPLS-DA loadings and variable-importance metrics for chemical and process variable blocks.
ChemicalLV1 LV2 LV1 FM/CV %LV2 FM/CV %VIPSR
SiO20.390.000.92/3.2−42.1/104.51.22.5
RF0.320.180.01/5.4−15.4/65.41.11.0
EC0.410.110.32/2.3−4.3/25.71.44.2
Sulphate0.43−0.02−0.39/2.57.6/−202.11.56.8
Potassium0.430.100.33/1.7−1.1/25.91.59
ProcessLV1LV2VIP FM/CV %SR FM/CV %VIPSR
A−0.480.070.24/−1.14.5/16.81.59.5
SI_gypsum0.49−0.080.25/0.96.4/26.21.514.1
SI_halite0.480.03−0.24/1.9−0.97/8.51.510.0
LV1 and LV2 represent predictive and orthogonal latent variables, respectively. VIP and SR correspond to Variable Importance in Projection and Selectivity Ratio median estimates. FM/CV (%) indicates full-model deviation and cross-validation variability obtained from jackknife LOMO resampling.
Table 5. Mean absolute error (MAE) obtained from nested cross-validation (rDCV) for chemical and process variable blocks. Training values were calculated from outer LOMO exclusions (LV = 1–3), whereas validation values were obtained using the optimal model. Class-specific MAE values are reported for MAJA and MAJA2.
DatasetBlockLV OPLS_DAMAE (Total)MAE (MAJA)MAE (MAJA2)
Training datasetChemical10.160.140.16
Training datasetChemical20.180.130.24
Training datasetChemical30.200.120.28
Training datasetProcess10.250.160.29
Training datasetProcess20.190.130.24
Training datasetProcess30.160.120.20
Validation datasetChemical10.230.130.38
Validation datasetProcess20.180.150.27
Disclaimer/Publisher’s Note: The statements, opinions and data contained in all publications are solely those of the individual author(s) and contributor(s) and not of MDPI and/or the editor(s). MDPI and/or the editor(s) disclaim responsibility for any injury to people or property resulting from any ideas, methods, instructions or products referred to in the content.