Article

Groundwater Vulnerability Assessment Using an Integrated GIS-Based DRASTIC, Land-Use, and Expert Elicitation Framework in Southern Egypt

by
Mohamed El-Sayed El-Mahdy
1,
Sally Sayed Saad
2,
Ibraheem A. H. Yousif
3,
Mohamed Ahmed Shahba
1,* and
Abd-Alrahman S. Ahmed
1
1
Department of Natural Resources, Faculty of African Postgraduate Studies, Cairo University, Giza 12613, Egypt
2
Central Administration for Groundwater (Lower and Upper Egypt), Groundwater Sector, Ministry of Water Resources and Irrigation, Cairo 12666, Egypt
3
Department of Soil Science, Faculty of Agriculture, Cairo University, Giza 12613, Egypt
*
Author to whom correspondence should be addressed.
Hydrology 2026, 13(8), 198; https://doi.org/10.3390/hydrology13080198
Submission received: 25 April 2026 / Revised: 29 June 2026 / Accepted: 21 July 2026 / Published: 23 July 2026
(This article belongs to the Section Surface Waters and Groundwaters)

Abstract

Groundwater vulnerability refers to an aquifer’s susceptibility to contamination based on natural hydrogeological properties, including geology, soil, topography, and unsaturated zone characteristics. In low-recharge arid systems, limited recharge reduces dilution and flushing, allowing contaminants introduced through anthropogenic activities to persist over time. This study assesses groundwater vulnerability in El-Farafra, El-Kharga, and Tushka using a GIS-based DRASTIC approach, enhanced with a Land-Use DRASTIC model to incorporate human activities. Parameters, including the depth-to-water table, net recharge, aquifer media, soil media, topography, the vadose zone, and hydraulic conductivity, were spatially analyzed to generate vulnerability indices. Sentinel-2 imagery was used for land-use classification. In addition, expert elicitation from twenty hydrogeology specialists provided alternative parameter weightings, which were compared with the standard DRASTIC weights. Results show that incorporating land use and expert-based weights refines vulnerability patterns, particularly in agricultural, urban, and industrial zones. El-Farafra exhibits the highest vulnerability due to intensive land use and hydrogeological conditions, El-Kharga shows moderate vulnerability, and Tushka shows lower vulnerability, where recharge from Lake Nasser enhances dilution and reduces contaminant persistence. The study highlights the importance of integrating land-use information and expert knowledge to improve vulnerability assessment in data-scarce arid environments and supports improved groundwater management strategies.

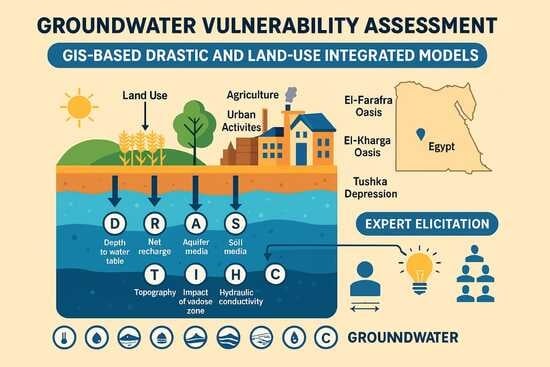
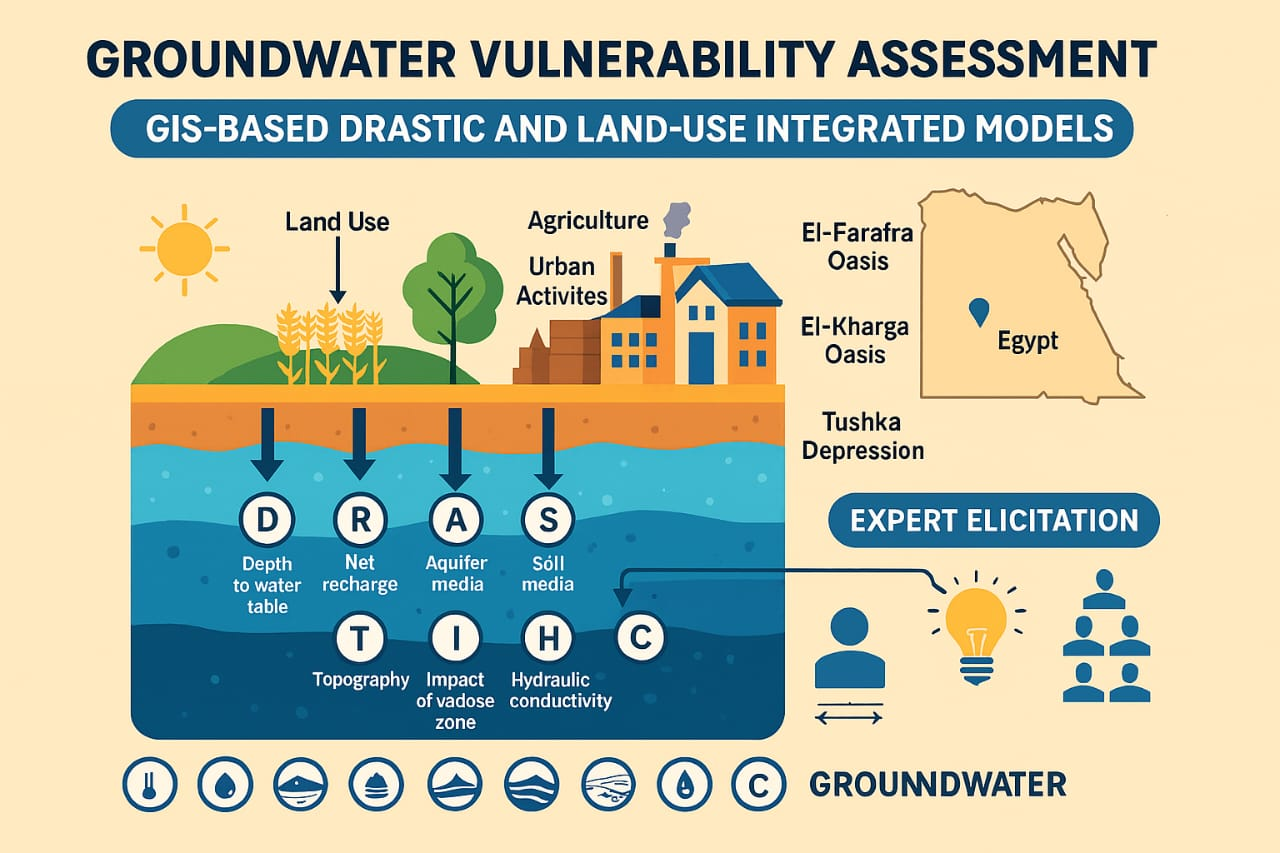
Graphical Abstract

1. Introduction

Groundwater represents a critical freshwater resource in arid and semi-arid regions where surface water availability is limited. Increasing population growth, expanding agricultural activities, and climate variability have intensified pressures on groundwater systems, highlighting the need for reliable methods to evaluate aquifer vulnerability. Arafa et al. [1], for example, developed an enhanced GALDIT-NUTS framework combined with Random Forest and Generalized Linear Models to assess groundwater vulnerability in the Eastern Nile Delta. Their results showed improved prediction accuracy, emphasizing the benefits of combining hydrochemical data, spatial modeling, and advanced computational techniques. These developments highlight the growing need for integrated assessment methods capable of supporting sustainable groundwater management in regions experiencing increasing environmental and anthropogenic pressures.
In Egypt, groundwater constitutes the principal source of water for domestic, agricultural, and industrial uses, particularly within desert oases and depressions. These areas depend heavily on groundwater for irrigation and daily consumption. Over-abstraction, limited natural recharge, and anthropogenic activities such as agricultural expansion and urban development primarily threaten groundwater quantity sustainability while also influencing groundwater quality vulnerability through the modification of flow conditions and increased contaminant loading [2].
The foundational work of Freeze and Cherry [3] established the key principles governing groundwater movement and contaminant transport, including hydraulic gradients, aquifer characteristics, and subsurface heterogeneity. These concepts continue to underpin modern hydrogeological investigations and form the basis for assessing groundwater availability and contamination risks. One of the most widely used approaches for evaluating groundwater vulnerability is the DRASTIC model, which integrates seven hydrogeological parameters, including depth to the groundwater, net recharge, aquifer media, soil media, topography, impact of the vadose zone, and hydraulic conductivity into a single vulnerability index [4]. Groundwater vulnerability refers to the susceptibility of an aquifer to contamination based on its natural hydrogeological characteristics, including geology, recharge conditions, soil properties, and the properties of the unsaturated zone [5]. More recently, inverse-Bayesian approaches have been incorporated into DRASTIC-type models to estimate probabilistic parameter values, moving beyond the use of fixed expert-assigned weights [6].
GIS-based vulnerability mapping has been widely applied in groundwater quality assessment studies. For instance, Brindha and Elango [7] combined GIS with the DRASTIC model to assess groundwater vulnerability in South India and validated their results using key groundwater quality indicators, including nitrate, chloride, and total dissolved solids (TDS). Their study revealed a strong agreement between high-vulnerability zones and areas with elevated contaminant concentrations, primarily linked to intensive agricultural activity. Although the model is widely applied due to its conceptual simplicity and ability to integrate diverse hydrogeological data, it does not explicitly account for land-use activities that may significantly influence groundwater quality. Recent developments in groundwater vulnerability assessment have expanded beyond traditional index-based methods by integrating machine learning techniques with hydrochemical and geospatial analyses [1]. This study highlights the ongoing evolution of groundwater vulnerability mapping toward hybrid methodologies that enhance predictive accuracy and support sustainable groundwater resource management. Numerous studies have therefore combined the DRASTIC framework with Geographic Information Systems (GIS) to improve the spatial analysis of groundwater vulnerability. For instance, Kadkhodaie et al. [8] applied a GIS-based DRASTIC model to assess groundwater vulnerability in the Shabestar Plain aquifer (northwest Iran), where intensive agricultural activities pose a risk of contamination from fertilizers. They were able to optimize the conventional DRASTIC approach by refining parameter ratings and weights using statistical and evolutionary techniques. They demonstrated the effectiveness of integrating statistical and optimization techniques to enhance groundwater vulnerability assessment. Index-based groundwater vulnerability models such as DRASTIC are widely used, but they are frequently criticized for their high degree of subjectivity. This stems from the fact that parameter selection, rating assignment, and weighting are often based on expert judgment, which may not be transferable across different hydrogeological settings. Consequently, fixed weighting schemes may fail to represent local subsurface complexity, leading to substantial variability in vulnerability outputs. This leads to the conclusion that standard DRASTIC weights may not adequately represent groundwater conditions in arid environments, where recharge dynamics and anthropogenic influences deviate from model assumptions, in addition to the subjectivity affecting parameter rating and result interpretation. Jhariya et al. [9] showed that even minor adjustments in the weighting structure can significantly alter vulnerability zonation, particularly in heterogeneous aquifer systems, highlighting the instability introduced by subjective choices. Pereira et al. [10] highlighted the critical role of uncertainty quantification in geostatistical modeling of saltwater intrusion in coastal aquifers. The study demonstrated how parameter uncertainty and spatial variability can significantly influence model predictions, emphasizing the need for probabilistic approaches rather than deterministic assessments. By applying advanced geostatistical techniques, the authors showed that accounting for uncertainty improves the reliability of vulnerability evaluations and supports more robust groundwater management decisions under data-limited and complex hydrogeological conditions. Shakeri and Motiee [11] emphasized that the uncritical application of default ratings can obscure the actual drivers of contamination, while Siarkos et al. [12] highlighted the need for transparency in incorporating expert judgment to improve the robustness and credibility of vulnerability assessments. These studies indicate that subjectivity is embedded throughout the modeling workflow, not only in weighting but also in parameterization and interpretation. Therefore, improving model reliability requires structured expert input, sensitivity analysis, and more transparent weighting frameworks to ensure the consistent application of index-based groundwater vulnerability models across diverse hydrogeological settings. In this study, groundwater vulnerability refers to susceptibility to contamination, whereas groundwater abstraction is considered only as an indirect control that modifies hydraulic gradients and transport pathways rather than a direct intrinsic vulnerability factor.
In addition to spatial modeling techniques, expert elicitation has become an important methodological approach in hydrogeological studies, particularly where empirical data are limited or uncertain [13]. Expert judgment is frequently used to assign weights or rankings to hydrogeological parameters in index-based models such as DRASTIC. Structured elicitation procedures enable experts to evaluate the relative importance of factors including recharge rates, soil permeability, and hydraulic conductivity. The integration of expert knowledge into hydrogeological modeling has been widely applied in several contexts, including Bayesian calibration of groundwater flow models [13], Bayesian inversion for estimating recharge and contaminant-source parameters in data-limited environments, probabilistic weighting of climate–hydrology model ensembles, and the characterization of uncertainty in hydraulic and stratigraphic properties.
Groundwater resources are particularly vital in southern Egypt, where local communities depend heavily on subsurface water supplies for drinking, irrigation, and socioeconomic development, as highlighted in studies of the Nubian Sandstone Aquifer System and related regional aquifers [5,14]. A comparable situation is observed in the Western Nile Delta, where intensive groundwater abstraction, agricultural expansion, and the strong interaction between surface water and aquifer systems have contributed to noticeable deterioration in groundwater quality [15]. These pressures are further intensified by climate variability and long-term climatic trends, including rising temperatures, irregular precipitation, and recurrent drought conditions, which collectively threaten groundwater sustainability and recharge dynamics [4,11,16]. The hydrogeological framework of southern Egypt adds additional complexity, as the region is characterized by multiple aquifer systems, including the extensive Nubian Sandstone Aquifer System as well as younger alluvial deposits. These units are structurally influenced by faults and fractures that control groundwater flow, recharge pathways, and contaminant transport processes [3,5,17]. Accordingly, reliable groundwater vulnerability assessment in such settings requires integrated approaches that combine hydrogeological characterization with spatial analysis tools and geoinformatics-based methods [2,18].
Sentinel-2 satellites within the European Union’s Copernicus Programme provide high-resolution multispectral imagery widely used for environmental monitoring applications [19]. The Sentinel-2 constellation, including satellites such as Sentinel-2A, Sentinel-2B, and Sentinel-2C, is equipped with the Multispectral Instrument (MSI), which captures data across thirteen spectral bands covering visible, near-infrared, and shortwave infrared wavelengths. These data enable detailed monitoring of land cover, vegetation health, and surface water dynamics relevant to groundwater systems [19,20]. Sentinel-2 imagery provides spatial resolutions ranging from 10 to 60 m and a swath width of approximately 290 km, with a revisit period of about five days, enabling frequent large-area environmental monitoring [19]. Although machine learning techniques are increasingly used in groundwater studies [1,21], DRASTIC-based approaches remain particularly useful in data-limited regions due to their transparency, reproducibility, and suitability for stakeholder-based decision making [2,22].
Groundwater vulnerability assessments are commonly developed for recharge-driven systems, where precipitation governs contaminant transport. However, this framework is not directly applicable to fossil aquifers such as the Nubian Sandstone Aquifer System, which are characterized by negligible modern recharge. In such settings, vulnerability is controlled not by natural infiltration but by anthropogenic processes. Intensive groundwater abstraction has locally modified hydraulic gradients within the NSAS, inducing flow regimes that can facilitate contaminant migration through mechanisms such as irrigation return flow, infrastructure leakage, and vertical pathways associated with wells or discontinuities in confining layers. Although these fluxes are limited in extent, their impact is significant because groundwater renewal and dilution are minimal. As a result, contamination is effectively irreversible on human timescales. Vulnerability assessment is therefore essential for identifying areas at risk under current land-use and abstraction conditions. Accordingly, this study focuses on the locally exploited and hydraulically accessible portions of the NSAS and associated shallow aquifers in southern Egypt, where interaction with surface activities occurs, rather than the deeper, regionally isolated system.
Despite numerous applications of the DRASTIC model, limited studies have integrated land-use information and expert-based parameter weighting to assess groundwater vulnerability in the desert oases of southern Egypt. Incorporating land-use data is particularly important in regions undergoing rapid agricultural expansion, where human activities significantly influence groundwater conditions. Therefore, this study evaluates groundwater vulnerability in the shallow aquifers of El-Farafra, El-Kharga, and Tushka using both the conventional GIS-based DRASTIC model and a Land-Use Integrated DRASTIC model. According to Elsheikh [5], integrating land-use information provides a more comprehensive evaluation of groundwater vulnerability in regions affected by intensive human activities. The objectives of this study are: (1) to assess groundwater vulnerability using both the traditional DRASTIC model and the Land-Use Integrated DRASTIC model; (2) to evaluate the influence of land-use practices on groundwater vulnerability; and (3) to compare vulnerability results derived from expert-based parameter weighting with those obtained using the conventional DRASTIC weighting scheme.

2. Materials and Methods

2.1. Study Area

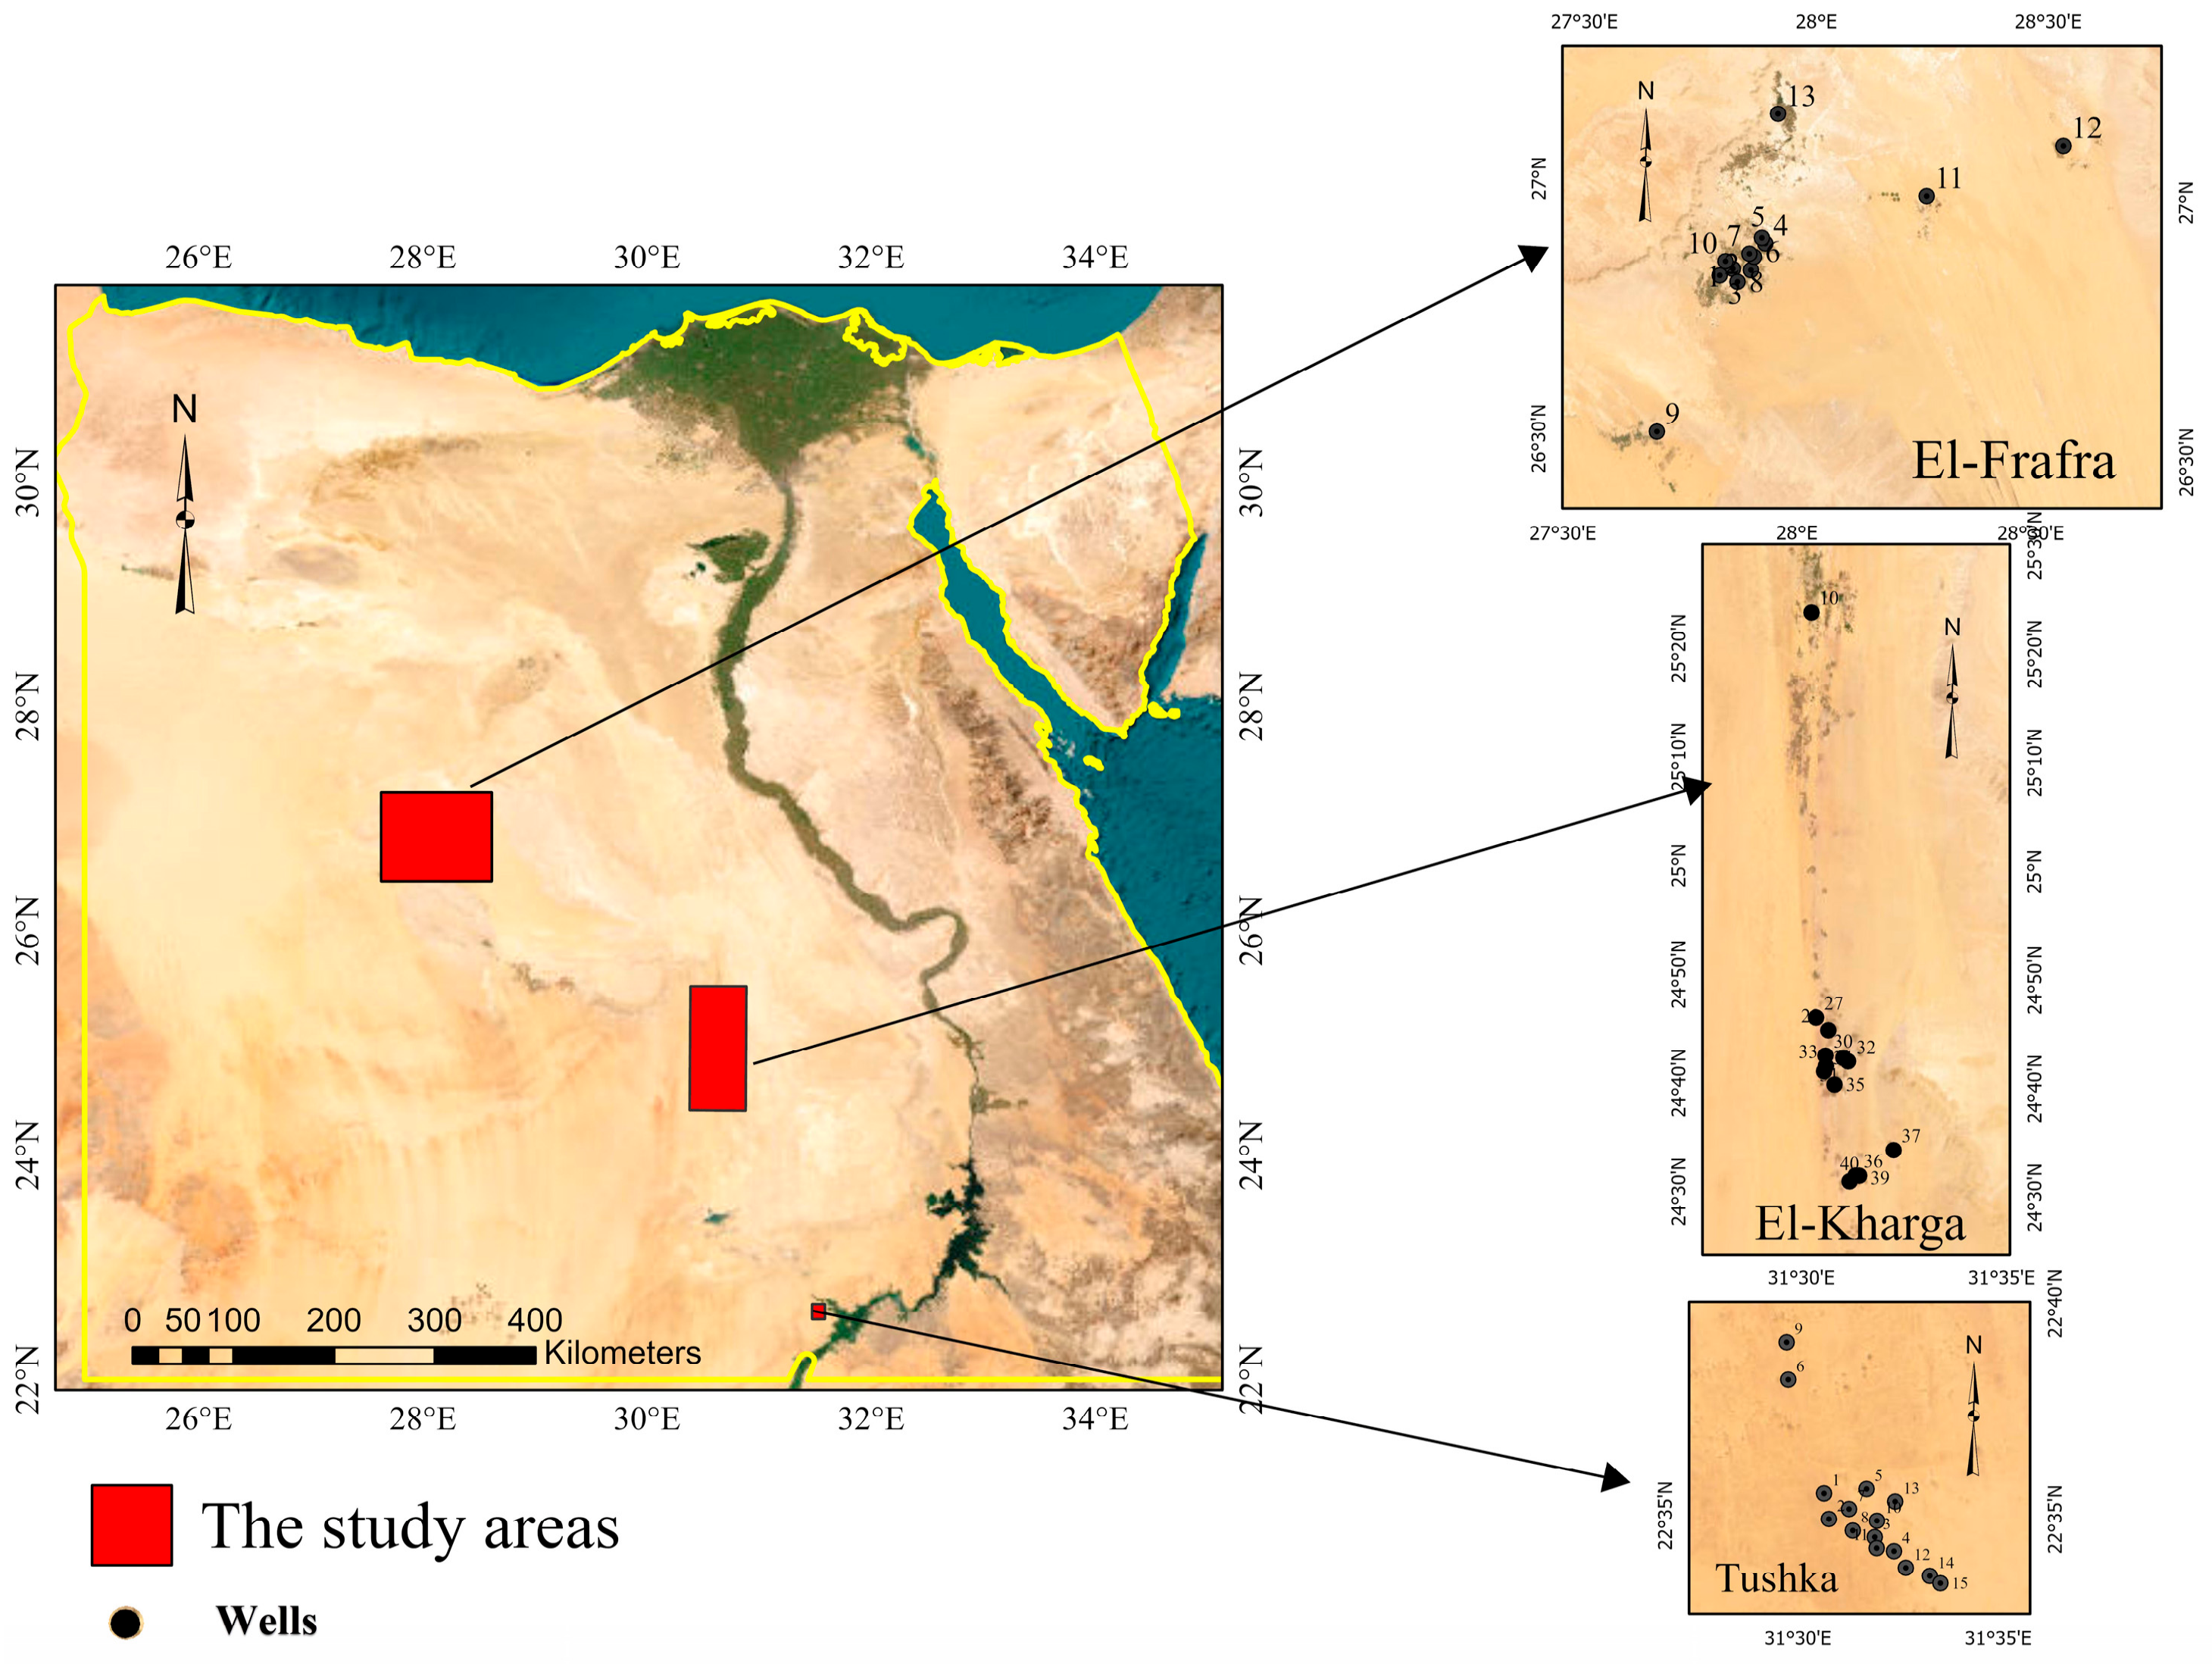
The study area consists of three locations in southern Egypt: El-Farafra Oasis, El-Kharga Oasis, and the Tushka Depression (Figure 1). These regions are hydrologically significant because they rely almost entirely on groundwater supplies and are increasingly exposed to natural and anthropogenic pressures, making them critical zones for assessing groundwater vulnerability [5,14]. The Nubian Sandstone Aquifer System (NSAS), one of the world’s largest fossil aquifer systems, runs through Egypt, Sudan, Libya, and Chad [5,17]. The Nubian Sandstone Aquifer System (NSAS), a deep fossil groundwater system, coexists with overlying shallow aquifer units in the study area. This study focuses on the hydraulically accessible portions of the NSAS and shallow aquifers where interaction with surface activities and abstraction occurs.
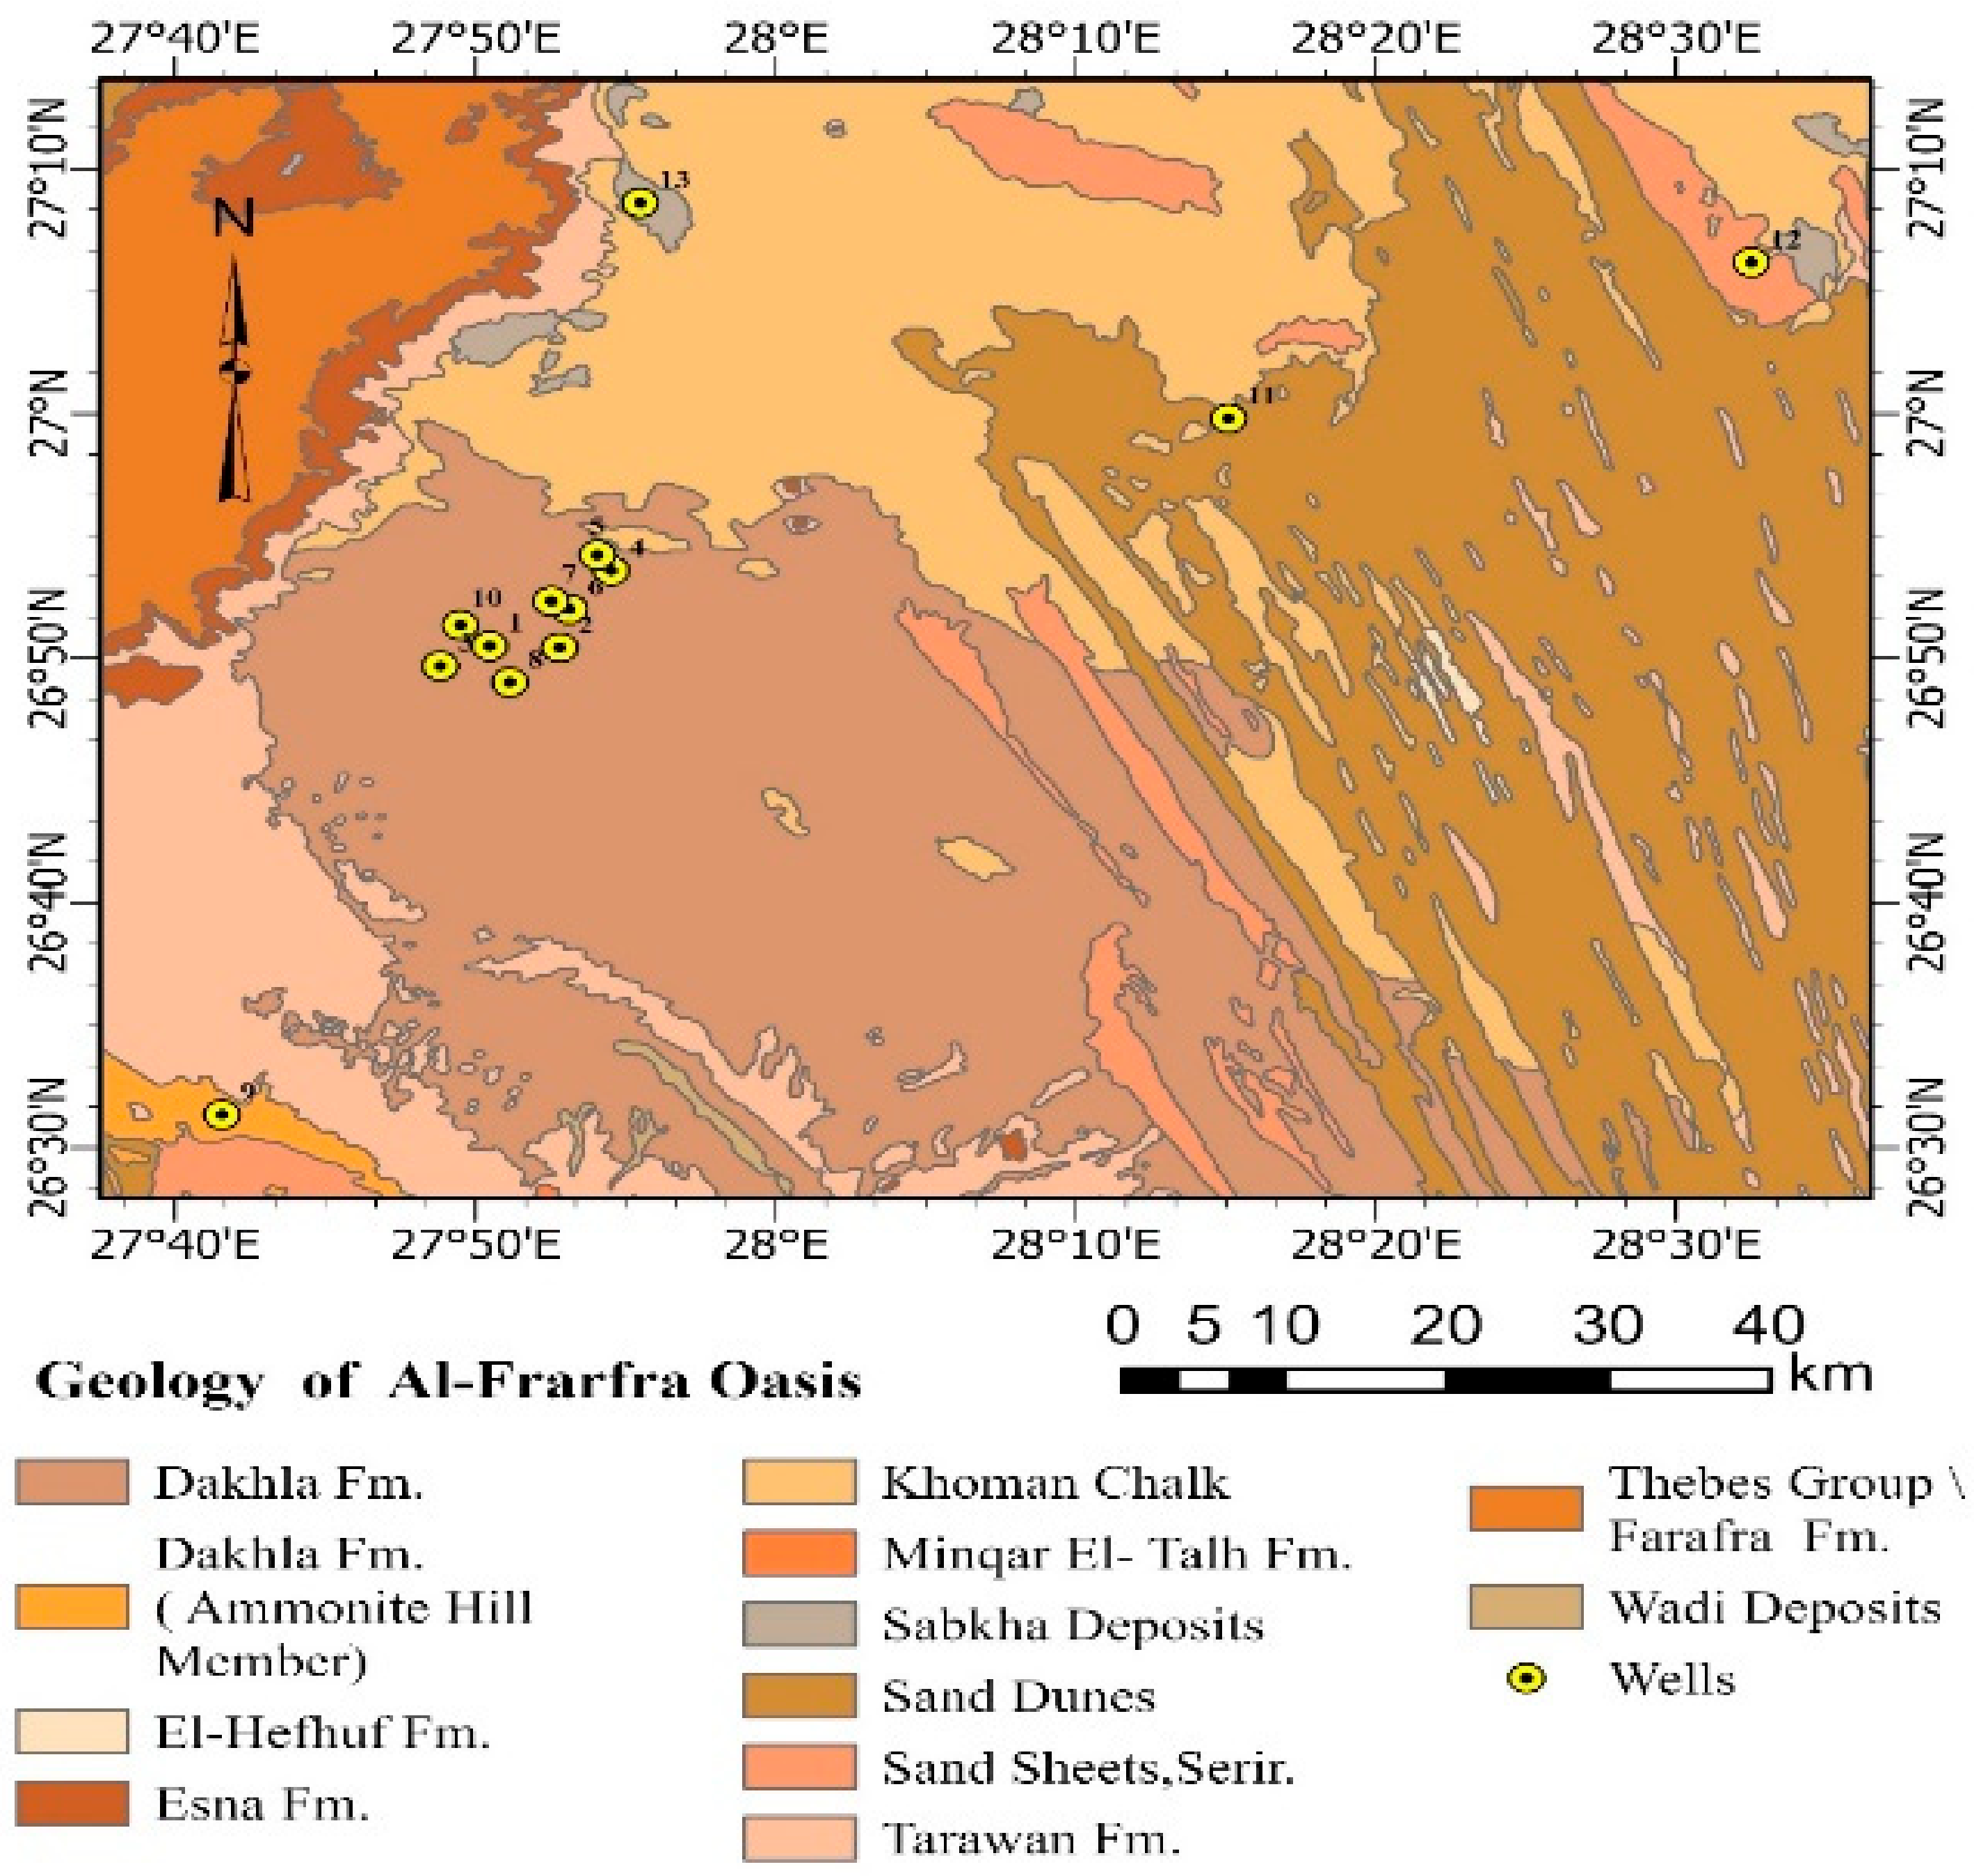
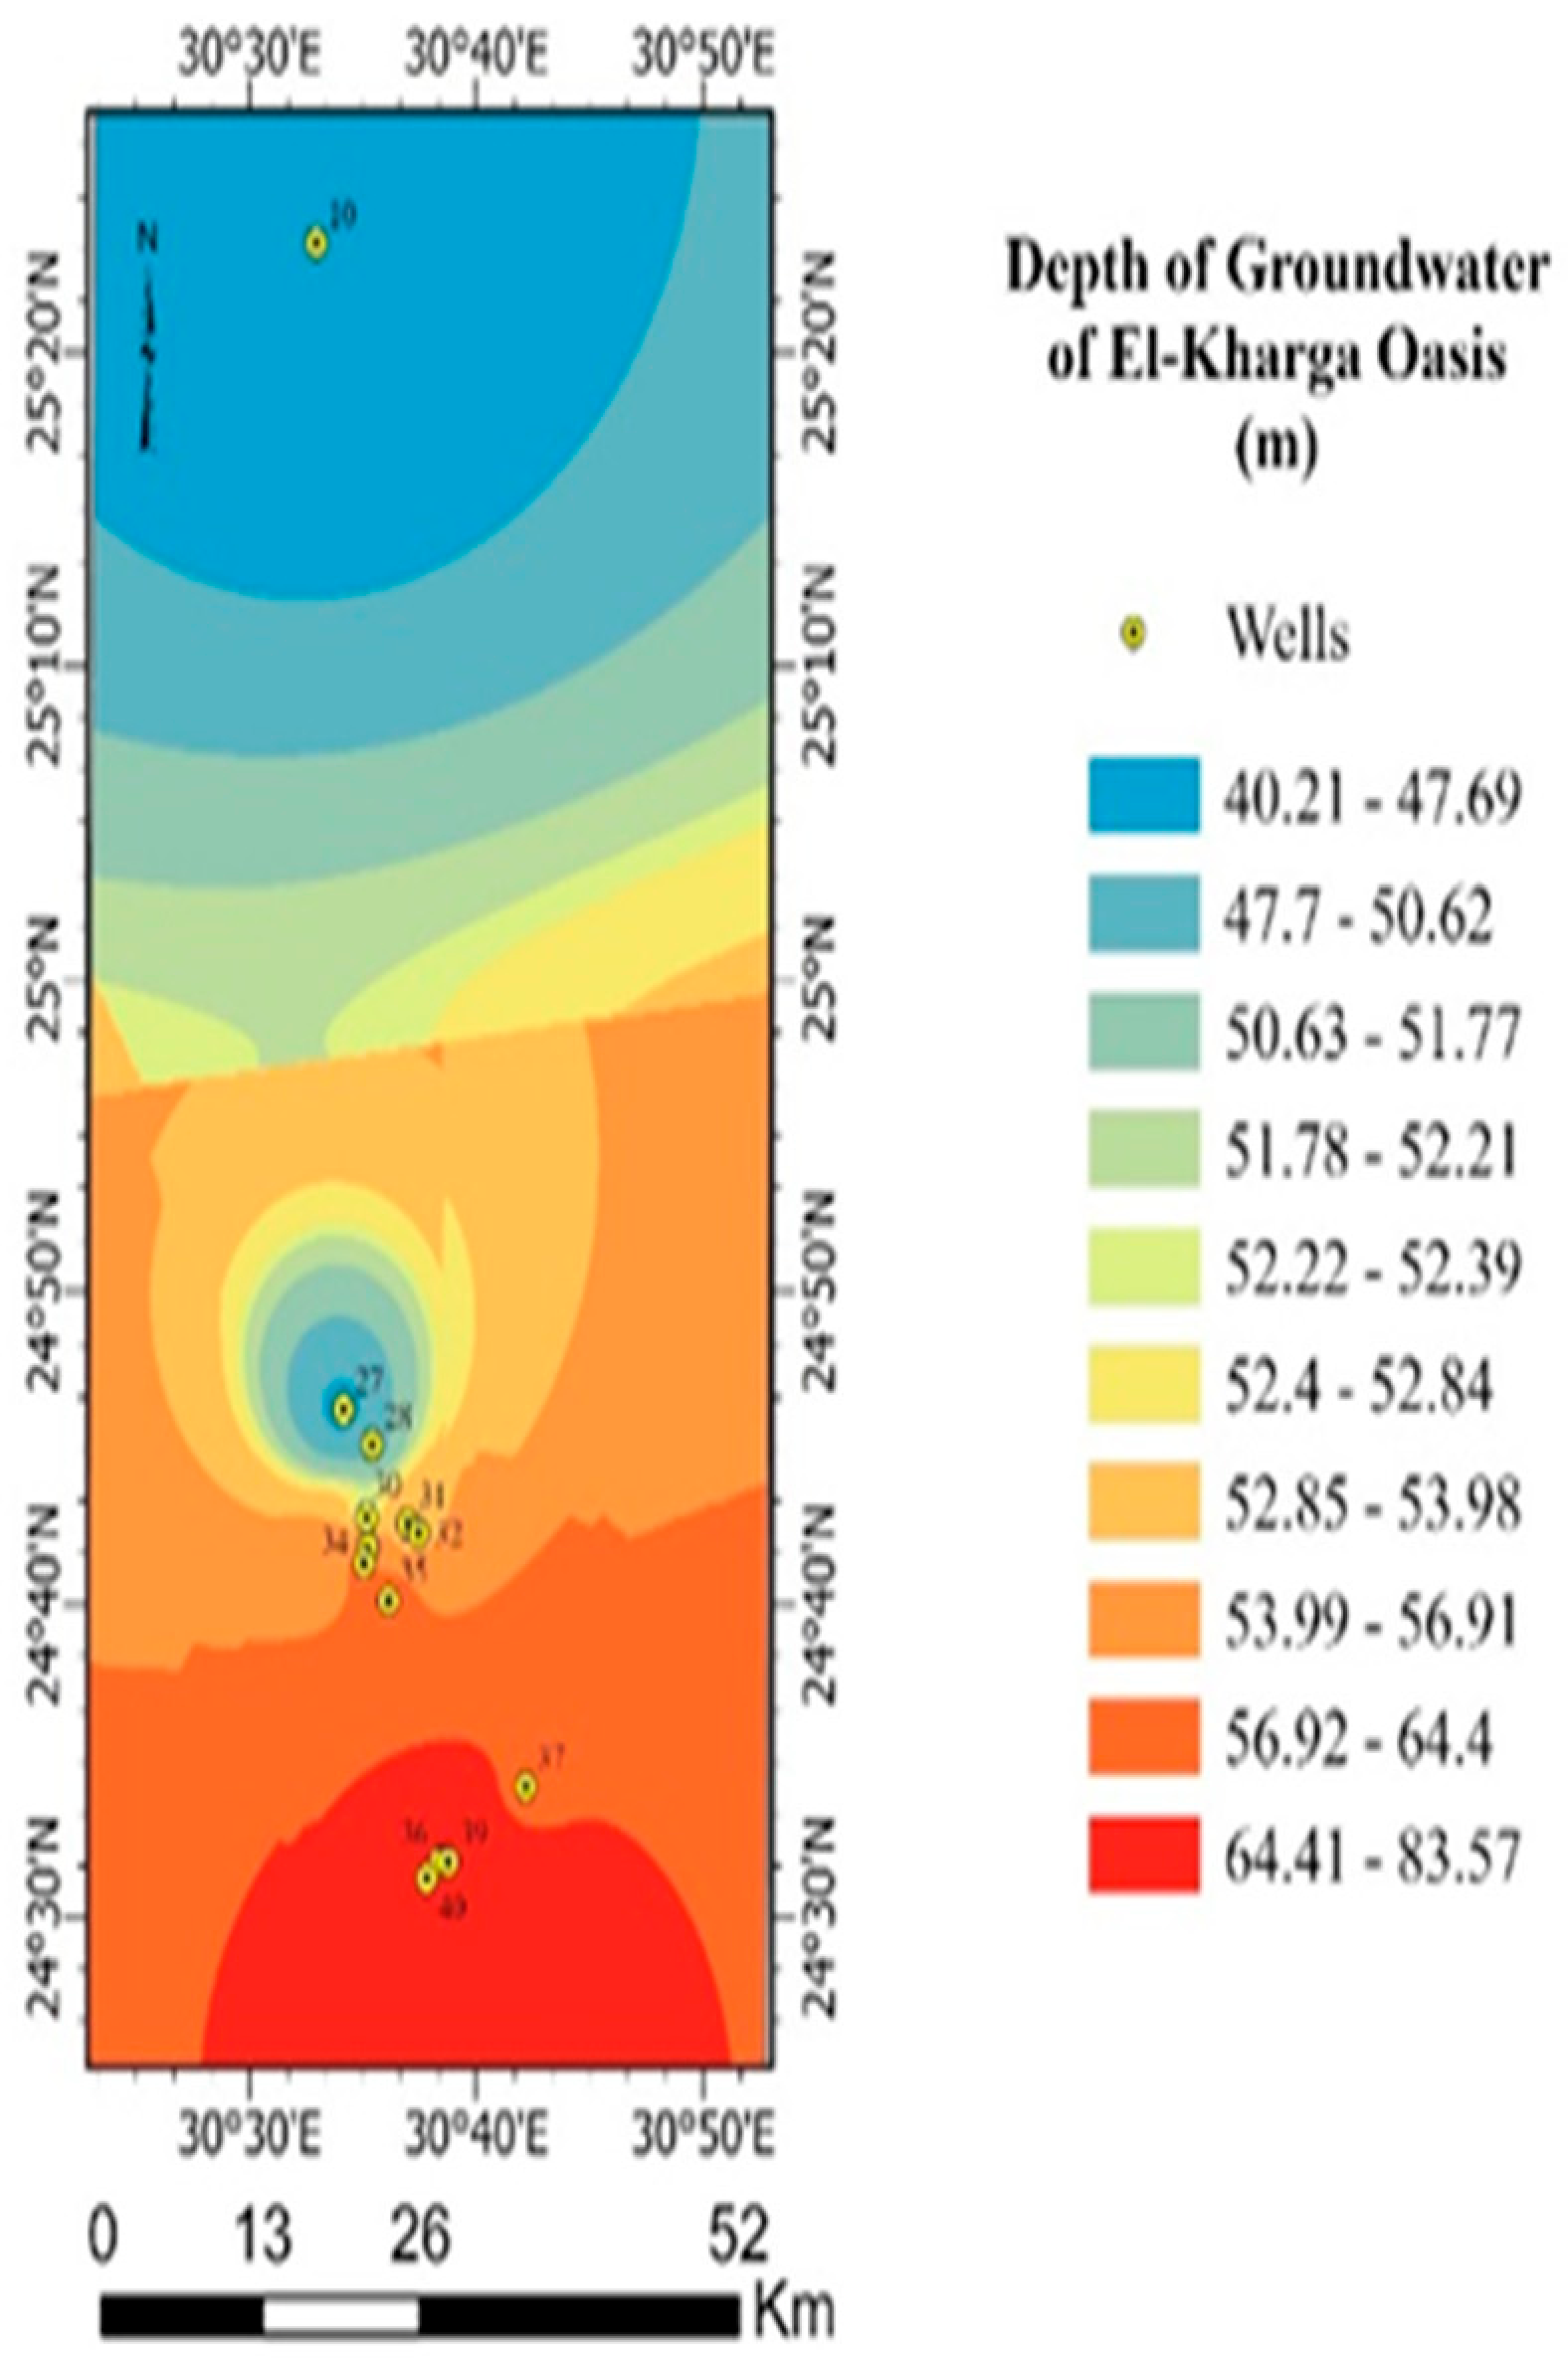
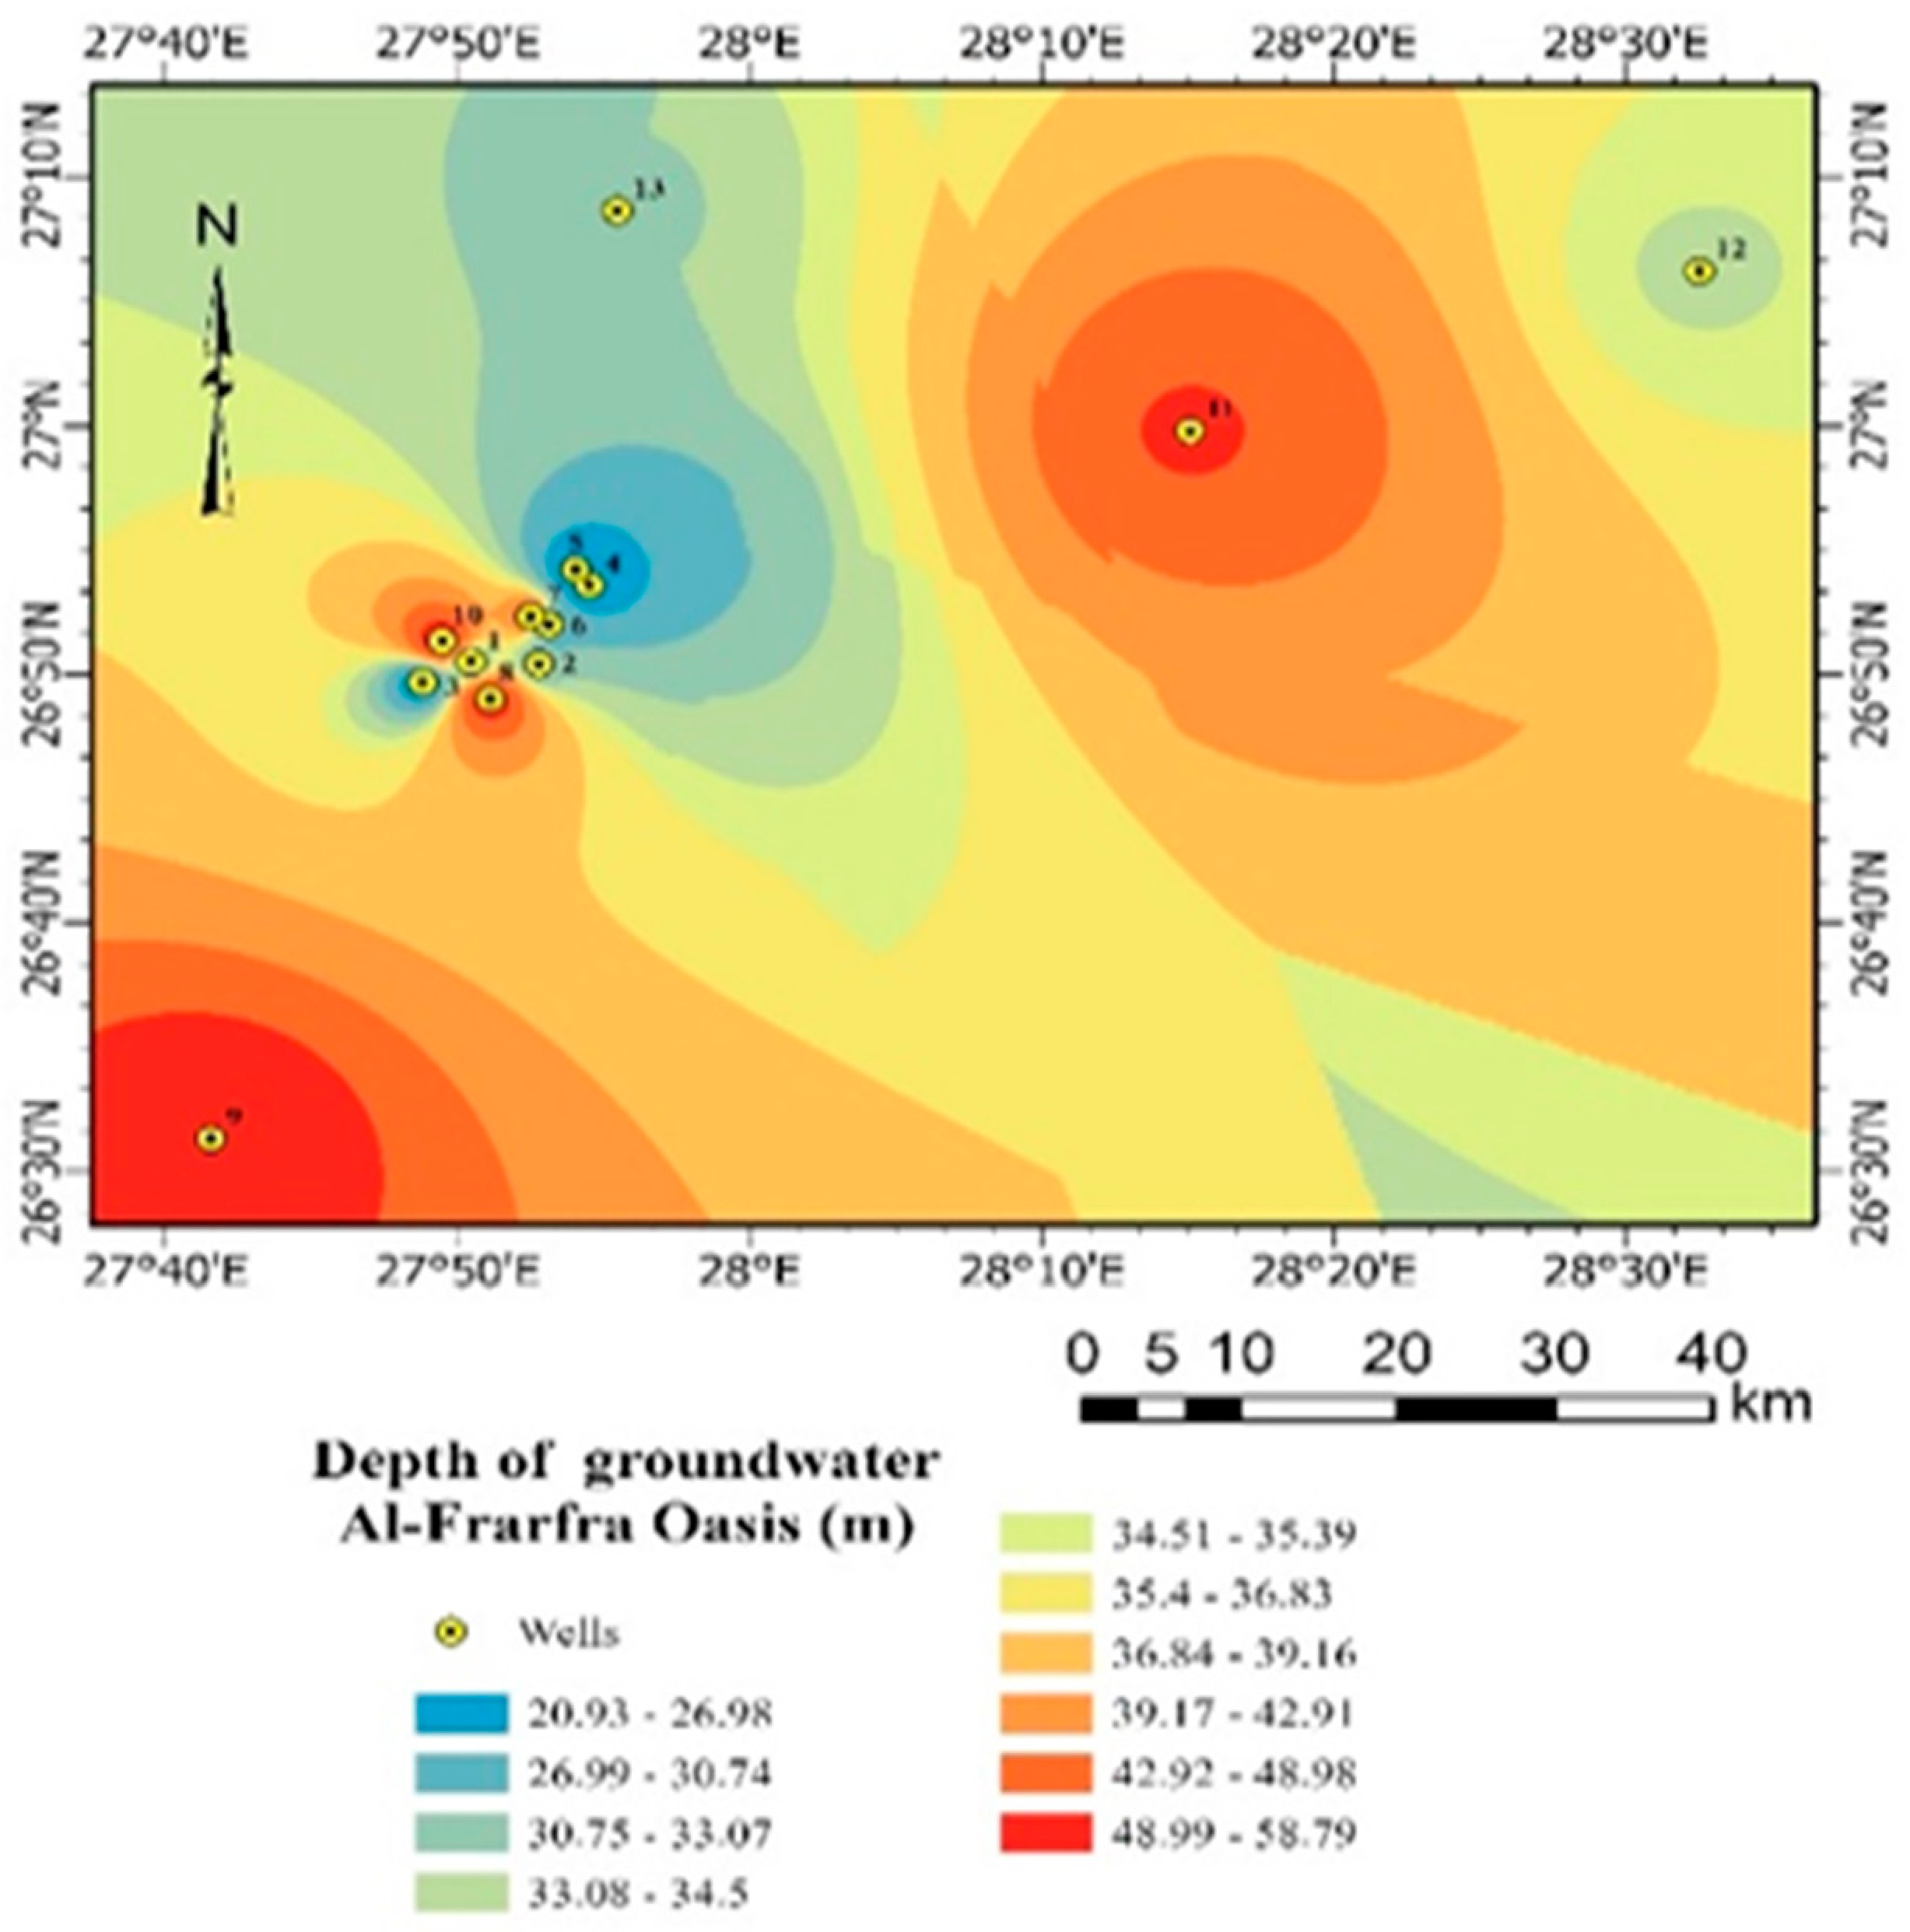
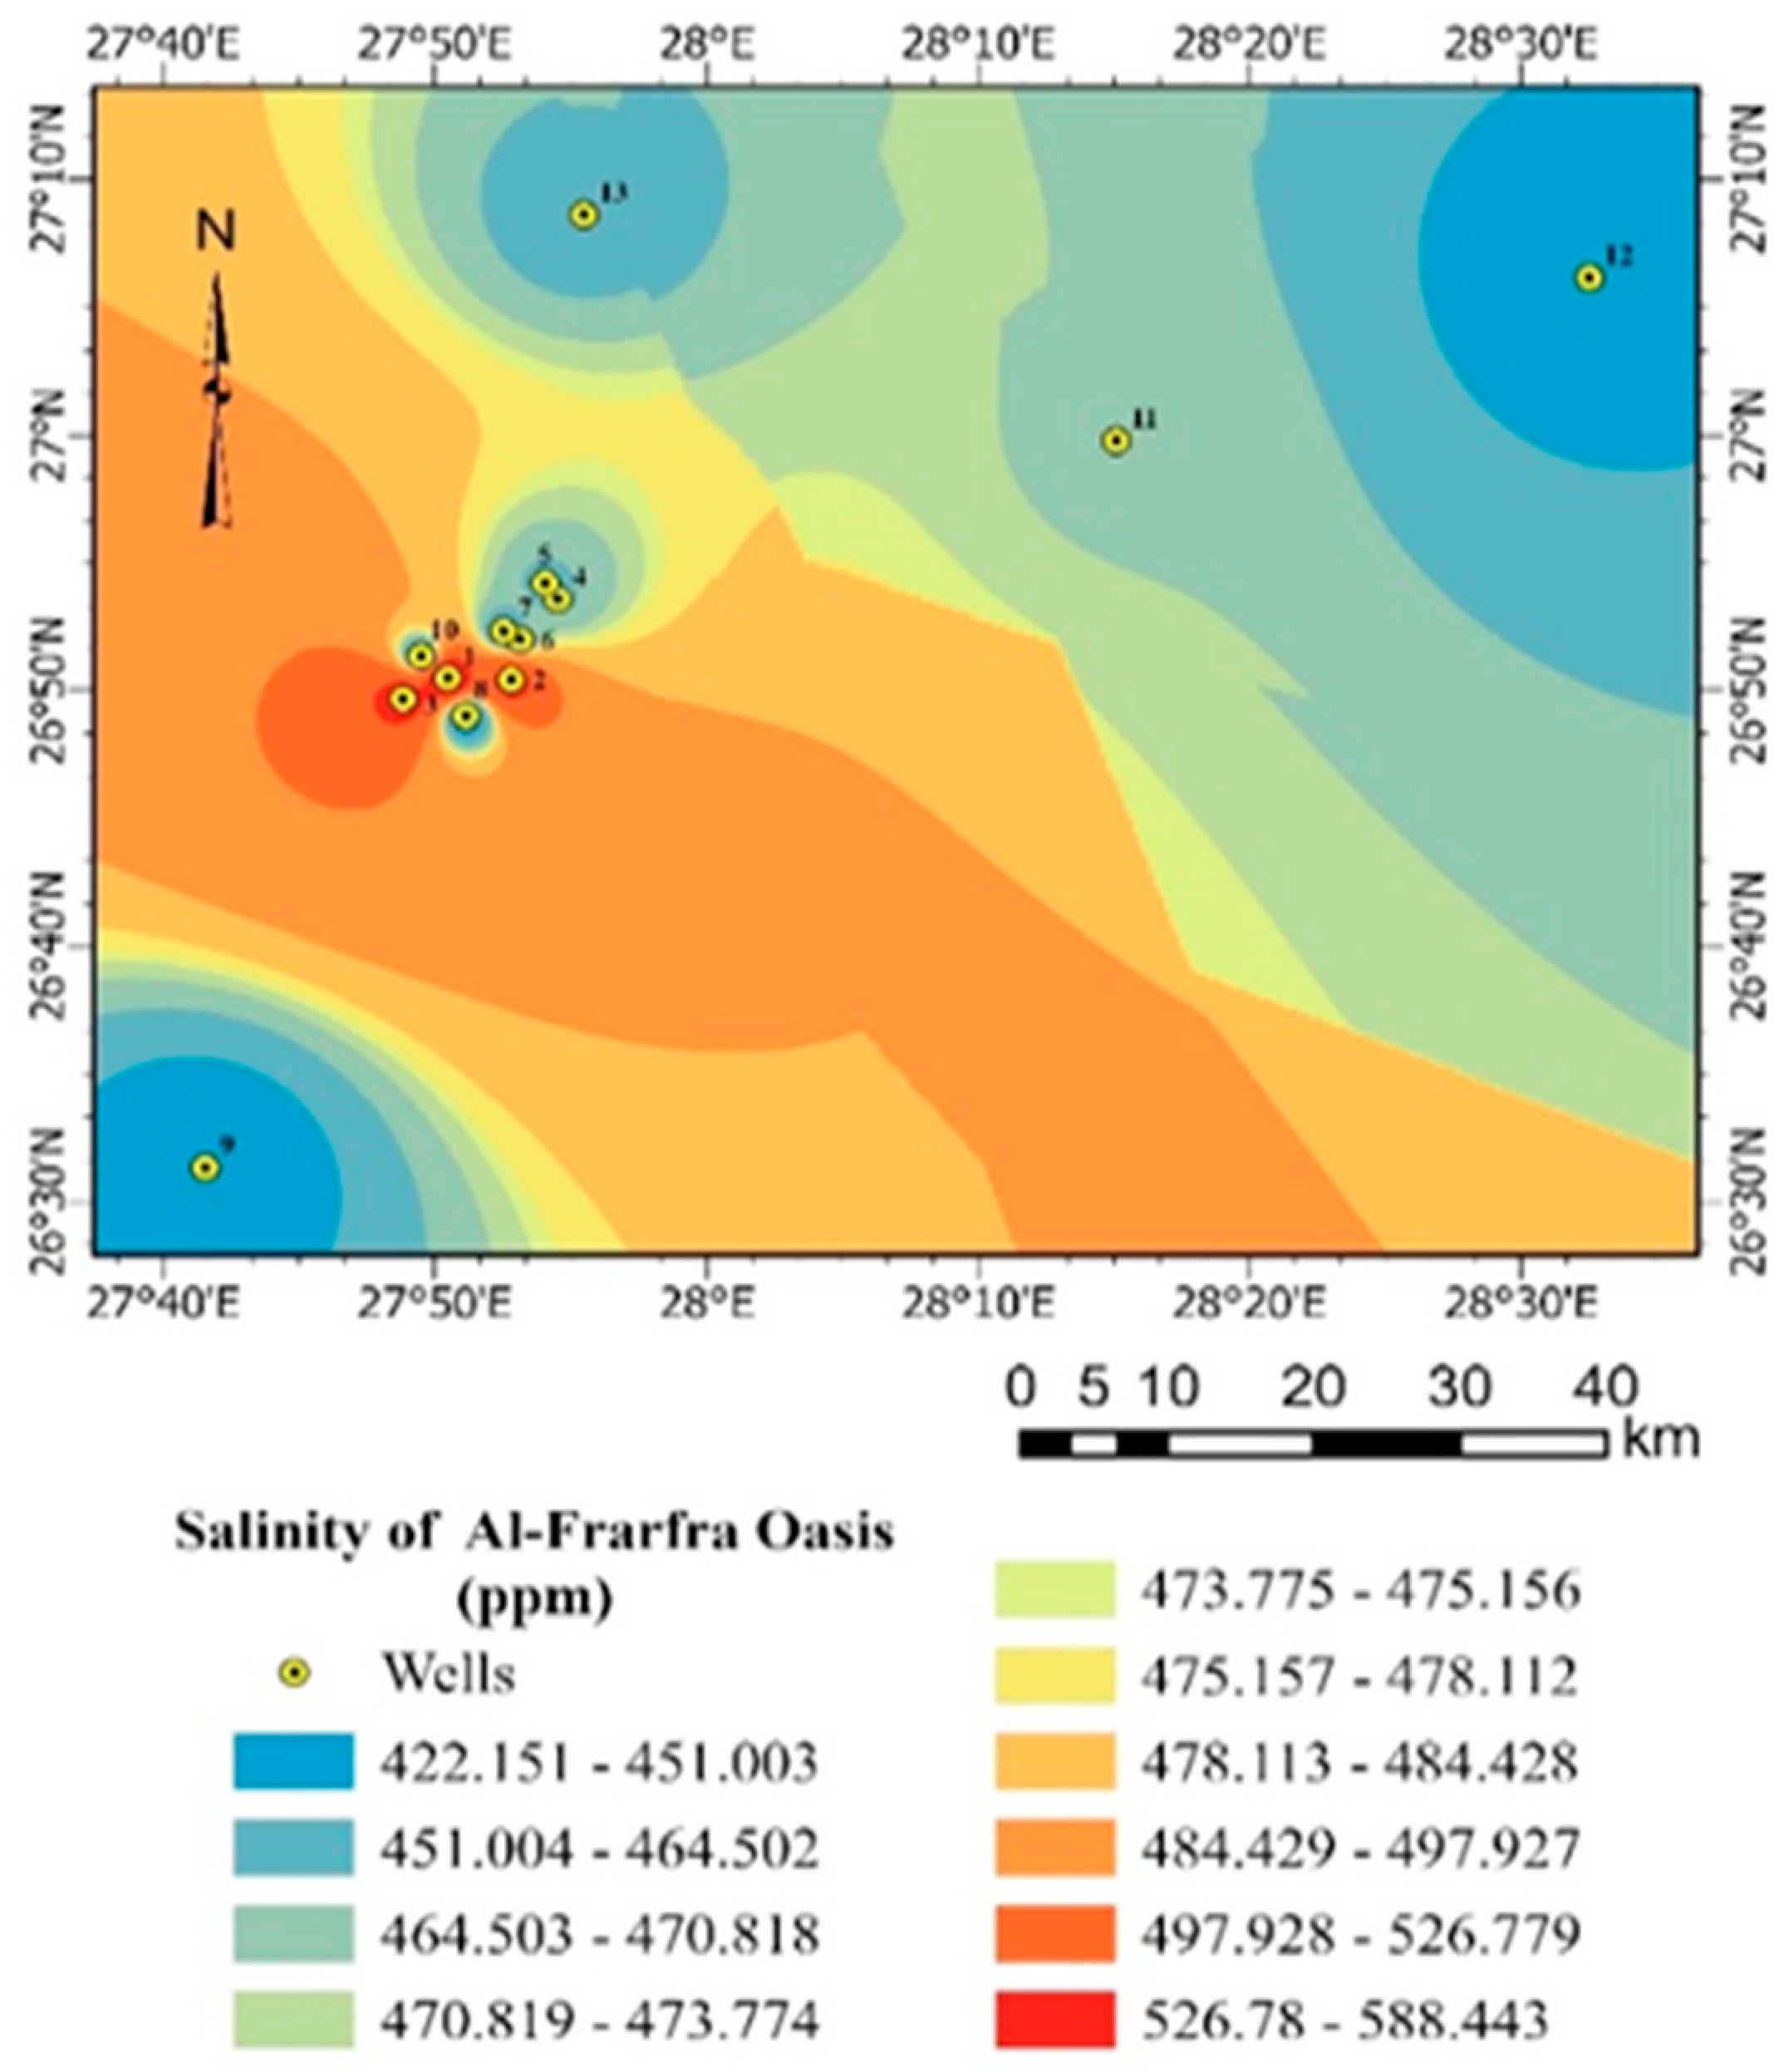
El-Farafra, situated between the Bahariya and Dakhla oases in the New Valley Governorate, features sandstone plateaus, structural escarpments, and shallow depressions shaped by long-term aeolian and tectono-sedimentary processes. As shown in Figure 2, the geological framework is dominated by Nubian Sandstone formations, which strongly influence aquifer characteristics and groundwater flow. The climate is hyper-arid, with annual rainfall of only a few millimeters and potential evapotranspiration exceeding 3000 mm/year. Consequently, net groundwater recharge (R) is extremely limited, estimated at approximately 1.2 mm yr−1 [5]. The depth-to-groundwater map (Figure 3) indicates generally deep water levels, reflecting dependence on fossil groundwater stored in the Nubian Sandstone Aquifer System (NSAS), typically accessed through wells 150–350 m deep. The classified electrical conductivity (EC) map (Figure 4) reveals spatial variability in groundwater salinity, which can be linked to intensive groundwater abstraction and recent agricultural expansion. These activities increase the risk of chemical and microbiological contamination from fertilizers, pesticides, and irrigation return flows, particularly under conditions of minimal natural recharge and limited soil attenuation capacity. Similar patterns have been reported in other parts of the Western Desert undergoing rapid agricultural development [5].
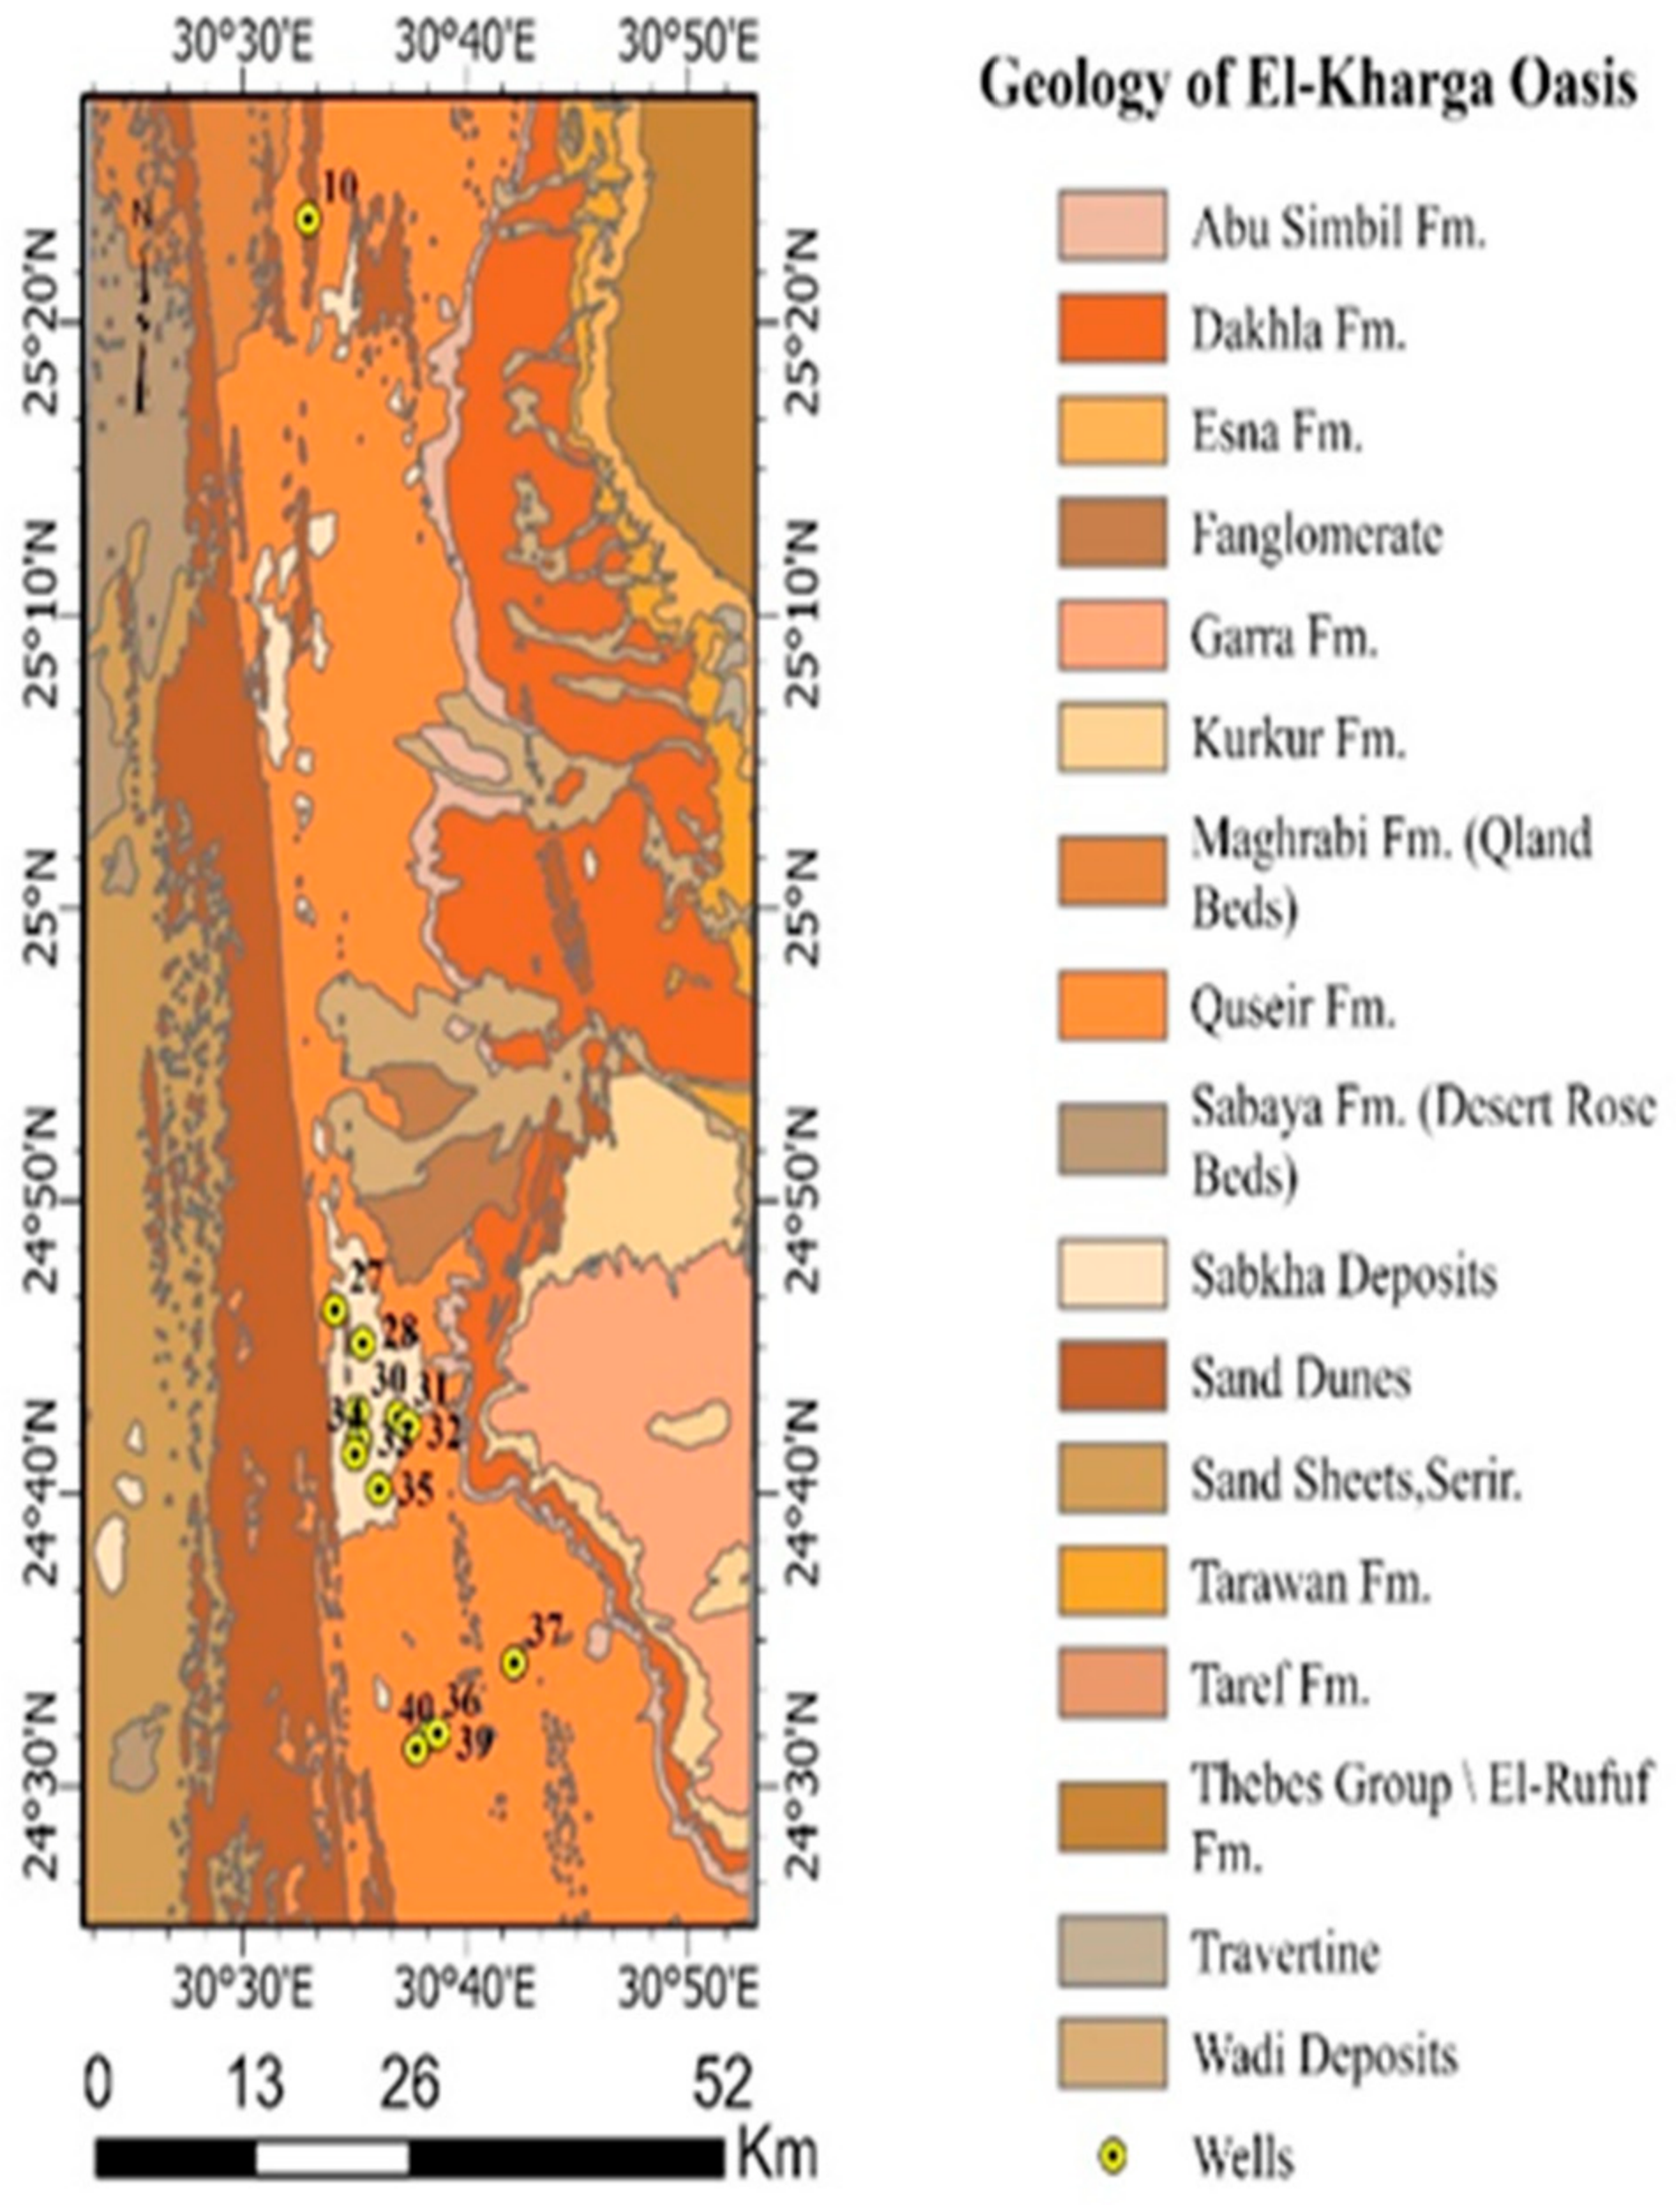
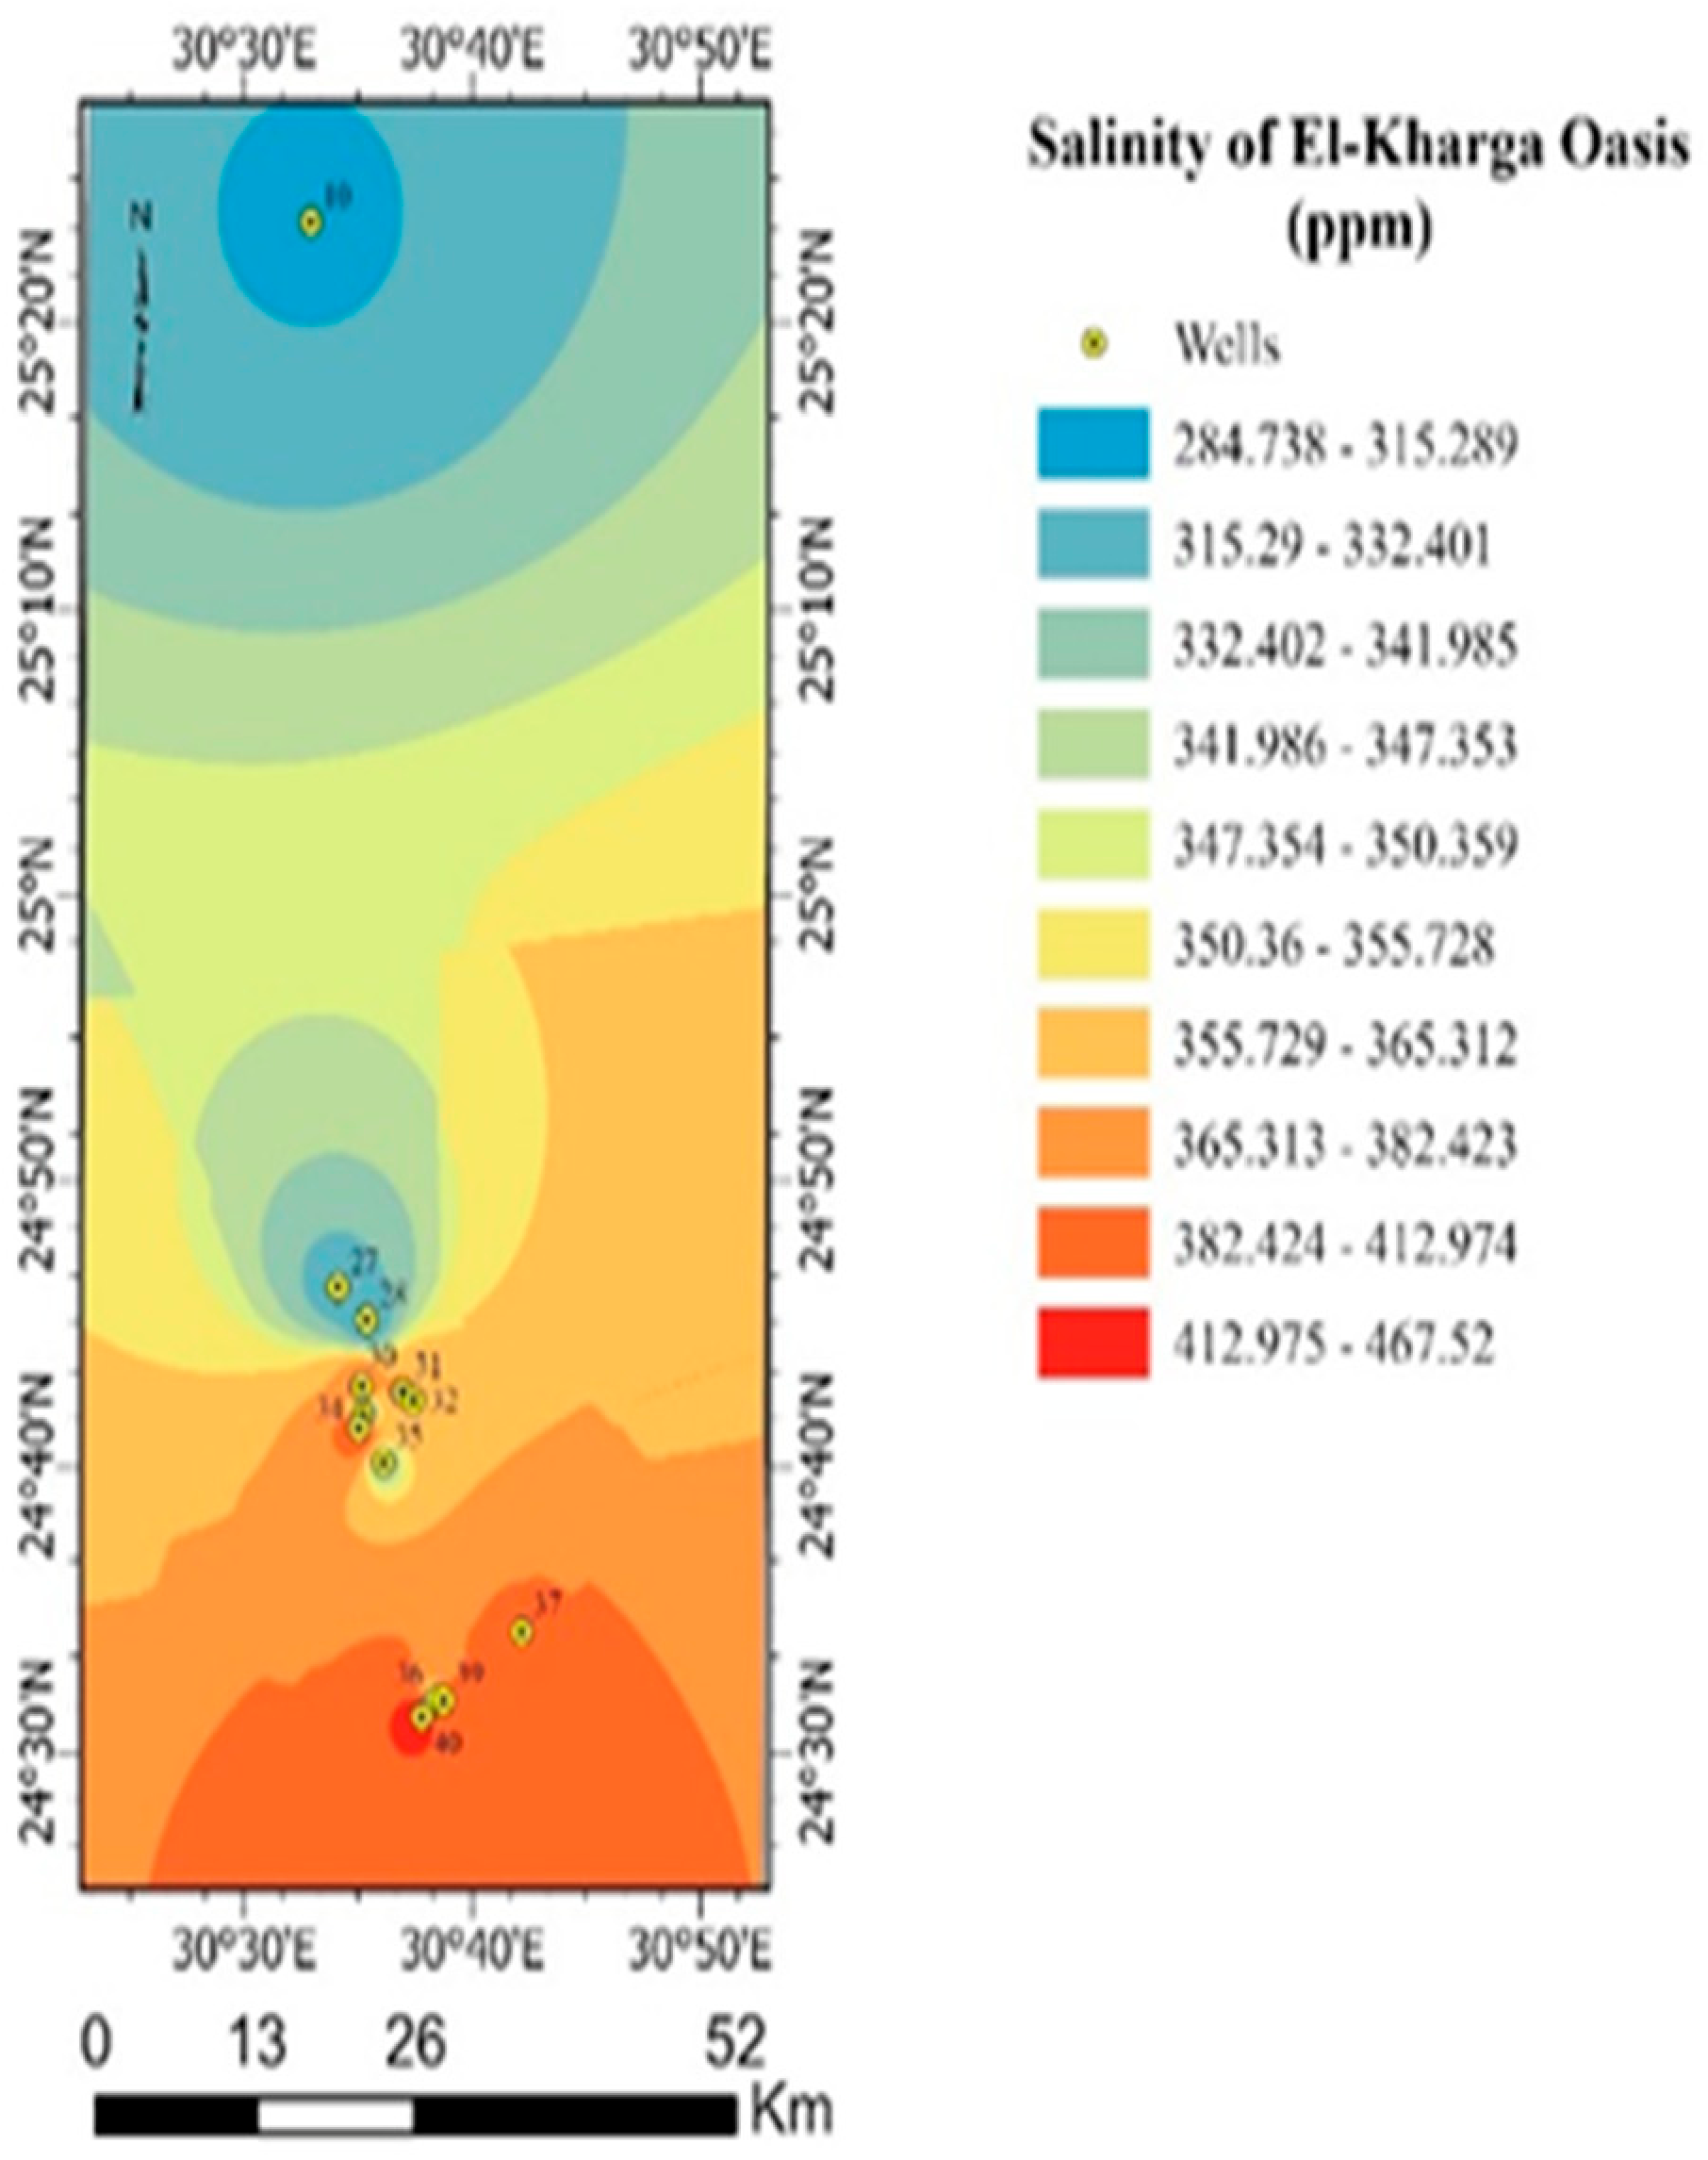
El-Kharga, the governorate capital, is the most urbanized oasis. Its subsurface is composed of thick Nubian Sandstone overlain by Cretaceous and Paleogene formations, forming a complex hydrostratigraphic system with alternating permeable and semi-permeable layers [23]. As illustrated in Figure 5, this geological heterogeneity controls the spatial variability in aquifer properties such as porosity and hydraulic conductivity, which in turn influence groundwater flow and contaminant transport. Land use is characterized by irrigated agriculture, industrial activities, and expanding urban infrastructure. The depth-to-groundwater map (Figure 6) shows spatial variations in groundwater levels, reflecting both natural conditions and intensive abstraction. Net recharge (R) remains very limited, previously estimated at approximately 1.5 mm yr−1 [17], with minor contributions from irrigation return flows and localized infiltration pathways. The classified electrical conductivity (EC) map (Figure 7) highlights noticeable spatial variability in groundwater salinity, likely associated with anthropogenic pressures and hydrogeological complexity. Increasing groundwater extraction and land-use intensification elevate the risk of contamination, consistent with findings from DRASTIC-based assessments in similar arid environments.
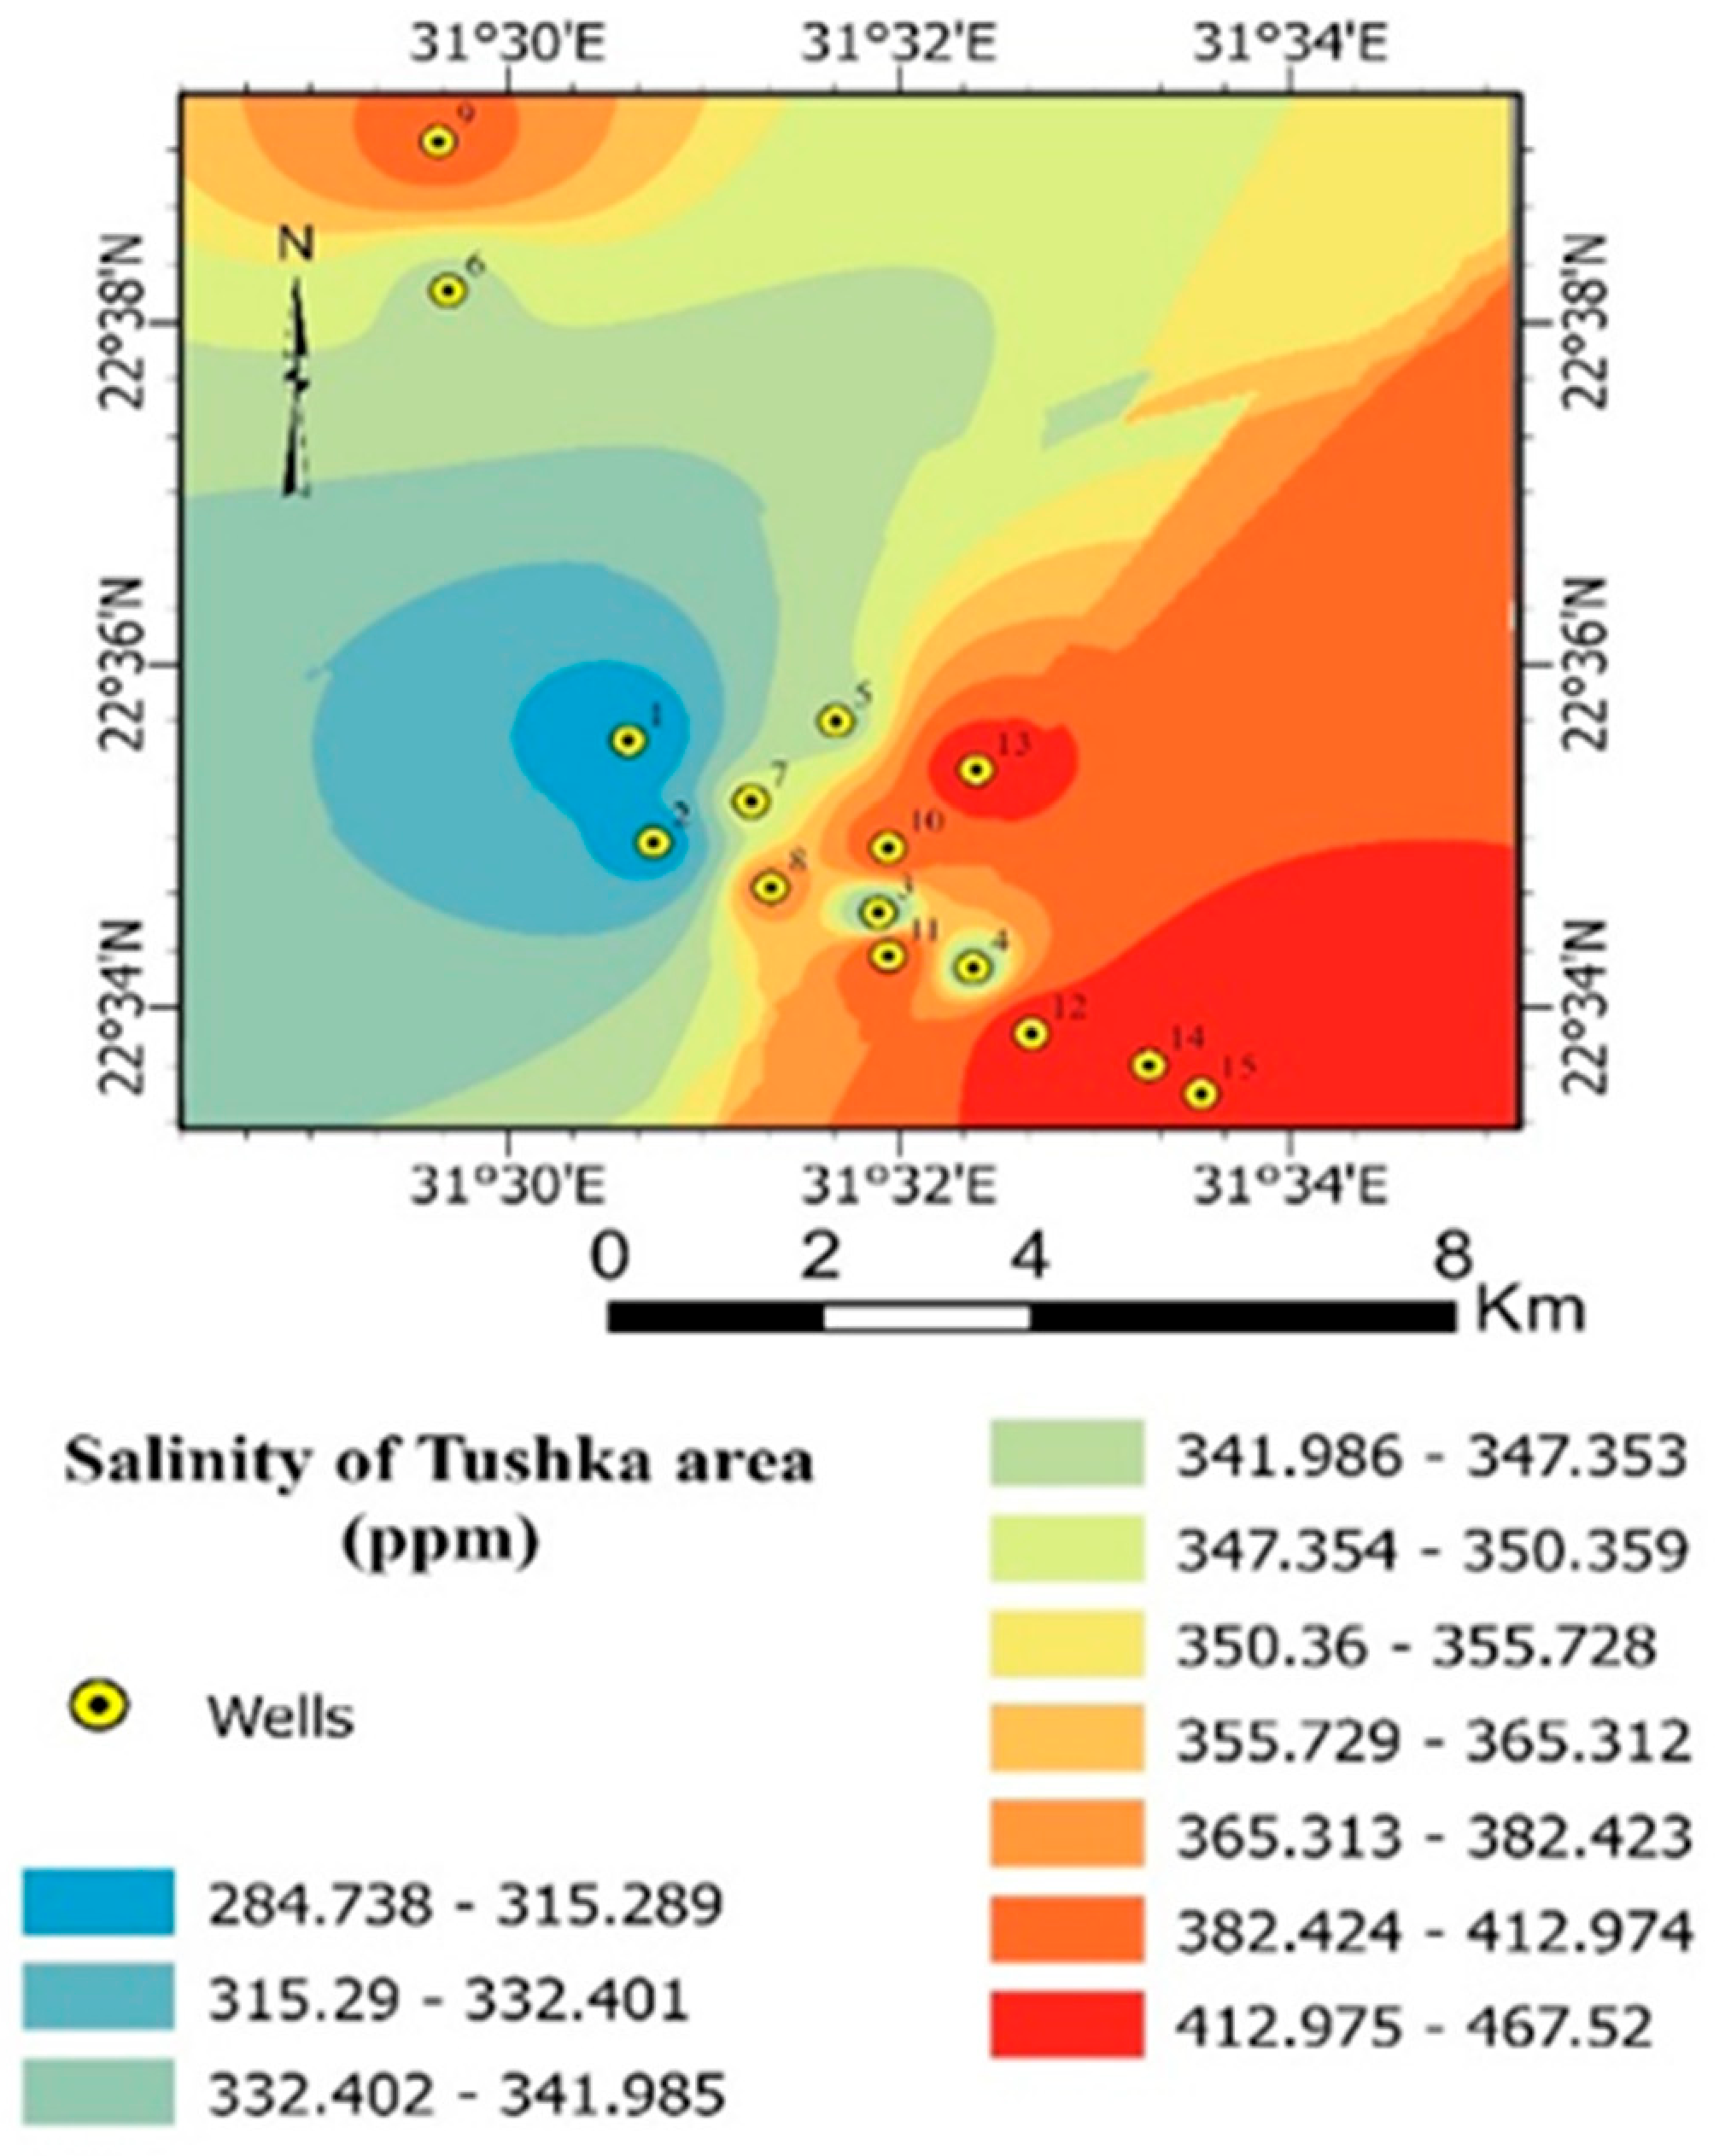
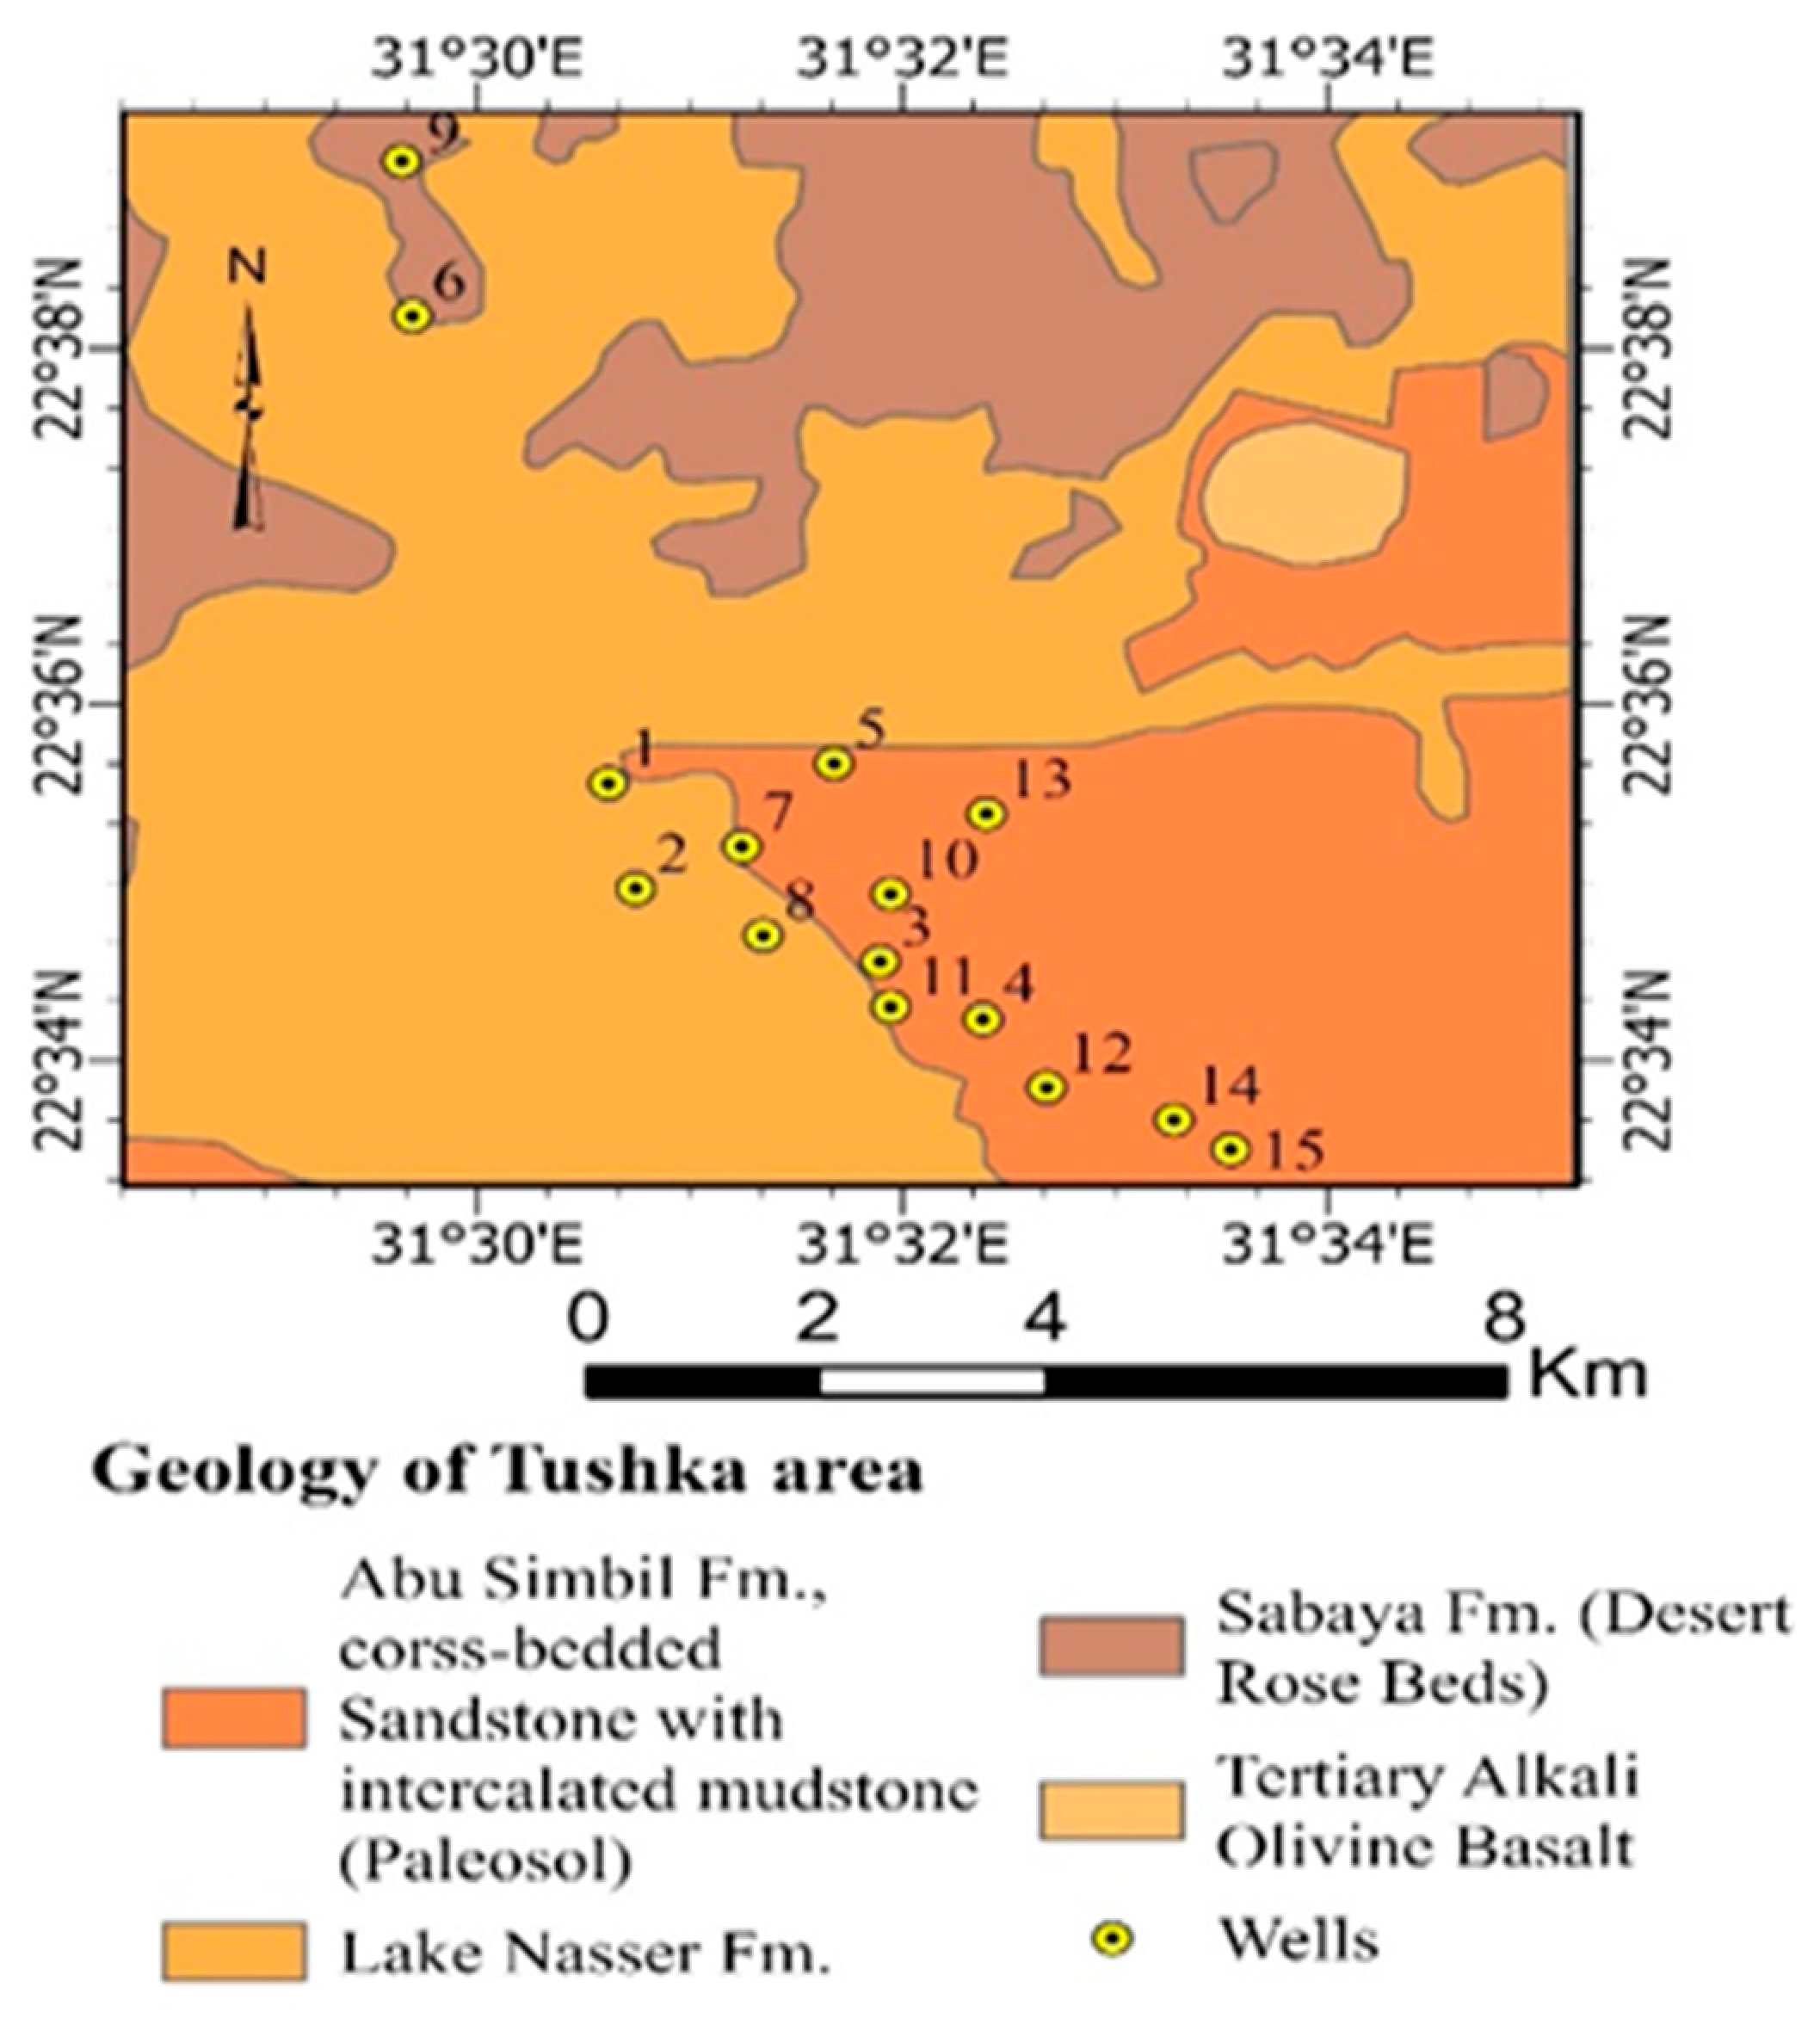
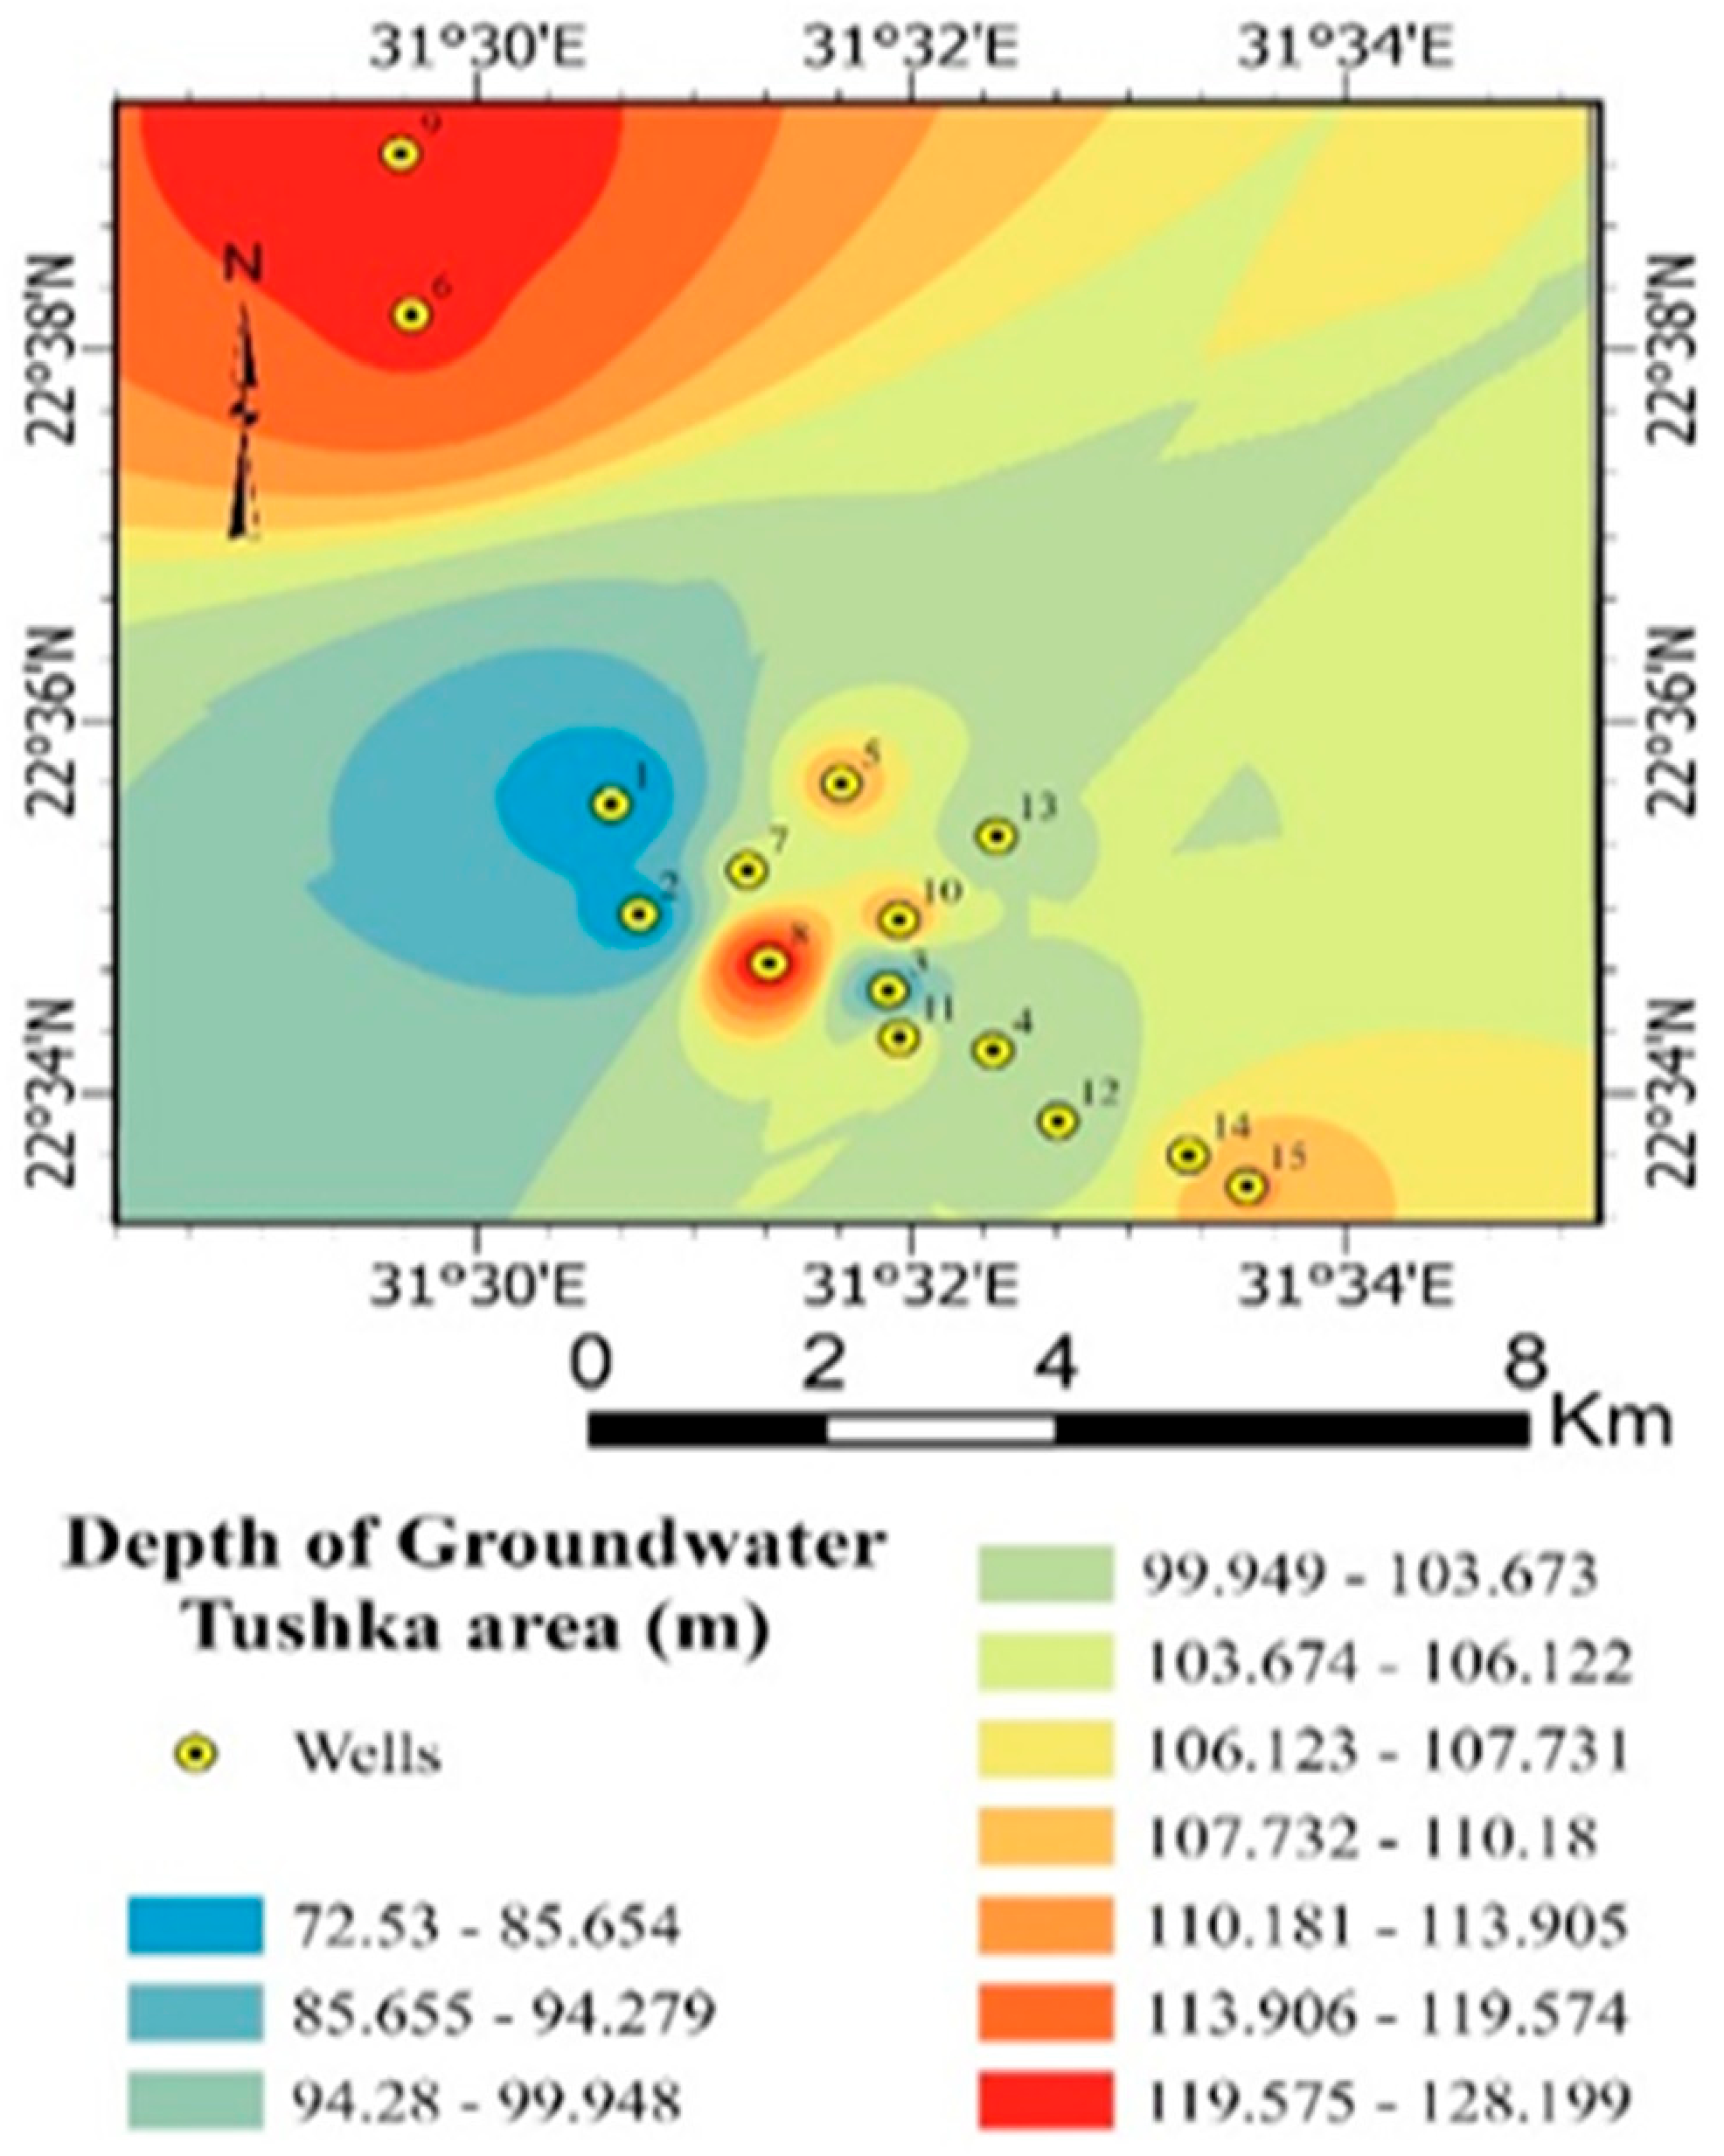
The Tushka Depression, located west of Lake Nasser, consists of interconnected basins that are occasionally recharged by spillway events during periods of high Nile flow. As shown in Figure 8, the area is characterized by a combination of shallow alluvial deposits and underlying Nubian Sandstone formations, creating a hydrogeological setting with multiple pathways for groundwater flow and contaminant migration. Floodwaters provide episodic but significant recharge through seepage, infiltration along abandoned channels, and irrigation return flows. Consequently, net recharge (R) is relatively higher than in the other study areas, estimated at approximately 25–30 mm yr−1 [24]. The depth-to-groundwater map (Figure 9) indicates generally shallower water levels than those in the oases, reflecting these recharge conditions. The classified electrical conductivity (EC) map (Figure 10) shows spatial variability in groundwater salinity, influenced by recharge processes, evaporation, and agricultural activities. Ongoing land reclamation and irrigation expansion further increase the potential for contamination, consistent with observations in semi-arid environments where land-use changes significantly enhance groundwater vulnerability [22].
All three regions exhibit hyper-arid conditions, with negligible rainfall, scarce surface water, and evapotranspiration far exceeding precipitation. As illustrated in Figure 2, Figure 3, Figure 4, Figure 5, Figure 6, Figure 7, Figure 8, Figure 9 and Figure 10, groundwater represents the only reliable water resource, with generally deep water levels in El-Farafra and El-Kharga (Figure 3 and Figure 6) and comparatively shallower conditions in the Tushka Depression due to localized recharge (Figure 9). Despite these differences, natural recharge to the Nubian Sandstone Aquifer System (NSAS) remains extremely limited overall, confirming its largely nonrenewable nature. The EC maps (Figure 4, Figure 7 and Figure 10) reveal spatial variability in groundwater salinity linked to abstraction, recharge conditions, and land-use practices, highlighting the increasing influence of anthropogenic pressures. Consequently, comprehensive vulnerability assessment is essential for sustainable groundwater management, particularly in arid environments subject to agricultural expansion and non-point-source pollution [25,26]. Despite the hyper-arid climate and negligible annual rainfall, groundwater recharge in the study area is highly localized rather than spatially uniform. Infiltration is generally restricted to geomorphic depressions and hydrologic convergence zones where episodic runoff accumulates and temporarily ponds, allowing focused recharge to occur. Consequently, groundwater recharge affects only a limited portion of the landscape, while most of the study area experiences negligible or no recharge under present climatic conditions.
Groundwater vulnerability was evaluated using a modified DRASTIC framework tailored to fossil aquifer conditions. Given the negligible natural recharge, vulnerability is defined in terms of abstraction-driven flow dynamics and land-use-related contaminant inputs rather than recharge-controlled transport. The method was further refined by incorporating land-use factors and expert-based weighting to better capture anthropogenic impacts. The assessment focuses on the shallow and hydraulically accessible zones of the aquifer system, where interaction with surface activities and contamination risk is greatest.

2.2. Methodology

2.2.1. General Overview

In this study, an integrated GIS-based framework was developed to assess groundwater vulnerability in three arid regions of southern Egypt. The approach integrates hydrogeological data, land-use information, expert knowledge, and statistical analysis within a structured workflow. First, groundwater vulnerability is assessed using the standard DRASTIC model, which employs seven hydrogeological parameters to generate spatial vulnerability maps. To account for anthropogenic influences, the model is extended by incorporating land use as an additional parameter, resulting in the DRASTIC-L model, which captures impacts associated with agriculture, urbanization, and industrial activities. Second, parameter weights are refined using a modified Delphi-based expert elicitation procedure, designed to incorporate local hydrogeological expertise and improve the representation of site-specific conditions in arid environments. Third, model performance is evaluated through validation against groundwater salinity (electrical conductivity, EC), used as a proxy indicator of aquifer stress. Both Pearson and Spearman correlation analyses are applied to assess linear and monotonic relationships between vulnerability indices and observed groundwater quality. Finally, a Sobol global sensitivity analysis is conducted to quantify the contribution of individual parameters to the overall variance of the vulnerability indices, thereby identifying the most influential controls and evaluating the robustness of expert-derived weighting. This workflow integrates vulnerability mapping, expert judgment, empirical validation, and uncertainty analysis to provide a comprehensive framework for groundwater management in arid environments.

2.2.2. The DRASTIC Index-Integrated Land Use DRASTIC Index

Groundwater vulnerability in the study area was assessed using two complementary GIS-based index–overlay models: (1) the classical DRASTIC model developed by Aller et al. [22], which evaluates groundwater vulnerability using seven hydrogeological parameters, and (2) the Integrated Land-Use DRASTIC model (DRASTIC-L), which incorporates an additional land-use parameter (L) to represent anthropogenic contamination pressures. This combined framework captures both natural hydrogeological controls and human-induced contamination risks, making it particularly suitable for arid and rapidly developing environments [27]. In this study context, low recharge does not imply reduced vulnerability; instead, it limits dilution and natural flushing, thereby allowing contaminants introduced through anthropogenic activities to persist longer in the aquifer system.
The classical DRASTIC model evaluates groundwater vulnerability using seven parameters: depth-to-water table (D), net recharge (R), aquifer media (A), soil media (S), topography (T), impact of the vadose zone (I), and hydraulic conductivity (C). Spatial layers for each parameter were prepared in ArcGIS, converted to raster format, and assigned ratings from 1 to 10, where higher values indicate greater vulnerability potential [28]. Each rated layer was multiplied by its standardized DRASTIC weight (Table 1), and the vulnerability index was calculated using the weighted-sum equation:
DRASTIC Index = (Dr Dw) + (Rr Rw) + (Ar Aw) + (Sr Sw) + (Tr Tw) + (Ir Iw) + (Cr Cw)
where r represents the assigned rating and w represents the corresponding parameter weight.

2.2.3. Integrated Land-Use DRASTIC (DRASTIC-L) Model

To incorporate anthropogenic influences on groundwater contamination risk, the DRASTIC-L model adds land use (L) as an additional parameter. Land-use patterns significantly affect contamination potential and improve the predictive capability of vulnerability assessments. In this approach, the land-use map of the study area was converted to a raster grid, classified into contamination-related categories, and assigned rating values (Lr) according to their potential impact [22]. A standard weight of Lw = 5 was applied following DRASTIC-L conventions (Table 1).
The integrated vulnerability index was calculated as:
Integrated Land Use DRASTIC Index = DI + (Lr Lw)
where DI represents the DRASTIC index, Lr the land-use rating, and Lw the land-use weight. Incorporating land use improves the model’s ability to represent vulnerability variations associated with agricultural expansion, irrigation return flows, and urban development, conditions particularly relevant in arid regions such as El-Farafra, El-Kharga, and Tushka [30]. While the traditional DRASTIC model relies on standardized ratings and weights for regional assessments, these defaults may not fully capture local hydrogeological, climatic, and land-use characteristics. Consequently, expert knowledge was incorporated to refine parameter ratings and weights, address data limitations, and account for site-specific processes not explicitly represented in the standard DRASTIC framework.

2.2.4. Data Preparation

Preparation of hydrogeological, climatic, soil, land-use, and remote sensing datasets formed the basis for generating the DRASTIC and DRASTIC-L indices. All spatial layers were preprocessed through data cleaning, interpolation where required, and rasterization to a uniform 30 m resolution. The resulting layers were reclassified into rating values, weighted according to model parameters, and integrated to produce the final groundwater vulnerability maps.
Depth-to-Water Table (D)
Depth-to-water table is a primary control on contaminant travel time and natural attenuation, as pollutants must migrate through the unsaturated zone before reaching the aquifer [31,32,33]. Shallow depths increase vulnerability by shortening flow paths and limiting filtration processes [5]. Groundwater levels were obtained from observation wells and Ministry of Water Resources and Irrigation (MWRI) records, while land-surface elevations were derived from U.S. Geological Survey (USGS) data. Depth to the water was calculated as the difference between surface elevation and groundwater level. Given the sparse well distribution typical of desert aquifers, a continuous surface was generated using inverse distance weighting (IDW) interpolation in ArcGIS. The resulting raster was classified according to standard DRASTIC rating ranges (Table 1), with depths of 0–5 m assigned the highest rating (9) and depths > 20 m assigned the lowest (1), consistent with previous studies in arid environments [5].
Net Recharge (R)
Net recharge in the study area is spatially heterogeneous rather than uniformly distributed across the region. Long-term average recharge is extremely low (approximately 1–1.5 mm yr−1 in El-Farafra and El-Kharga), reflecting the prevailing hyper-arid climatic conditions. However, these values represent regional averages and do not imply that recharge occurs uniformly throughout the landscape. Instead, recharge is concentrated in localized hydrologically active zones associated with runoff accumulation, topographic depressions, and anthropogenic water inputs. During infrequent rainfall events, surface runoff converges in closed depressions where temporary ponding enhances infiltration, creating discrete recharge hotspots. Additional recharge occurs in cultivated and reclaimed areas through irrigation return flow, canal seepage, and localized infrastructure leakage. In the Tushka Depression, seepage from the lake and flooding associated with Lake Nasser spillways further enhance localized recharge, resulting in substantially higher recharge rates than those observed in the oases. Accordingly, net recharge is treated in this study as a spatially variable, process-dependent parameter. The DRASTIC recharge rating classes (Table 1) therefore represent localized recharge intensity at the grid-cell scale rather than regional average recharge.
Aquifer Media (A)
Aquifer media represent the lithological characteristics of water-bearing formations, including pore structure and fracture networks that control contaminant transport and attenuation [20]. Coarse-grained, highly permeable, or fractured formations facilitate rapid contaminant movement and are therefore more vulnerable than fine-grained or well-cemented units (Figure 2, Figure 5 and Figure 8). Based on lithological maps and borehole data, the study area is predominantly underlain by the Nubian Sandstone Aquifer System, a highly permeable, coarse-grained sandstone aquifer containing fossil groundwater recharged during past humid climatic periods [5]. In the northern sector, hydraulic continuity with the Khoman Formation forms a mixed Nubian–Khoman system. Owing to its granular structure and high permeability, the NSAS exhibits high vulnerability to contamination, consistent with observations in similar sandstone aquifers [34]. Accordingly, Nubian sandstone and associated alluvial deposits were assigned the highest aquifer-media ratings, as they constitute the principal groundwater-bearing units and abstraction sources.
Soil Media (S)
The soil media parameter represents the properties of the upper unsaturated zone that control infiltration, percolation, and contaminant attenuation before pollutants reach the aquifer [6]. Sandy soils promote rapid infiltration and contaminant transport, whereas clay-rich or silty soils reduce permeability and limit migration [35].
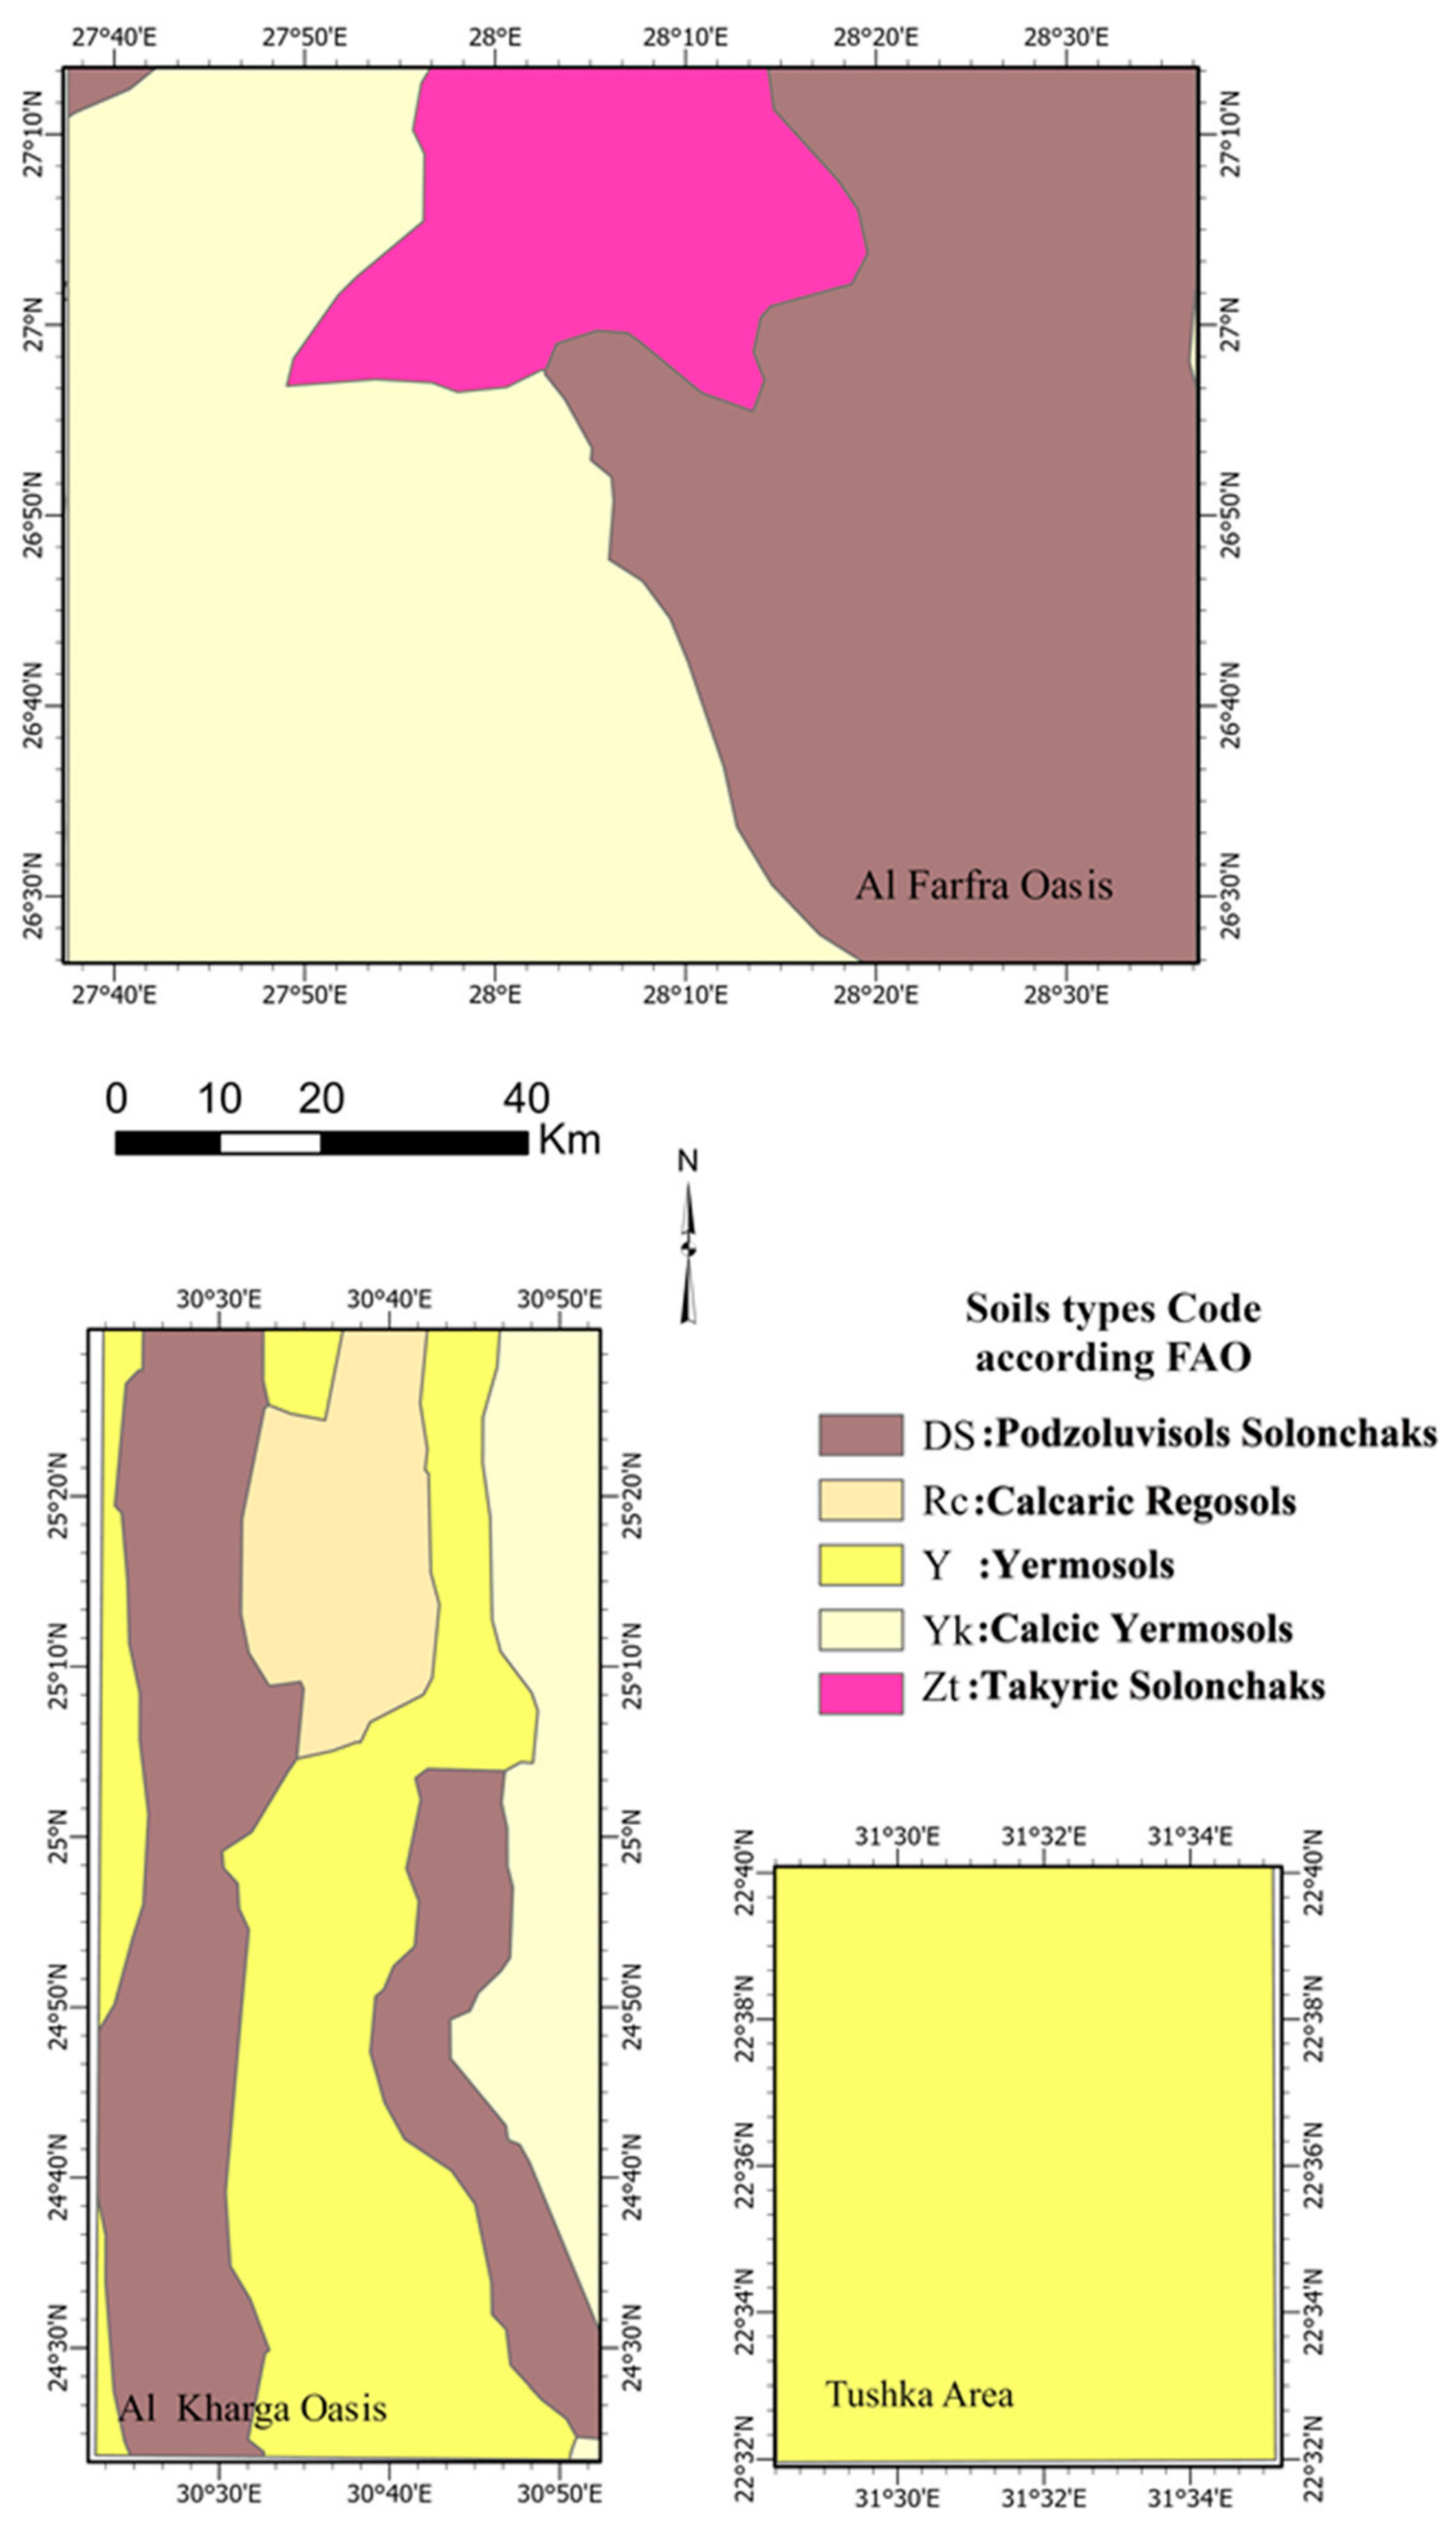
Soil data were obtained from the Harmonized World Soil Database [16] and classified according to standard DRASTIC rating categories (Table 1). Each soil type was assigned a rating from 1 to 10, and the soil-media index was generated by applying the DRASTIC weight (2) to the rated raster layer. In the study area, sandy and urban soils were assigned the highest ratings (9) due to their high permeability, whereas clay-rich soils and areas with limited infiltration capacity received the lowest ratings (1). The spatial distribution of soil types is shown in Figure 11.
Topography (T)
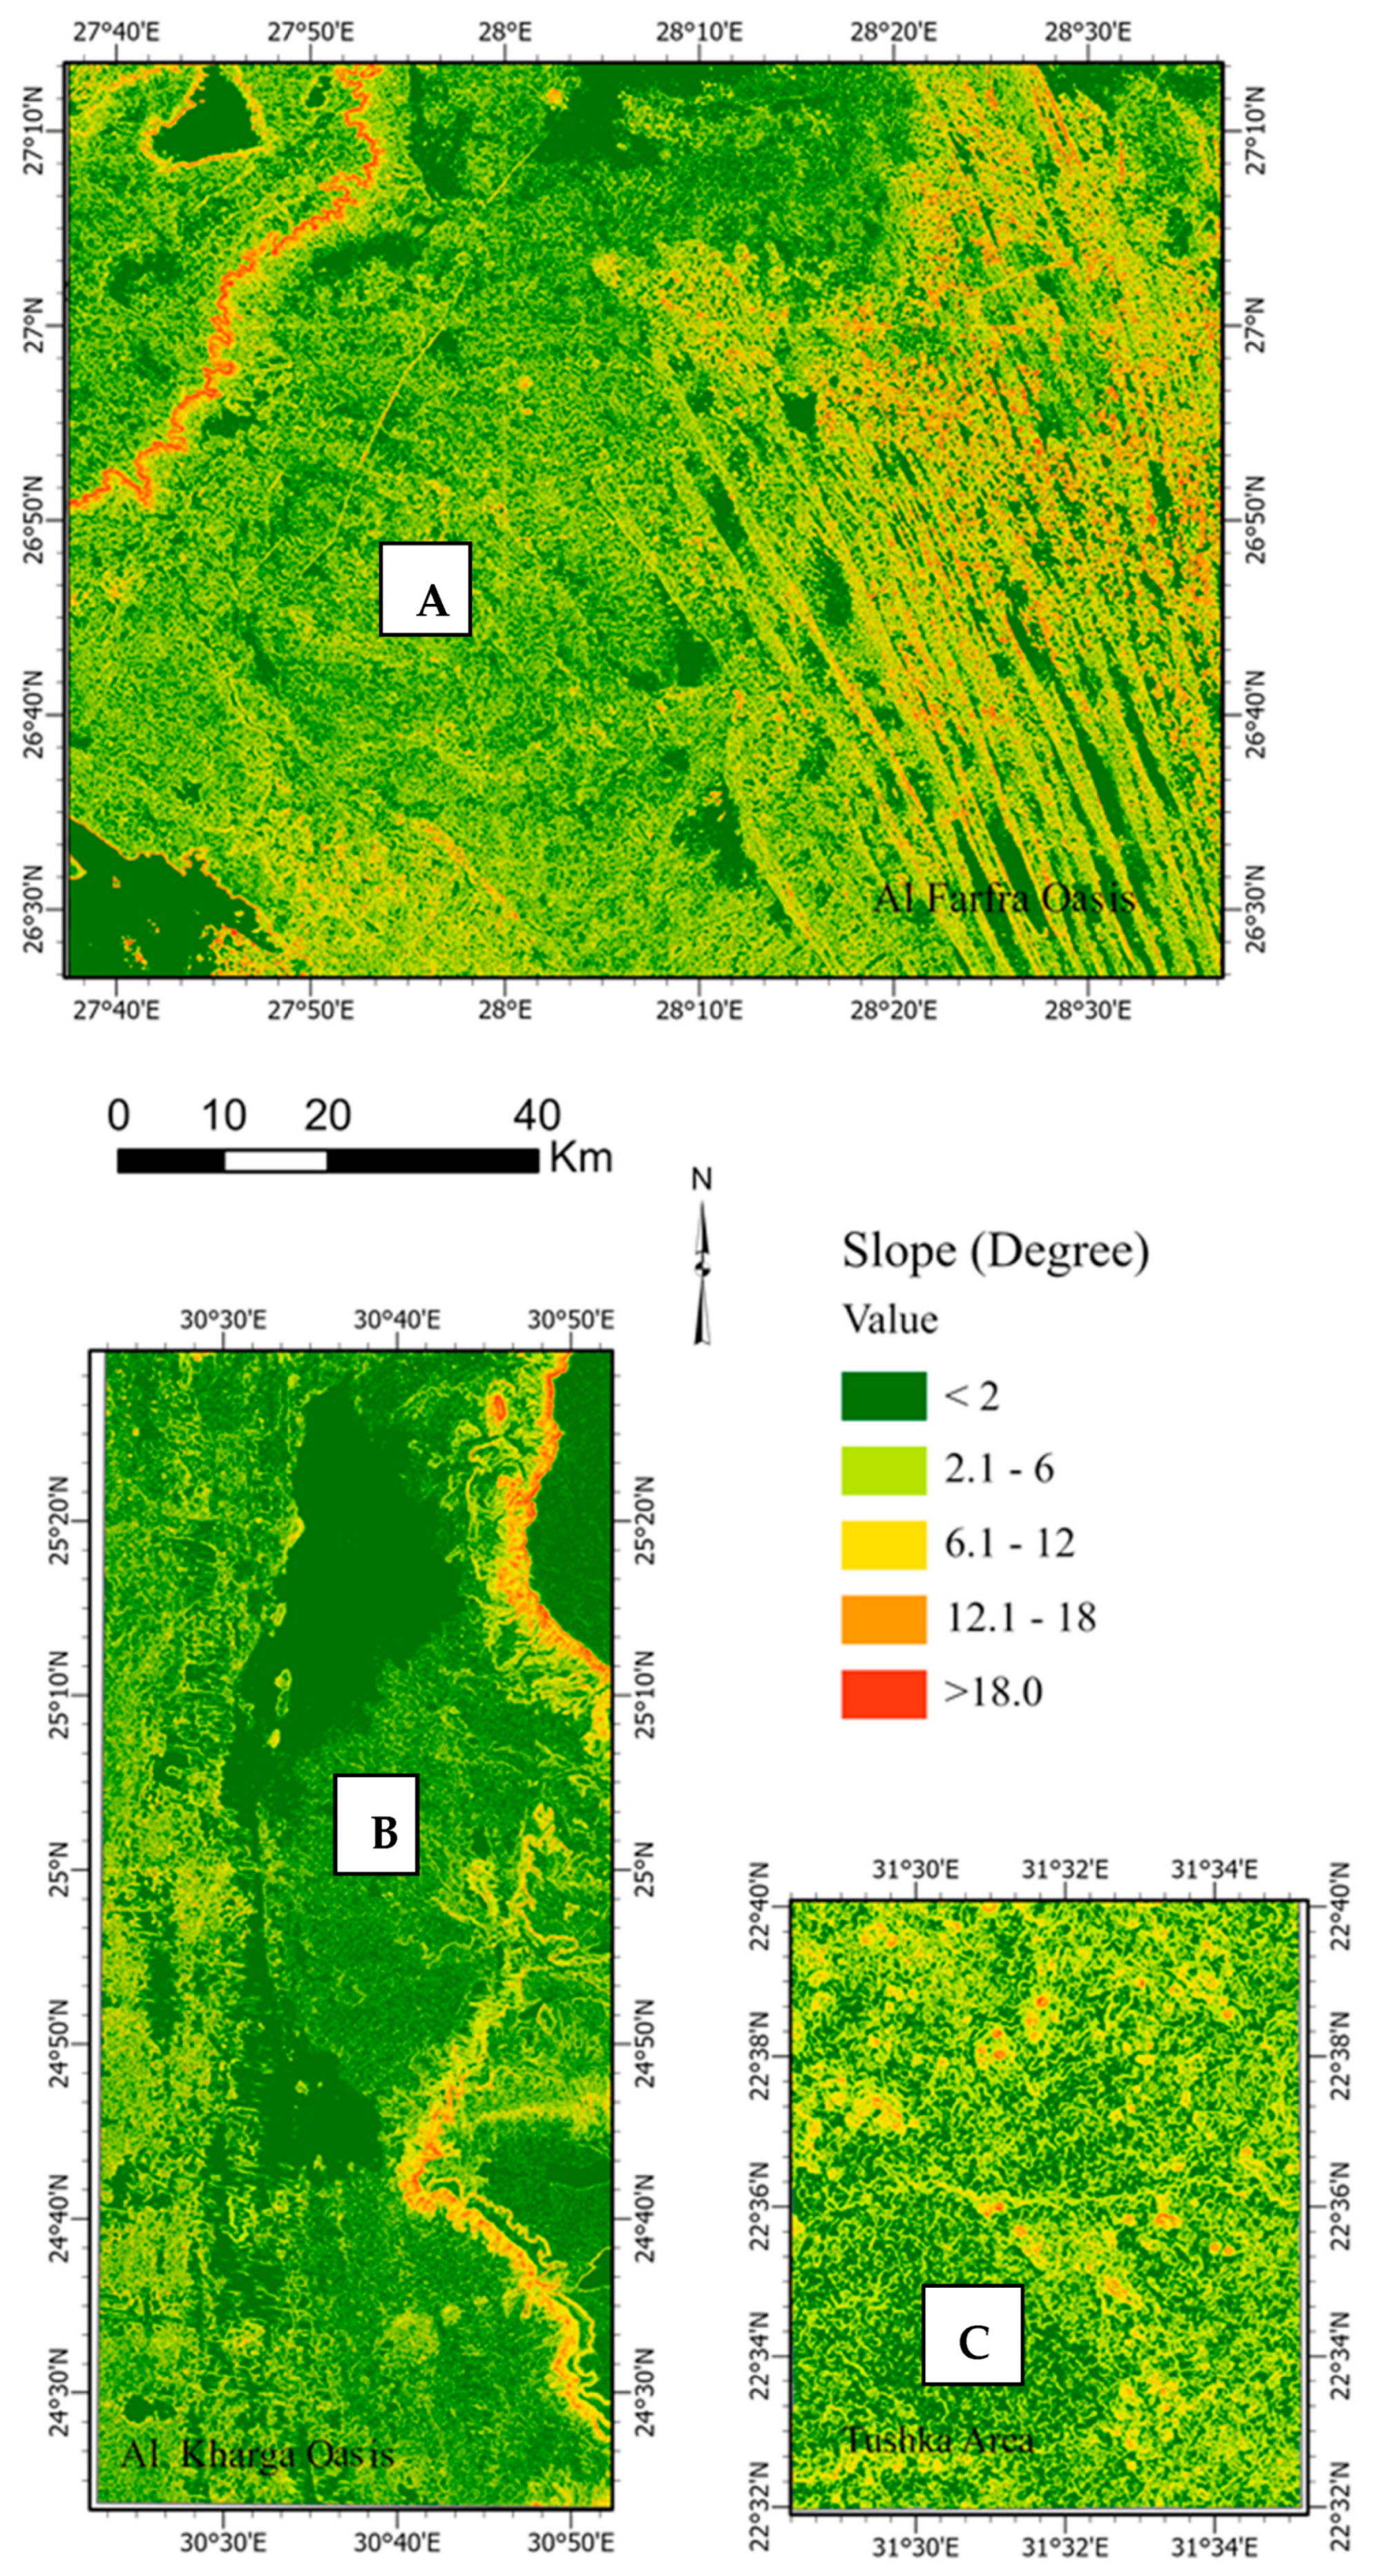
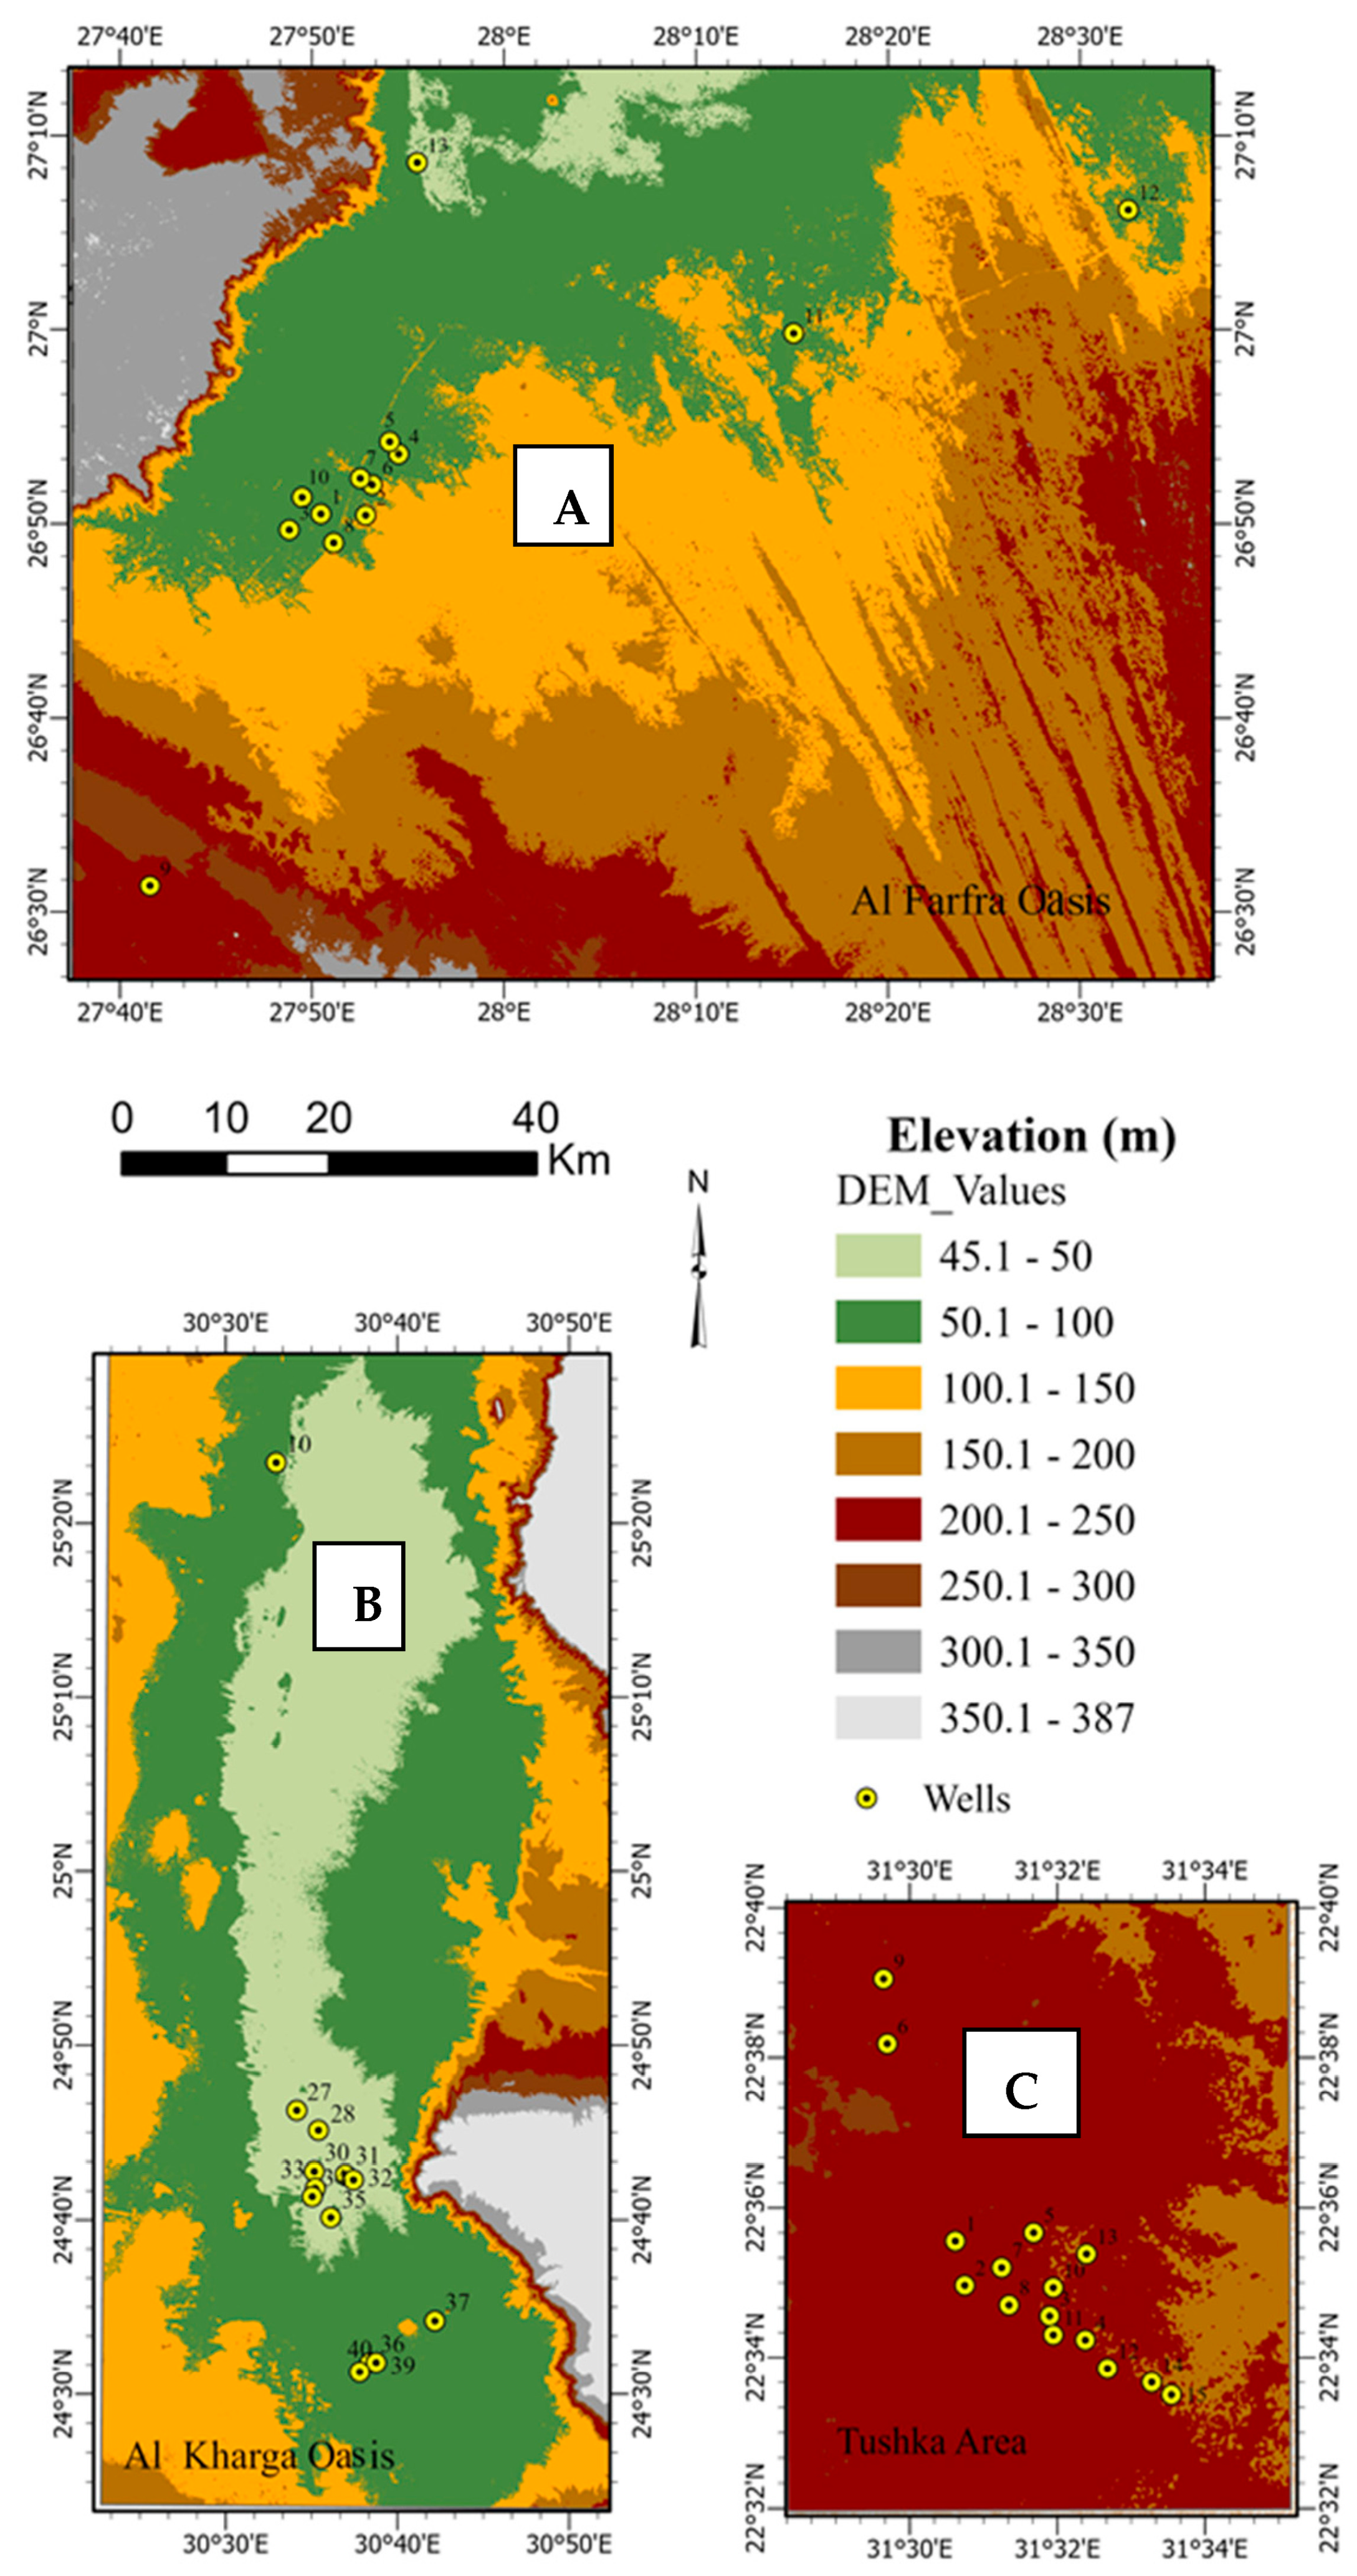
Topography influences surface runoff and the residence time available for infiltration. Flat to gently sloping terrain enhances infiltration and increases contamination risk, whereas steep slopes promote rapid runoff and limit infiltration [13,20]. Slope data were derived from the ASTER DEM [36] and classified according to standard DRASTIC criteria. Five slope classes were defined: <2% (rating 10), 2–6% (9), 6–12% (5), 12–18% (3), and >18% (1), reflecting decreasing infiltration potential. These classes were used to generate the topographic index (Table 1), while the spatial distribution of elevation and slope is presented in Figure 12 and Figure 13.
Impact of the Vadose Zone (I)
The vadose zone, also referred to as the unsaturated zone between the soil layer and the aquifer, plays a key role in controlling contaminant transport through a range of physical, chemical, and biological processes, including filtration, biodegradation, chemical attenuation, volatilization, neutralization, and dispersion [23]. The lithology and thickness of this zone strongly influence the rate at which pollutants migrate to the saturated aquifer system. In accordance with the DRASTIC methodology, vadose-zone ratings were assigned based on the same lithological classification used for aquifer media [37]. Coarse-grained sandstone formations, which facilitate relatively rapid contaminant movement, were assigned higher vulnerability ratings than finer-grained sediments due to their greater permeability and reduced attenuation capacity. Given the lithological similarity between the vadose zone and aquifer media within the study area, aquifer-media characteristics were adopted as a proxy representation for the vadose zone. The resulting vadose-zone index map was generated by multiplying the reclassified raster layer by the standard DRASTIC weight of five (Table 1).
Hydraulic Conductivity (C)
Hydraulic conductivity represents the ability of the aquifer to transmit water under a hydraulic gradient and plays a key role in controlling groundwater flow velocity and contaminant transport within the saturated zone [5]. Aquifers with higher hydraulic conductivity facilitate faster advective transport and are therefore associated with higher vulnerability. Hydraulic conductivity values were compiled from available pumping-test data, transmissivity estimates, and published hydrogeological studies for the Nubian Sandstone Aquifer System (NSAS) and surrounding formations in southern Egypt [38]. However, due to the sparse spatial distribution of these measurements and the regional scale of the study, it was not feasible to construct a continuous, spatially representative conductivity surface based solely on direct observations.
To address this limitation, a proxy-based regionalization approach was adopted. In this framework, hydraulic conductivity classes were primarily defined based on aquifer media and lithological characteristics derived from geological maps and borehole data, which provide the most direct indication of subsurface permeability. Highly permeable sandstone formations of the NSAS were assigned higher ratings, while finer-grained or semi-consolidated units received lower ratings, consistent with standard DRASTIC guidelines. In areas where direct hydrogeological data were limited, surface and near-surface materials were used as supporting indicators to refine the spatial distribution of conductivity classes. This approach is based on the observation that, in parts of the study area, surface sediments may reflect the broader depositional environment (e.g., sandy versus clay-rich settings), which can be associated with subsurface permeability patterns, particularly where the aquifer is shallow or hydraulically connected to overlying deposits. However, soil media were not used as a direct proxy for hydraulic conductivity, but only as a secondary guide where necessary. The final hydraulic conductivity map was generated by assigning DRASTIC rating values (1–10) to the classified conductivity ranges and multiplying the resulting raster layer by the standard weighting factor of three (Table 1).
Detailed geological maps (Figure 2, Figure 5 and Figure 8) of the three locations of the study area have been included to better represent the lithological framework controlling hydrogeological conditions, particularly in relation to the aquifer media (A) and vadose zone impact (I) parameters. In addition, spatial distribution maps for both depth to the groundwater (D) and net recharge (R) have been added (Figure 3, Figure 6 and Figure 9), with particular emphasis on the depth-to-water map given its dominant influence on the vulnerability assessment. These additions enhance the transparency of the parameterization and allow for clearer interpretation of the resulting vulnerability patterns.
Land Use
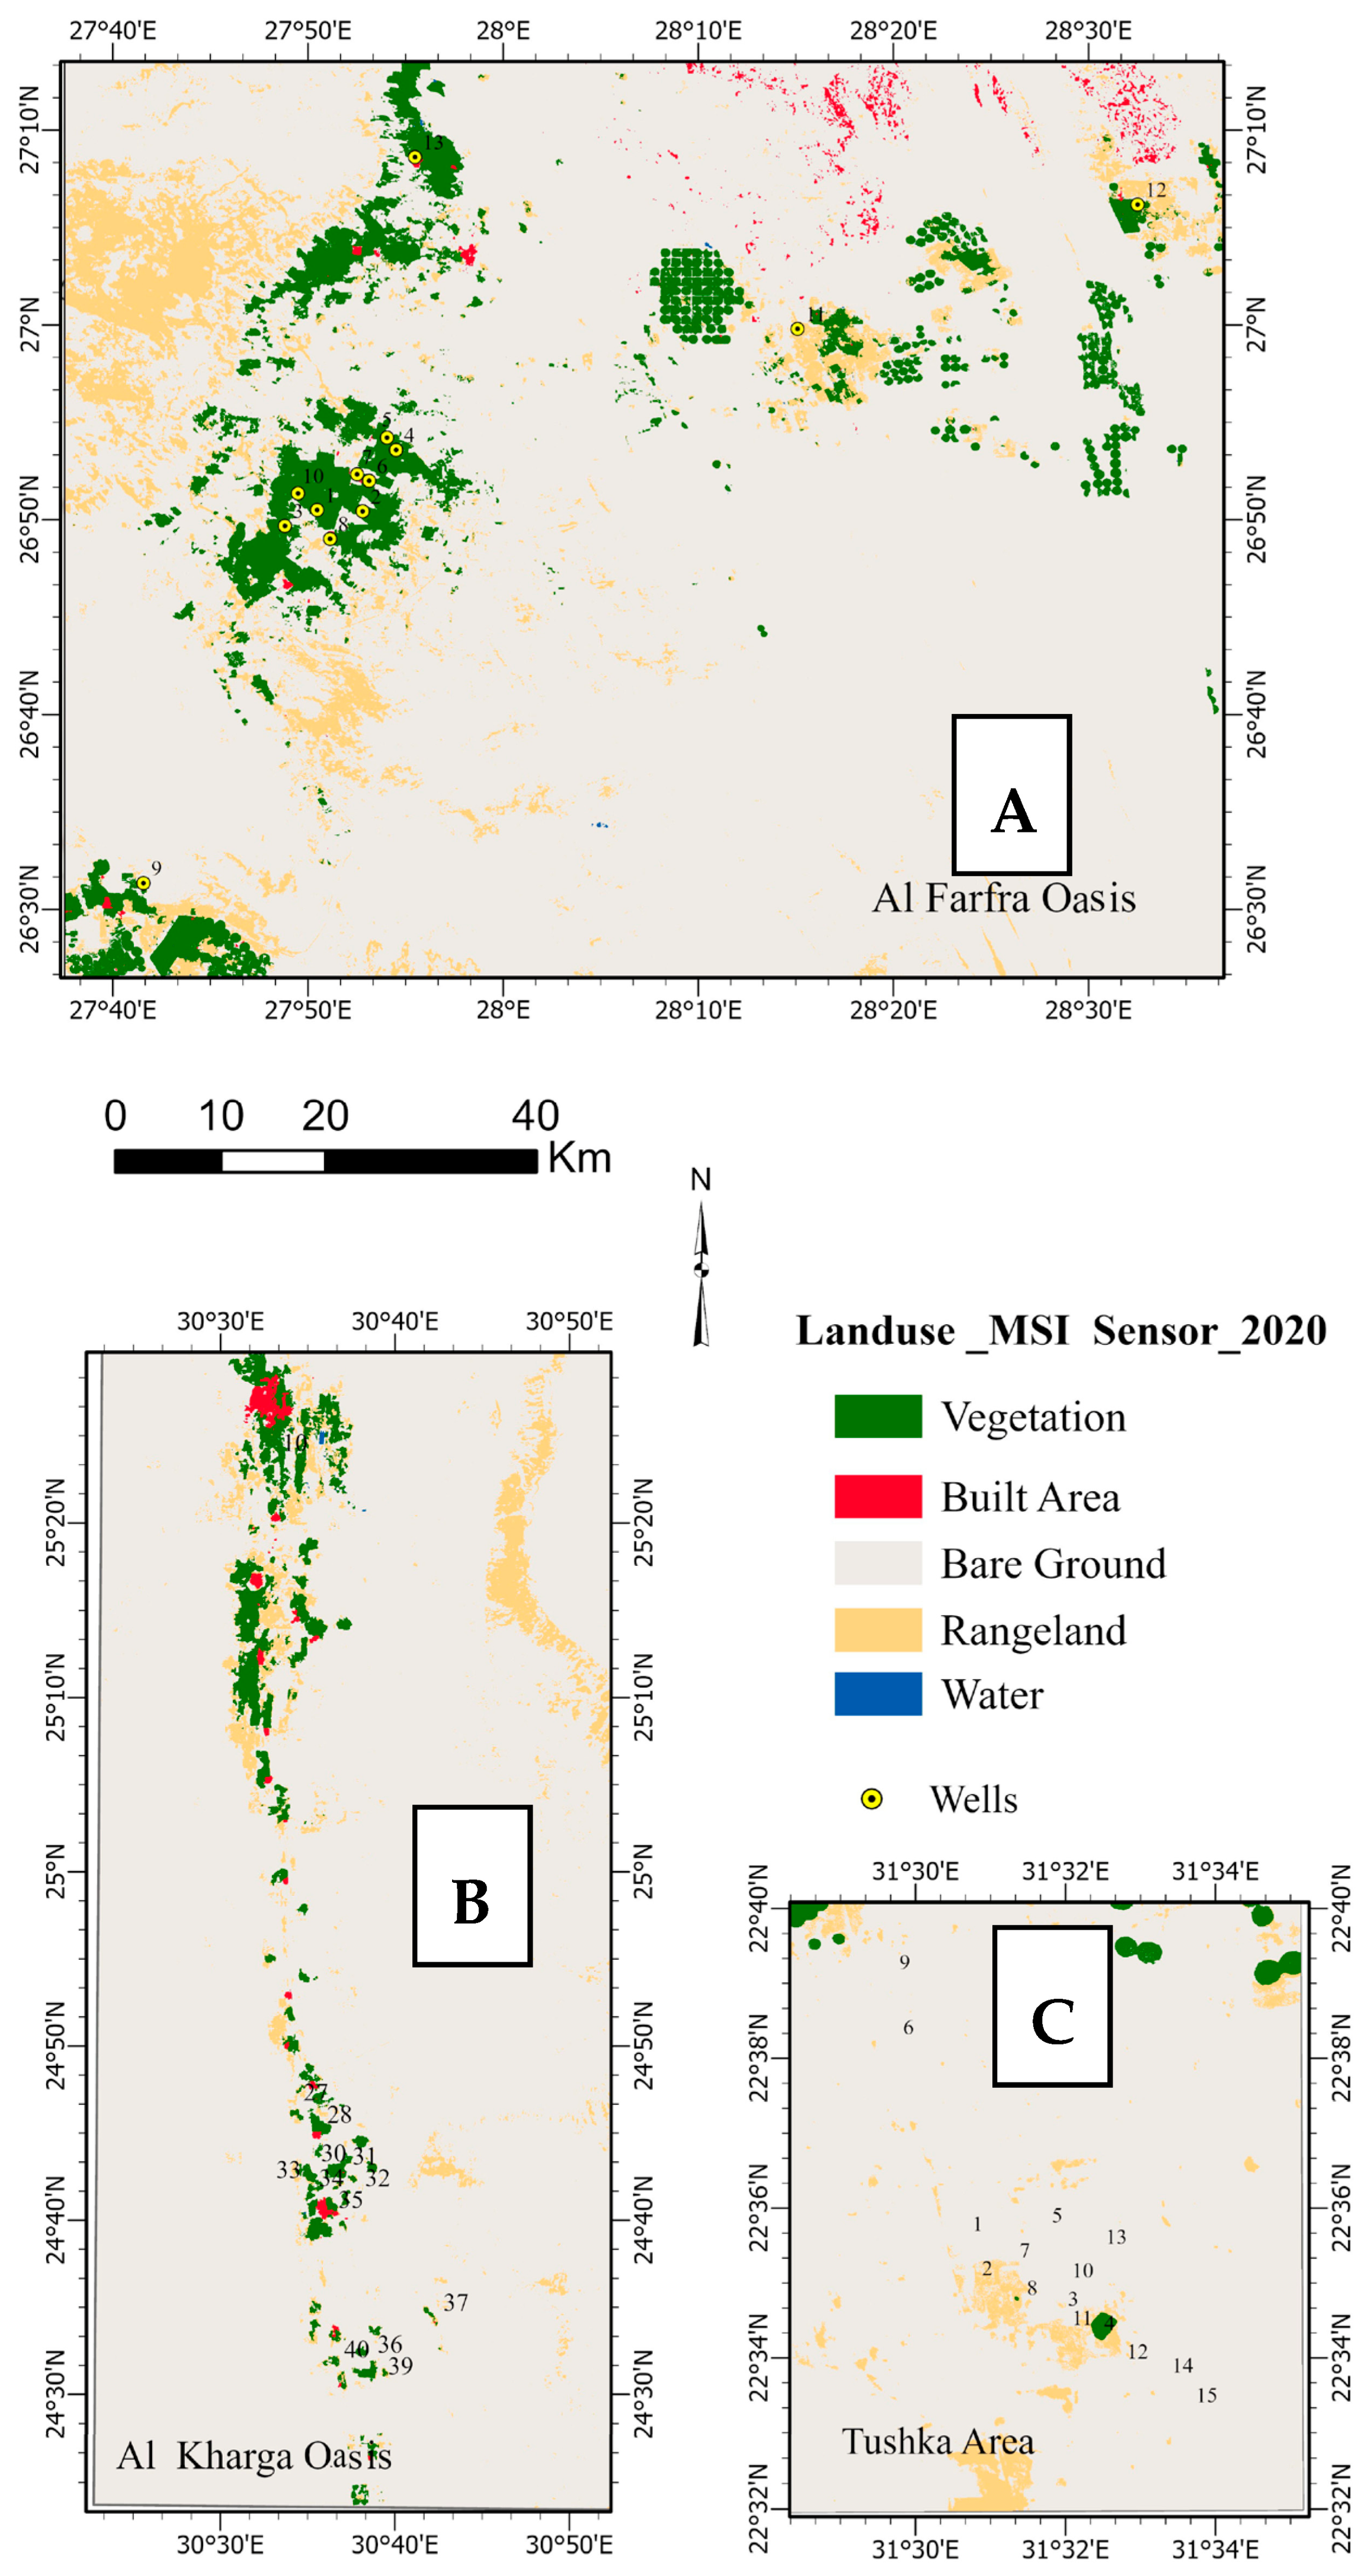
Land use plays a crucial role in determining both the type and intensity of potential groundwater contamination sources [5]. In this study, land-use maps were generated using Sentinel-2 10 m resolution time-series imagery (2017–2023) acquired from the ESRI Image Service [39]. The classification was performed using a supervised maximum-likelihood algorithm, achieving an overall accuracy greater than 85%. Five primary land-use categories were identified: livestock areas; urban and agricultural zones; permanent crops (e.g., palm plantations); water bodies and wetlands; and natural vegetation, including grassland, shrubland, bare land, and forest (Table 1). Bare land is the dominant land cover, occupying nearly 80% of the study area (Figure 14). Higher vulnerability ratings were assigned to agricultural and urban areas due to their potential to introduce contaminants such as fertilizers, pesticides, untreated wastewater, and industrial effluents into the groundwater system [28]. Within the DRASTIC-L framework, the land-use index was computed by multiplying assigned contamination potential ratings (1–10) by a weight factor of five [5]. Recent advances in remote sensing and geospatial analysis have substantially improved the characterization of environmental processes affecting groundwater systems. In particular, satellite-based observations enable detailed assessment of land-use distribution, vegetation dynamics, and surface conditions, all of which influence groundwater recharge behavior and contamination pathways.

2.2.5. Expert Elicitation Procedure

Because hydrogeological observations are sparse across the extensive arid regions of the Western Desert and subsurface conditions vary considerably over short distances, a structured expert elicitation procedure was applied to refine the parameter weighting scheme of the DRASTIC-L model. Expert elicitation is widely used to incorporate informed judgment under uncertainty in hydrogeology, environmental modeling, and groundwater vulnerability assessment [31].
A panel of twenty senior hydrogeologists from universities, governmental water authorities, and national geological survey institutions participated in the study. All experts had at least ten years of experience working with arid-zone aquifer systems such as the Nubian Sandstone Aquifer System (NSAS) and comparable regional sandstone aquifers [4]. Prior to the elicitation process, participants received a comprehensive data package, including geological and hydrogeological maps (1:250,000–1:500,000), lithological well logs, soil classification maps, groundwater-level datasets, digital elevation models (DEMs), recharge estimates, and land-use maps, ensuring consistency with established DRASTIC and DRASTIC-L parameterization approaches [32]. The elicitation followed a modified Delphi method [4]. In Round 1, experts completed a structured questionnaire evaluating the condition and relative importance of the eight DRASTIC-L parameters—Depth to the Water (D), Net Recharge (R), Aquifer Media (A), Soil Media (S), Topography (T), Impact of the Vadose Zone (I), Hydraulic Conductivity (C), and Land Use (L)—across the three study areas: El-Farafra Oasis, El-Kharga Oasis, and the Tushka Depression. For each parameter and location, participants assigned a weight ranging from 1 to 5, reflecting the parameter’s influence on groundwater vulnerability. Experts were also invited to provide qualitative feedback on parameter ratings and hydrogeological conditions; however, these inputs were used only for interpretation and sensitivity evaluation.
Expert panels used in environmental assessments commonly include 10–30 participants, particularly when specialized knowledge is required. In such contexts, the depth and diversity of expertise are more important than panel size alone [14,16]. Panels of approximately twenty experts are widely considered optimal because they provide sufficient diversity of perspectives while maintaining effective participation and consensus-building. Research on group decision-making shows that panels of 20–30 experts can produce stable and reproducible conclusions even for complex technical assessments, supporting the use of a twenty-member panel in this study [23]. The questionnaire also collected professional background information and included open-ended questions asking experts to identify dominant vulnerability controls, evaluate the suitability of standard DRASTIC weights for hyper-arid environments, and provide methodological recommendations. Participants supported their responses with references to local hydrogeological characteristics, soil permeability, land-use intensity, and recharge limitations known to strongly influence groundwater vulnerability in desert aquifers [40].
After Round 1, participants received anonymized summaries of group responses, including medians, means, and interquartile ranges. In Round 2, experts reviewed these aggregated results and were invited to revise their weight assignments based on group trends, an iterative process known to reduce individual bias and strengthen consensus [41]. Final parameter weights were aggregated using equal-weight linear pooling, a standard expert-aggregation technique [40]. It is important to emphasize that, although expert feedback was collected on both parameter weights and ratings, only the expert-derived weights were incorporated into the final DRASTIC-L model, while the standard DRASTIC rating scheme was retained. This approach ensures methodological consistency and preserves comparability with previous DRASTIC-based studies.
To further evaluate the robustness of the expert-informed weighting scheme, a global sensitivity analysis using the Sobol variance decomposition approach was conducted to quantify each parameter’s contribution to the variability in the DRASTIC-L vulnerability index [23]. Parameters with low sensitivity were identified for possible adjustment or future review. This hybrid calibration approach, combining expert judgment with sensitivity analysis, enhances the robustness of the DRASTIC-L framework and aligns with recent methodological developments in semi-arid groundwater vulnerability modeling, including hybrid DRASTIC-Lu, DRASTIC-AHP, and multi-criteria evaluation systems [5].
GIS-Based Implementation Workflow
All datasets were processed using a standardized GIS workflow consistent with regional groundwater vulnerability assessments [4]. Relevant spatial and hydrogeological datasets [42] were compiled, including a digital elevation model (DEM), geological and hydrogeological maps, pumping-test results, well logs, soil data, land-use and land-cover maps, and climatic datasets. All spatial layers were converted into raster format with a uniform spatial resolution of 30 m [43]. Each parameter layer was reclassified according to the DRASTIC rating scale (1–10) and integrated using the standard DRASTIC weighting scheme (Table 1). Weighted-sum overlay analyses were then applied to compute both the DRASTIC index (DI) and the land-use-modified index (DI-L). Model outputs were subsequently verified for hydrogeological consistency by examining lithologic boundaries, depth-to-water patterns, and available water-quality indicators, including total dissolved solids and nitrate concentrations [22].

2.3. Model Computation, Vulnerability Mapping, and Sensitivity Analysis

The DRASTIC index (DI) and the land-use-integrated DRASTIC index (DI-L) were calculated after standardizing all raster layers representing the DRASTIC parameters (D, R, A, S, T, I, C) and the land-use parameter (L) to a uniform 30 m resolution. These layers were integrated using a weighted-sum overlay method. Groundwater vulnerability classes were then delineated using the Jenks natural breaks classification, commonly applied in regional vulnerability assessments. The resulting vulnerability maps were validated by comparing spatial patterns with depth-to-water distribution, lithological boundaries, and observed water-quality indicators, including total dissolved solids and nitrate concentrations. To identify the dominant controls on groundwater vulnerability, a Sobol global sensitivity analysis was conducted to quantify the contribution of each parameter to the variance of the vulnerability index. The results highlighted the major influence of depth to water, net recharge, and hydraulic conductivity [6]. This dual-index framework integrates hydrogeological conditions and anthropogenic land-use pressures, providing a management-oriented approach for groundwater risk assessment in arid regions and rapidly developing desert environments.

2.3.1. Sobol Global Sensitivity Analysis

A variance-based Sobol global sensitivity analysis was conducted to quantify the influence of DRASTIC parameters and the land-use weighting factor on groundwater vulnerability in southern Egypt. This approach decomposes output variance to evaluate both individual parameter effects and higher-order interactions, making it suitable for nonlinear hydrogeological systems [44]. Two indices were considered: the first-order index (Si), which measures the direct contribution of each parameter to output variance, and the total-order index (STi), which captures the overall influence, including interactions [42].
The analysis was applied to the integrated GIS-based DRASTIC–land-use–expert elicitation framework. Model inputs included the seven standard DRASTIC parameters—Depth-to-water table (D), Net recharge (R), Aquifer media (A), Soil media (S), Topography (T), Impact of the vadose zone (I), and Hydraulic conductivity (C)—together with the expert-weighted land-use factor. Input uncertainty ranges were defined using field data, regional hydrogeological information, and expert-derived probability distributions.
Sampling was performed using the Saltelli sampling scheme to ensure efficient exploration of the parameter space. The total number of simulations followed N × (2k + 2), where k is the number of input parameters [42]. Sensitivity indices were computed using variance decomposition following Sobol and Saltelli, and parameters with higher STi values were interpreted as exerting greater control on vulnerability patterns.
The implementation involved: (i) defining probability distributions (uniform, triangular, or normal) for each parameter; (ii) selecting an adequate sample size based on convergence testing; (iii) computing both Si and STi indices; and (iv) assessing convergence by progressively increasing the sample size until index stability was achieved. Sensitivity results are reported with 95% confidence intervals derived from bootstrapping. The analysis was further used to evaluate expert-derived weights, identify dominant hydrogeological controls, and support interpretation of spatial vulnerability patterns.

2.3.2. Vulnerability Assessment Using Salinity and Statistical Validation

The reliability of the groundwater vulnerability models (DRASTIC and the integrated DRASTIC-L) was evaluated using groundwater salinity as an independent validation parameter. We have expanded the description of the electrical conductivity (EC) dataset used for model validation and included thematic EC maps with classified values (Figure 4, Figure 7 and Figure 10). These provide a clearer representation of the spatial variability and range of groundwater salinity across the study area, strengthening the validation framework and facilitating comparison with the vulnerability indices. Salinity is widely applied in groundwater vulnerability studies, particularly in arid and semi-arid regions where direct contaminant monitoring data are often limited. As an integrated hydrochemical indicator, salinity reflects the cumulative influence of multiple processes affecting groundwater quality, including irrigation return flow, upward leakage from deeper formations, groundwater abstraction, and evaporative concentration. In arid aquifers, these processes often lead to clear spatial gradients in salinity, which can help identify zones experiencing greater hydrogeological stress. Previous studies conducted in Egypt and other arid environments have reported a consistent relationship between vulnerability and groundwater salinity, where areas classified as highly vulnerable frequently correspond to elevated total dissolved solids (TDS) concentrations [14]. This pattern suggests that vulnerable zones typically have a limited capacity to attenuate contaminants, allowing dissolved salts to accumulate more rapidly.
Due to the limited availability of continuous field measurements, salinity data used for validation were compiled from previously published hydrogeological datasets covering the three study regions. These datasets were obtained primarily from groundwater monitoring bulletins issued by the Ministry of Water Resources and Irrigation (MWRI). The collected records provided representative salinity values across the study areas and allowed comparison with the spatial distribution of the vulnerability indices.
To quantify the relationship between groundwater salinity and the vulnerability indices, several statistical approaches were applied. First, the Pearson correlation coefficient (r) was calculated to evaluate the linear relationship between the DRASTIC and DRASTIC-L index values and measured groundwater salinity, expressed as electrical conductivity (EC). Second, the coefficient of determination (R2) was used to assess the proportion of salinity variability explained by the vulnerability models. Finally, a one-way analysis of variance (ANOVA) was performed to test whether mean salinity values differed significantly among the three vulnerability classes (low, moderate, and high). The statistical validation was conducted using data from 13 well sites in each study region, corresponding to the spatial distribution of the vulnerability assessment.

3. Results and Discussion

Thematic layers for the DRASTIC model and the integrated land-use DRASTIC (DRASTIC-L) model were created for El-Farafra Oasis, El-Kharga Oasis, and the Tushka Depression after rigorous data preparation and GIS-based spatial analysis. The resulting groundwater vulnerability indices reflect the combined effects of hydrogeological conditions, land-use practices, and expert-informed parameter weighting in these hyper-arid environments. This section presents and discusses the findings by looking at the impact of expert elicitation on parameter significance, the resulting vulnerability classes and their spatial distribution, the contrasting regional vulnerability patterns, and the implications for sustainable groundwater management in fossil aquifer systems. The resulting vulnerability indices were categorized into low, moderate, and high classes using the Jenks natural breaks classification method.

3.1. Influence of Expert Elicitation on DRASTIC Parameter Weights

The comparison between standard DRASTIC parameter weights adopted from previous studies and the average relative weights derived from the expert elicitation procedure is presented in Table 2. The expert-derived weighting scheme shows notable deviations from the classical DRASTIC framework, highlighting the limitations of applying globally generalized weights to regionally specific hyper-arid groundwater systems. These findings are consistent with those reported by Baker et al. [13]. To quantify the influence of each parameter on the overall vulnerability assessment, a Sobol global sensitivity analysis was conducted. The results indicate that depth-to-water table, net recharge, and hydraulic conductivity are the dominant contributors to total variance, consistent with previous studies of arid and semi-arid aquifers. The Sobol analysis shows that parameters Xa and Xb account for most of the output variance, with first-order indices Sa = 0.41 [0.35, 0.47] and Sb = 0.23 [0.18, 0.28]. Based on total-order indices, Xa has the greatest overall influence (STa = 0.52 [0.46, 0.58]), followed by Xb (STb = 0.37 [0.31, 0.43]) and Xc (STc = 0.21 [0.16, 0.26]). These values indicate moderate interaction effects, particularly for Xb, which shows MIRb = 0.38. Among pairwise interactions, the combination (Xa, Xb) is the most significant, with Sab = 0.11 [0.07, 0.15]. The effective model dimension remains relatively low (DT(0.95) = 3, DS(0.95) = 2), suggesting that only a limited number of parameters dominate the variability of the vulnerability index. Bootstrap confidence intervals are narrow (median RHW for Si = 0.12), and the sensitivity indices remain stable even after doubling the base sample size (median ΔSi = 0.01, ΔSTi = 0.015). The sum of first-order effects (∑iSi = 0.74) indicates the presence of parameter interactions (I = ∑iSTi − 1 = 0.29). In addition, a top-k screening identified two parameters with negligible influence (ST < 0.01) [44]. Depth-to-water table (D) consistently received the highest relative weight across all study areas (4.55–4.80), indicating its dominant influence on contaminant travel time, dilution capacity, and attenuation processes. In arid environments, where the vadose zone is often thick but weakly reactive, shallow or intermediate groundwater levels significantly increase vulnerability by shortening the filtration pathway. Hydraulic conductivity (C) and aquifer media (A) also obtained relatively high weights, particularly in El-Kharga Oasis and the Tushka Depression, highlighting the importance of aquifer transmissivity and lithological continuity within the Nubian Sandstone Aquifer System (NSAS). Highly permeable sandstone formations facilitate rapid advective transport, allowing contaminants to spread quickly once they reach the saturated zone.
The strong influence of the depth-to-water table identified here is consistent with recent studies indicating that this parameter is often the most influential factor in desert aquifers undergoing intensive groundwater abstraction [3]. Similarly, the importance of hydraulic conductivity aligns with vulnerability assessments of large sandstone aquifers in North Africa, the Arabian Peninsula, and Central Asia, where this parameter has been shown to strongly control groundwater vulnerability [45]. The reduced importance assigned to net recharge reflects increasing criticism of the traditional DRASTIC framework, particularly arguments that its original recharge weighting is not appropriate for arid and semi-arid regions [28]. Furthermore, the role attributed to land use agrees with recent hybrid vulnerability approaches combining DRASTIC with AHP and expert judgment, which also highlight land-use patterns as key modifiers of groundwater vulnerability [3].
Expert elicitation indicates that, although recharge has a relatively minor influence at the regional scale because of its limited spatial extent, localized recharge occurring in topographic depressions, irrigated areas, and seepage zones can exert a disproportionate influence on groundwater flow and contaminant transport pathways.

3.2. Groundwater Vulnerability Classification and Spatial Trends

The vulnerability indices produced by both the DRASTIC and the integrated DRASTIC L models were grouped into three classes using the Jenks natural breaks classification available in ArcGIS (Table 3). Keep in mind, the vulnerability classes from the DRASTIC and DRASTIC-L models are not absolute but they are relative to each model. Adding the land-use parameter widens the index range, so it does not make sense to compare absolute thresholds directly. The real value comes from looking at how spatial patterns and vulnerability zones shift when you include different parameters. The classes were low (from 107 to 139), moderate (from 140 to 169), and high (from 170 to 200).
Across the three study areas, the DRASTIC-L model consistently generated higher groundwater vulnerability indices and delineated a broader spatial extent of moderate- to high-vulnerability zones compared to the DRASTIC model. High-risk areas are mainly associated with shallow groundwater, high permeability, and intensive agricultural or urban land use. Although abstraction does not directly increase vulnerability, it may enhance local contamination risk through induced flow and reduced dilution under anthropogenic conditions. These results coincide with those of previous studies [7,8]. In contrast, low-vulnerability zones are mainly associated with deeper water tables, lower hydraulic conductivity, limited anthropogenic pressures, and, in some locations, the presence of supplementary recharge mechanisms.
The enhanced vulnerability identified by the DRASTIC-L model underscores the critical role of land-use dynamics in modulating groundwater contamination risk in arid environments. The systematic expansion of moderate- and high-vulnerability zones suggests that anthropogenic pressures, particularly intensive groundwater abstraction, irrigated agriculture, and urban development, can alter natural protection mechanisms by increasing downward contaminant fluxes and reducing unsaturated zone residence times. This indicates that vulnerability models, which primarily emphasize hydrogeological parameters, may fail to capture key human-driven pathways of contaminant transport, leading to a systematic underestimation of risk in rapidly transforming landscapes [19]. Moreover, the strong spatial correspondence between high vulnerability and areas of shallow groundwater and high permeability reflects the compounded effect of natural susceptibility and land-use stressors. In arid aquifer systems, where diffuse natural recharge is limited, anthropogenic recharge associated with irrigation return flows, leakage from water infrastructure, and concentrated abstraction-induced gradients becomes a dominant driver of contaminant migration. The consistency of these patterns across all study areas reinforces the conceptual understanding that groundwater vulnerability in arid regions is governed less by climatic recharge than by localized human activities that bypass or weaken natural attenuation processes [1]. Collectively, these findings emphasize the necessity of integrating land-use factors into vulnerability assessments to support more realistic risk evaluation and to inform land-use planning and groundwater protection strategies in water-scarce regions.

3.3. El-Farafra Oasis: Extreme Vulnerability in a Fossil Aquifer System

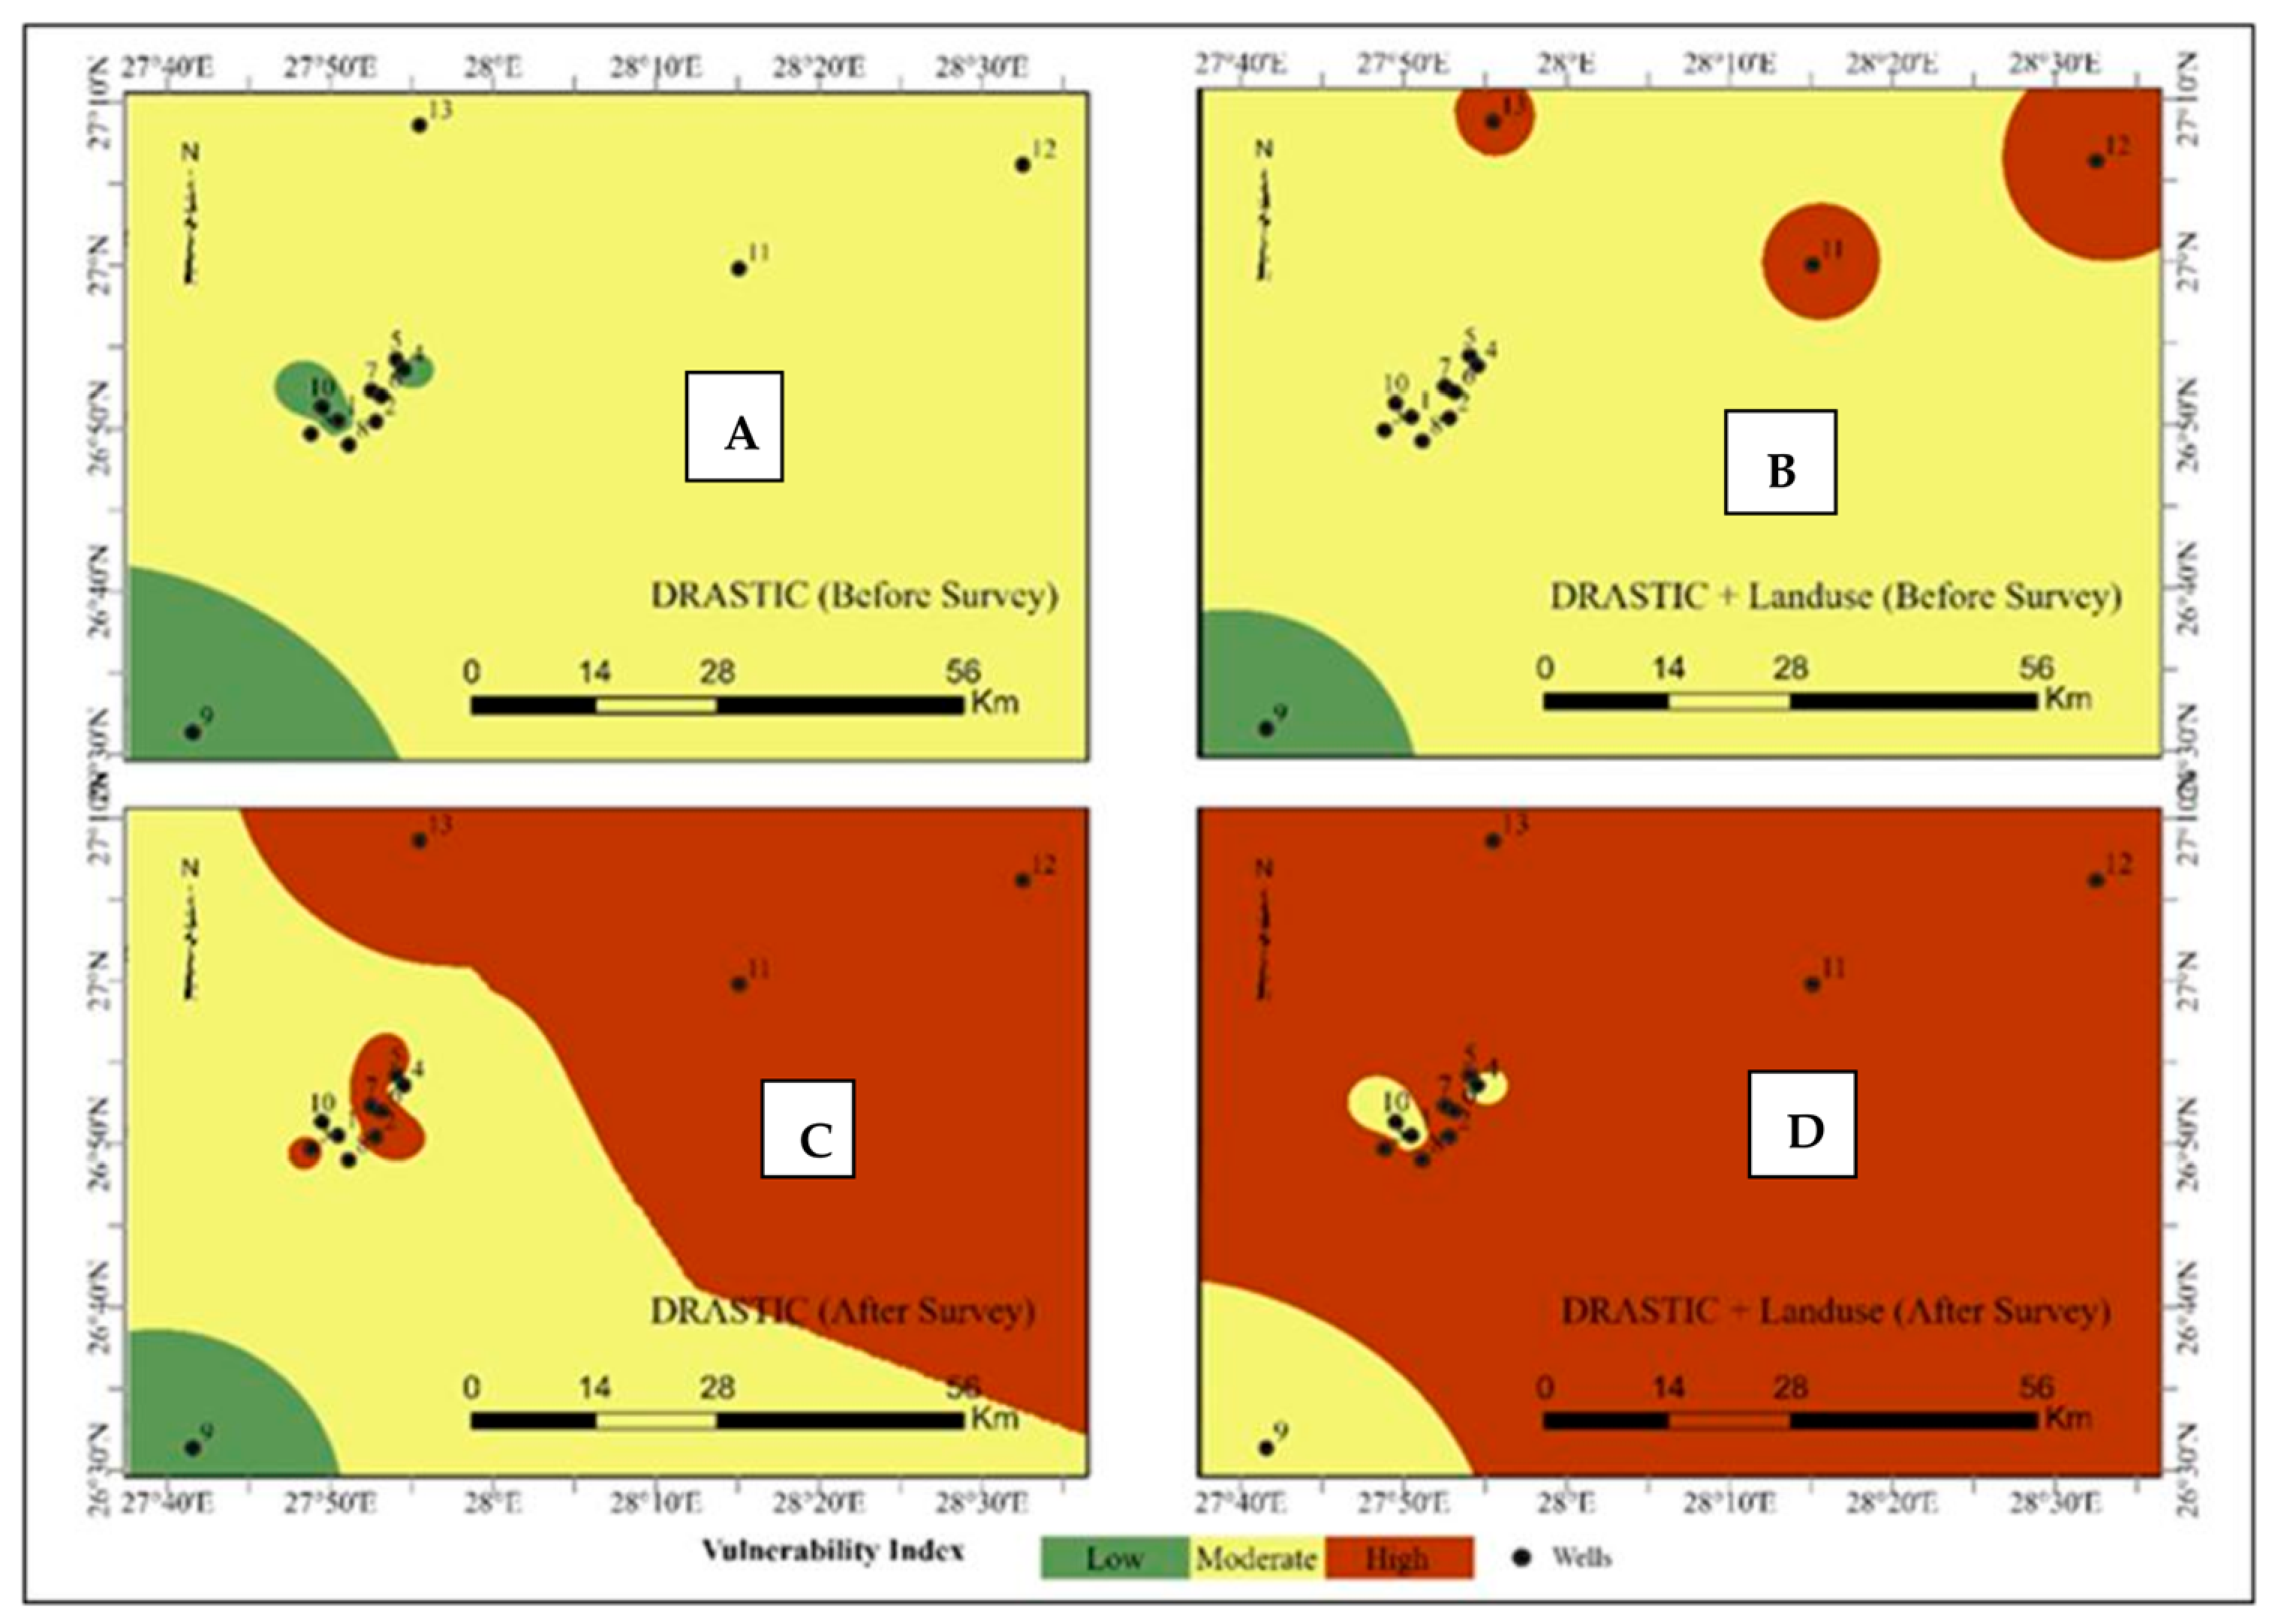
El-Farafra Oasis exhibits the highest groundwater vulnerability among the three investigated areas. Several wells that were classified as having low to moderate vulnerability under the DRASTIC model were reclassified into the high-vulnerability class after the incorporation of expert-derived weights and land-use factors (Table 4 and Figure 15). The spatial distribution of high-vulnerability zones closely corresponds to areas characterized by intensive groundwater abstraction, which modifies hydraulic gradients and may enhance contaminant migration in regions affected by agricultural activities and highly permeable Nubian Sandstone aquifer materials as well as shallow to intermediate groundwater depths under conditions of negligible natural recharge. Recent hydrogeological studies report groundwater-level drawdowns exceeding 30 m in parts of El-Farafra Oasis, resulting in steep hydraulic gradients and an increased potential for vertical leakage from the land surface [5]. These drawdowns reinforce the vulnerability patterns identified by the DRASTIC-L model by reducing the effective thickness of the unsaturated zone and shortening contaminant travel times. In addition to enhancing susceptibility to surface-derived contamination, prolonged drawdown conditions may promote the mobilization of deeper, more saline groundwater, thereby intensifying groundwater quality deterioration.
The DRASTIC-L results further highlight the dominant influence of agricultural land use on groundwater vulnerability in El-Farafra Oasis. Intensive fertilizer and pesticide applications, coupled with irrigation return flows, represent major non-point pollution sources that spatially coincide with high-vulnerability zones. Similar increases in mapped vulnerability following land-use integration have been documented in reclaimed desert environments across Algeria, Tunisia, Saudi Arabia, and Iran, suggesting that the observed response reflects a broader regional behavior of arid agricultural aquifer systems [31]. The vulnerability pattern in El-Farafra Oasis illustrates the compounded effect of intensive abstraction, permeable aquifer media, and anthropogenic land use on groundwater systems within fossil aquifers. Given the largely non-renewable nature of the Nubian Sandstone Aquifer System, continued exploitation under current practices, in the absence of effective regulation and groundwater protection measures, poses a substantial risk of long-term and potentially irreversible degradation of groundwater quantity and quality.

3.4. El-Kharga Oasis: Transitional Vulnerability Under Urban–Agricultural Pressure

El-Kharga Oasis is predominantly characterized by moderate groundwater vulnerability, with distinct spatial variability related to hydrostratigraphic conditions and land-use patterns (Table 5; Figure 16). In comparison with El-Farafra Oasis, El-Kharga benefits from thicker aquifer sequences and locally deeper groundwater levels, which provide a partial degree of natural protection and contribute to the dominance of moderate rather than high-vulnerability classes. The integrated DRASTIC-L model indicates a clear upward shift in groundwater vulnerability in areas affected by urban expansion, industrial activities, and irrigated agriculture. Almost all wells shifted from low vulnerability to moderate vulnerability, as shown in Table 5. Several zones that were classified as having low vulnerability under the DRASTIC model transition to moderate vulnerability following the incorporation of expert-derived weights and land-use factors, reflecting increasing anthropogenic pressure on the aquifer system. In contrast, wells located in zones 9 and 10 remain within the low-vulnerability class, likely due to deeper groundwater tables, reduced hydraulic connectivity, or more favorable local hydrogeological conditions.
Groundwater monitoring data show ongoing declines in groundwater levels in El-Kharga Oasis, although at rates lower than those observed in El-Farafra. This evolving hydrogeological condition supports the moderate vulnerability classification identified by the DRASTIC L model and indicates that El-Kharga Oasis currently represents a transitional state. Such conditions constitute a critical management opportunity, during which proactive measures such as regulating groundwater abstraction, improving irrigation efficiency, enhancing wastewater management, and implementing land-use zoning can effectively prevent further progression toward high vulnerability. Similar transitional vulnerability conditions have been documented in arid urban oases elsewhere, where early intervention proved substantially more effective than remediation following advanced groundwater degradation [29].

3.5. Tushka Depression: Recharge-Buffered Low Vulnerability with Localized Risks

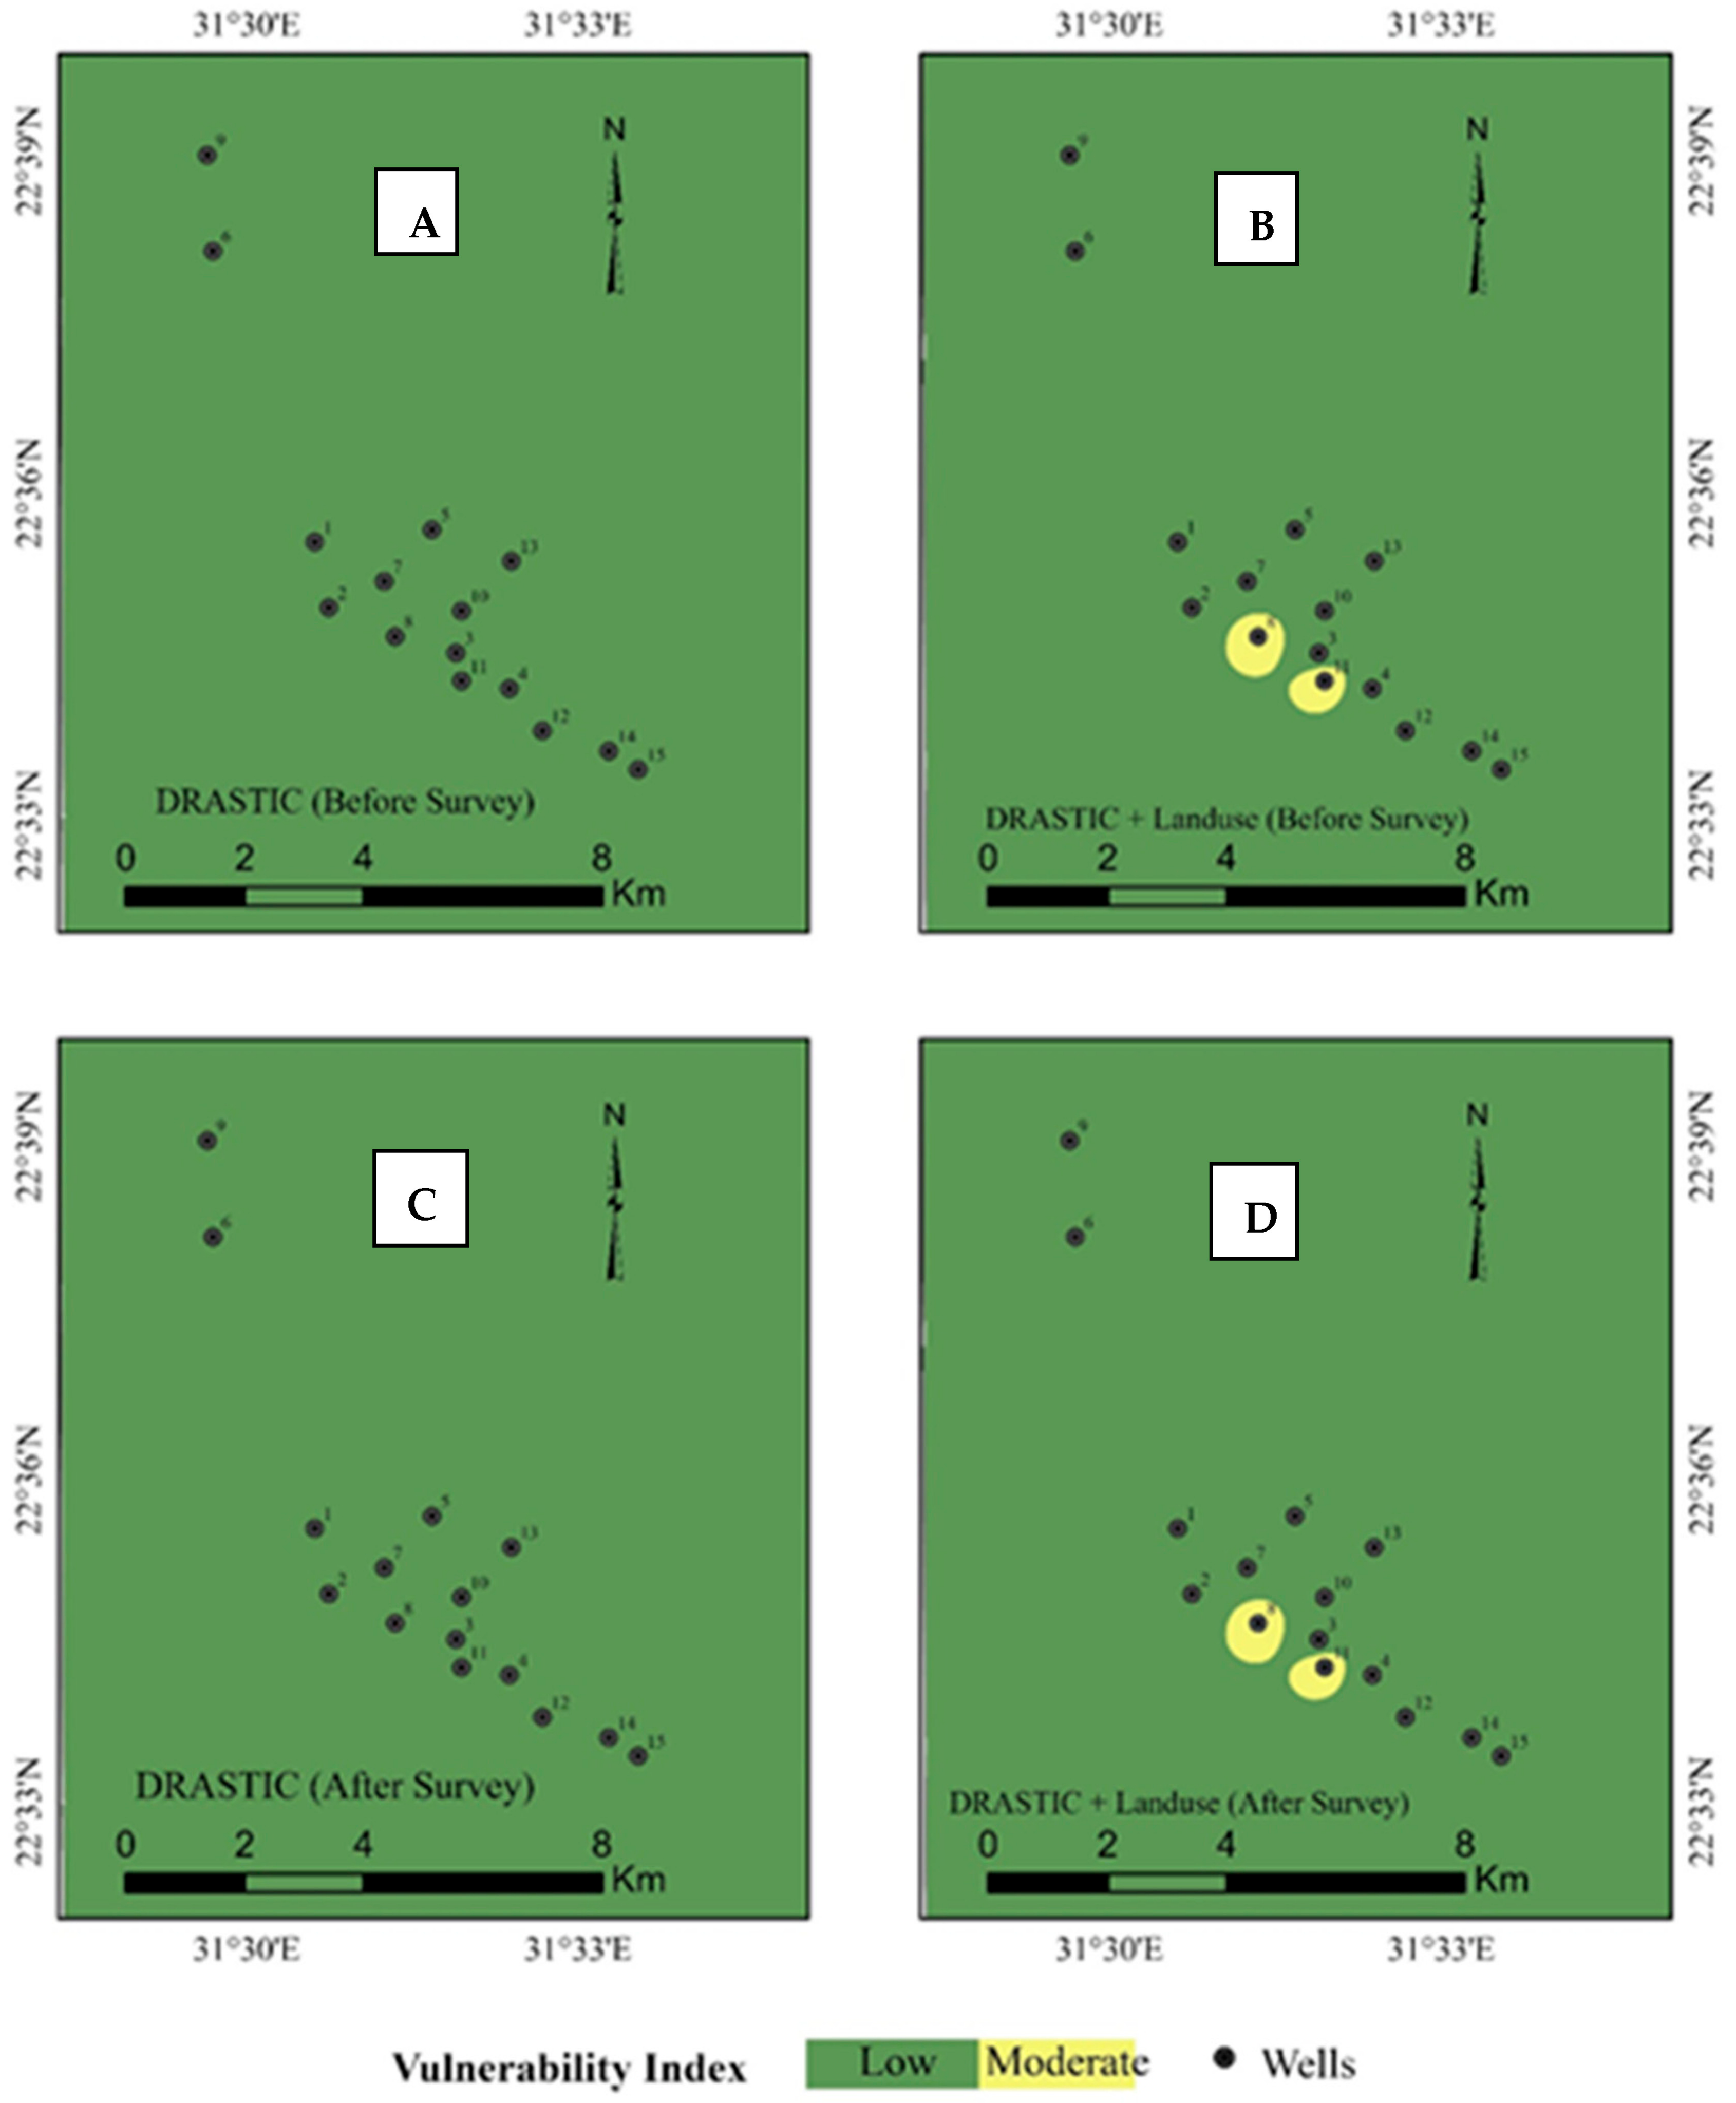
The Tushka Depression exhibits the lowest overall groundwater vulnerability among the investigated areas. The majority of wells remain within the low-vulnerability class both before and after the application of expert elicitation in the DRASTIC L model (Table 6), as shown in the spatial distribution of vulnerability (Figure 17). This stability indicates limited sensitivity of the aquifer system to land-use integration at the regional scale.
The favorable vulnerability conditions in the Tushka Depression are primarily associated with the presence of supplementary modern recharge from Lake Nasser. Recharge mechanisms include lake seepage, spillway flooding during years of high Nile flows, canal leakage, and irrigation return flows. These processes contribute to buffering groundwater level declines, reducing groundwater residence times, and promoting partial dilution of potential contaminants, thereby lowering overall groundwater vulnerability relative to the other study areas [22]. Despite these generally protective conditions, localized increases to moderate groundwater vulnerability are identified at wells 8 and 11 in the DRASTIC L model. These increases spatially coincide with areas experiencing expanding agricultural development and settlement activities, indicating that even recharge-supported aquifer systems remain sensitive to land-use intensification. Irrigation-dominated recharge may shift from a protective mechanism to a risk-enhancing factor when associated with intensive agrochemical application and inadequate drainage management, underscoring the importance of controlled land-use practices to maintain groundwater quality [22].
Groundwater vulnerability across the study areas follows a clear gradient, with El-Farafra Oasis showing the highest vulnerability due to intensive abstraction and agricultural land use that enhance contaminant sources and modify flow conditions. El-Kharga Oasis exhibits moderate vulnerability influenced by urbanization and irrigation activities, while the Tushka Depression shows lower vulnerability, where supplementary recharge from Lake Nasser promotes dilution and reduces contaminant persistence. Localized increases in vulnerability highlight the sensitivity of even partially protected aquifers to land-use intensification, underscoring the need for proactive management measures. These include regulating groundwater abstraction, improving irrigation efficiency, enhancing wastewater management, and enforcing land-use planning to safeguard groundwater resources in arid regions.
In contrast, the net recharge parameter (R) received relatively low weights in El-Farafra and El-Kharga, consistent with reported recharge rates of only 1.2–1.5 mm yr−1 [18,20], whereas higher values are observed in Tushka (25–30 mm yr−1) [25]. These patterns reflect the limited role of modern recharge under hyper-arid climatic conditions. Expert evaluation indicated that, in fossil aquifer systems, recharge exerts a secondary influence compared to abstraction-driven flow dynamics. Similarly, the land-use parameter (L), although typically assigned a high weight in standard DRASTIC-L applications, was moderated by experts (1.95–2.30), suggesting that land use primarily acts as a triggering factor rather than a direct hydrogeological control. Nevertheless, it remains an important amplifier of vulnerability where unfavorable hydrogeological conditions are already present.

3.6. Statistical Validation of the Vulnerability Assessment

The reliability of the DRASTIC and integrated DRASTIC-L groundwater vulnerability models was evaluated using groundwater quality indicators, primarily salinity expressed as total dissolved solids (TDS). Salinity is widely recognized as a robust proxy for long-term aquifer stress and vulnerability, particularly in arid sandstone aquifers. Because vulnerability assessments are not linked to specific contaminants, salinity can serve as a conservative indicator of groundwater degradation. It reflects the cumulative effects of hydrogeological and anthropogenic processes, including groundwater abstraction, irrigation return flow, and evaporation-driven concentration. The rationale for using salinity as an evaluation indicator was discussed earlier in Section 2.

3.6.1. Validation Results

The statistical validation results indicate a positive relationship between groundwater salinity and the vulnerability indices derived from both the DRASTIC and DRASTIC-L models. The Pearson correlation analysis shows relatively strong correlations in El-Farafra, where r = 0.74 for the DRASTIC model and r = 0.83 for the DRASTIC-L model, followed by El-Kharga, with r = 0.62 (DRASTIC) and r = 0.71 (DRASTIC-L). In contrast, the Tushka region exhibits weaker correlations, with r = 0.38 for DRASTIC and r = 0.52 for DRASTIC-L. Across all study areas, the integrated DRASTIC-L model consistently demonstrates stronger correlations with groundwater salinity than the conventional DRASTIC model, indicating that the inclusion of land-use information enhances the model’s ability to represent observed groundwater conditions.
Spearman rank correlation was used alongside Pearson correlation to evaluate both monotonic and linear relationships between groundwater salinity and vulnerability indices, addressing potential non-linear hydrogeochemical behavior in arid environments. The results show consistent improvement in correlation values for the DRASTIC-L model across all study areas (Table 7), confirming the added explanatory value of land-use integration. In El-Farafra Oasis, the strongest relationships are observed (r = 0.83, ρ = 0.79 for DRASTIC-L), indicating a clear monotonic increase in salinity with higher vulnerability, driven by intensive abstraction and irrigation return flows. El-Kharga shows moderate but consistent associations (r = 0.71, ρ = 0.66), reflecting greater hydrogeological heterogeneity and mixed land-use influence. In contrast, Tushka exhibits weaker correlations (r = 0.52, ρ = 0.48), consistent with the buffering effect of Lake Nasser recharge, which partially decouples salinity from vulnerability patterns. Overall, the combined statistical evidence confirms that the integrated DRASTIC-L framework better captures spatial variations in groundwater quality, although its sensitivity varies with the hydrogeological setting. Additionally, the one-way ANOVA analysis reveals statistically significant differences (p < 0.05) in mean salinity among the three vulnerability classes (low, moderate, and high) in both El-Farafra and El-Kharga, confirming the consistency between the vulnerability classification and groundwater quality patterns. In contrast, the Tushka region exhibits only marginal statistical significance, which is consistent with its relatively uniform hydrogeological conditions.

3.6.2. Validation Findings

The statistical validation reveals several important findings. The integrated DRASTIC-L model demonstrates stronger agreement with observed groundwater quality than the conventional DRASTIC model, confirming the value of incorporating land-use information into vulnerability assessments. Areas classified as highly vulnerable generally correspond to zones with elevated groundwater salinity, indicating that the model effectively captures both natural hydrogeological susceptibility and anthropogenic influences.
The influence of land use is particularly evident in El-Farafra and El-Kharga, where agricultural expansion and urban development spatially coincide with salinization hotspots. In contrast, the relatively weaker correlation observed in Tushka is likely associated with recharge from Lake Nasser, which dilutes groundwater salinity regardless of surface land-use conditions. The statistical validation provides independent quantitative evidence supporting the reliability of the integrated DRASTIC-L model combined with expert-weighted parameters for groundwater vulnerability assessment in southern Egypt. These results further indicate that incorporating land-use factors significantly enhances the predictive capability of vulnerability models in arid aquifer systems, thereby supporting the use of the resulting vulnerability maps as decision-support tools for groundwater protection and sustainable resource management.

3.7. Limitations and Uncertainty

Despite the structured implementation of the DRASTIC and DRASTIC-L models, several sources of uncertainty remain. Data availability is a primary constraint, as key parameters such as hydraulic conductivity and vadose-zone characteristics are partly derived from interpolation or lithological proxies rather than direct field measurements. Recharge estimation introduces additional uncertainty in hyper-arid environments, where rainfall is highly episodic and poorly represented by long-term averages. Furthermore, the static formulation of the DRASTIC framework does not account for temporal variability, including seasonal groundwater fluctuations, pumping dynamics, or evolving land-use conditions. Rapid agricultural expansion and infrastructure development may therefore modify contamination pathways beyond those captured by the model. Uncertainty also arises from the subjective nature of parameter rating and weighting, although the application of sensitivity analysis helps to constrain this effect. Consequently, the DRASTIC (DI) and DRASTIC-L (DI-L) outputs should be interpreted as baseline, regional-scale indicators of groundwater vulnerability intended to support planning rather than precise prediction. In line with recent recommendations for desert aquifer systems, these assessments should be periodically updated using improved hydrogeological data, groundwater quality monitoring, and revised land-use strategies.

3.8. Broader Methodological and Management Implications

The results of this study demonstrate that integrating land-use information and expert elicitation significantly enhances the reliability and applicability of groundwater vulnerability assessments in arid environments. The DRASTIC-L model captures spatial patterns of contamination risk that are often underestimated by conventional DRASTIC approaches, while expert-informed weighting improves the regional relevance and interpretability of the resulting vulnerability indices. The methodological framework applied in this study therefore provides a transferable approach that can be adapted to other fossil aquifer systems experiencing rapid land-use change, particularly in arid and semi-arid regions where hydrogeological data are frequently limited. By combining hydrogeological parameters with land-use factors and expert knowledge, the proposed approach improves the capacity of vulnerability models to represent both natural susceptibility and anthropogenic pressures.
From a groundwater management perspective, the findings highlight the need for differentiated strategies across the study areas. El-Farafra Oasis requires immediate regulatory intervention due to its relatively high vulnerability, whereas El-Kharga Oasis would benefit from proactive land-use planning supported by continuous groundwater monitoring to prevent further deterioration of aquifer conditions. In contrast, the Tushka Depression, which currently exhibits lower vulnerability levels, should be managed through preventive measures aimed at maintaining its favorable hydrogeological status. Integrating groundwater vulnerability maps into land-use planning and groundwater governance frameworks is therefore essential to support sustainable groundwater management and ensure the long-term protection of groundwater resources in southern Egypt.

4. Conclusions

This study presents a comprehensive groundwater vulnerability assessment of El-Farafra Oasis, El-Kharga Oasis, and the Tushka Depression in southern Egypt using a GIS-based DRASTIC framework enhanced with land-use integration and structured expert elicitation. By combining hydrogeological parameters with anthropogenic influences and expert-derived weights, the assessment provides a realistic representation of groundwater vulnerability, supporting sustainable management in hyper-arid fossil aquifer systems subject to intensive human stressors. The conventional DRASTIC model alone underestimates vulnerability in areas with limited natural recharge and extensive groundwater abstraction, whereas the DRASTIC-L model, incorporating land use and expert-informed weighting, consistently produces higher vulnerability indices and expands high-risk zones, particularly in regions affected by urban expansion, infrastructure development, and agricultural reclamation. El-Farafra Oasis exhibits the highest vulnerability, driven by intensive groundwater abstraction, shallow to moderate water tables, highly permeable Nubian Sandstone aquifers, and minimal natural recharge, highlighting the need for urgent regulatory interventions. El-Kharga Oasis displays predominantly moderate vulnerability, reflecting a balance between partial natural protection and increasing anthropogenic pressures, underscoring the importance of proactive management and continuous monitoring. The Tushka Depression currently maintains low vulnerability due to supplementary recharge from Lake Nasser; however, localized increases associated with land-use expansion indicate that even well-recharged systems remain susceptible if development is unmanaged.
The study demonstrates the value of integrating expert elicitation into groundwater vulnerability modeling, particularly in data-limited arid regions where conventional fixed-weight approaches may not fully capture hydrogeological and socio-economic conditions. Expert-derived weighting, supported by global sensitivity analysis, enhances robustness, interpretability, and management relevance while retaining the transparency and practicality of DRASTIC-based models. Groundwater vulnerability patterns are primarily controlled by land use as a contaminant source and by hydrogeological conditions governing transport, while abstraction influences hydraulic gradients that can locally modify contaminant migration pathways. Sustainable management of the Nubian Sandstone Aquifer System requires coordinated strategies, including regulated groundwater extraction, water-efficient irrigation, protection of recharge-sensitive areas, and incorporation of vulnerability maps into land-use planning and development policies. While this assessment provides a regional baseline, it also underscores the dynamic nature of groundwater vulnerability and the need for further research that incorporates temporal variations in groundwater levels, land-use change, climate-driven recharge variability, and ongoing groundwater quality monitoring. The integrated methodology proposed here offers a transferable and adaptable framework for evidence-based, sustainable groundwater management in other arid and semi-arid regions.


Author Contributions

Conceptualization, M.A.S., M.E.-S.E.-M. and S.S.S.; methodology, S.S.S. and A.-A.S.A.; validation, M.A.S., A.-A.S.A. and M.E.-S.E.-M.; formal analysis, S.S.S. and A.-A.S.A.; investigation, S.S.S. and A.-A.S.A.; resources, I.A.H.Y. and S.S.S.; data curation, S.S.S.; writing—original draft preparation, S.S.S., A.-A.S.A. and M.E.-S.E.-M.; writing—review and editing, M.A.S. and I.A.H.Y.; visualization, A.-A.S.A. and S.S.S.; supervision, M.A.S.; project administration, M.A.S. and I.A.H.Y.; funding acquisition, S.S.S., M.A.S. and I.A.H.Y. All authors have read and agreed to the published version of the manuscript.
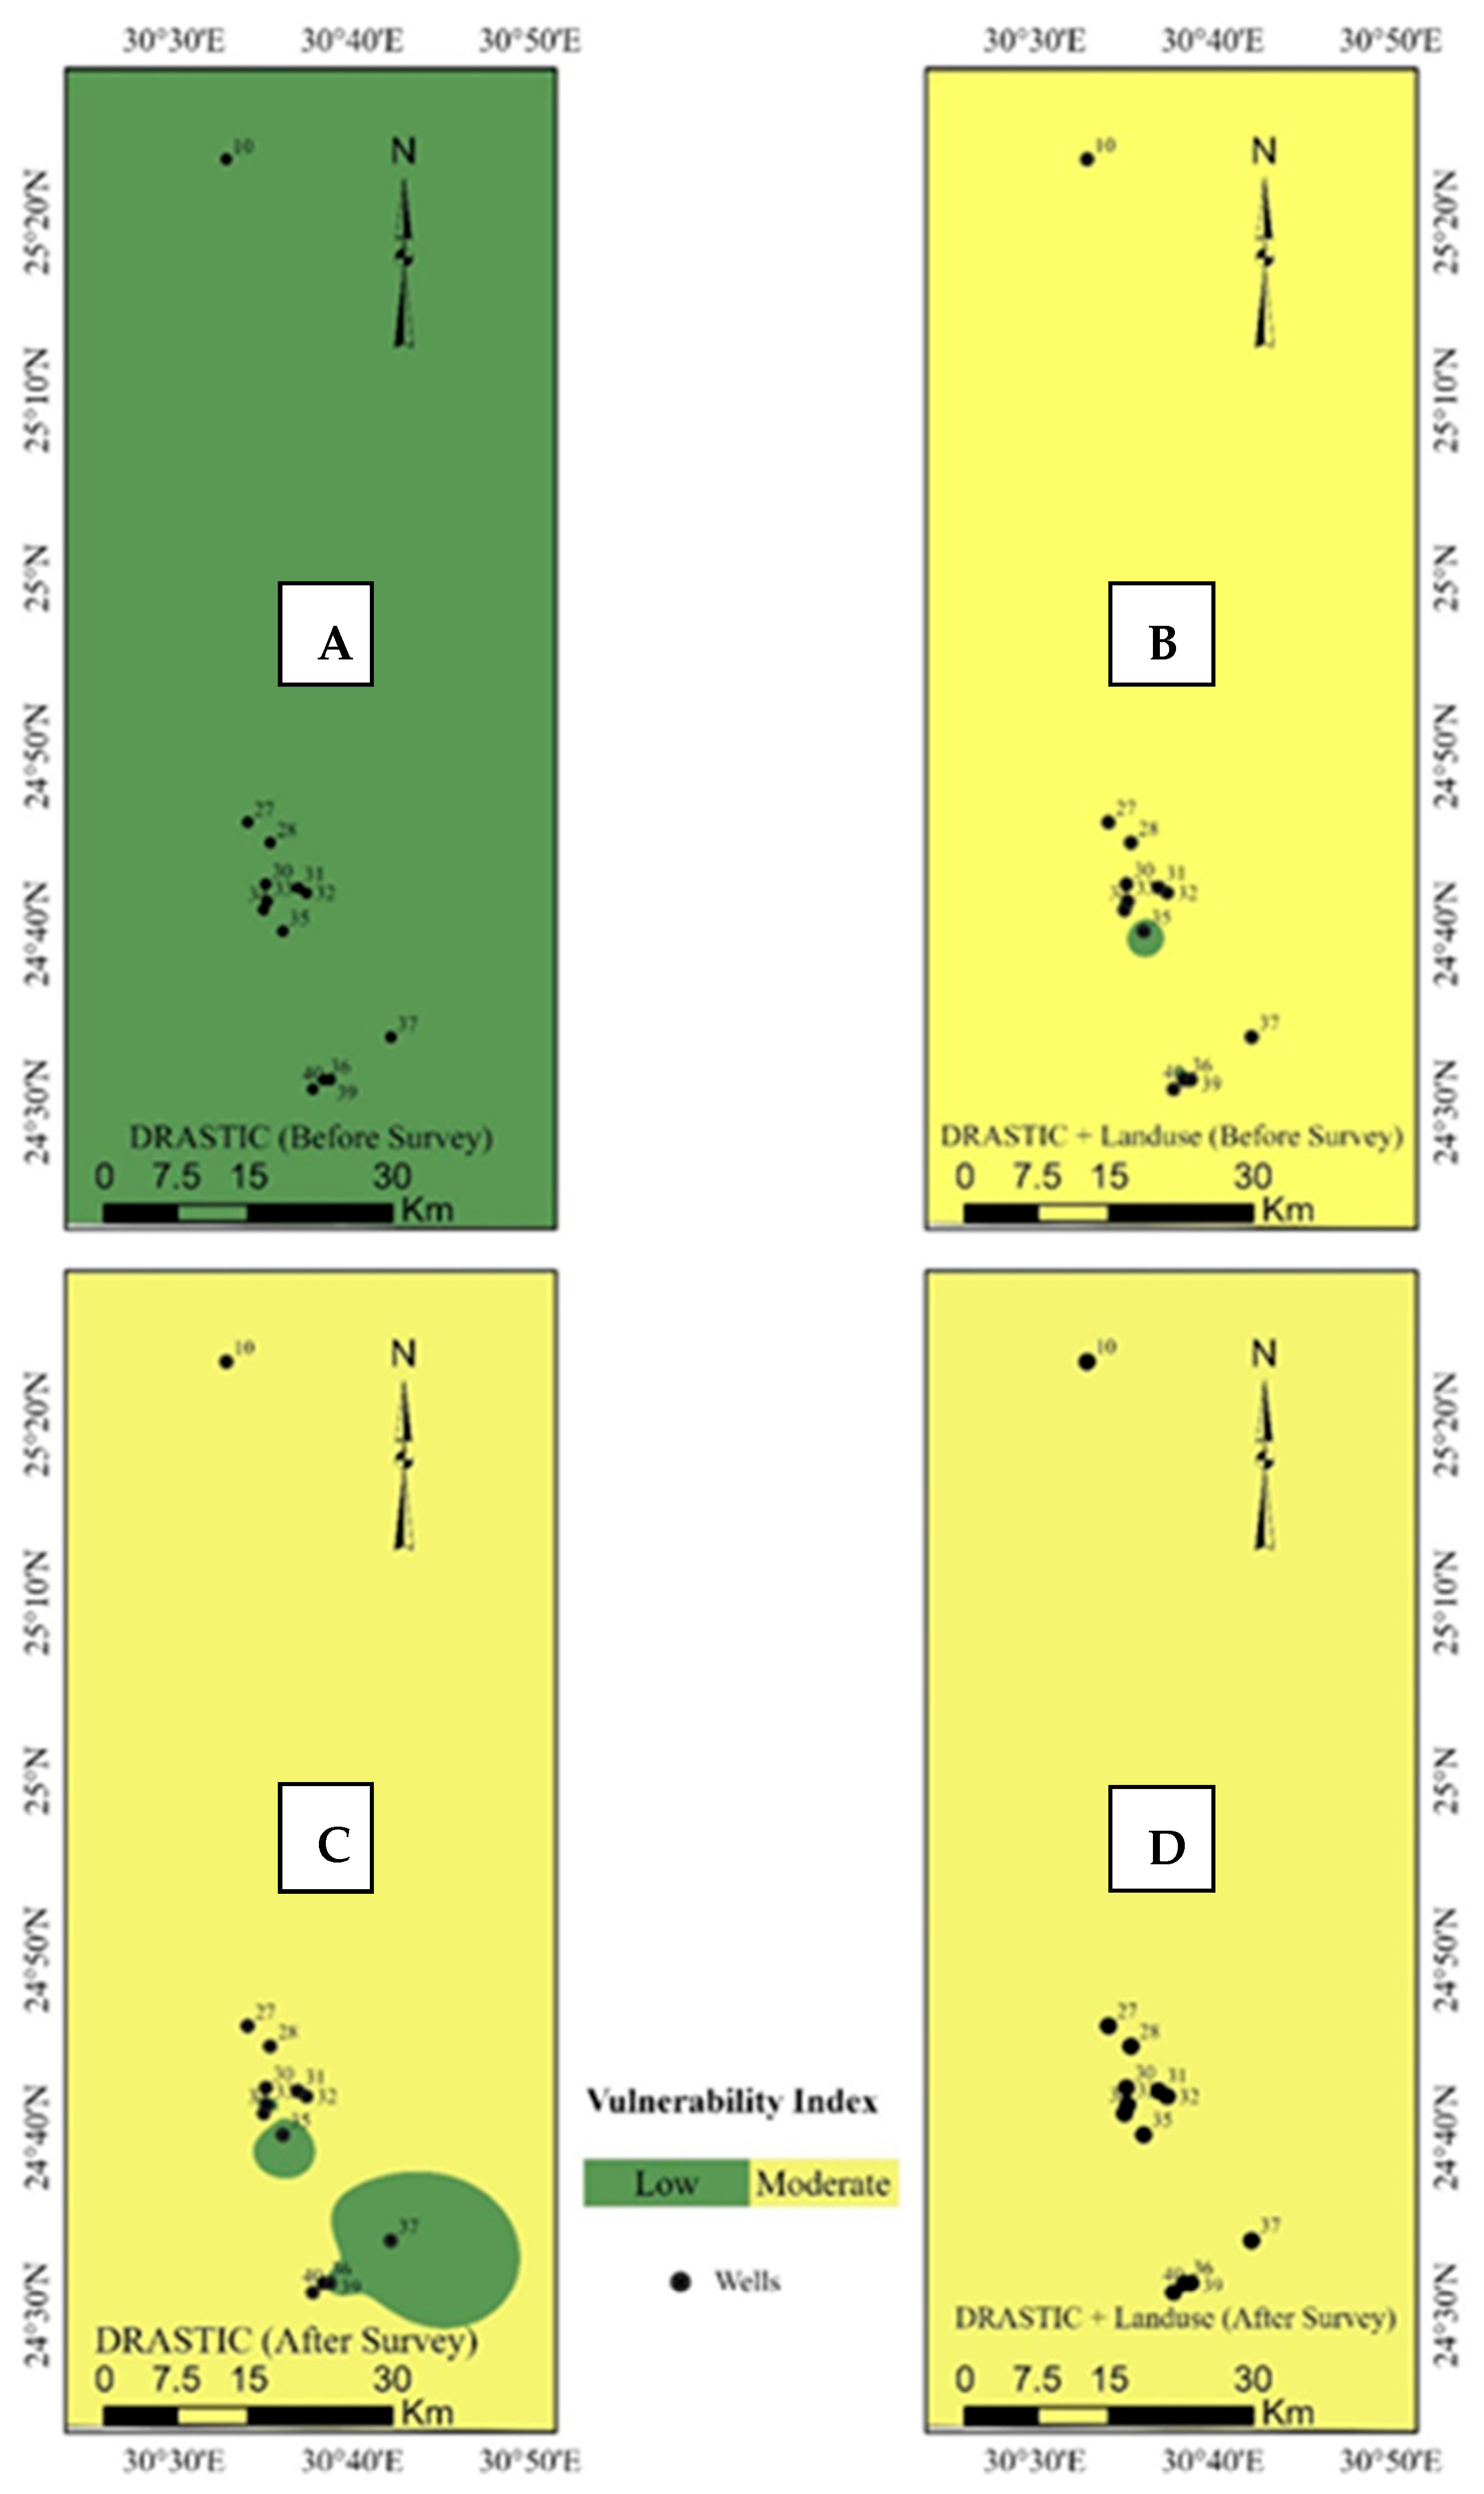
Funding

This research received no external funding.

Data Availability Statement

Data supporting the reported results can be found at the corresponding author upon reasonable request.

Conflicts of Interest

The authors declare no conflicts of interest.

Abbreviations

The following abbreviations are used in this manuscript:
AHPAnalytic Hierarchy Process
CHydraulic conductivity
DDepth-to-water table
DEMDigital Elevation Model
DIDRASTIC Index
DI-LLand-use-modified DRASTIC Index
DRASTIC-LDRASTIC model incorporating land use/land cover in groundwater vulnerability assessment
DRASTIC-AHPDRASTIC model with parameter weights derived using the Analytic Hierarchy Process (AHP)
DTTruncation (total-effect) effective dimension
IImpact of the vadose zone
kNumber of input parameters in the sensitivity analysis
MIRbMain Interaction Ratio
NBase sample size used in the Saltelli sampling scheme
NSASNubian Sandstone Aquifer System
RNet recharge
SSoil media
SiFirst-order Sobol sensitivity index (direct contribution of each parameter to output variance)
STiTotal-order Sobol sensitivity index (overall contribution including interactions)
TTopography

References

  1. Arafa, N.A.; El-Said Salem, Z.; Abdeldayem, A.L.; Ghorab, M.A.; Moustafa, Y.M.; Soliman, S.A.; Farag, M.H.; Purohit, S.; Elhag, M.; Youssef, Y.M. Advancing deltaic aquifer vulnerability mapping to seawater intrusion and human impacts in Eastern Nile Delta: Insights from machine learning and hydrochemical perspective. Earth Syst. Environ. 2025, 9, 2481–2506. [Google Scholar] [CrossRef] [Scilit]
  2. Wachniew, P.; Żurek, A.J.; Stumpp, C.; Gemitzi, A.; Gargini, A.; Filippini, M.; Różański, K.; Meeks, J.; Kværner, J.; Witczak, S. Toward operational methods for the assessment of groundwater vulnerability: A review. Crit. Rev. Environ. Sci. Technol. 2016, 46, 827–884. [Google Scholar] [CrossRef] [Scilit]
  3. Freeze, R.A.; Cherry, J.A. Groundwater; Prentice-Hall: Englewood Cliffs, NJ, USA, 1979. [Google Scholar]
  4. Williams, S.A.; Megdal, S.B.; Zuniga-Teran, A.A.; Quanrud, D.M.; Christopherson, G. Mapping groundwater vulnerability in arid regions: A comparative risk assessment using modified DRASTIC models, land use, and climate change factors. Land 2025, 14, 58. [Google Scholar] [CrossRef] [Scilit]
  5. Elsheikh, A.E. Mitigation of groundwater level deterioration of the Nubian Sandstone aquifer in Farafra Oasis, Western Desert, Egypt. Environ. Earth Sci. 2015, 74, 2351–2367. [Google Scholar] [CrossRef] [Scilit]
  6. Kaliraj, S.; Chandrasekar, N.; Peter, T.S.; Selvakumar, S.; Magesh, N.S. Mapping of coastal aquifer vulnerable zones in the southwest coast of Kanyakumari, South India, using a GIS-based DRASTIC model. Environ. Monit. Assess. 2015, 187, 4073. [Google Scholar] [CrossRef] [Scilit] [PubMed]
  7. Brindha, K.; Elango, L. Groundwater quality zonation in a shallow weathered rock aquifer using GIS. Geo-Spat. Inf. Sci. 2012, 15, 95–104. [Google Scholar] [CrossRef] [Scilit]
  8. Kadkhodaie, F.; Asghari Moghaddam, A.; Barzegar, R.; Gharekhani, M.; Kadkhodaie, A. Optimizing the DRASTIC vulnerability approach to overcome subjectivity: A case study from Shabestar Plain, Iran. Arab. J. Geosci. 2019, 12, 527. [Google Scholar] [CrossRef] [Scilit]
  9. Jhariya, D.C.; Kumar, T.; Pandey, H.K.; Kumar, S.; Kumar, D.; Gautam, A.K.; Kishore, N. Assessment of groundwater vulnerability to pollution using a modified DRASTIC model and analytic hierarchy process. Environ. Earth Sci. 2019, 78, 610. [Google Scholar] [CrossRef] [Scilit]
  10. Pereira, J.L.; Varouchakis, E.A.; Karatzas, G.P.; Katsifarakis, I.A.; Dimitrakopoulos, R. Uncertainty quantification in geostatistical modelling of salt-water intrusion at a coastal aquifer system. Math. Geosci. 2024, 56, 867–885. [Google Scholar] [CrossRef] [Scilit]
  11. Shakeri, H.; Motiee, H. Risk analysis of impacts of climate change on changes in municipal wastewater production in wastewater reuse plans. Urban Water J. 2023, 20, 298–312. [Google Scholar]
  12. Siarkos, I.; Arfaoui, M.; Tzoraki, O.; Zammouri, M.; Hamzaoui-Azaza, F. Implementation and evaluation of different techniques to modify the DRASTIC method for groundwater vulnerability assessment: A case study from the Bouficha aquifer, Tunisia. Environ. Sci. Pollut. Res. 2023, 30, 89459–89478. [Google Scholar]
  13. Baker, T.; Manenti, C.; Reali, F.; Sangalli, L.M.; Tamellini, L.; Todeschini, A. Combining noisy well data and expert knowledge in a Bayesian calibration of a flow model under uncertainties. Stoch. Environ. Res. Risk Assess. 2023, 37, 4183–4201. [Google Scholar]
  14. Hassan, A.; Elsaeed, G.; Nagaty, M.; Abdelghani, E. Groundwater flow modeling in a Nubian Sandstone aquifer, South Western Desert, Egypt. J. Sci. Res. Rep. 2015, 6, 243–254. [Google Scholar] [CrossRef] [Scilit] [PubMed]
  15. Masoud, A.A. Groundwater quality assessment of the shallow aquifers west of the Nile Delta (Egypt) using multivariate statistical and geostatistical techniques. J. Afr. Earth Sci. 2014, 95, 123–137. [Google Scholar] [CrossRef] [Scilit]
  16. Wilson, T.; Boyles, R.P.; DeCrappeo, N.; Drexler, J.Z.; Kroeger, K.D.; Loehman, R.A.; Pearce, J.M.; Waldrop, M.P.; Warwick, P.D.; Wein, A.M.; et al. US Geological Survey Climate Science Plan—Future Research Directions; USGS: Reston, VA, USA, 2024.
  17. El-Rawy, M.; De Smedt, F. Estimation and mapping of the transmissivity of the Nubian Sandstone aquifer in the Kharga Oasis, Egypt. Water 2020, 12, 604. [Google Scholar] [CrossRef] [Scilit]
  18. Kerzabi, R.; Mansour, H.; Yousfi, S.; Marín-Guerrero, A.I.; Andreo-Navarro, B.; Bensefia, K.E. Contribution of remote sensing and GIS to mapping groundwater vulnerability in arid zones: Case from Amour Mountains (Algerian Saharan Atlas). J. Afr. Earth Sci. 2021, 182, 104277. [Google Scholar] [CrossRef] [Scilit]
  19. Esri. Sentinel-2 10 m Land Use/Land Cover Time Series (2017–2023) [Imagery Dataset]. ArcGIS Living Atlas of the World. 2023. Available online: https://www.arcgis.com/home/item.html?id=6df9ed7a1eda4ed58023456b7c5484fd#overview (accessed on 20 July 2026).
  20. Ouedraogo, I.; Defourny, P.; Vanclooster, M. Mapping groundwater vulnerability for pollution at the pan-African scale. Sci. Total Environ. 2016, 544, 939–953. [Google Scholar] [CrossRef] [Scilit] [PubMed]
  21. Yu, H.; Wang, F.; Hou, Y.; Wang, J.; Zhu, J.; Guo, J. MSARG-Net: A multimodal offshore floating raft aquaculture area extraction network for remote sensing images based on multiscale SAR guidance. IEEE J. Sel. Top. Appl. Earth Obs. Remote Sens. 2024, 17, 18319–18334. [Google Scholar]
  22. EPA/600/2-87/035; DRASTIC: A Standardized System for Evaluating Ground Water Pollution Potential Using Hydrogeologic Settings. U.S. Environmental Protection Agency: Washington, DC, USA, 1987.
  23. ElKashouty, M. Groundwater vulnerability risk assessment in South Darb El Arbaein, South Western Desert. Arab. J. Geosci. 2021, 11, 86. [Google Scholar] [CrossRef] [Scilit]
  24. Saad, M.; Nofal, E.; Abdelmonem, Y.; Riad, P. Application of decision support system/remote sensing/GIS techniques in groundwater recharge assessment. Water Pract. Technol. 2024, 19, 3721–3743. [Google Scholar] [CrossRef] [Scilit]
  25. Elshalkany, M.; Ahmed, M.; Sauck, W.; Abouelmagd, A.; Mansour, S.; El-Nekhiely, I.N.; Abdelfattah, M.; Abdelrehim, R.; Gamal, M.; Omar, A. Geophysical and remote-sensing constraints on fault controls on groundwater accumulation in basement rock aquifers in Sinai, Egypt. Surv. Geophys. 2025, 46, 627–664. [Google Scholar] [CrossRef] [Scilit]
  26. Seleem, A.S.; Kaiser, M.F.; Athelib, H.S. Data Integration to Assess Aquifer Vulnerability Potential to Pollution around Ismailia Canal Using Remote Sensing and GIS Techniques. IOSR J. Appl. Geol. Geophys. 2018, 6, 40–53. [Google Scholar]
  27. Fienen, M.N.; Doherty, J.E.; Hunt, R.J.; Reeves, H.W. Using prediction uncertainty analysis to design hydrologic monitoring networks: Example applications from the Great Lakes Water Availability Pilot Project. In U.S. Geological Survey Scientific Investigations Report; U.S. Geological Survey: Reston, VA, USA, 2010; p. 44. [Google Scholar] [CrossRef] [Scilit]
  28. Pathak, D.R.; Hiratsuka, A.; Awata, I.; Chen, L. Groundwater vulnerability assessment in shallow aquifer of Kathmandu Valley using GIS-based DRASTIC model. Environ. Geol. 2009, 57, 1569–1578. [Google Scholar]
  29. A spinall, W. A route to more tractable expert advice. Nature 2010, 463, 294–295. [Google Scholar] [CrossRef] [Scilit] [PubMed]
  30. Linstone, H.A.; Turoff, M. (Eds.) The Delphi Method; Addison-Wesley: Reading, MA, USA, 1975. [Google Scholar]
  31. Salem, Z.E.; Attiah, A.M.; Negm, A.; Fathy, M.S.; Youssef, Y.M. Assessment of quaternary aquifer pollution sensitivity using modified DRASTIC models around a stressed canal in Eastern Nile Delta, Egypt. Sci. Rep. 2025, 15, 25287. [Google Scholar] [CrossRef] [Scilit] [PubMed]
  32. Foster, S.; Hirata, R.; Gomes, D. Groundwater Quality Protection: A Guide for Water Service Companies, Municipal Authorities, and Environmental Agencies; World Bank: Washington, DC, USA, 2002. [Google Scholar]
  33. Al-Abadi, A.M.; Al-Shamma’a, A.M.; Aljabbari, M.H. A GIS-based DRASTIC model for assessing groundwater vulnerability in northeastern Missan Governorate, southern Iraq. Appl. Water Sci. 2017, 7, 89–101. [Google Scholar] [CrossRef] [Scilit]
  34. Aldabaa, A.; Yousif, I. Geostatistical approach for land suitability assessment of some desert soils. Egypt. J. Soil Sci. 2020, 60, 195–209. [Google Scholar] [CrossRef] [Scilit]
  35. Zghibi, A.; Merzougui, A.; Chenini, I.; Ergaieg, K.; Zouhri, L.; Tarhouni, J. Groundwater vulnerability analysis of a Tunisian coastal aquifer: Application of the DRASTIC index method in a GIS environment. Groundw. Sustain. Dev. 2016, 2, 169–181. [Google Scholar] [CrossRef] [Scilit]
  36. Allen, R.G.; Pereira, L.S.; Raes, D.; Smith, M. Crop Evapotranspiration: Guidelines for Computing Crop Water Requirements; FAO Irrigation and Drainage Paper No. 56; FAO: Rome, Italy, 1998. [Google Scholar]
  37. Aly, M.M.; Fayad, S.A.; Abd Elhamid, A.M. Assessment of groundwater suitability for different activities in Toshka district, South Egypt. J. Groundw. Sci. Eng. 2024, 12, 34–48. [Google Scholar] [CrossRef] [Scilit]
  38. Nakhostinrouhi, M.; Rezaei Moghaddam, M.H. Groundwater vulnerability mapping using a modified DRASTIC model in Ajabshir Plain, southeast of Lake Urmia, Iran. Int. Arch. Photogramm. Remote Sens. Spat. Inf. Sci. 2019, XLII-4/W18, 789–792. [Google Scholar] [CrossRef] [Scilit]
  39. Shrestha, S.; Semkuyu, D.J.; Pandey, V.P. Assessment of groundwater vulnerability and risk to pollution in Kathmandu Valley, Nepal. Sci. Total Environ. 2016, 556, 23–35. [Google Scholar] [CrossRef] [Scilit] [PubMed]
  40. Taylor, J.G.; Ryder, S.D. Use of the Delphi method in resolving complex water resources issues. J. Am. Water Resour. Assoc. 2003, 39, 183–189. [Google Scholar] [CrossRef] [Scilit]
  41. Shamsuddin, A.S.; Syed Ismail, S.N.; Zainal Abidin, E.; Ho, Y.B.H.; Juahir, H.; Bakar, W.A.M.A. Application of GIS-based DRASTIC model approaches in assessing groundwater vulnerability for shallow alluvial aquifers. Arab. J. Geosci. 2021, 14, 2693. [Google Scholar] [CrossRef] [Scilit]
  42. Clemen, R.T.; Winkler, R.L. Combining probability distributions from experts in risk analysis. Risk Anal. 1999, 19, 187–203. [Google Scholar] [CrossRef] [Scilit]
  43. Rahman, A. A GIS-based DRASTIC model for assessing groundwater vulnerability in a shallow aquifer in Aligarh, India. Appl. Geogr. 2008, 28, 32–53. [Google Scholar] [CrossRef] [Scilit]
  44. Saltelli, A.; Ratto, M.; Andres, T.; Campolongo, F.; Cariboni, J.; Gatelli, D.; Saisana, M.; Tarantola, S. Global Sensitivity Analysis: The Primer; John Wiley & Sons: Chichester, UK, 2008. [Google Scholar] [CrossRef] [Scilit]
  45. Hussain, Y.; Ullah, S.F.; Akhter, G.; Aslam, A.Q. Groundwater quality evaluation by electrical resistivity method for optimized tubewell site selection in an agro-stressed Thal Doab aquifer in Pakistan. Model. Earth Syst. Environ. 2017, 3, 15. [Google Scholar] [CrossRef] [Scilit]
Figure 1. Locations of the El-Farafra Oasis, the El-Kharga Oasis, and the Tushka Depression in southern Egypt.
Hydrology 13 00198 g001
Figure 2. Geological map of the El-Farafra Oasis, generated using ArcGIS Pro. V.3.4.
Hydrology 13 00198 g002
Figure 3. Depth-to-groundwater map of the El-Farafra Oasis, generated using ArcGIS Pro.
Hydrology 13 00198 g003
Figure 4. Electrical conductivity (EC) map of the El-Farafra Oasis, generated using ArcGIS Pro.
Hydrology 13 00198 g004
Figure 5. Geological map of the El-Kharga Oasis, generated using ArcGIS Pro.
Hydrology 13 00198 g005
Figure 6. Depth-to-groundwater map of the El-Kharga Oasis, generated using ArcGIS Pro.
Hydrology 13 00198 g006
Figure 7. Electrical conductivity (EC) map of the El-Kharga Oasis, generated using ArcGIS Pro.
Hydrology 13 00198 g007
Figure 8. Geological map of the Tushka Depression, generated using ArcGIS Pro.
Hydrology 13 00198 g008
Figure 9. Depth-to-groundwater map of the Tushka Depression, generated using ArcGIS Pro.
Hydrology 13 00198 g009
Figure 10. Electrical conductivity (EC) map of the Tushka Depression, generated using ArcGIS Pro.
Hydrology 13 00198 g010
Figure 11. Soil types in the three study locations: El-Farafra Oasis (top), El-Kharga Oasis (bottom left), and the Tushka Depression (bottom right).
Hydrology 13 00198 g011
Figure 12. Elevation maps of the three locations of the study area. The (A) El-Farafra Oasis, the (B) El-Kharga Oasis, and the (C) Tushka Depression.
Hydrology 13 00198 g012
Figure 13. Land slope (%) distribution of the three locations of the study area. The (A) El-Farafra Oasis, the (B) El-Kharga Oasis, and the (C) Tushka Depression.
Hydrology 13 00198 g013
Figure 14. Land-use map of the three locations of the study area. (A) El-Farafra Oasis, (B) El-Kharga Oasis, and (C) Tushka Depression.
Hydrology 13 00198 g014
Figure 15. Vulnerability index for the El-Farafra Oasis region. (A) DRASTIC before the expert elicitation procedure, (B) DRASTIC-L before the expert elicitation procedure, (C) DRASTIC after the expert elicitation procedure, and (D) DRASTIC-L after the expert elicitation procedure.
Hydrology 13 00198 g015
Figure 16. Vulnerability index for the El-Kharga Oasis region. (A) DRASTIC before the expert elicitation procedure, (B) DRASTIC-L before the expert elicitation procedure, (C) DRASTIC after the expert elicitation procedure, and (D) DRASTIC-L after the expert elicitation procedure.
Hydrology 13 00198 g016
Figure 17. Vulnerability index for the Tushka region. (A) DRASTIC before the expert elicitation procedure, (B) DRASTIC-L before the expert elicitation procedure, (C) DRASTIC after the expert elicitation procedure, and (D) DRASTIC-L after the expert elicitation procedure.
Hydrology 13 00198 g017
Table 1. Rating and weight values assigned for all parameters adopted from several sources of reference [29].
DRASTIC ParameterRangeRatingWeight
Depth-to-water table (m)0–595
5–106
10–153
15–202
>201
Recharge (mm/year)>25094
180–2508
100–1806
50–1003
0–501
Aquifer mediaQuaternary (alluvium)93
Acid intrusive rock (e.g., granite)2
Soil mediaUrban land92
Sand9
Peat8
Coarse sandy clay–clay6
Fine sandy clay loam–sandy clay–clay6
Fine sandy clay loam6
Fine sandy clay6
Clay1
Steepland1
Topography (slope %)<2101
2–69
6–125
12–183
>181
Impact of vadose zoneQuaternary (alluvium)95
Acid intrusive rock (e.g., granite)2
Hydraulic conductivityUrban land93
Sand9
Peat8
Coarse sandy clay–clay6
Fine sandy clay loam–sandy clay–clay6
Fine sandy clay loam6
Fine sandy clay2
Clay1
Steepland1
Land useLivestock, urban, agricultural areas85
Palm tree and other permanent crop lands5
Water bodies3
Swamps, grassland, shrubland, bare land2
Forest1
Table 2. A comparison of the weight values assigned to all parameters derived from several references [29] and the average relative weight values resulting from the expert elicitation procedure.
ParametersWeight (Derived from Several References) *Relative Weight *
(According to the Expert Elicitation Procedure)
El-FrafraEl-KhargaTushka
Depth-to-water table (D)5 4.65 4.8 4.55
Net recharge (R)41.21.52.25
Aquifer media (A)33.53.753.5
Soil media (S)23.453.553.45
Topography (T)12.22.42.3
Impact of the vadose zone (I)53.73.73.6
Hydraulic conductivity (C)33.73.753.75
Land use (L)52.21.952.3
* Weight and relative weight values were estimated based on several reference sources, along with experts’ ratings after applying the necessary iterative procedure [29], blending using equal-weight linear pooling [27], and a global sensitivity analysis utilizing the Sobol variance decomposition approach [30].
Table 3. Classification of groundwater vulnerability indices for the DRASTIC and DRASTIC-L models.
Zone No.DRASTIC Index ValueVulnerability Zones
1107–139Low
2140–169Moderate
3170–200High
Table 4. Vulnerability index for the El-Farafra Oasis.
Well IDVulnerability Zones
(Before Expert Elicitation Procedure)
Vulnerability Zones
(After Expert Elicitation Procedure)
Vulnerability Index for DRASTIC ModelVulnerability Index
for Integrated Land Use
DRASTIC Model
Vulnerability Index
for DRASTIC Model
Vulnerability Index
for Integrated Land Use DRASTIC Model
1lowModerateModerateModerate
2ModerateHighModerateHigh
3ModerateHighHighHigh
4lowModerateModerateModerate
5ModerateHighHighHigh
6ModerateHighHighHigh
7ModerateHighModerateHigh
8ModerateModerateHighHigh
9lowlowlowModerate
10lowModerateModerateModerate
11ModerateHighModerateHigh
12ModerateHighHighHigh
13ModerateHighHighHigh
Table 5. Vulnerability index for El-Kharga.
Well IDVulnerability Zones
(Before Expert Elicitation Procedure)
Vulnerability Zones
(After Expert Elicitation Procedure)
Vulnerability Index for DRASTIC ModelVulnerability Index for Integrated Land Use DRASTIC ModelVulnerability Index for DRASTIC ModelVulnerability Index
for Integrated Land Use DRASTIC Model
1lowModerateModerateModerate
2lowModerateModerateModerate
3lowModerateModerateModerate
4lowModerateModerateModerate
5lowModerateModerateModerate
6lowModerateModerateModerate
7lowModeratelowModerate
8lowModerateModerateModerate
9lowlowlowModerate
10lowlowModerateModerate
11lowModeratelowModerate
12lowModeratelowModerate
13lowModerateModerateModerate
Table 6. Vulnerability index for the Tushka Depression.
Well IDVulnerability Zones
(Before Expert Elicitation Procedure)
Vulnerability Zones
(After Expert Elicitation Procedure)
Vulnerability Index for DRASTIC ModelVulnerability Index
for Integrated Land Use DRASTIC Model
Vulnerability Index
for DRASTIC Model
Vulnerability Index
for Integrated Land Use DRASTIC Model
1lowlowlowlow
2lowlowlowlow
3lowlowlowlow
4lowlowlowlow
5lowlowlowlow
6lowlowlowlow
7lowlowlowlow
8lowModeratelowModerate
9lowlowlowlow
10lowlowlowlow
11lowModeratelowModerate
12lowlowlowlow
13lowlowlowlow
14lowlowlowlow
15lowlowlowlow
Table 7. Pearson and Spearman correlation-based validation of the DRASTIC and DRASTIC-L groundwater vulnerability models.
Study AreaModelPearson rSpearman ρ
El-FarafraDRASTIC0.740.71
DRASTIC-L0.830.79
El-KhargaDRASTIC0.620.58
DRASTIC-L0.710.66
TushkaDRASTIC0.380.41
DRASTIC-L0.520.48
Disclaimer/Publisher’s Note: The statements, opinions and data contained in all publications are solely those of the individual author(s) and contributor(s) and not of MDPI and/or the editor(s). MDPI and/or the editor(s) disclaim responsibility for any injury to people or property resulting from any ideas, methods, instructions or products referred to in the content.