1. Introduction
Groundwater–surface water (GW-SW) exchange controls water availability, streamflow persistence, solute transport, and ecosystem function across a wide range of hydrogeological settings [
1,
2,
3,
4]. Unconfined aquifers also transform transient boundary signals: hydraulic disturbances are delayed and attenuated with distance, and short-period fluctuations are damped more strongly than long-period fluctuations [
5,
6,
7,
8]. This frequency-dependent behavior is well established in analytical solutions for periodically forced aquifers and provides a useful physical basis for interpreting managed water-level records.
Agricultural drainage and irrigation networks impose boundary conditions that differ from the smooth seasonal variations in many natural rivers. Gate opening, closure, and temporary storage can introduce step-like or irregular changes, while rainfall, evapotranspiration, pumping, and field irrigation act simultaneously [
9,
10]. In the Huaibei Plain, drought and waterlogging frequently alternate, and shallow groundwater is strongly affected by drainage, irrigation, and control structures [
11,
12,
13,
14]. In the Chezegou system, main-ditch regulation is used to retain or evacuate water according to crop and flood-control requirements, and previous site-scale models have shown that the groundwater response depends on both operating stage and duration [
12,
14]. Such management-driven non-stationarity limits the direct application of empirical linear time-invariant spectral methods unless sampling and stationarity requirements are demonstrably satisfied.
The hydrogeological response is further complicated by Shajiang black soil, a Vertisol with pronounced shrink-swell behavior [
15,
16,
17]. Drying can create connected desiccation cracks and macropores, whereas wetting promotes clay swelling and progressive closure of these pathways [
15,
16,
17]. Preferential flow through structured soils is therefore plausible during intense rainfall, but its magnitude and persistence depend on antecedent moisture, crack geometry, and matrix-fracture exchange [
17,
18,
19,
20,
21,
22]. Groundwater-level changes record the resulting hydraulic-head response, while complementary tracers or multi-depth measurements are needed to resolve travel paths and water age.
Classical solutions of the linearized Boussinesq equation provide two complementary reference calculations for this setting. Periodic solutions quantify amplitude and power attenuation as functions of forcing period, distance, and hydraulic diffusivity [
5,
6]. Related solutions describe stream-boundary and infiltration effects in sloping unconfined aquifers [
23], while the Edelman step response and convolution formulations describe adjustment to abrupt or sequential stage changes [
24,
25,
26]. These established solutions are used here as reference calculations rather than fitted descriptions of irregular observations. They provide response-time and distance estimates across the adopted site parameter range for comparison with the rainfall and groundwater records.
Here, we examine groundwater–surface water responses in the Chezegou Watershed by combining the 2019–2024 monitoring record with analytical Boussinesq solutions. We describe the temporal resolution and quality control of the field data, recalculate the half-power cutoff and its sensitivity to hydraulic parameters and distance, and examine the shallow-groundwater response to the July 2020 storm without equating head change with water-particle travel. We then consider how managed channel boundaries and moisture-dependent flow in Shajiang black soil may have acted together. The contribution is a case-based evaluation of established response calculations under the sampling resolution and operating conditions of a regulated agricultural catchment, rather than a new universal framework.
2. Materials and Methods
2.1. Study Area and Monitoring Network
The Chezegou Watershed is located in Lixin County, Anhui Province, within the Huaibei Plain of eastern China. The area has a warm-temperate, semi-humid monsoon climate and pronounced interannual rainfall variability. The highest complete annual total during the study period was 941.2 mm in 2020. Because the 2022 gauge series covers only part of the year, its subtotal of 357.3 mm was not compared with complete annual totals.
The watershed occupies the Yellow River alluvial plain and is underlain by Quaternary unconsolidated deposits. A shallow unconfined groundwater system occurs beneath silty clay and Shajiang black soil, with sandier units at depth. Observed groundwater depths commonly varied from less than 1 m to more than 4 m below ground during the monitoring period. Aquifer response was represented by the linearized diffusivity α = KD/Sy, where K is horizontal hydraulic conductivity, D is saturated thickness, and Sy is specific yield. Local survey and pumping-test estimates of K = 9.97 m d
−1, D = 30 m, and Sy = 0.040 were used as the central case, with the sensitivity range described in
Section 2.3.
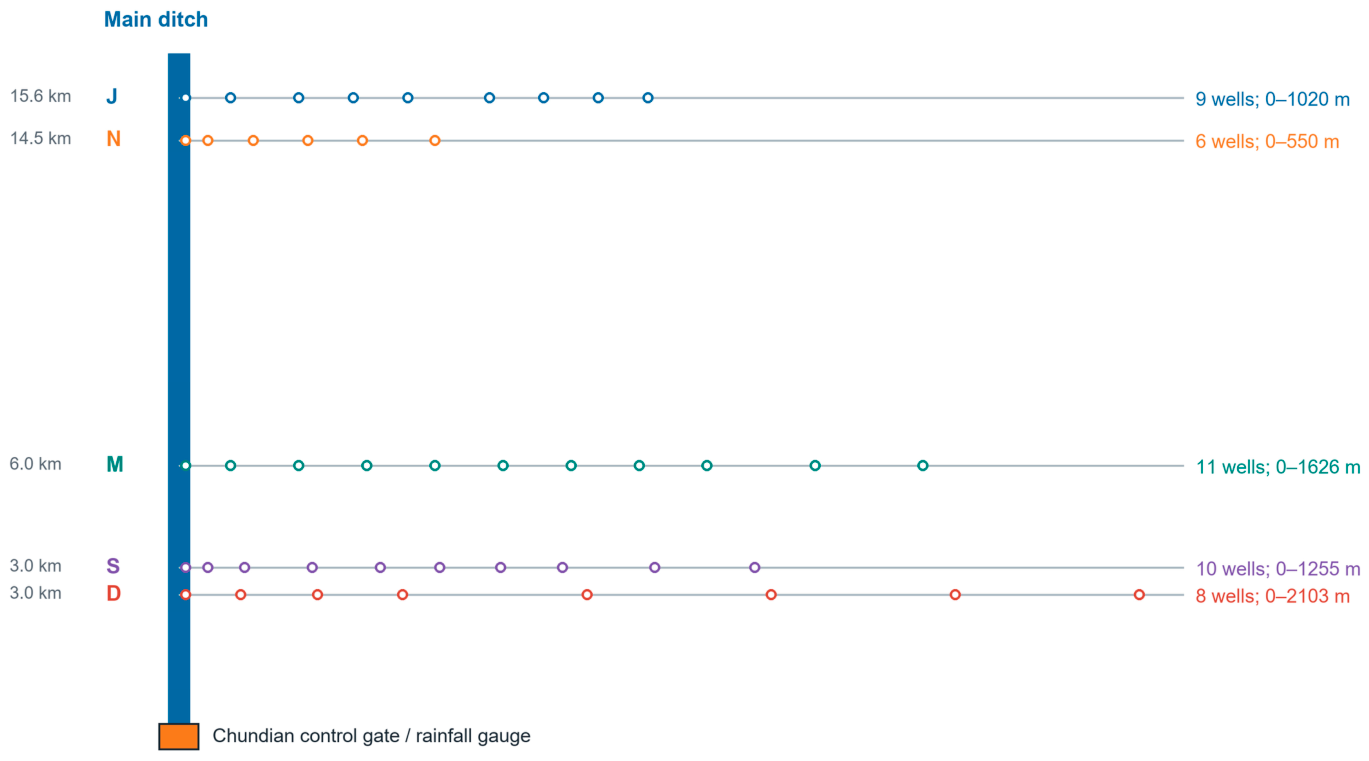
Five monitoring transects (J, N, M, S, and D) were arranged approximately perpendicular to the managed channels. Network documentation lists 63 installed wells, of which bank-distance data were available for 44: nine at J, six at N, eleven at M, ten at S, and eight at D. Surface-water levels were recorded at control structures, including the Chezegou gate series. Water levels were measured manually at a median interval of about five days. Values are reported as depth to water; a decrease in depth therefore denotes a rise in groundwater level. The wells record shallow-system hydraulic head. Differentiating the regional phreatic surface from local piezometric responses would require nested-screen observations.
Figure 1 links the five transects in
Table 1 to the principal channels and control structures. The transects span near-bank and inland positions so that observed hydrographs can be compared with the distance-dependent analytical response.
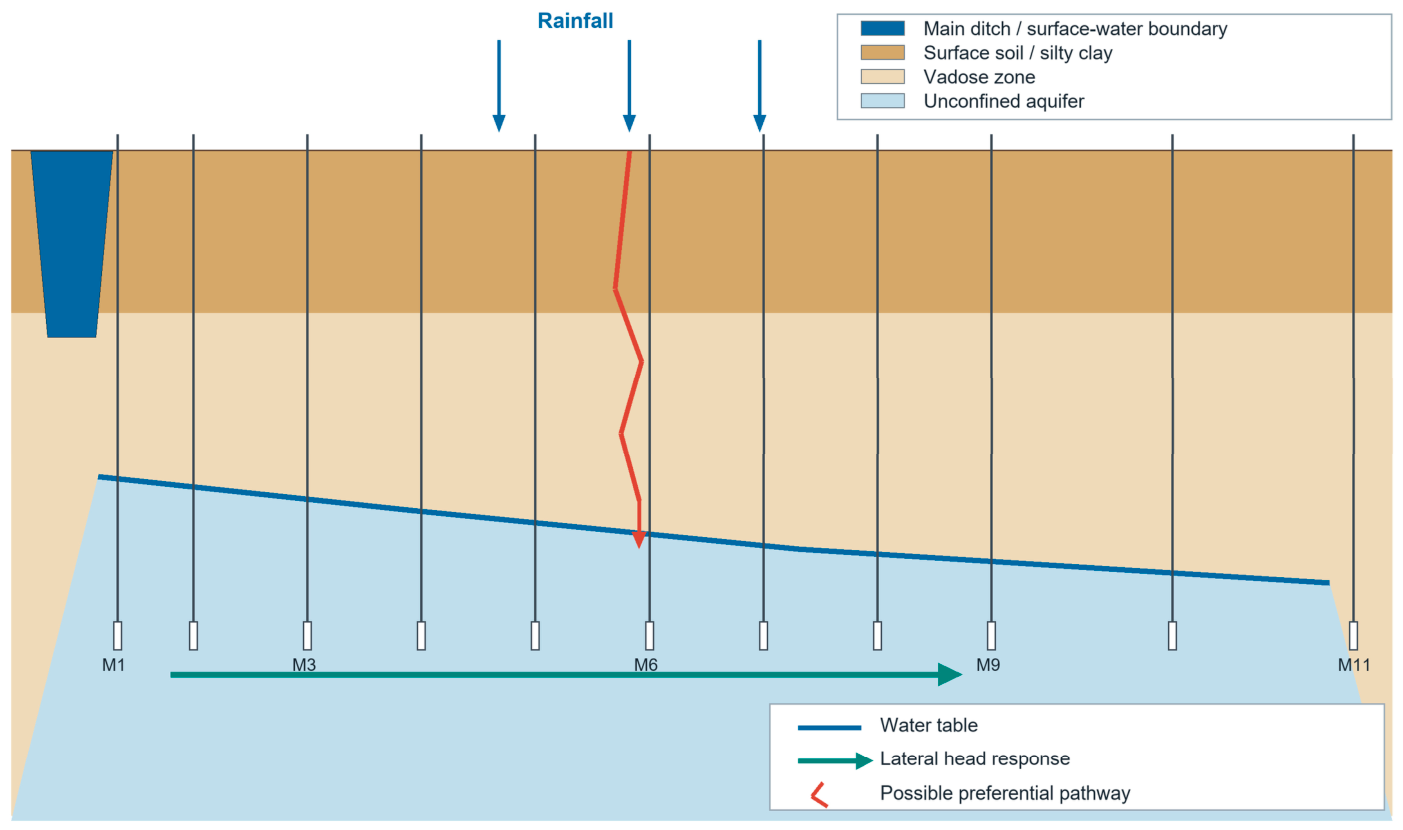
Figure 2 summarizes the hydrogeological interpretation used in this study. Lateral channel-stage forcing acts through the shallow saturated system, while rainfall, evapotranspiration, and soil structural changes affect vertical fluxes. The arrows indicate potential pathways and should not be read as event-specific measurements of flux or travel time.
2.2. Data Preparation and Quality Control
The consolidated workbook contained 18,227 numeric entries grouped under 75 sheet-and-label water-level series names, together with 66 annotated or nonnumeric cells. Dates, well identifiers, distances, units, month headers, and evident decimal formats were checked against the worksheet structure and adjacent observations. Annotated and nonnumeric cells were excluded from quantitative plots, while valid numeric observations were kept at their recorded dates. No smoothing, interpolation, or statistical threshold-based outlier removal was applied because these operations could alter event peaks and timing at the roughly five-day sampling interval.
Figure 2.
Conceptual cross-section of the shallow groundwater system, showing lateral hydraulic-head response, rainfall infiltration, and a possible preferential pathway in Shajiang black soil. The arrows indicate plausible processes rather than measured fluxes or travel times. Vertical scale is exaggerated.
Figure 2.
Conceptual cross-section of the shallow groundwater system, showing lateral hydraulic-head response, rainfall infiltration, and a possible preferential pathway in Shajiang black soil. The arrows indicate plausible processes rather than measured fluxes or travel times. Vertical scale is exaggerated.
Long-term lines were broken wherever adjacent observations were more than 20 d apart, approximately four typical sampling intervals, and event changes were calculated only between actual measurements. This avoids imposing an interpolation method; spline and patched-kriging reconstructions can differ materially when their assumptions are not independently constrained [
27]. The Chundian control-gate rainfall table contained 259 dated daily entries. These values were aggregated by calendar year and inspected around the July 2020 event. Observed water-level change was calculated as the pre-event depth minus the post-event depth, so positive values indicate groundwater-level rise.
2.3. Analytical Low-Pass Response and Parameter Sensitivity
For the analytical calculation, the aquifer is treated as locally homogeneous, one-dimensional, and semi-infinite, with small head perturbations, no distributed source term, and a prescribed head signal at the canal boundary. Under the Dupuit-Forchheimer approximation, lateral response in an unconfined aquifer is represented by the linearized Boussinesq diffusion equation [
5,
6,
23]. Hydraulic diffusivity is
where α has units of m
2 d
−1. The central parameter set K = 9.97 m d
−1, D = 30 m, and Sy = 0.040 gives α = 7477.5 m
2 d
−1.
For a sinusoidal boundary fluctuation of angular frequency ω, the amplitude ratio at distance x from a semi-infinite boundary is
The corresponding power gain is
This analytical response describes attenuation of a harmonic head signal; it is not an empirical spectrum estimated from the irregular monitoring record.
The cutoff is defined by the conventional half-power condition,
Solving Equation (4) gives ωc = α(ln 2)
2/(2x
2). With Tc = 2π/ωc, the half-power cutoff period is
Conversely, the half-power distance for a prescribed forcing period T is
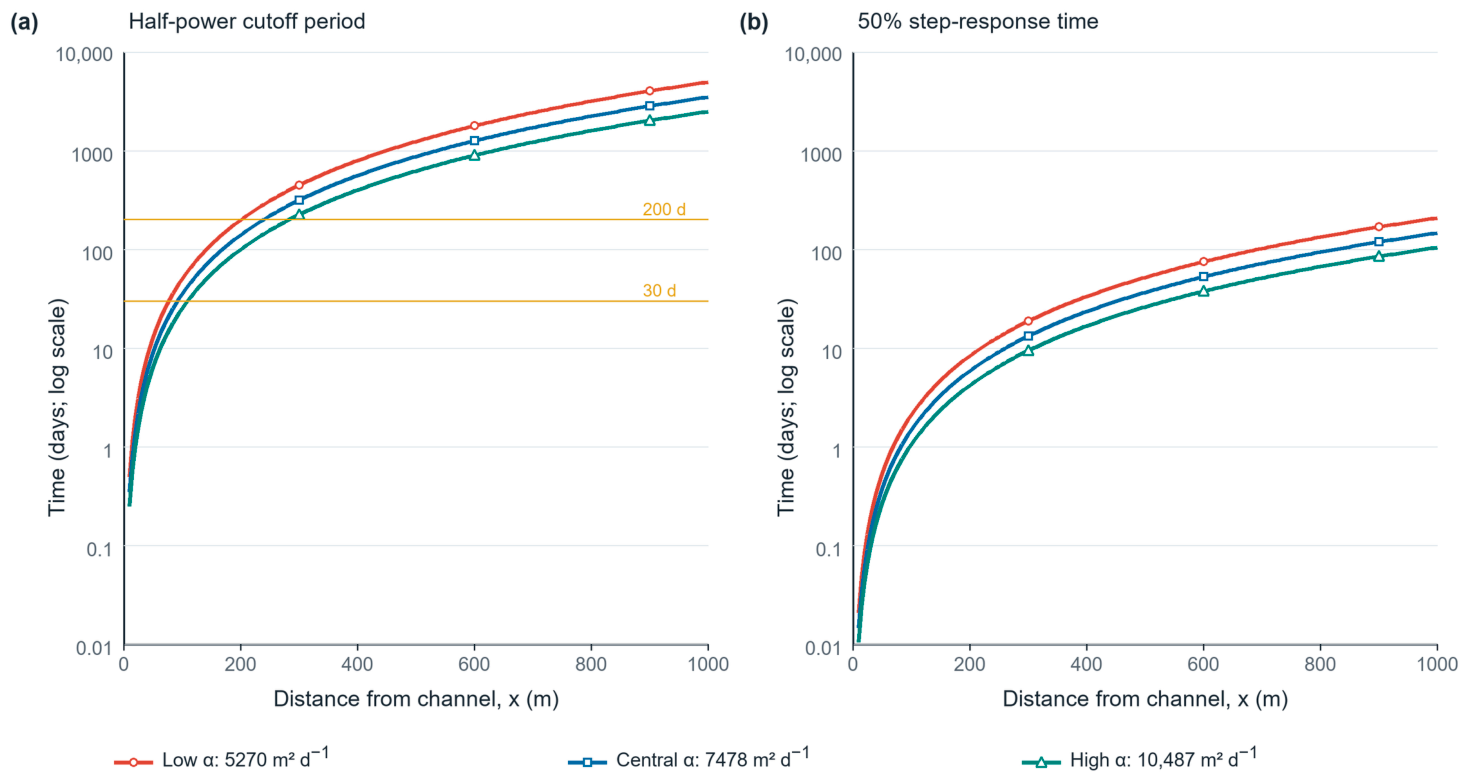
Sensitivity was evaluated at x = 50, 150, 400, and 800 m. Estimates from local surveys and pumping tests, K = 9.97 m d−1, D = 30 m, and Sy = 0.040, were used as the central case. The sensitivity calculations used K = 9.97 ± 1.50 m d−1, D = 30 ± 2 m, and Sy = 0.040 ± 0.005. The low-K/low-D/high-Sy combination gives α = 5270 m2 d−1, and the high-K/high-D/low-Sy combination gives α = 10,487 m2 d−1. These endpoints are deterministic scenario bounds, not confidence intervals.
Tc should be interpreted as a response timescale rather than a sharp limit of influence. Half of the input power remains at Tc; shorter-period signals are progressively attenuated, whereas sustained or step-like operations can propagate farther over time.
Because the measurements were irregular and spaced about five days apart, we did not estimate Welch spectra, magnitude-squared coherence, or coherence-derived spatial thresholds. Frequency response was instead evaluated from the analytical gain function over the adopted parameter range.
2.4. Analytical Step Response and Interpretation of Head Propagation
For an abrupt boundary-head change ΔH
0 in a homogeneous semi-infinite aquifer, the Edelman step response is [
24]
where h
i is the initial head, x is lateral distance, t is elapsed time, and erfc is the complementary error function. The solution predicts hydraulic-head adjustment under linear lateral-flow assumptions.
Defining t
50 as the time at which the response reaches 50% of the imposed boundary-head change gives
Equation (8) was used only to compare response times across distance. Estimating α from observed event lags would require detailed gate-operation records and finer temporal resolution, which were unavailable; the calculations therefore use the same parameter range as the harmonic analysis.
If a sequence of discrete boundary changes ΔH
i occurs at times t
i, linear superposition gives the theoretical response
Equation (9) represents the accumulated head response to successive boundary-stage changes. Direct convolution with the field record would require synchronized gate-operation times, evapotranspiration, pumping, irrigation, and intervals with approximately stable conditions; these data were not available.
Both Equations (7) and (9) describe hydraulic-head propagation. A rapid response in a well may occur faster than advective transport of a comparable water volume. Demonstrating volumetric canal recharge or stormwater arrival would require water-balance, flux, geochemical, isotope, or tracer evidence in addition to water-level timing.
2.5. Conceptual Representation of Matrix and Macropore Flow
Shajiang black soil is treated as a structured medium whose flow pathways vary with moisture. Vertisol shrinkage can generate macropores, connected macropores can accelerate infiltration, and wetting can reduce crack aperture through swelling [
15,
16,
17,
18,
19,
20,
21,
22]. We therefore distinguish a relatively slow matrix domain from faster flow through connected structural pores. This distinction is conceptual; no dual-permeability parameters were fitted.
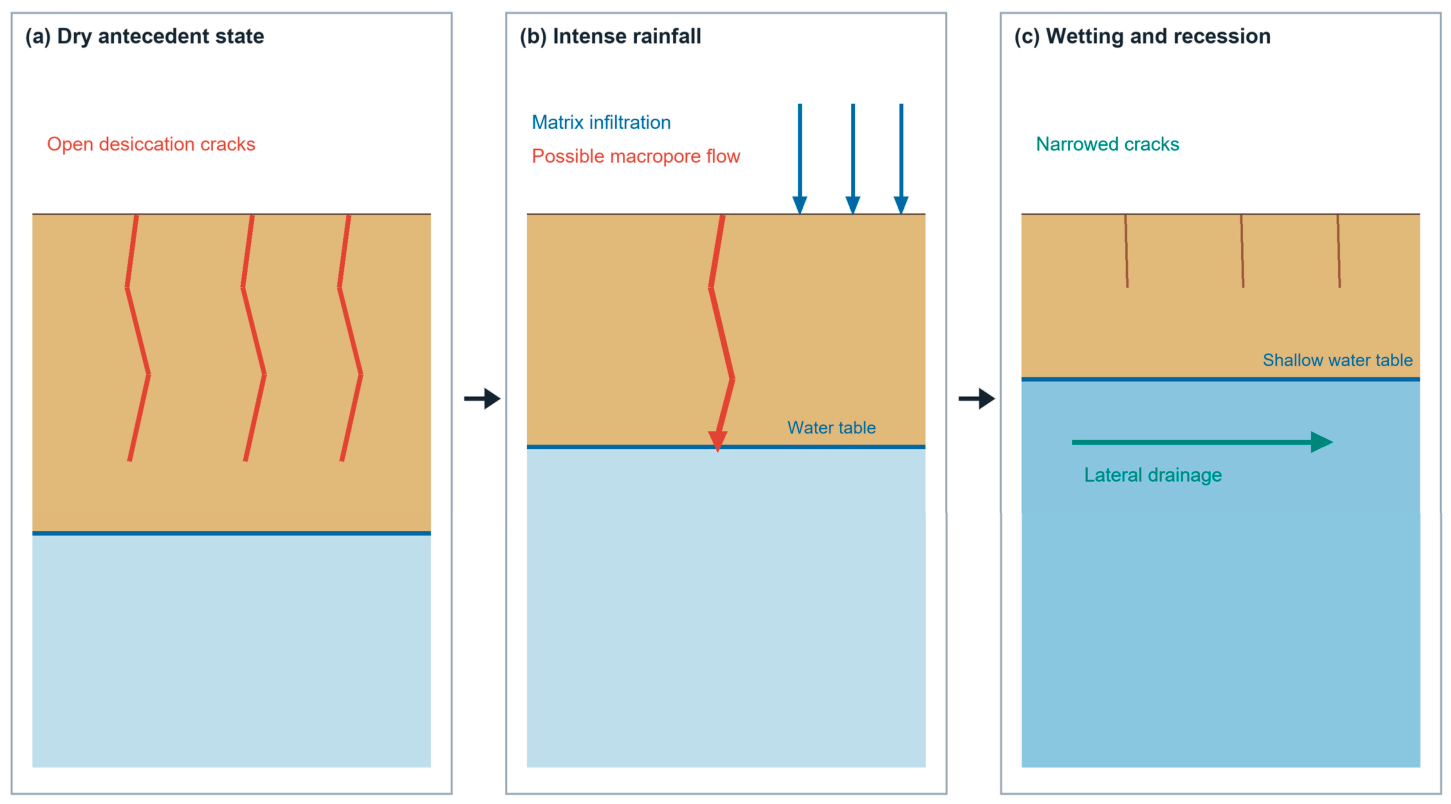
This conceptual interpretation includes crack opening during drying, rainfall entry into the matrix and connected macropores, and swelling and redistribution during wetting. The balance between these pathways depends on antecedent moisture and crack connectivity. No crack volume, critical moisture, exchange coefficient, or fracture conductivity was fitted.
Because inland wells responded within the available observation interval, slow matrix infiltration cannot be treated as the only possible mechanism. The water-level record, however, does not separate macropore flow from hydraulic-pressure transmission.
Testing this interpretation would require synchronized soil-moisture profiles, repeated crack-aperture or volume measurements, nested piezometers, evapotranspiration and irrigation records, and preferably tracers. These observations could then be incorporated into a coupled unsaturated-saturated flow model.
3. Results
3.1. Observed Hydrometeorological Forcing and Groundwater Variability
Annual rainfall totaled 480.9 mm in 2019, 941.2 mm in 2020, 901.9 mm in 2021, 779.2 mm in 2023, and 735.1 mm in 2024. The available portion of the 2022 gauge record summed to 357.3 mm and was not included in comparisons among complete years. The event analysis focused on the 106 mm daily total recorded on 12 July 2020.
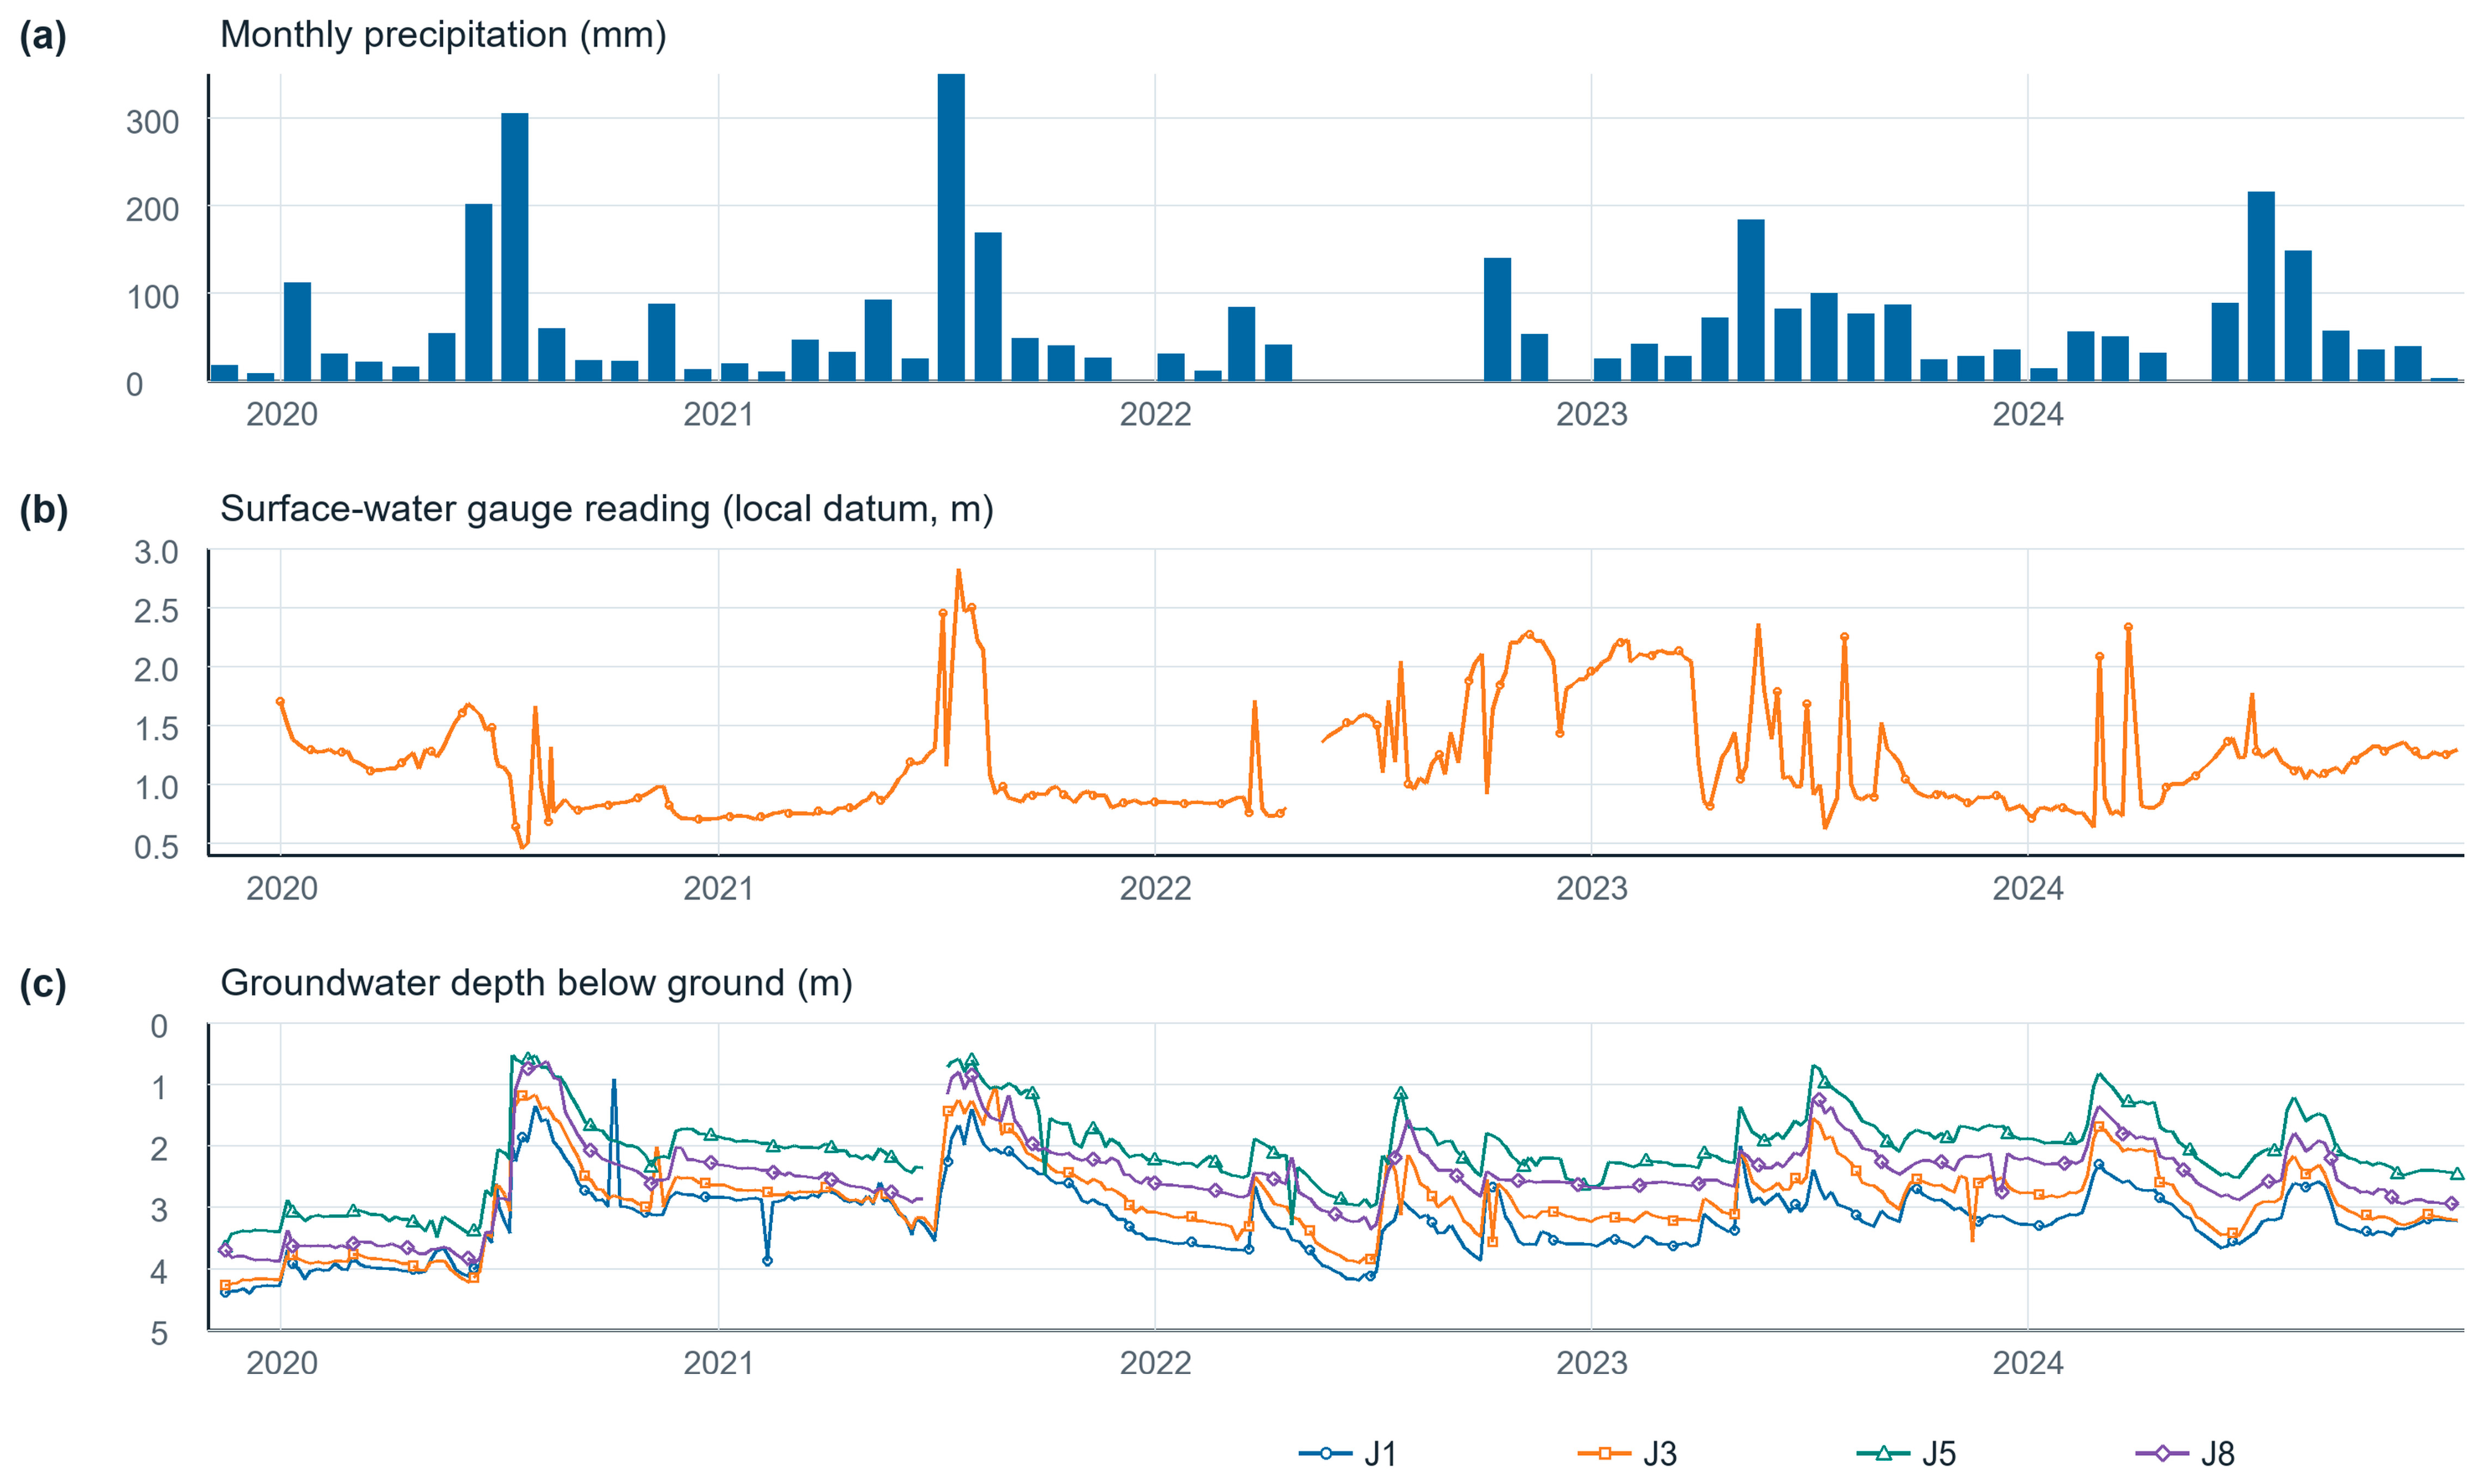
Step-like changes in surface-water level are consistent with gate operation, whereas the groundwater records include seasonal recession, rainfall-related rises, and changes with no corresponding recorded rainfall (
Figure 3). Rainfall and canal stage therefore account for different parts of the record. Given the irregular sampling and changing operating conditions, an empirical stationary transfer function was not fitted.
3.2. Analytical Attenuation and Parameter Sensitivity
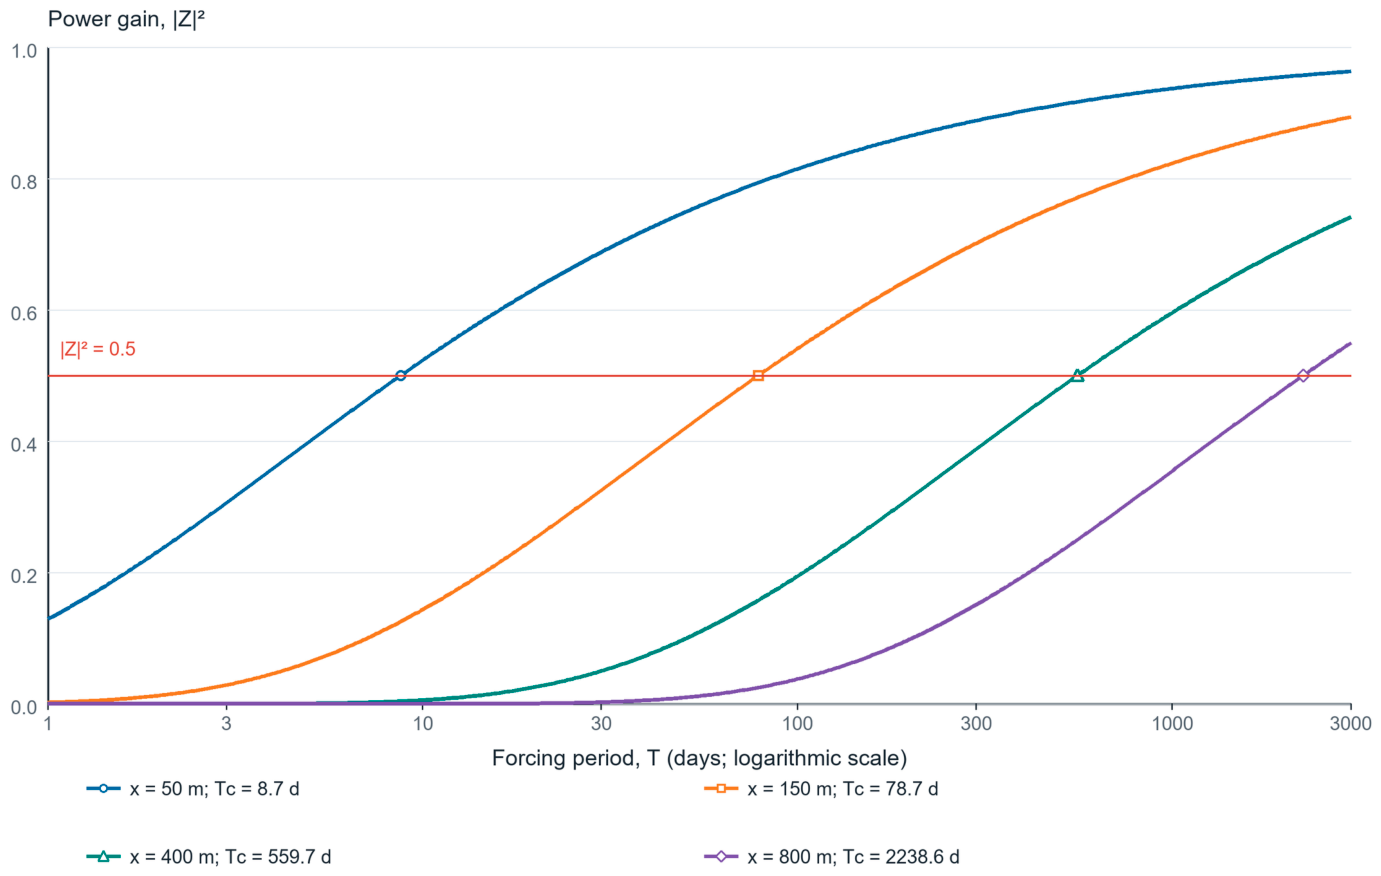
The analytical gain curves show monotonic attenuation with increasing frequency and distance (
Figure 4). For the central diffusivity α = 7477.5 m
2 d
−1, the half-power cutoff period increases quadratically from 8.7 d at 50 m to 78.7 d at 150 m, 559.7 d at 400 m, and 2238.6 d at 800 m. Therefore, a gate cycle that is readily expressed close to the channel may be strongly damped inland even though a sustained stage change can continue to propagate.
Figure 3.
Observed records from November 2019 to December 2024: (a) monthly rainfall, (b) surface-water gauge readings, and (c) groundwater depths at selected J-transect wells. The 2022 rainfall series is shown only for the periods covered by the gauge record. Lines join observations at their recorded dates and are broken across gaps longer than 20 d; symbols are subsampled for legibility. Groundwater depth decreases upward, so a shallower depth represents a higher water level.
Figure 3.
Observed records from November 2019 to December 2024: (a) monthly rainfall, (b) surface-water gauge readings, and (c) groundwater depths at selected J-transect wells. The 2022 rainfall series is shown only for the periods covered by the gauge record. Lines join observations at their recorded dates and are broken across gaps longer than 20 d; symbols are subsampled for legibility. Groundwater depth decreases upward, so a shallower depth represents a higher water level.
Parameter uncertainty changes the response-time scale but not the x
2 dependence. At 150 m, Tc ranges from 56.1 d for the high-diffusivity case to 111.7 d for the low-diffusivity case; at 400 m, the corresponding range is 399.1–794.1 d (
Table 2). In distance form, a 30 d cycle reaches half power at 77.7–109.7 m across the parameter envelope, whereas a 200 d cycle reaches 200.7–283.2 m.
There is no single regulatory radius: the distance over which a canal-stage signal remains appreciable varies with the duration and form of the operation, K, D, Sy, recharge, and heterogeneity. Even in the high-diffusivity case, a harmonic signal at 400 m requires a period of about 399 d to retain half of its input power.
3.3. Harmonic and Step-Response Timescales
The half-power cutoff and the 50% step response describe different boundary histories (
Figure 5). Across α = 5270–10,487 m
2 d
−1, Equation (8) gives t50 = 16.8–33.4 d at 400 m and 67.1–133.5 d at 800 m. These step-response times are shorter than the corresponding harmonic half-power periods because a maintained step contains a persistent low-frequency component.
The step-response curves represent theoretical hydraulic-head timescales under homogeneous one-dimensional conditions. For the central α, t50 is approximately 23.5 d at 400 m and 94.1 d at 800 m; complementary tracer observations would be required to evaluate advective travel time.
3.4. July 2020 Extreme-Rainfall Response
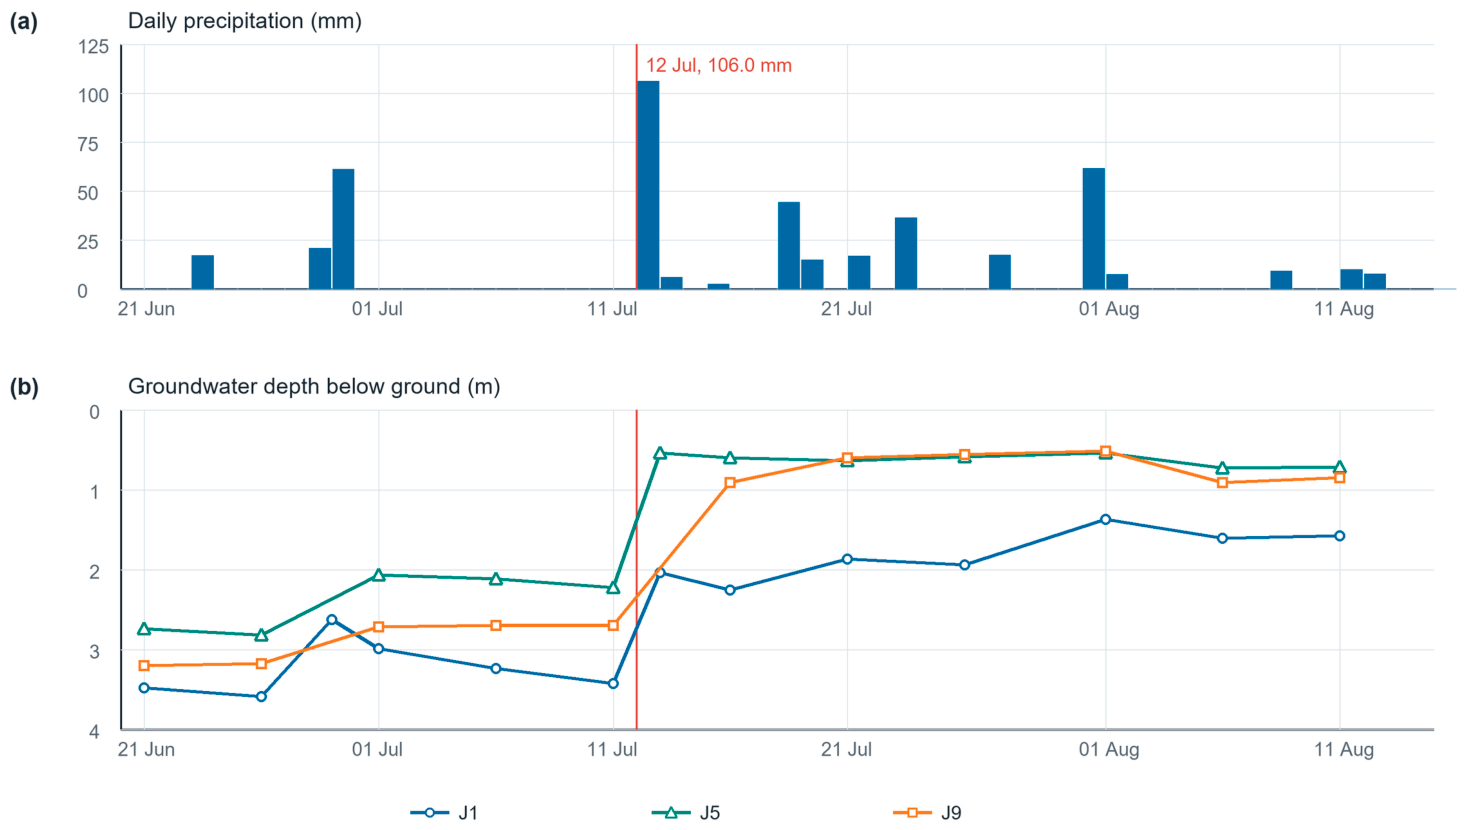
The 106 mm rainfall on 12 July 2020 was followed by a rapid rise across the J transect (
Figure 6). At J1 (0 m), groundwater depth decreased from 3.43 m on 11 July to 2.04 m on 13 July, a 1.39 m rise in 48 h. At J5 (490 m), depth decreased from 2.23 to 0.54 m over the same interval, a 1.69 m rise. J9 (1020 m) was measured at 2.70 m on 11 July and 0.91 m on 16 July, corresponding to a 1.79 m rise over five days; no J9 observation was available on 13 July, so a 48 h response cannot be assigned to that well.
The 12 July storm was followed by repeated rainfall, including 44.2 mm on 18 July, 36.2 mm on 23 July, and 61.5 mm on 31 July; cumulative rainfall from 12 to 31 July was 305.0 mm. J5 remained between 0.54 and 0.64 m depth from 13 July through 1 August, and J9 remained between 0.52 and 0.91 m from 16 July through 6 August. The prolonged shallow levels therefore reflect an event sequence rather than the recession from a single isolated storm.
The rapid inland rise cannot be attributed uniquely from these data. Connected macropores may transmit rainfall through part of the vadose zone, but pressure redistribution and pre-event groundwater storage can also produce a rapid well response. Moreover, the 61.0 mm rainfall on 29 June and the subsequent event sequence rule out an assumption of uniformly dry, fully open cracks immediately before 12 July.
3.5. Interpretation of Rainfall and Canal Effects
The long-term and event-scale observations reveal overlapping forcing modes. Gate management imposes irregular lateral head changes, rainfall supplies spatially distributed vertical input, and groundwater storage integrates both signals over time.
Figure 7 summarizes how matrix flow, connected structural pathways, and wetting-induced swelling may change their relative importance during drying and rainfall.
The wells record shallow-groundwater head, so the July response cannot be assigned uniquely to recharge or pressure transmission. Continued rainfall, drainage, storage, crop water use, and swelling-related changes in conductivity may all have contributed to the persistence of shallow water levels. Nested screens, soil-profile observations, crack measurements, and tracers are needed to separate these effects.
4. Discussion
4.1. Hydraulic Head Propagation Versus Advective Recharge
The analytical solution gives the expected low-pass response of an unconfined aquifer: attenuation varies with period, distance, and diffusivity [Equations (2)–(6)]. In the field, however, gate operation, rainfall, evapotranspiration, and soil conditions vary simultaneously. The harmonic results are therefore used only as reference timescales for this non-stationary record.
A well hydrograph records hydraulic head. Head disturbances can propagate through a connected aquifer without the same water particles traveling from the canal or land surface to the observation point over the observed interval [
24,
25,
26]. The July 2020 data show a rapid head response but do not establish the origin or travel time of the responding water. The signal cannot be assigned solely to phreatic recharge or lateral pressure propagation from these observations.
A rise in canal stage may produce an inland head response, but that response alone does not quantify storage or recharge. Estimating storage change requires Sy and the affected area, while recharge efficiency also depends on canal seepage, drainage outflow, evapotranspiration, pumping, and the other water-balance terms.
4.2. Structural Dynamics of Shajiang Black Soil
The conceptual dual-domain interpretation is consistent with established Vertisol behavior. Regional studies document shrinkage and pore-structure changes in Shajiang black soil [
15,
16], while broader work on cracking and preferential flow supports the proposed pathways [
17,
18,
19,
20,
21,
22]. Because soil cracks evolve with moisture and stress, seasonally varying structural parameters provide a more appropriate representation than a single fixed fracture conductivity or porosity.
The rapid rise and subsequent persistence at inland wells are consistent with macropore flow, but antecedent moisture profiles and crack volume were not measured. Macropore flow therefore remains a possible explanation for this event rather than a validated mechanism across all rainfall conditions.
A suitable test would track volumetric water content through the vadose profile, surface and subsurface crack aperture or volume, vertical head gradients, and the chemistry or isotopic composition of event water. These observations would allow the relative roles of bypass infiltration, matrix wetting, pressure transmission, and post-wetting conductivity reduction to be separated. They would also permit a more defensible assessment of whether preferential pathways increase solute-leaching risk.
4.3. Implications for Canal Operation
The calculated influence distance depends on operating duration. Across the adopted parameter range, a 30 d cycle retains half power within approximately 78–110 m, while a 200 d cycle reaches approximately 201–283 m. At 400 m, the half-power period is approximately 399–794 d. Short gate cycles are therefore most apparent near the bank, whereas sustained seasonal storage can influence a broader area. This time dependence is compatible with local modeling studies showing that managed main-ditch stages can affect groundwater over hundreds of meters when control is maintained [
12,
14].
These values should not be converted directly into a canal-spacing standard. Appropriate spacing and scheduling also depend on stratigraphy, drainage density, crop tolerance, flood-control constraints, pumping, and the required magnitude of response. A practical strategy is to use longer-duration canal storage when drought management and safety constraints permit, monitor near-bank waterlogging risk, and supplement lateral regulation with field-scale drainage or pumping where interior blocks respond too slowly. Performance should be assessed using both head and water-balance metrics.
4.4. Limitations and Future Work
The main limitations are the five-day sampling interval and incomplete supporting records. Sub-daily lags and empirical coherence could not be resolved, and missing gate-command, pumping, irrigation, evapotranspiration, and canal-flow data precluded a complete water balance. The one-dimensional homogeneous solution also omits three-dimensional flow, heterogeneity, vertical gradients, and moisture-dependent parameters, so the calculated ranges remain conditional on the adopted K, D, and Sy values.
Soil moisture, crack volume, nested heads, and tracers were not measured during 2020, and the storm response therefore cannot be attributed uniquely. Future field campaigns should combine these measurements with repeated imaging or geophysical observations of crack evolution. The resulting data could constrain a coupled Richards-equation/shallow-groundwater model with moisture-dependent matrix–macropore exchange and, where needed, a hydromechanical component.
5. Conclusions
The Chezegou record and analytical calculations show that groundwater response varies with forcing duration and with the pathways through which water and pressure are transmitted.
Using |Z|2 = 1/2, the half-power cutoff for α = 5270–10,487 m2 d−1 is 56.1–111.7 d at 150 m and 399.1–794.1 d at 400 m. A 30 d cycle has a half-power distance of approximately 77.7–109.7 m. These calculations show strong attenuation of short-period gate signals with distance and do not support a fixed regulatory radius or universal canal-spacing limit.
The 106 mm storm on 12 July 2020 was followed by a 1.69 m groundwater-level rise at J5 (490 m) within 48 h and a 1.79 m rise at J9 (1020 m) over five days. These measured shallow-groundwater head responses may reflect contributions from vertical recharge and/or hydraulic-pressure transmission. Nested piezometers, soil-profile observations, water-balance data, and tracers would help quantify their relative contributions.
The event behavior and established shrink-swell properties of Shajiang black soil are consistent with matrix–macropore interaction, although contemporaneous moisture and crack measurements are needed to test this mechanism. Canal-stage scheduling should be matched to the duration-dependent aquifer response and evaluated using both groundwater head and volumetric water-balance measurements.