


Abstract
Reservoir release induced flooding is a major downstream hazard worldwide, yet most warning systems rely on hydraulic modeling and underuse real time reservoir operation data. This study presents a data driven framework to detect flood discharge events, assess downstream operational severity, and forecast daily discharges using deep learning. The approach was validated at the Ba Ha hydropower reservoir (Vietnam) with inflow, discharge, water level, and CHIRPS rainfall data to represent basin-scale precipitation forcing. More than 160 discharge events were identified using a composite Operational Severity Index (OSI) based on peak discharge, duration, and rise rate; although only ~2% were extreme, they posed the greatest risks. Among three Transformer-based models, Informer achieved the best short-term forecasting performance (RMSE ≈ 78 m3/s, R2 ≈ 0.80), while Autoformer showed greater stability at longer horizons (3–7 days). In contrast, all models exhibited reduced skill under abrupt and extreme discharge conditions. These results demonstrate that combining trend and anomaly-aware modeling enables reliable discharge prediction and severity assessment without complex hydraulic simulations. The proposed framework provides a practical foundation for reservoir early warning systems by transforming routine operational data into actionable flood-risk information.
1. Introduction
Numerous studies examined the overall role of reservoirs in power generation, irrigation, and water security, while addressing associated environmental and climate challenges. Ref. [1] provided a global overview of hydropower and irrigation dam development trends, highlighting conflicts between energy benefits and environmental consequences. Ref. [2] built on this perspective by examining the balance between hydropower, water management, and ecological conservation under changing climate conditions. Refs. [3,4] analyzed the role of energy systems, including hydropower, in achieving large-scale emission reduction and climate adaptation goals. Ref. [5] showed that the effectiveness of dams in moderating flood flows in India decreases as hydrological extremes intensify under climate change. However, these studies primarily addressed the issue at the long-term strategic or policy scale, without assessing the direct influence of reservoirs on downstream flow and flooding.
Existing literature extensively demonstrated that reservoir operation and river regulation can substantially alter discharge peaks, timing, and inundation regimes in regulated river systems worldwide [6,7,8], primarily due to the combined effects of flow control, infrastructure regulation, and climatic variability. Many existing studies addressed these dynamics through hydraulic modelling, most commonly using one or two dimensional frameworks such as HEC-RAS to simulate downstream flooding and assess operational or economic implications [9,10]. At broader scales, research also examined extreme discharge peaks associated with dam failures or abrupt regulatory changes [11,12,13], while [14] explored alternative analytical frameworks for dam-related discharge processes. However, despite their methodological sophistication, these studies largely relied on complex hydraulic simulations or post-event analyses and focused on reproducing flow or inundation patterns. As a result, they provided limited capability for directly extracting operationally meaningful indicators from routinely available reservoir operation data, thereby constraining their applicability for continuous discharge analysis and real-time reservoir operation assessment. This limitation highlighted the need for operation data driven approaches that can transform routine operational data into actionable information for real-time analysis.
Methodologically, prior works utilized hydrological models or machine learning to simulate and predict reservoir flow and operation. Studies such as [15,16] compared machine learning algorithms for real-time reservoir operation simulation, while [17] developed a data driven reservoir operation model and [18] investigated operational severity within multi-objective reservoir systems. At larger scales, refs. [19,20] focused on hydropower simulation and water resource planning, and deep learning approaches have also been applied to river discharge prediction [7,21]. However, these studies generally addressed forecasting, simulation, or optimization as separate tasks, without explicitly linking discharge prediction to event-based operational severity assessment and downstream early warning applications. In particular, the integration of (i) event-based discharge identification, (ii) quantitative operational severity characterization, and (iii) multihorizon forecasting within a unified operational data driven framework remains limited in the existing literature. Addressing this gap was essential for transforming routinely available reservoir operation data into actionable information for real-time risk-aware reservoir management.
Globally, reservoir operations played a crucial role in balancing hydropower production, flood control, irrigation supply, and environmental sustainability. However, the increasing frequency of hydrological extremes and rapid operational adjustments have raised concerns about downstream flood risks and operational safety in many regulated river systems. These challenges were particularly pronounced in monsoon-dominated regions of Southeast Asia, where steep terrain and intense rainfall generated rapid flood responses, making reservoir operation an essential component of flood risk management. Vietnam rapidly expanded hydropower and reservoir infrastructure to support energy production and water resource regulation. In central Vietnam, steep terrain and intense monsoon rainfall frequently generated rapid flood responses, making reservoir operation a key factor influencing downstream flood risk and water level fluctuations [22,23,24,25]. Therefore, improving data driven tools for monitoring and forecasting reservoir discharge was important for enhancing reservoir operation management and downstream flood preparedness [26].
Although previous studies applied hydraulic modelling, statistical analysis, and machine learning techniques to investigate reservoir operations and discharge dynamics, most of them focused either on flow simulation, operational optimization, or discharge prediction separately. Few studies integrated event-based discharge identification, operational severity assessment, and data driven forecasting within a unified analytical framework. To address this gap, this study investigated the following research questions: (1) how high-discharge release events could be systematically identified from routine reservoir operation data? (2) How the operational severity of these events could be quantitatively characterized? (3) To what extent deep learning models could support short-term forecasting of reservoir discharge dynamics? It was hypothesized that integrating event detection, operational severity metrics, and data driven forecasting within a unified operational-data framework could provide a more comprehensive understanding of reservoir discharge dynamics and support early-warning-oriented reservoir management.
In this context, this study proposed a fully integrated approach framework based on reservoir operation data, combining: (1) flood discharge event identification from daily discharge series; (2) hydrological operational dynamics analysis using multidimensional time series analysis tools such as autocorrelation function (ACF), cross-correlation function (CCF), mutual information (MI), and Spearman’s rank correlation coefficient; (3) development of a composite OSI based on peak discharge, duration, and rate of increase; and (4) test discharge prediction using three specialized deep learning models for time series (Autoformer, Informer, iTransformer) to assess their potential for early warning support of severe discharge release episodes. The framework did not require traditional hydraulic models and operated directly on routinely available operational data, making it a practical and transferable framework for reservoir systems where detailed hydraulic models or dense monitoring networks were not available.
2. Materials and Methods
2.1. Case Study and Data
This section presents the study area and the dataset used to implement and validate the proposed methodology framework. In the scope of the study, the Ba Ha hydropower reservoir was selected as a test case due to its continuously operating and publicly available real time dataset. The study used operational reservoir data covering the period 2018–2025 with daily temporal resolution, including inflow, discharge, upstream and downstream water levels, and power generation. Satellite rainfall data were obtained from the CHIRPS dataset with a spatial resolution of 0.05° and daily temporal resolution. After preprocessing and feature construction, the dataset was sorted chronologically and sequentially divided into training (70%), validation (15%), and testing (15%) subsets for forecasting model development.
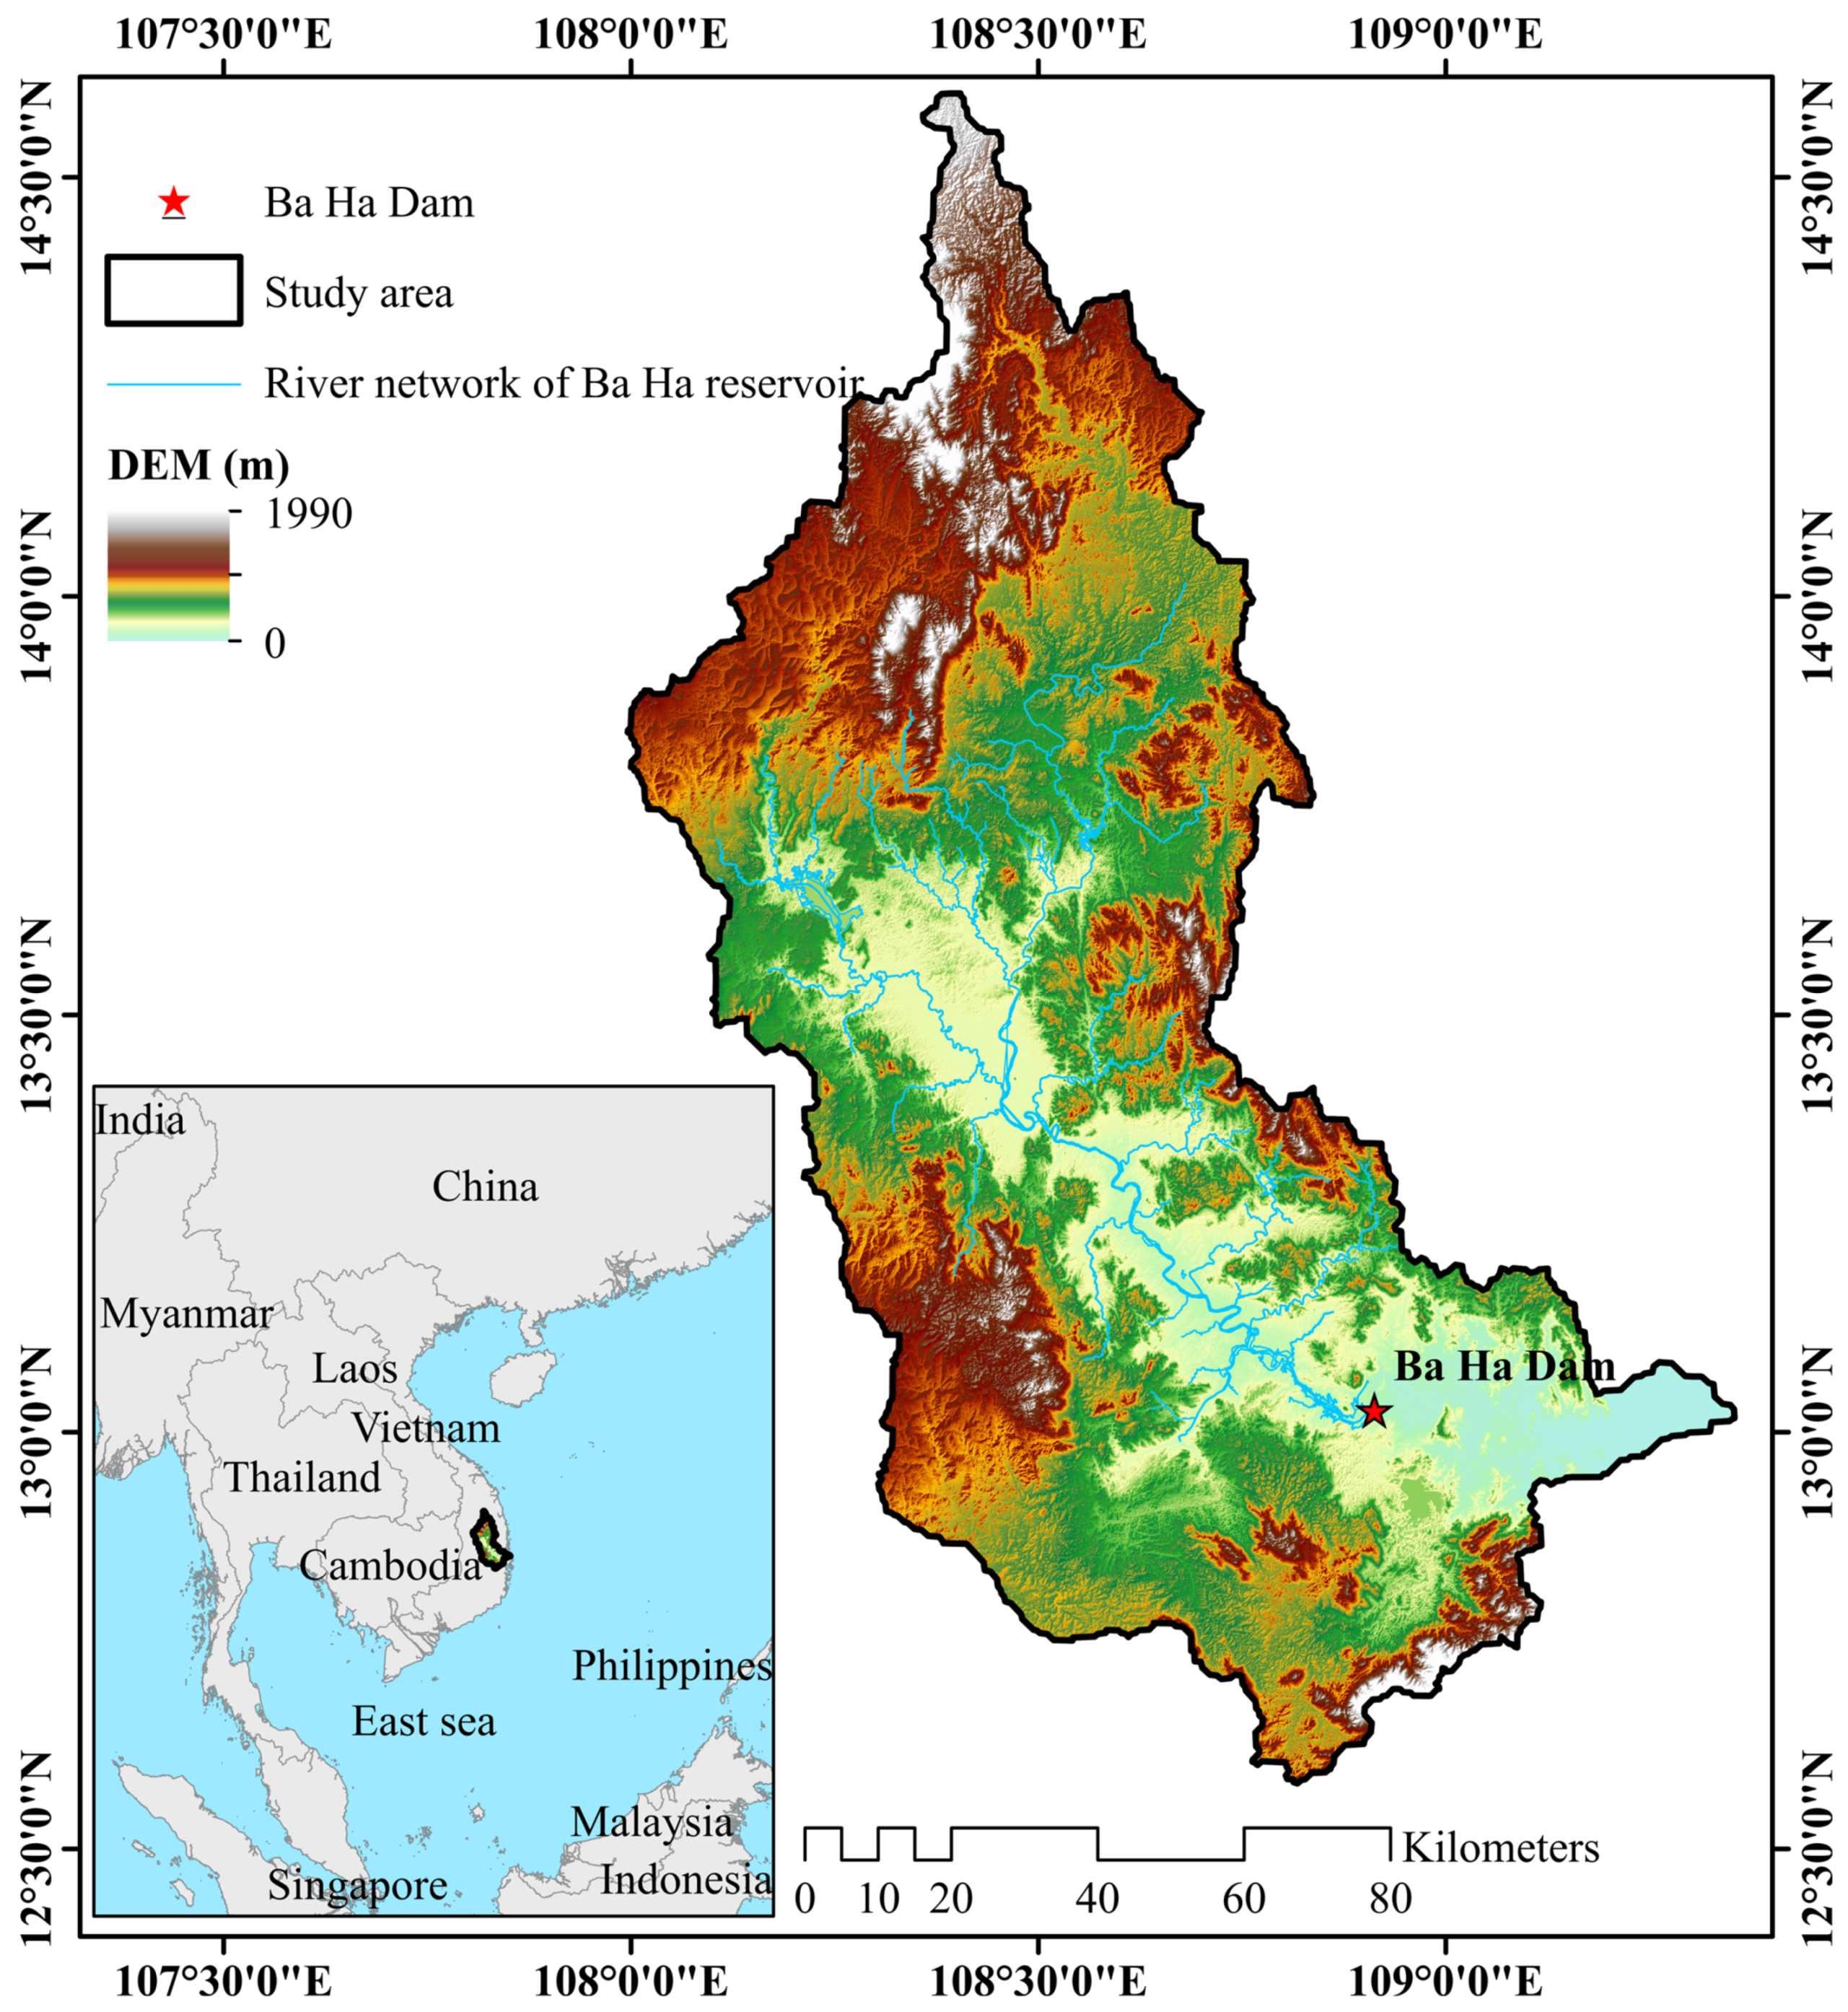
Ba Ha Hydropower Reservoir (Figure 1) is located on the Ba River, Central Vietnam, at approximately 13.21–13.35° N and 109.05–109.25° E, covering an area of approximately 13,900 km2 [27]. This is a basin with a sloping terrain from the Central Highlands to the coast, creating conditions for the formation of a rapidly concentrated and strongly fluctuating flow during the rainy season. Ref. [28] reported that the rainy season in the Central Highlands is closely associated with the active phase of the Asian monsoon. There are two distinct seasons, namely rainy and dry seasons, during the rainy season (May–October) with annual rainfall often varying around 1200–2700 mm [29]. These conditions are associated with frequent high-flow events. The characteristic hydrological response of rapid flow rise and recession means that reservoir operation decisions can strongly influence downstream water levels. The basin spans the provinces of Gia Lai, Dak Lak and Phu Yen and supports a population of about 1.6 million people, with the local economy strongly dependent on agriculture and forestry. Because a large proportion of the population relies on climate sensitive agricultural activities, water resources management and reservoir operation play an important role in supporting regional socio-economic stability and mitigating flood risks [27]. Overall, the Ba River Basin plays an important role in regional socio-economic development, supporting agricultural production, hydropower generation, and domestic water supply for downstream communities. The basin is characterized by densely populated areas and intensive agricultural activities, making it particularly vulnerable to rapid changes in reservoir discharge. In this context, abrupt release events can directly affect downstream livelihoods and infrastructure, highlighting the importance of reliable discharge forecasting and operational severity assessment. Therefore, the selection of the Ba Ha reservoir is not only based on data availability, but also on its critical role in managing water resources and mitigating downstream risks in a socio-economically significant basin.
Figure 1.
Location of the Ba Ha hydropower reservoir in the Ba River Basin, Central Vietnam.
Ba Ha Reservoir was selected as a case study because: (i) it has a flood discharge operation regime that depends simultaneously on hydrological fluctuations and power generation demand; (ii) operational data is continuously published in real time, a suitable condition for data-based research; and (iii) it has a history of many discharges with very rapid flow rate increases, suitable for verifying event identification methods, operational severity assessment and discharge forecasting models. The reservoir operation data series was collected from the public information page of Ba Ha Hydropower Plant during the period 2018–2025, including inflow (inflow, m3/s), discharge (discharge, m3/s), upstream water levels (m), downstream water levels (m), and power generation (kWh). Data are publicly available at: https://sbh.vn/vi-VN/san-xuat/Tinh-hinh-san-xuat-60-1300 (accessed on 23 November 2025). The analysis period (2018–2025) was selected based on the availability of continuous and consistent daily operational records.
2.2. Satellite Rainfall Data
Rainfall data are integrated from the CHIRPS (Climate Hazards Group Infrared Precipitation with Stations) dataset with a resolution of 0.05° and a daily frequency. CHIRPS was chosen over other global rainfall datasets such as TMPA (TRMM Multisatellite Precipitation Analysis) and MSWEP (Multi-Source Weighted-Ensemble Precipitation) because it has been widely applied in hydrological studies for drought monitoring, early warning, and assessing hydrological responses to climate variability [30], and satellite-based rainfall datasets have been shown to be particularly useful for hydrological analysis in topographically complex and tropical regions [31], including applications in Vietnam and the Mekong Basin [32,33].
The original data with mixed hourly and daily frequencies were synchronized to daily frequencies by linear interpolation and representative values were taken (max/mean depending on the variable). Time drifts, blanks and noise were treated using spline/linear interpolation and Savitzky-Golay smoothing [34] to retain the important rainfall peak structure for discharge analysis but reduce random fluctuations. After processing, the dataset was sorted by date and split chronologically into training (70%), validation (15%), and testing (15%) subsets. The training subset was used for model fitting, the validation subset was used for model selection and early stopping, and the testing subset was reserved for final performance evaluation. No random shuffling was applied across the full dataset, thereby ensuring a realistic forecasting setup and preventing data leakage.
2.3. Overall Workflow of the Proposed Framework
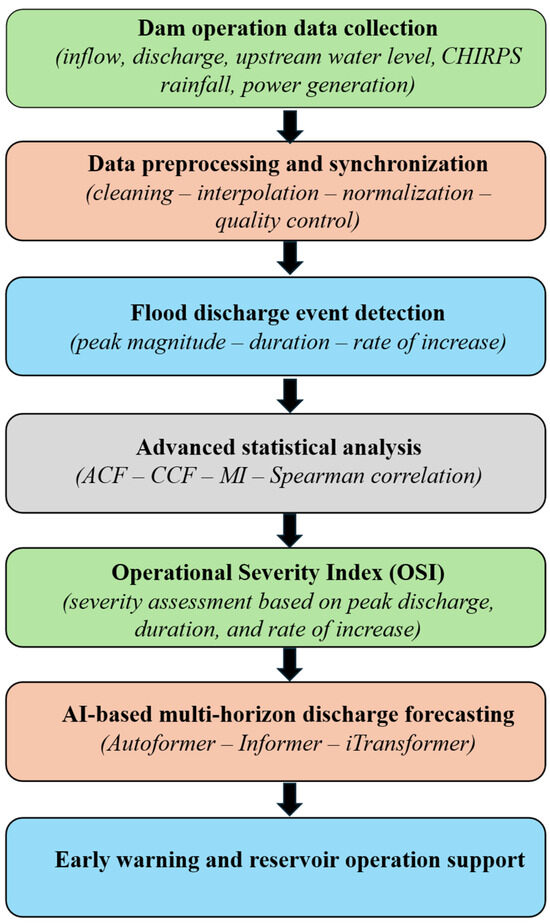
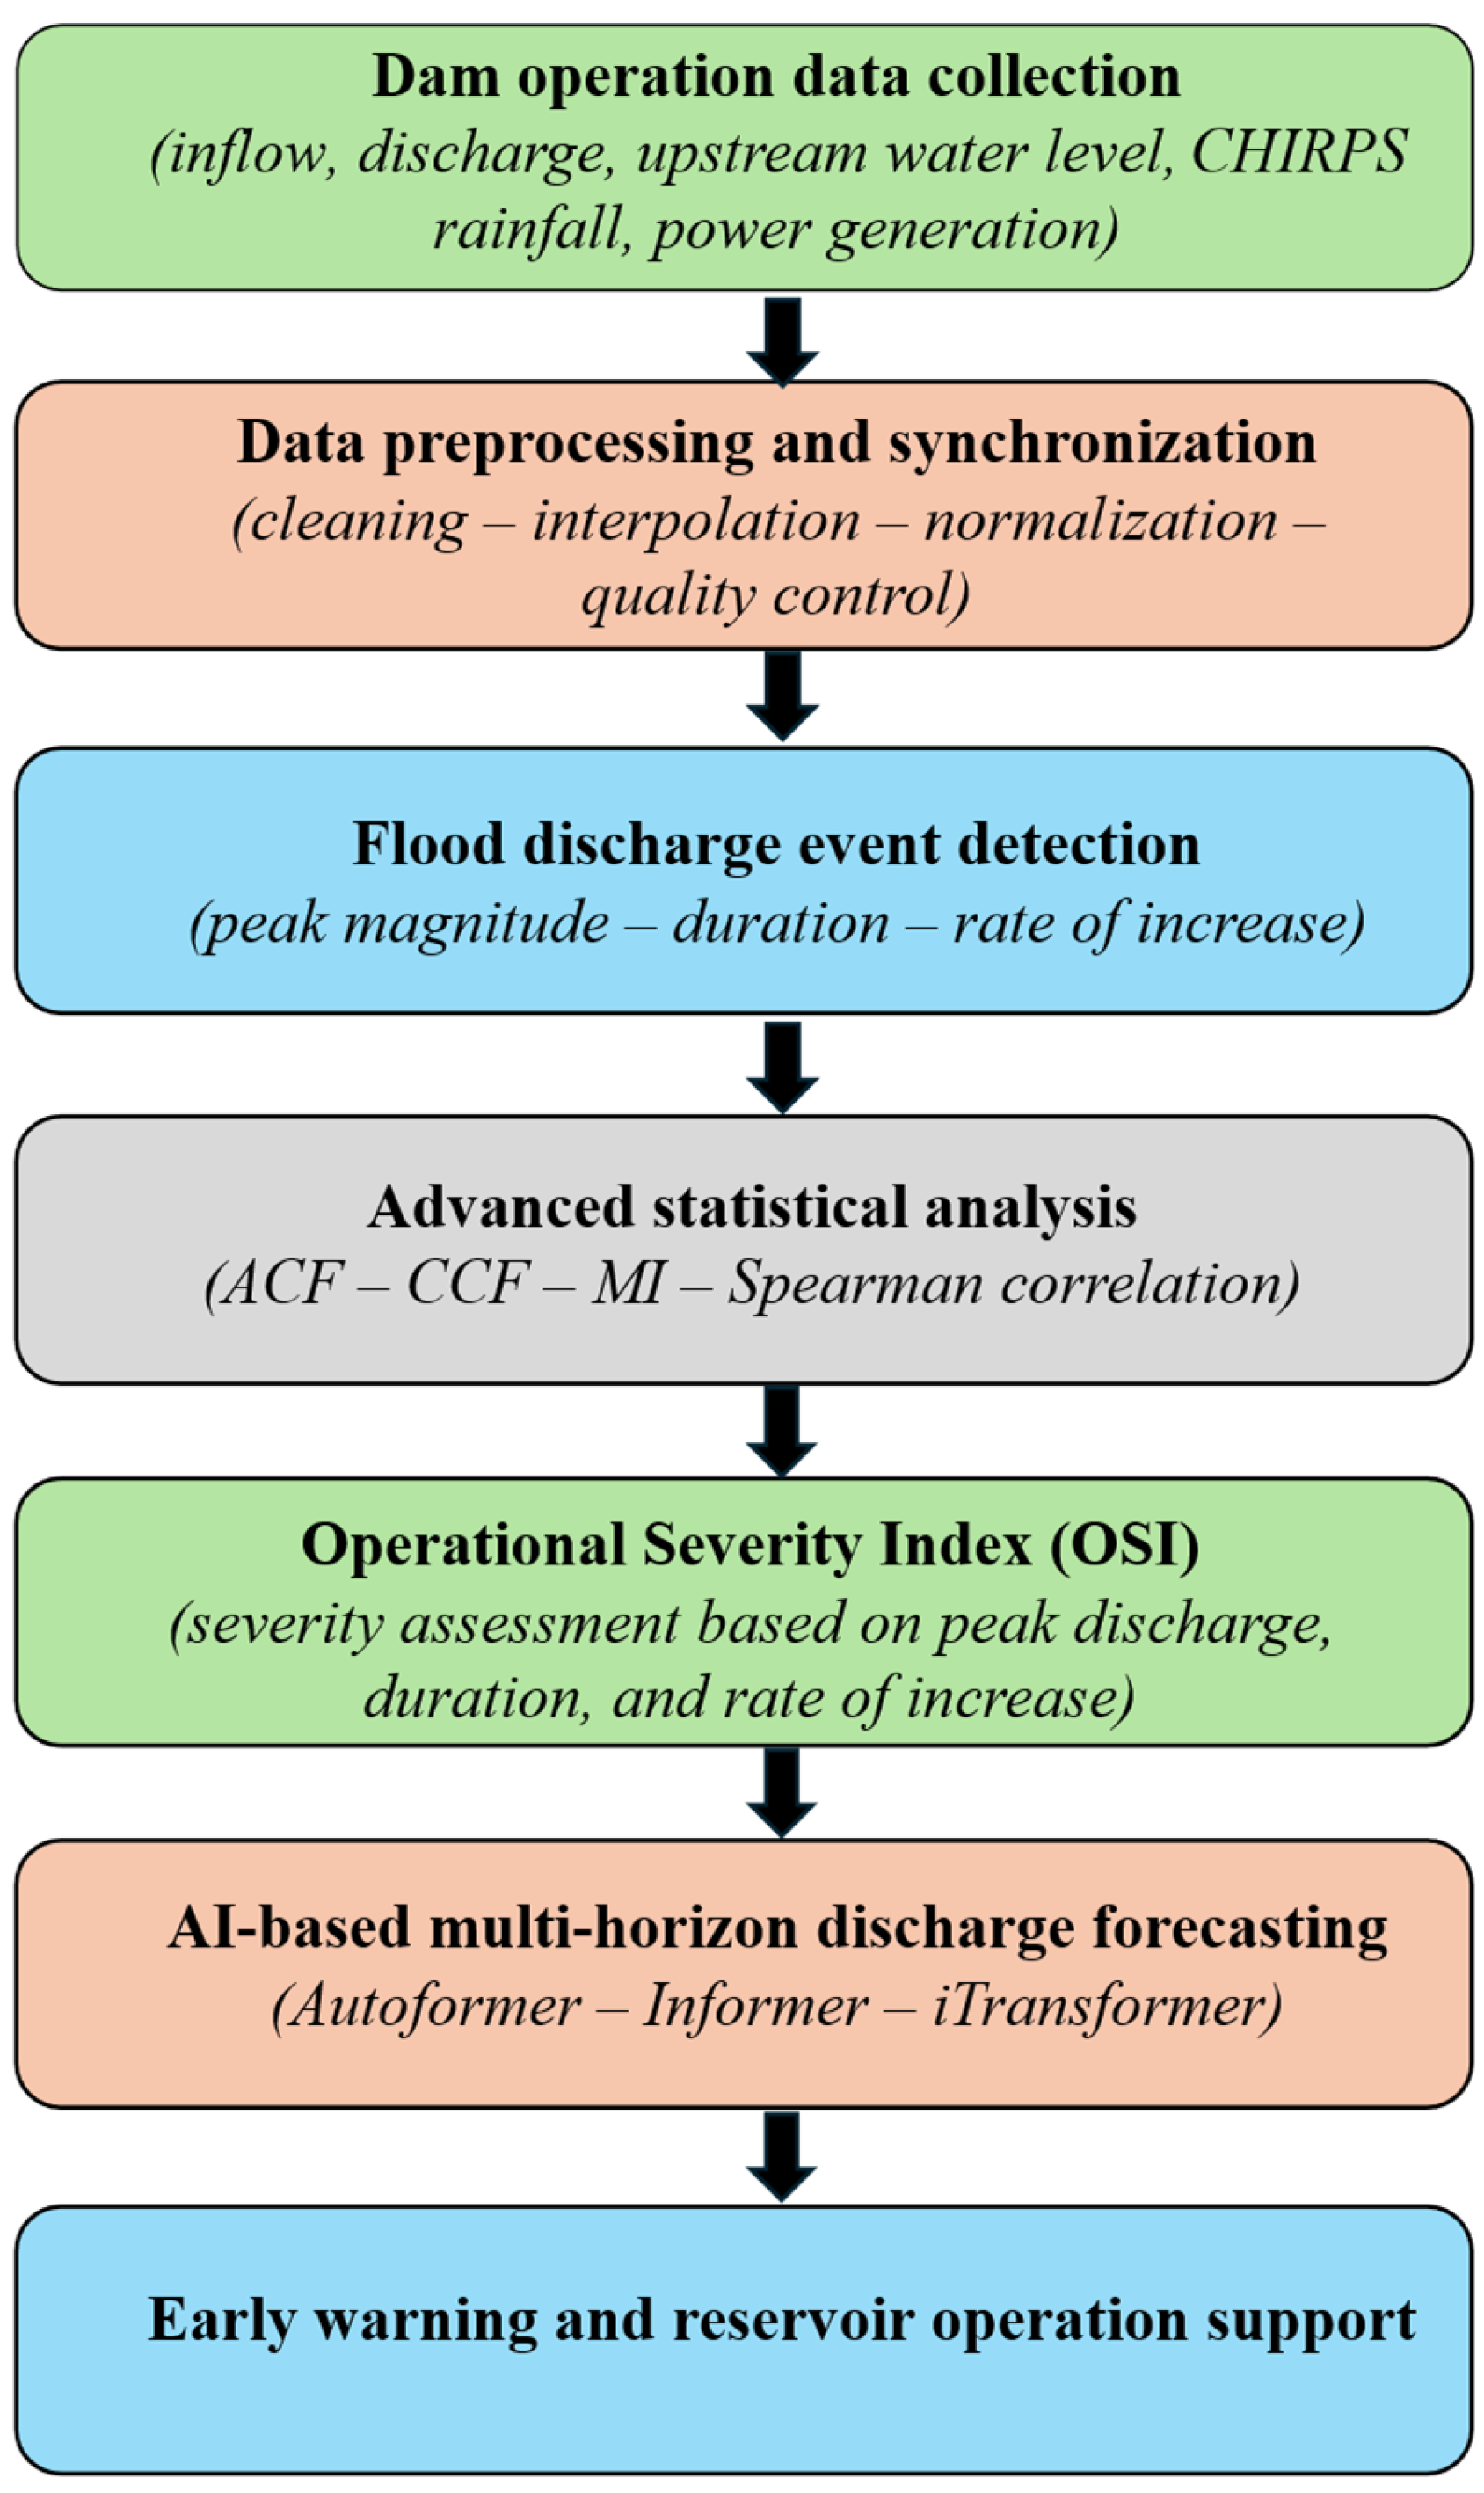
The workflow begins with the collection and synchronization of real-time reservoir operation data, including inflow, discharge, upstream and downstream water levels, power generation, and CHIRPS rainfall (Figure 2). After preprocessing, the discharge series are used to identify flood discharge events based on statistical thresholds and change rates to extract three important physical features: discharge peak, duration, and growth rate. Next, ACF-CCF-MI-Spearman analyses are performed to explore the dynamic structure of the regulation system and determine both linear and nonlinear dependencies between discharge and operational variables. From the three event features, a composite OSI is constructed to quantify the operational severity for each flood discharge event. In parallel, deep learning models (Informer, Autoformer, and iTransformer) were trained and validated for 1-, 3-, and 7-day forecasts to assess the potential for predicting discharges from real-world operating sequences. Combining the AI model’s forecast trends with event-based operational severity metrics allowed for enhanced early detection of sudden increases in discharge rates, an important basis for operational severity screening and reservoir operation decision support.
Figure 2.
Flowchart of the proposed reservoir operation-based discharge severity analysis and forecasting framework.
2.4. Discharge Event Detection
To characterize flood release dynamics in event form rather than as a continuous series, flood discharge events were identified from the daily discharge record using three criteria. A day was classified as a high-discharge day if at least one of the following conditions was met: (i) discharge exceeded the 90th percentile of the full daily discharge series during 2018–2025, representing unusually high releases relative to the historical operational regime; (ii) the day-to-day discharge increase () exceeded 500 m3/s/day, selected based on exploratory analysis of the discharge variability to capture abrupt operational release escalation; or (iii) daily rainfall exceeded 50 mm/day, representing heavy rainfall conditions commonly associated with rapid inflow increases in the basin. The first threshold is data-driven, whereas the latter two are heuristic screening criteria selected for event detection in the present case study.
It should be noted that the daily rainfall threshold does not distinguish between short-duration intense bursts and evenly distributed rainfall, which may introduce uncertainty in event identification. Furthermore, these thresholds are intended to identify operationally significant release episodes rather than to define universal hydrological thresholds, and their transferability to other reservoirs may require local recalibration or adaptive threshold selection.
2.5. Time Series Analysis (ACF, CCF, MI, Spearman Correlation)
To explore the dynamic structure of the reservoir operation chain and the response mechanism of discharge to hydrological-regulatory signals, this study applied a combination of four groups of time series statistical analysis. First, ACF is used to assess the dependence of discharge on its own past values, thereby reflecting the inertia and periodicity in the discharge regime of the reservoir [35].
The CCF was deployed to check the lag between discharge and key input variables including inflow, upstream and downstream water levels, power generation output and rainfall, allowing quantification of the reservoir’s response speed to hydrological fluctuations and power generation demand [36].
In parallel with the two linear analyses above, the study continues to apply to measure the degree of nonlinear dependence between discharge and the remaining variables. helps to identify complex relationships that ACF/CCF may miss in the case of nonlinear series, sudden fluctuations or skewed distributions [37]. measures nonlinear dependence between two variables and is defined as:
where is the joint probability and , are marginal probability.
Finally, to assess the degree of hierarchical relationship stability in the face of noise and irregular distributions, the study deploys Spearman’s rank correlation between discharge and explanatory variables. The Spearman correlation allows us to determine the strength and weakness of the relationship according to rank, useful in the context of flood discharge stages often having sudden amplitudes, making linear correlations no longer accurately reflect the actual level of dependence [38,39].
The simultaneous combination of ACF, CCF, and Spearman allow to describe the reservoir’s operating mechanism at multiple layers: (i) inertia and discharge period (ACF), (ii) response rate and lag to input variables (CCF), (iii) nonlinear dependency structure () and (iv) robustness of hierarchical relationships to disturbances (Spearman). This multi-layered analysis provides a solid quantitative foundation for explaining discharge behavior, identifying extreme events and selecting optimal input variables for deep learning models.
2.6. Operational Severity Index (OSI)
All three components are standardized on a 0–100 scale to remove unit effects and ensure equal contribution to the composite index (Table 1).
Table 1.
Components and normalization scheme of the Operational Severity Index. All components are normalized to a 0–100 scale using a consistent min-max approach.
Based on these components, the provides a multidimensional description of the severity of discharge release episodes from an operational perspective, without directly representing downstream damages on society. is calculated as the arithmetic mean of the standardized peak discharge, rate of change, and duration:
: normalized peak release magnitude;
: normalized release abruptness (operational shock potential);
: normalized persistence of high-release conditions.
For interpretability, values are grouped into four relative severity classes: mild ( < 40), moderate (40–60), severe (60–80), and extreme ( > 80). These class boundaries are heuristic and used to facilitate comparative analysis of discharge severity across events, rather than to define absolute physical or damage thresholds.
2.7. Deep Learning Models (Autoformer, Informer, and iTransformer)
To test the potential of discharge forecasting from real-time reservoir operation data, the study implemented three dedicated deep learning models for time series: Autoformer, Informer, and iTransformer, which are all models belonging to the Transformers-based forecasting generation but targeting different characteristics of time series data. Transformer-based models were selected due to their superior ability to capture complex feature interactions and long-range dependencies, which are critical in hydrological systems. Compared to traditional recurrent models such as LSTM and GRU, which may exhibit lower accuracy and limited capability in handling long-sequences and outliers, Transformer architectures provide enhanced performance in modeling complex and highly variable discharge dynamics [40,41,42].
Autoformer introduces a decomposition architecture that separates time series into trend and seasonal components and applies an auto-correlation attention mechanism to capture long-term temporal dependencies [43]. Informer improves computational efficiency for long-sequence forecasting through a ProbSparse self-attention mechanism that focuses on dominant attention scores while reducing complexity [44]. iTransformer adopts an inverted attention structure in which attention is applied across variables rather than across time steps, allowing more efficient modeling of multivariate time series relationships [45]. These three models represent different Transformer design philosophies and therefore allow a comparative evaluation of forecasting performance under complex reservoir operation dynamics.
The input variables include inflow, upstream and downstream water levels, power generation, and CHIRPS rainfall, representing two groups of mechanisms that influence discharge: (i) hydrological fluctuations (inflow and rainfall) and (ii) reservoir operational decisions (water levels and power generation). Power generation is not treated as a direct hydrological forcing variable but as an operational indicator reflecting turbine discharge and reservoir release decisions.
The output variables are the forecast discharge at three different forecast horizons: 1, 3, and 7 days, corresponding to short-term, medium-term, and weekly warning trends. The dataset was split chronologically into training (70%), validation (15%), and testing (15%) subsets to preserve temporal structure and avoid information leakage. All models were trained for up to 300 epochs using the Adam optimizer, with RobustScaler applied to reduce the influence of extremes. Early stopping and training-validation loss monitoring were used to control overfitting and assess model generalization. The training and validation procedures were standardized across all models to ensure fair comparison.
Forecast performance was evaluated using Root Mean Square Error (RMSE), Mean Absolute Error (MAE), Mean Absolute Percentage Error (MAPE), and the coefficient of determination ), which together provide complementary measures of model accuracy and variability explanation. RMSE and MAE quantify absolute errors, MAPE reflects relative error in percentage terms, and measures the proportion of variance explained by the model. The corresponding equations are given as follows:
When , the model fits perfectly; , the model does not improve on the mean, and can take negative values when model predictions perform worse than a baseline predictor using the mean of observations.
Overall, the predictive modeling framework aims not only to forecast discharge values but also to test the feasibility of using operational data to forecast operational severity. By comparing the performance of three models for three forecasting periods, the study can show which model is best suited for early warning, which model is most stable when uncertainty increases, and the current limits of AI when working with highly variable hydrological chains. The above methodology framework is designed to be independent of geographical areas and can be applied to many reservoir systems with real-time operational data. To verify the feasibility and effectiveness of the method, the study applies the entire process to the Ba Ha hydropower reservoir-a typical case with an operating regime simultaneously governed by hydrological fluctuations and power generation demand.
3. Results and Discussion
3.1. Statistics and Discharge Event Detection
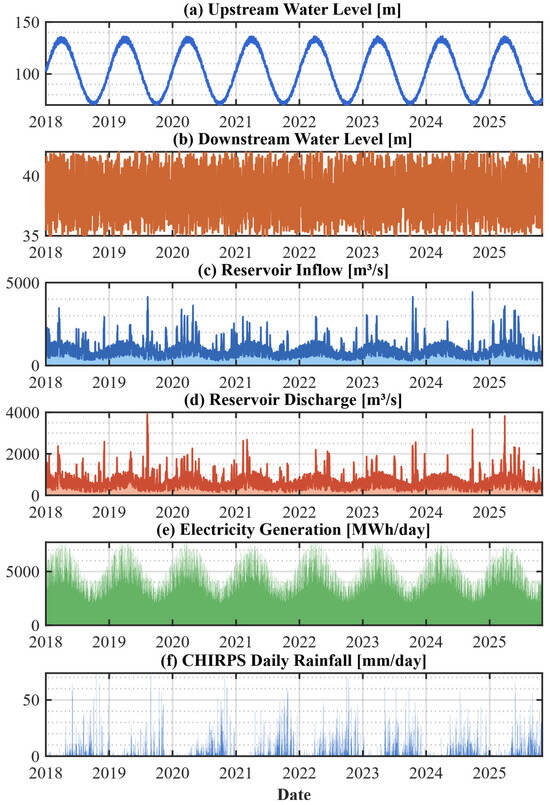
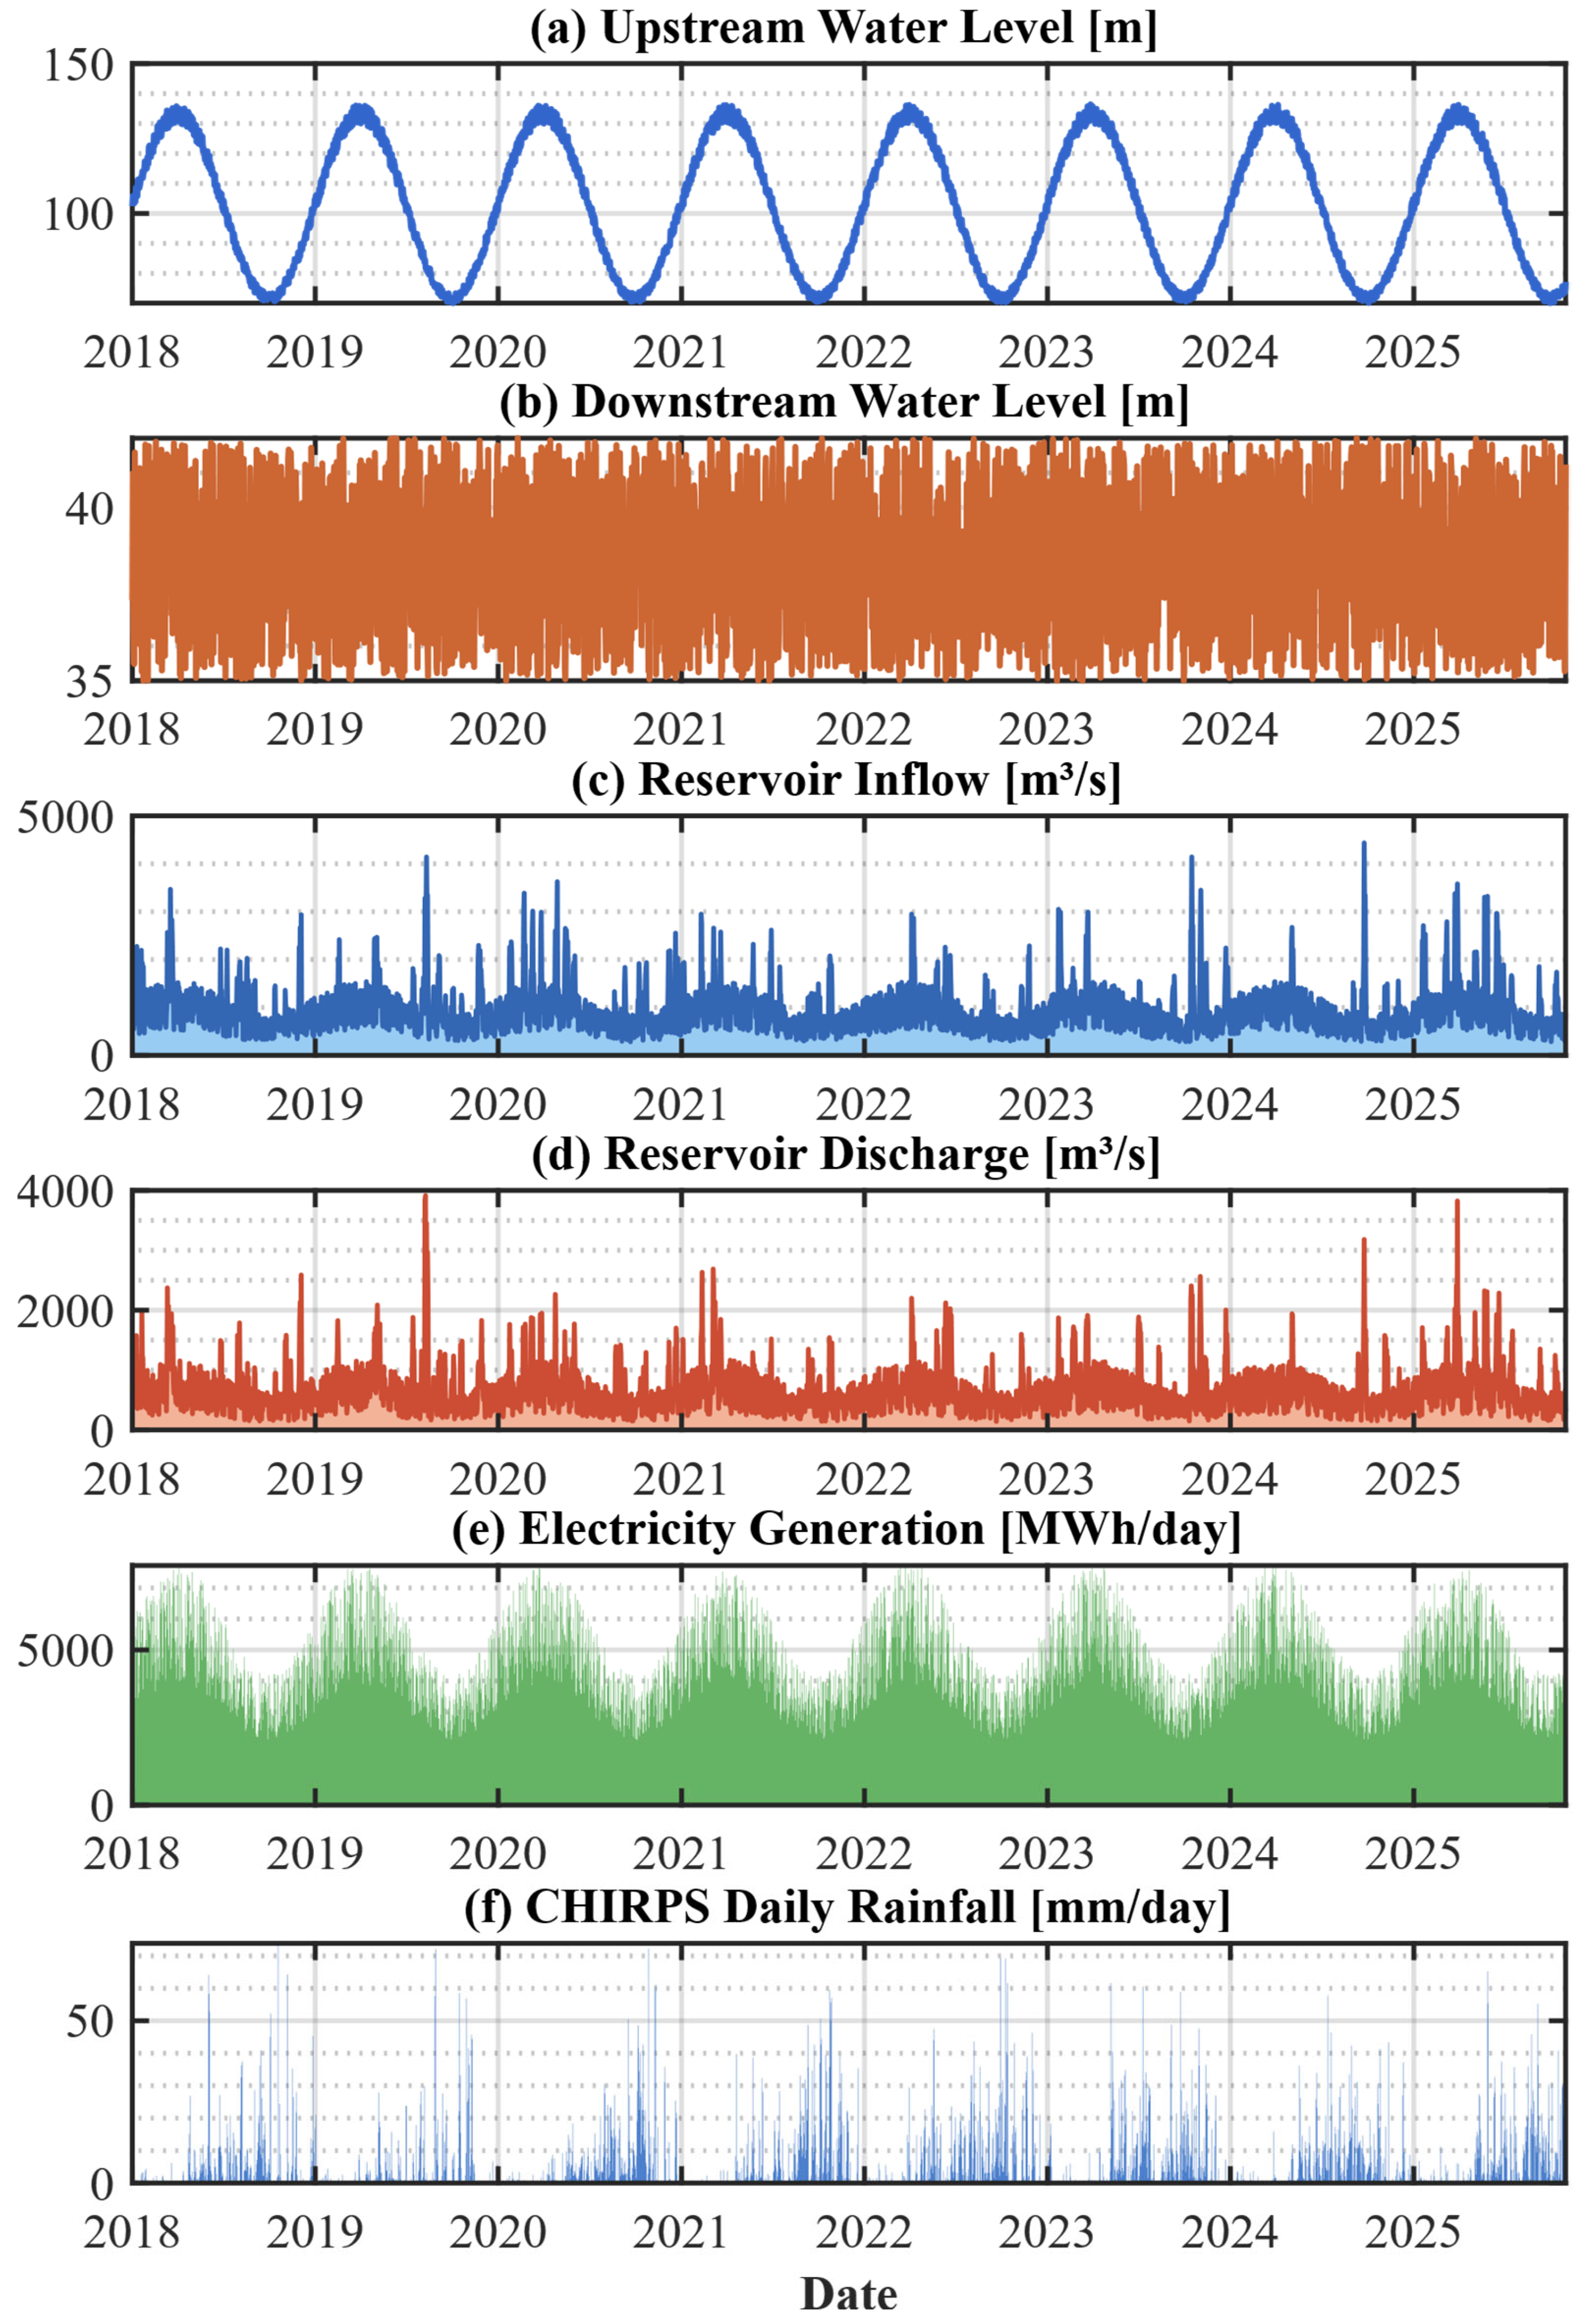
The seasonal operating structure of the Ba Ha reservoir during the study period is illustrated in Figure 3. The upstream water level (Figure 3a) fluctuates within a narrow band around the design elevation, only slightly increasing during the flood season and gradually decreasing during the dry season. In contrast, the downstream water level fluctuates with a much smaller amplitude, proving that the reservoir plays a buffer role, eliminating a significant part of the natural water level fluctuations and contributing to stabilizing the flow conditions for the downstream area. The flattening of the downstream water level compared to the upstream is direct evidence of the discharge regulation function of the reservoir.
Figure 3.
Time series of key operational and hydrological variables at Ba Ha reservoir during 2018–2025: (a) upstream water level, (b) downstream water level, (c) inflow, (d) discharge, (e) power generation, and (f) CHIRPS rainfall.
The inflow series (Figure 3b) shows sudden increases in the rainy season, which coincide with the heavy rains from CHIRPS data (Figure 3e). The inflow peaks not only appear in individual events but also in seasonal-annual clusters, reflecting the seasonal rainfall characteristics of the Central region. Comparing Figure 3b,c, it is shown that discharge peaks often appear almost simultaneously with inflow peaks, especially in the flood seasons of 2022, 2023, and 2024, demonstrating the discharge according to the incoming water operating strategy to keep the reservoir water level stable within safe limits. This is consistent with the cross-correlation analysis results in the following section: the variables inflow, water level, and power generation have the highest correlation with discharge in the vicinity of lag ≈ 0 days, meaning the reservoir responds very quickly to upstream fluctuations, with only a very small delay due to the regulation process.
Daily power generation (Figure 3d) reflects the operational behavior of the hydropower plant and is indirectly influenced by inflow conditions through turbine discharge regulation. Most of the time, the generation curve follows the stable operating phases, only increasing sharply during large and prolonged discharge periods. This reflects a dual operational strategy that combines two objectives: prioritizing timely discharge during high inflow conditions and maximizing power generation from released water within capacity constraints. The close relationship between discharge and generation was quantified using correlation and indices. It should be noted that power generation is not treated as a hydrological forcing variable but as an operational indicator reflecting turbine discharge and reservoir release decisions.
In summary, the results show that the reservoir’s operating system has a clear structure: water levels are kept stable, while inflow, discharge, and power generation all vary strongly seasonally and with each rainfall event. From an operational severity perspective, this means that although the reservoir has reduced downstream water level fluctuations, rapid discharge events still occur and can coincide with intense rainfall, creating periods of heightened operational stress and strong downstream flow responses. Therefore, a detailed analysis of each discharge event is necessary to better understand the times when the system approaches high-operational severity thresholds.
3.2. Time-Series Statistical Analysis
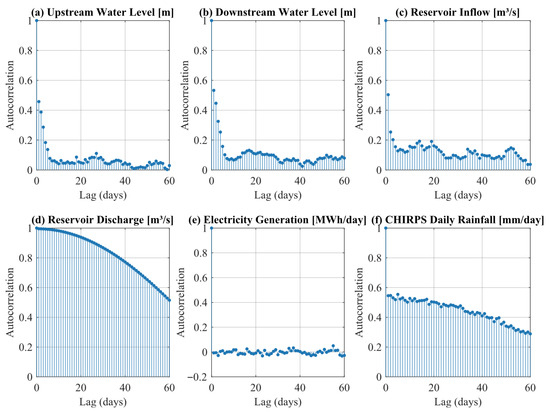
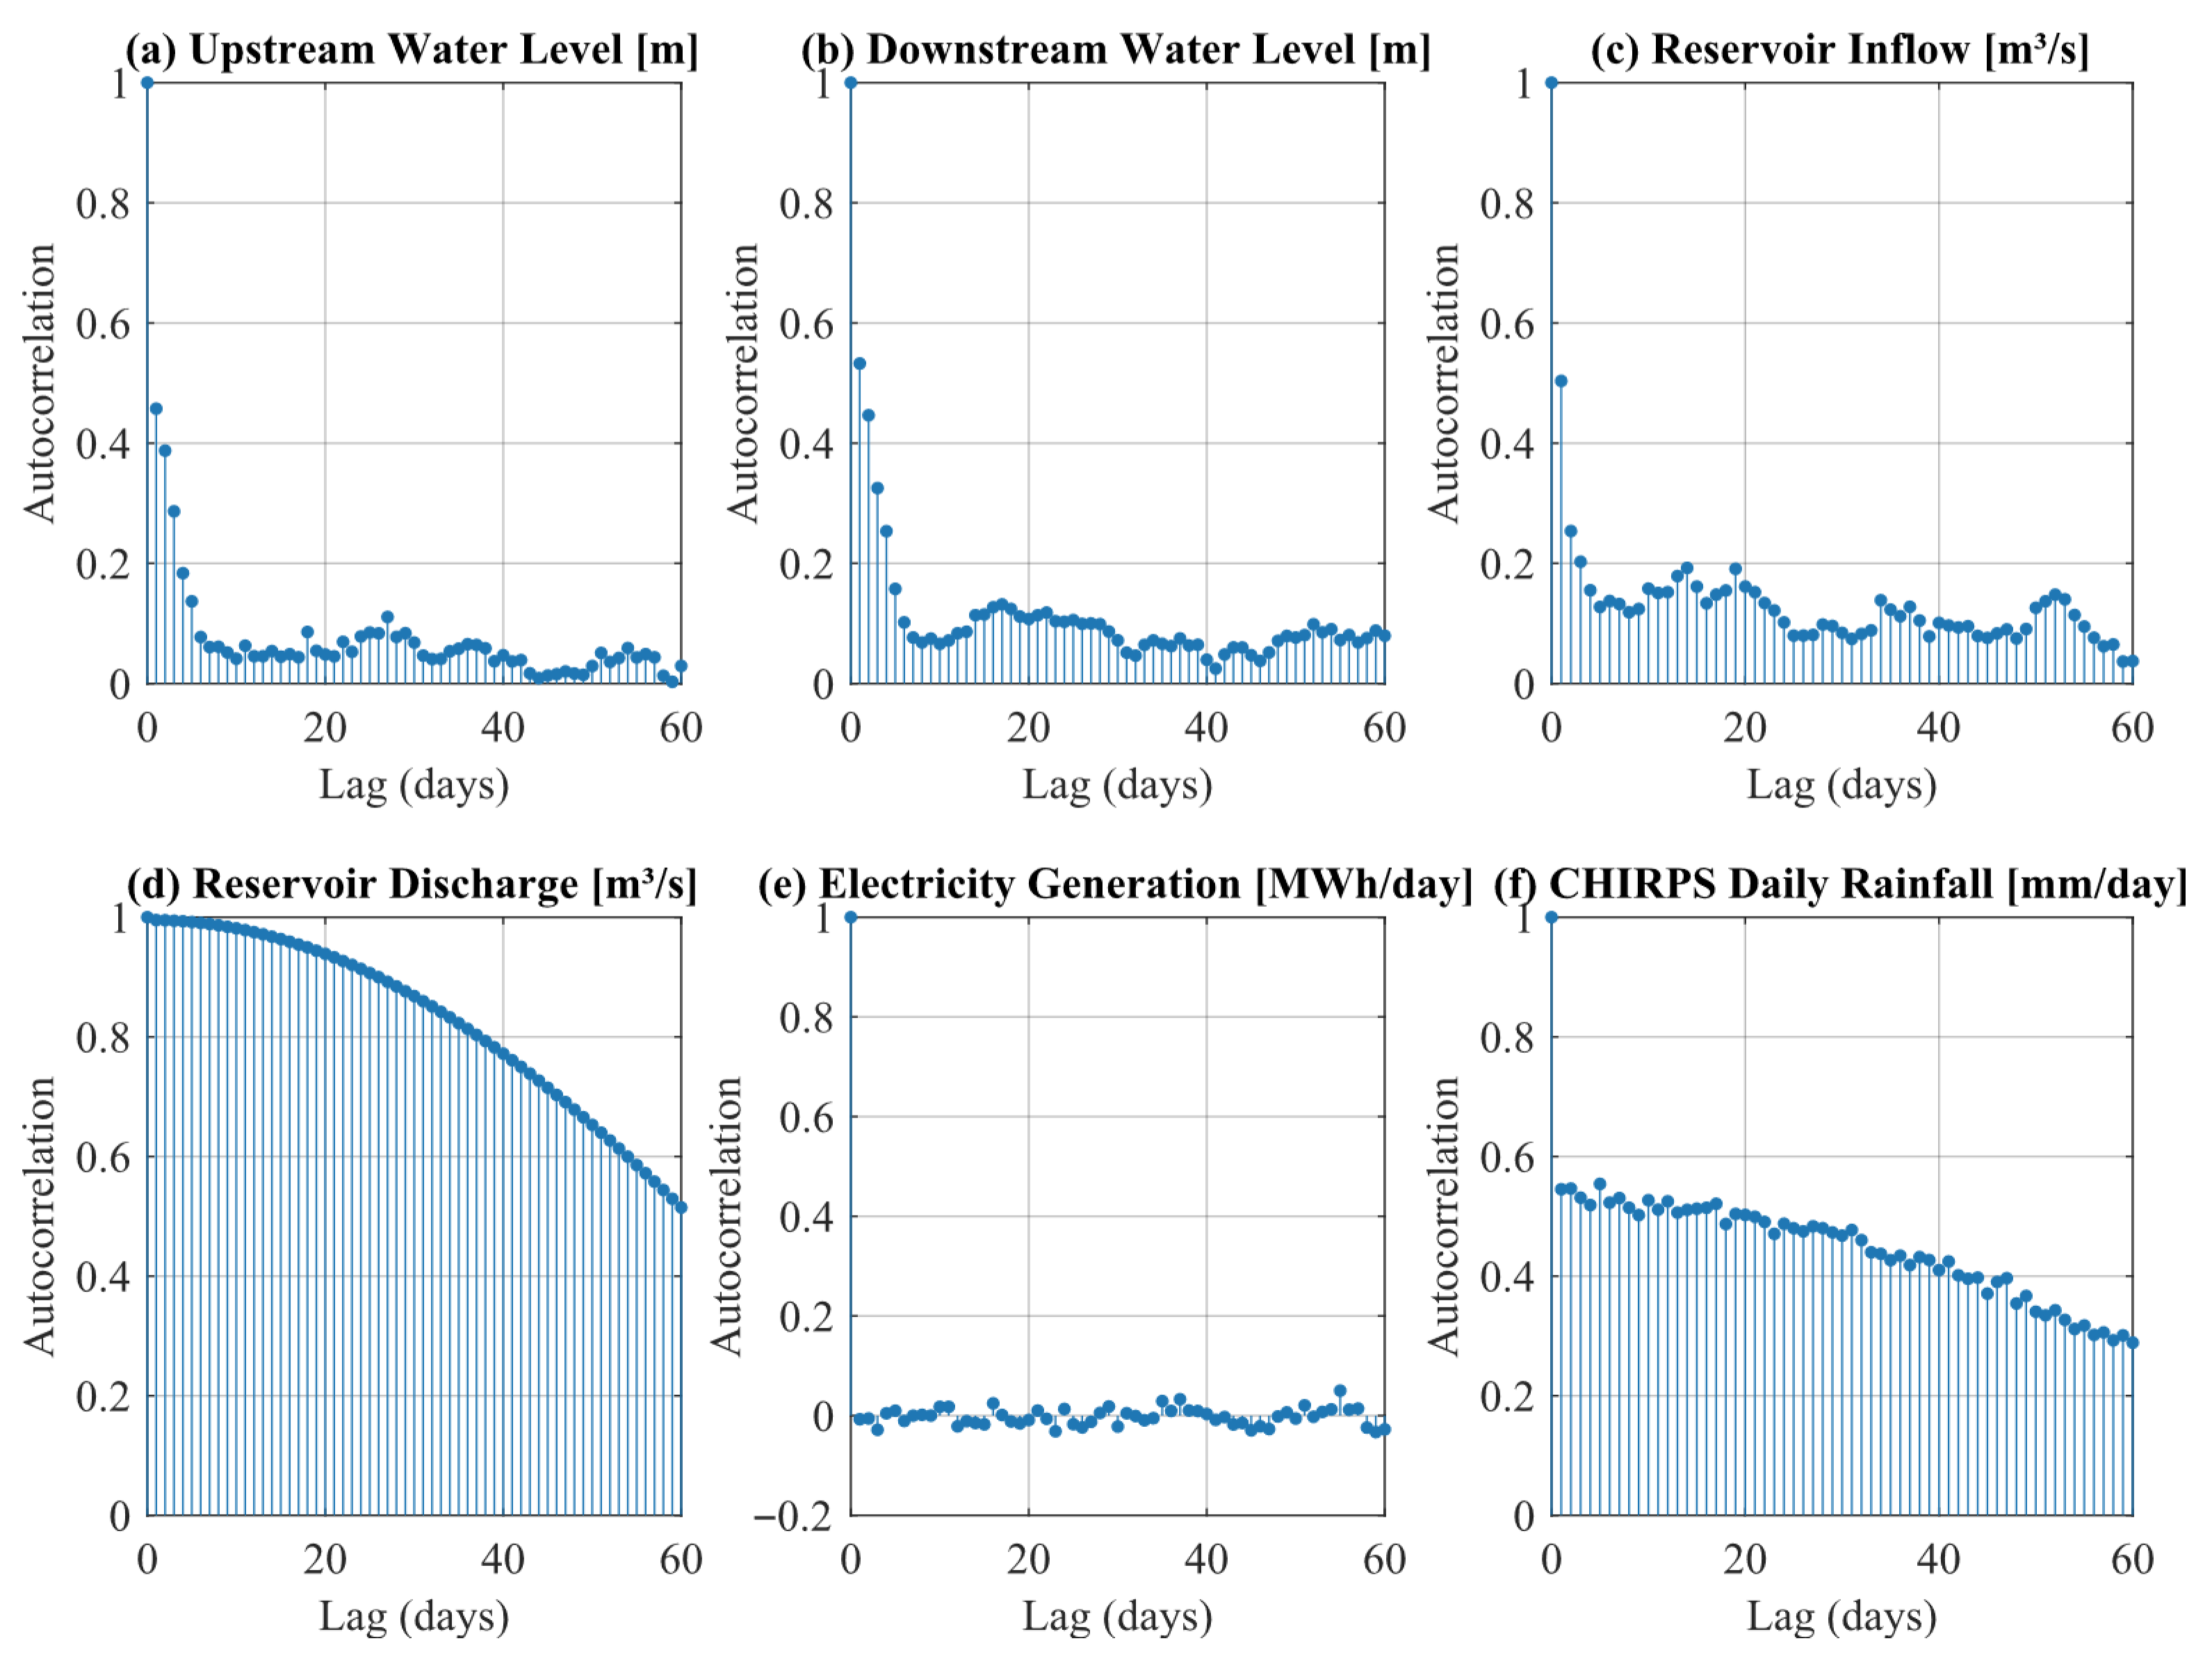
ACF-Autocorrelation of variables (Figure 4) indicates that the ACF of discharge and inflow decreases slowly over a month, demonstrating the long-term “memory” of the regulation system: the fluctuations of discharge depend not only on the current day value but also on the long-term influence of the state of previous days. In contrast, the ACF of rainfall shows rapid instability, confirming that the rainfall signal only lasts very short while passing through the basin and reservoir. In particular, the generation volume shows a strong long-term autocorrelation, indicating that the generation process is maintained relatively stable over the energy production cycle and is directly dependent on discharge regulation.
Figure 4.
Autocorrelation functions (ACF) of discharge, inflow, power generation, and rainfall.
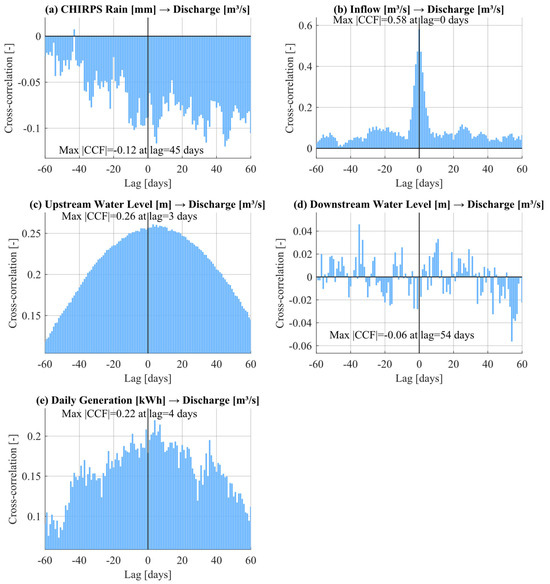
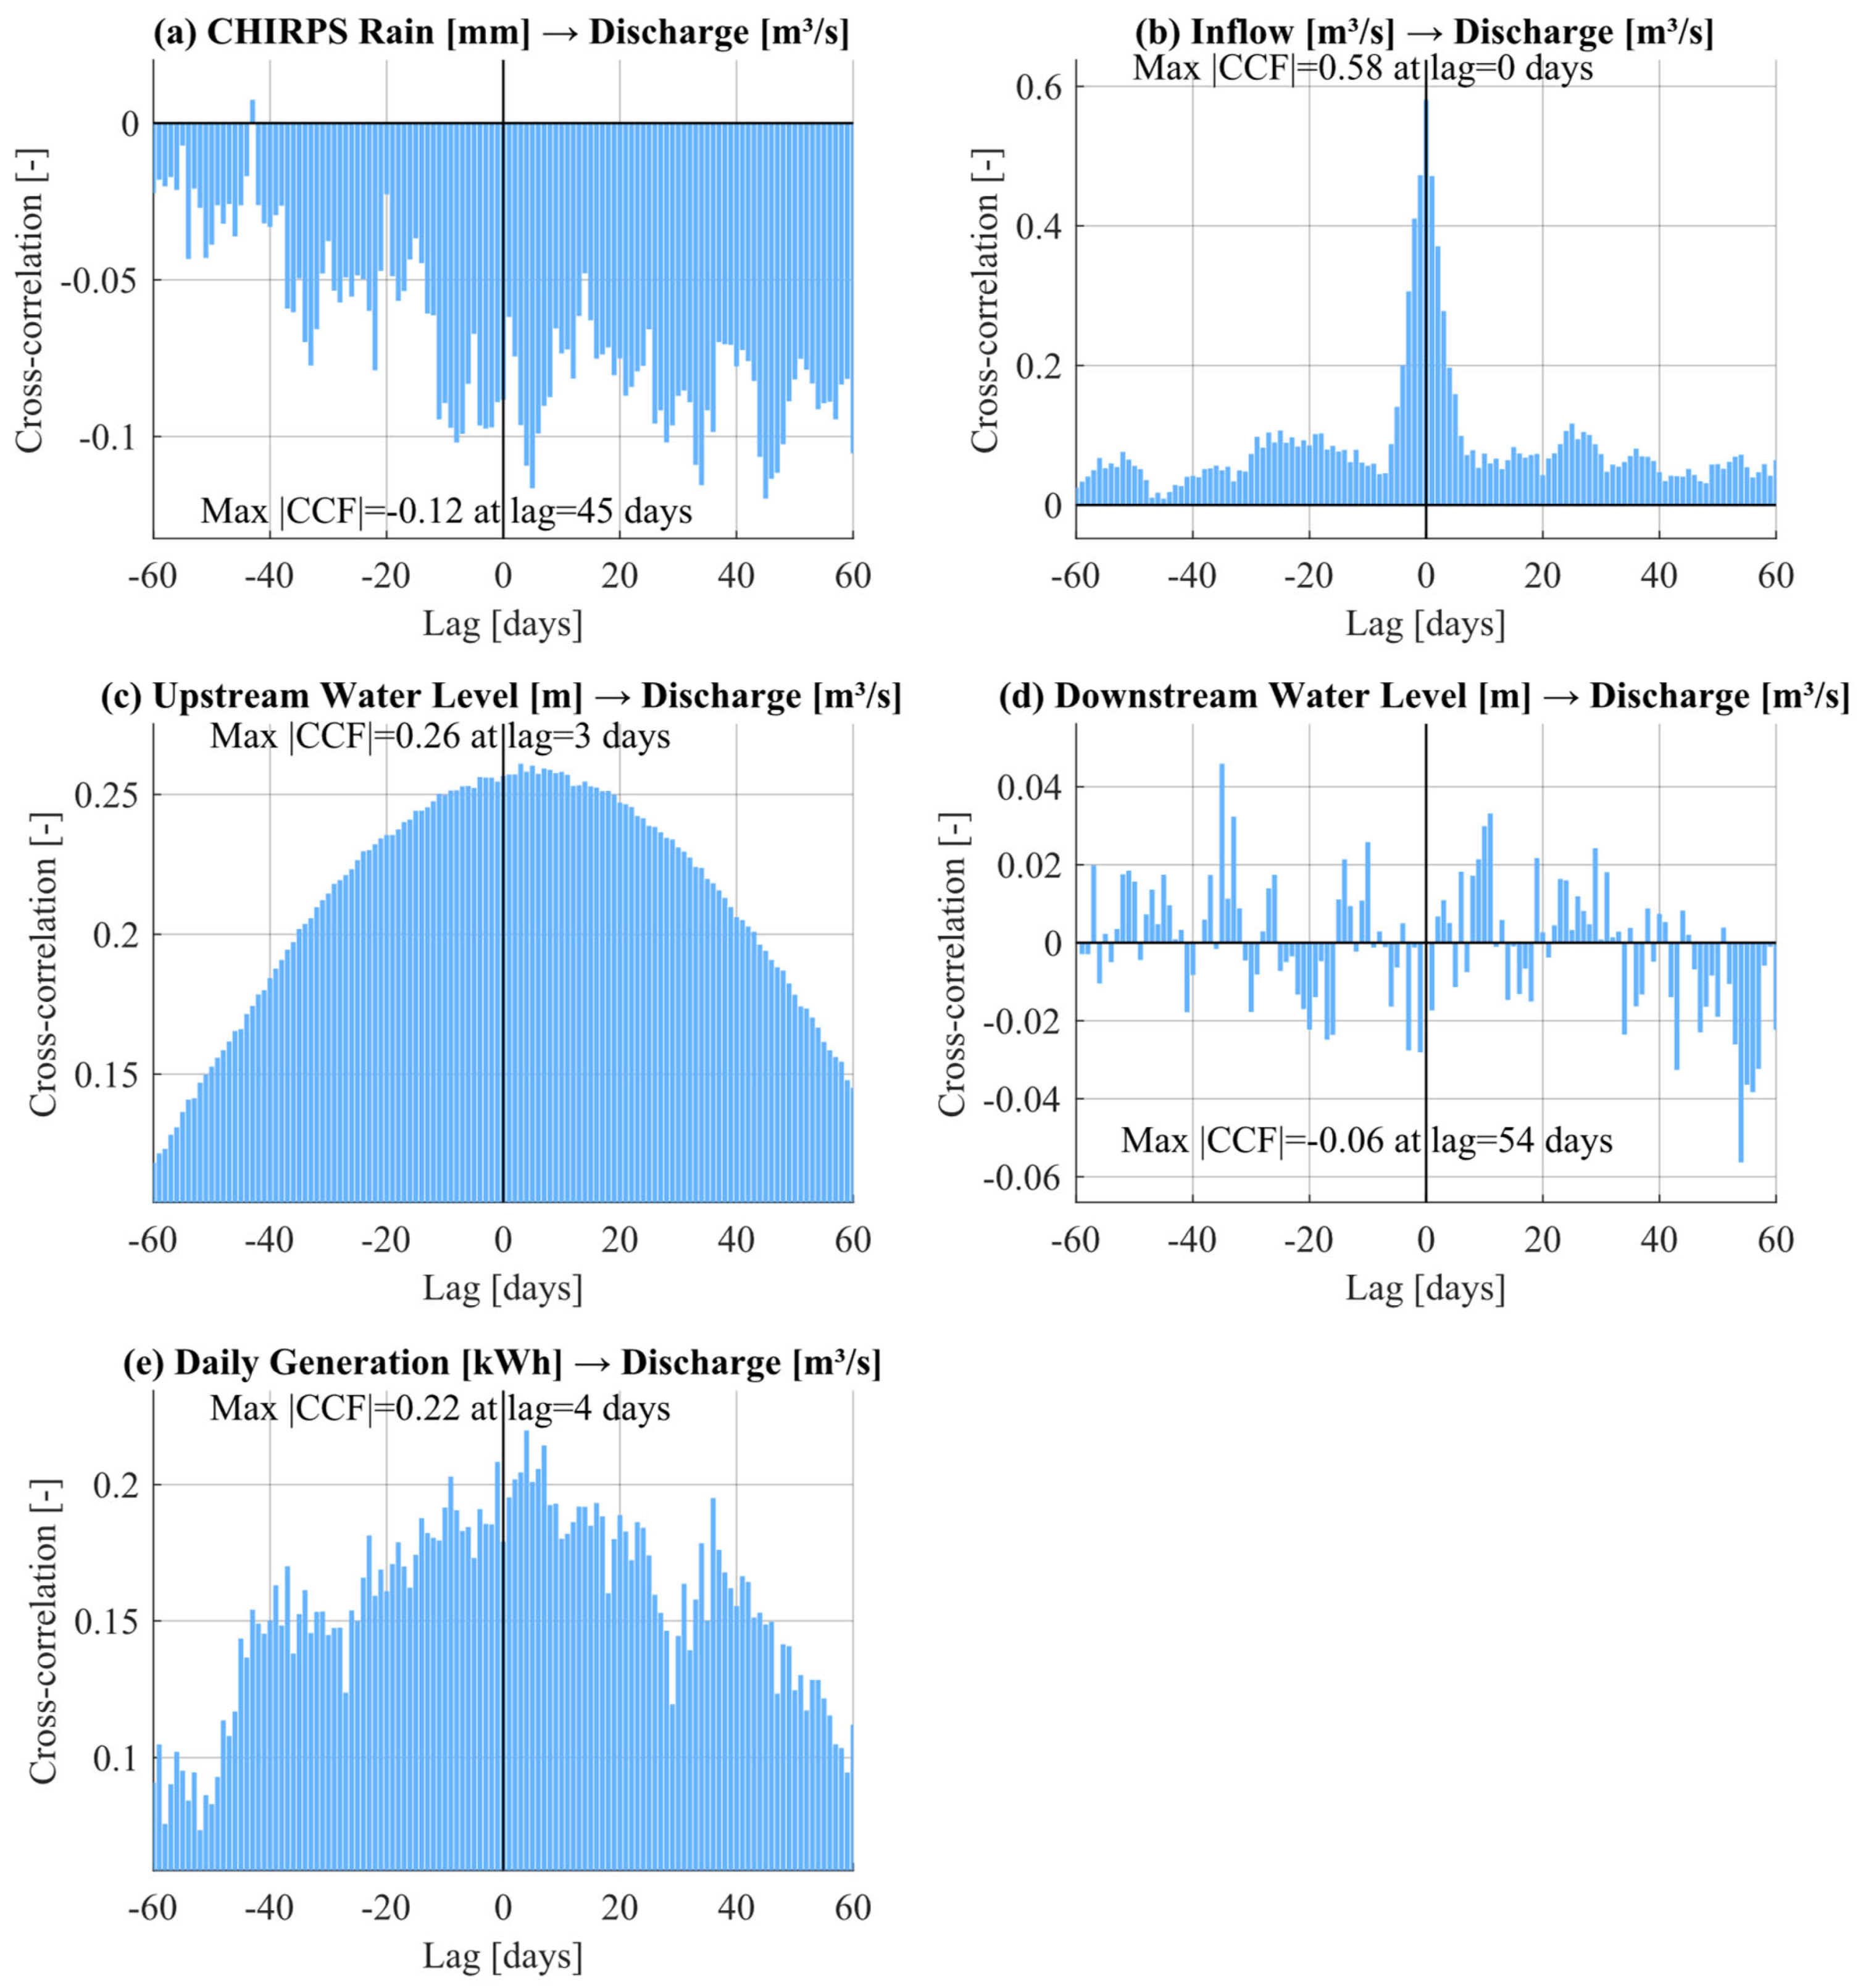
CCF-Cross-correlation between discharge and forecast variables (Figure 5) shows that for inflow, upstream water level, downstream water level, power generation, and rainfall, the correlation structure is variable-dependent, with inflow showing a peak at lag = 0 (max CCF ≈ 0.58), while upstream water level and power generation exhibit delayed peaks at approximately 3–4 days. In contrast, rainfall and downstream water level show weak or negative correlations with longer lags. This result proves the immediate regulatory response of the reservoir to upstream fluctuations: when inflow or water level increases, discharge is adjusted on the same day to keep the reservoir safe and serve the power generation goal. This is clear quantitative evidence for the incoming water-immediate discharge operating mechanism of Ba Ha reservoir, not the seasonal storage, discharge mechanism like many other cascade reservoirs.
Figure 5.
Cross-correlation functions (CCF) between discharge and explanatory variables (inflow, upstream and downstream water levels, power generation, and rainfall).
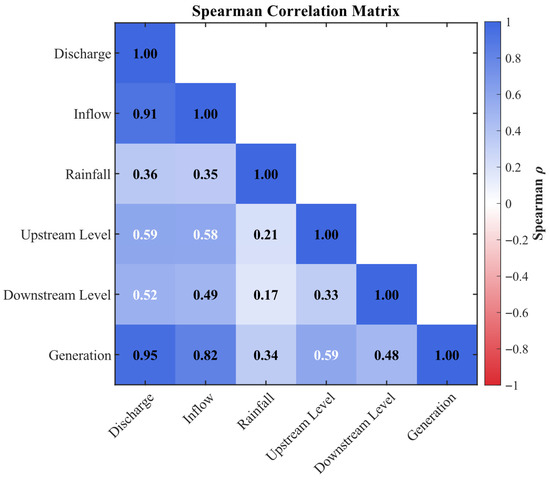
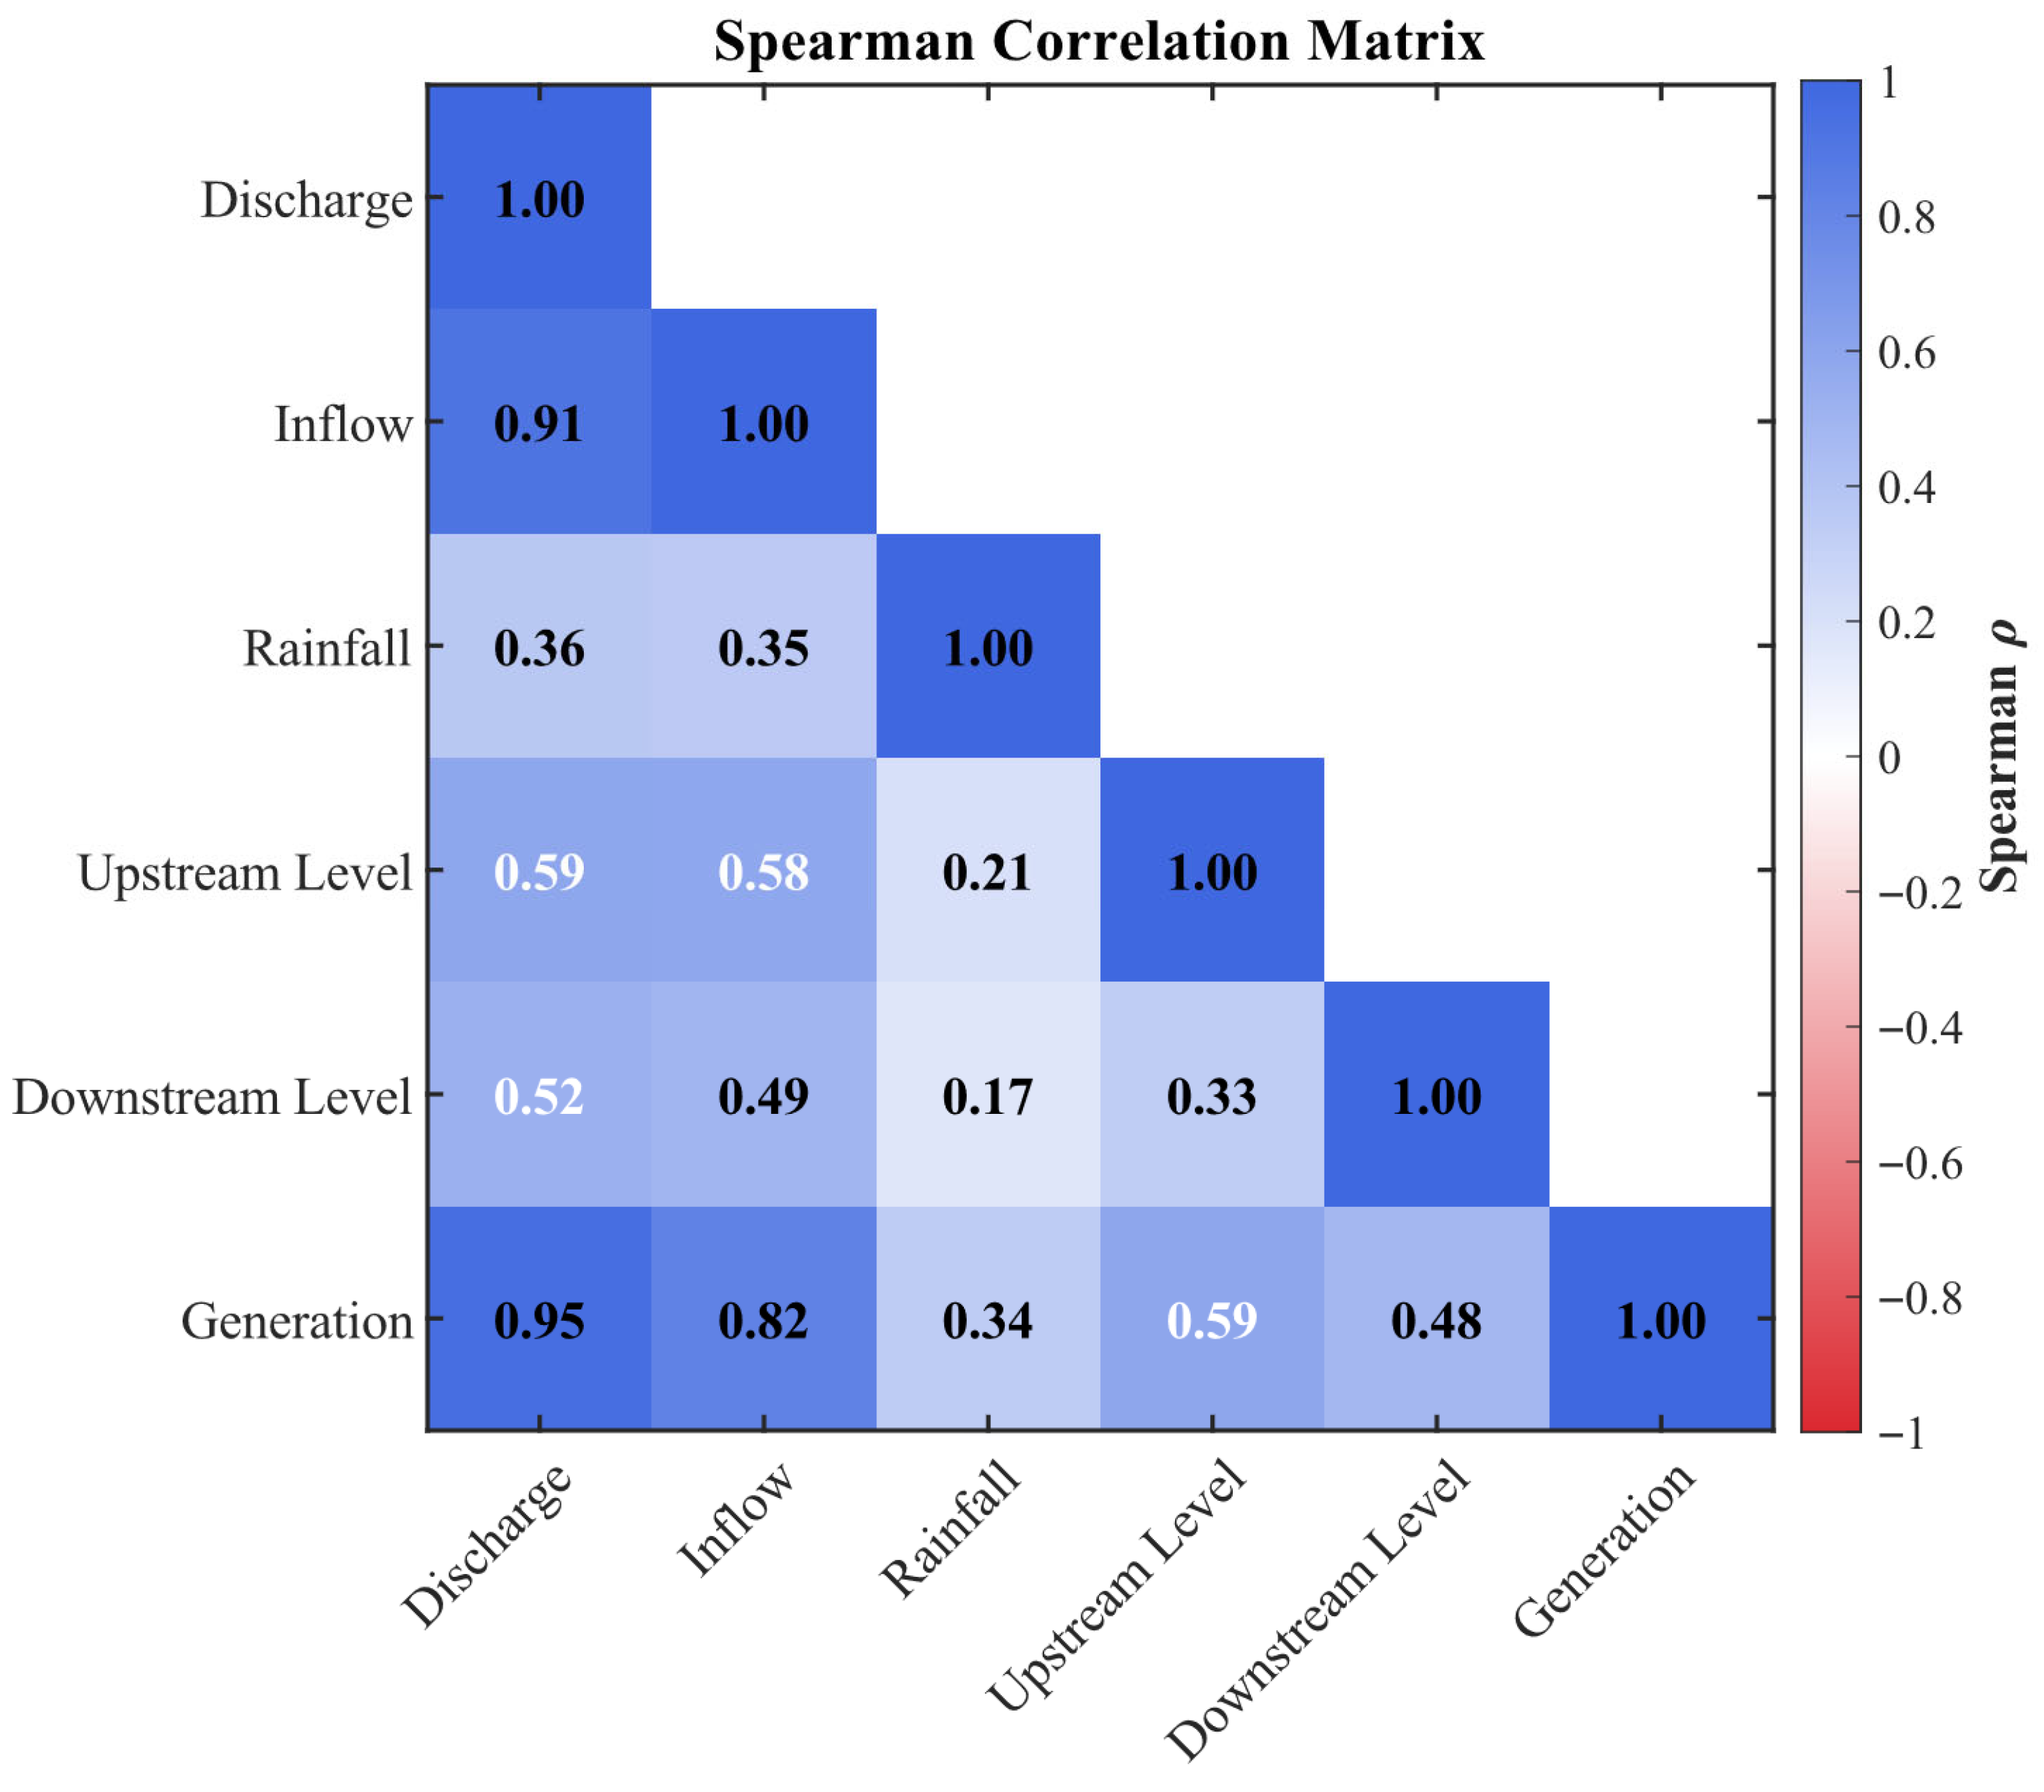
The Spearman matrix (Figure 6) shows that discharge is highly correlated with inflow and especially with daily power generation. This suggests that power generation discharge plays an equally important and sometimes even stronger regulatory role than the purely hydrological influence of inflow. The moderate correlations with upstream and downstream water levels reflect the operational constraints on water levels, while CHIRPS rainfall has the lowest correlation due to its indirect effect and is attenuated by the reservoir’s regulatory volume.
Figure 6.
Spearman rank correlation matrix between discharge and operational-hydrological variables, highlighting the relative strength of monotonic relationships.
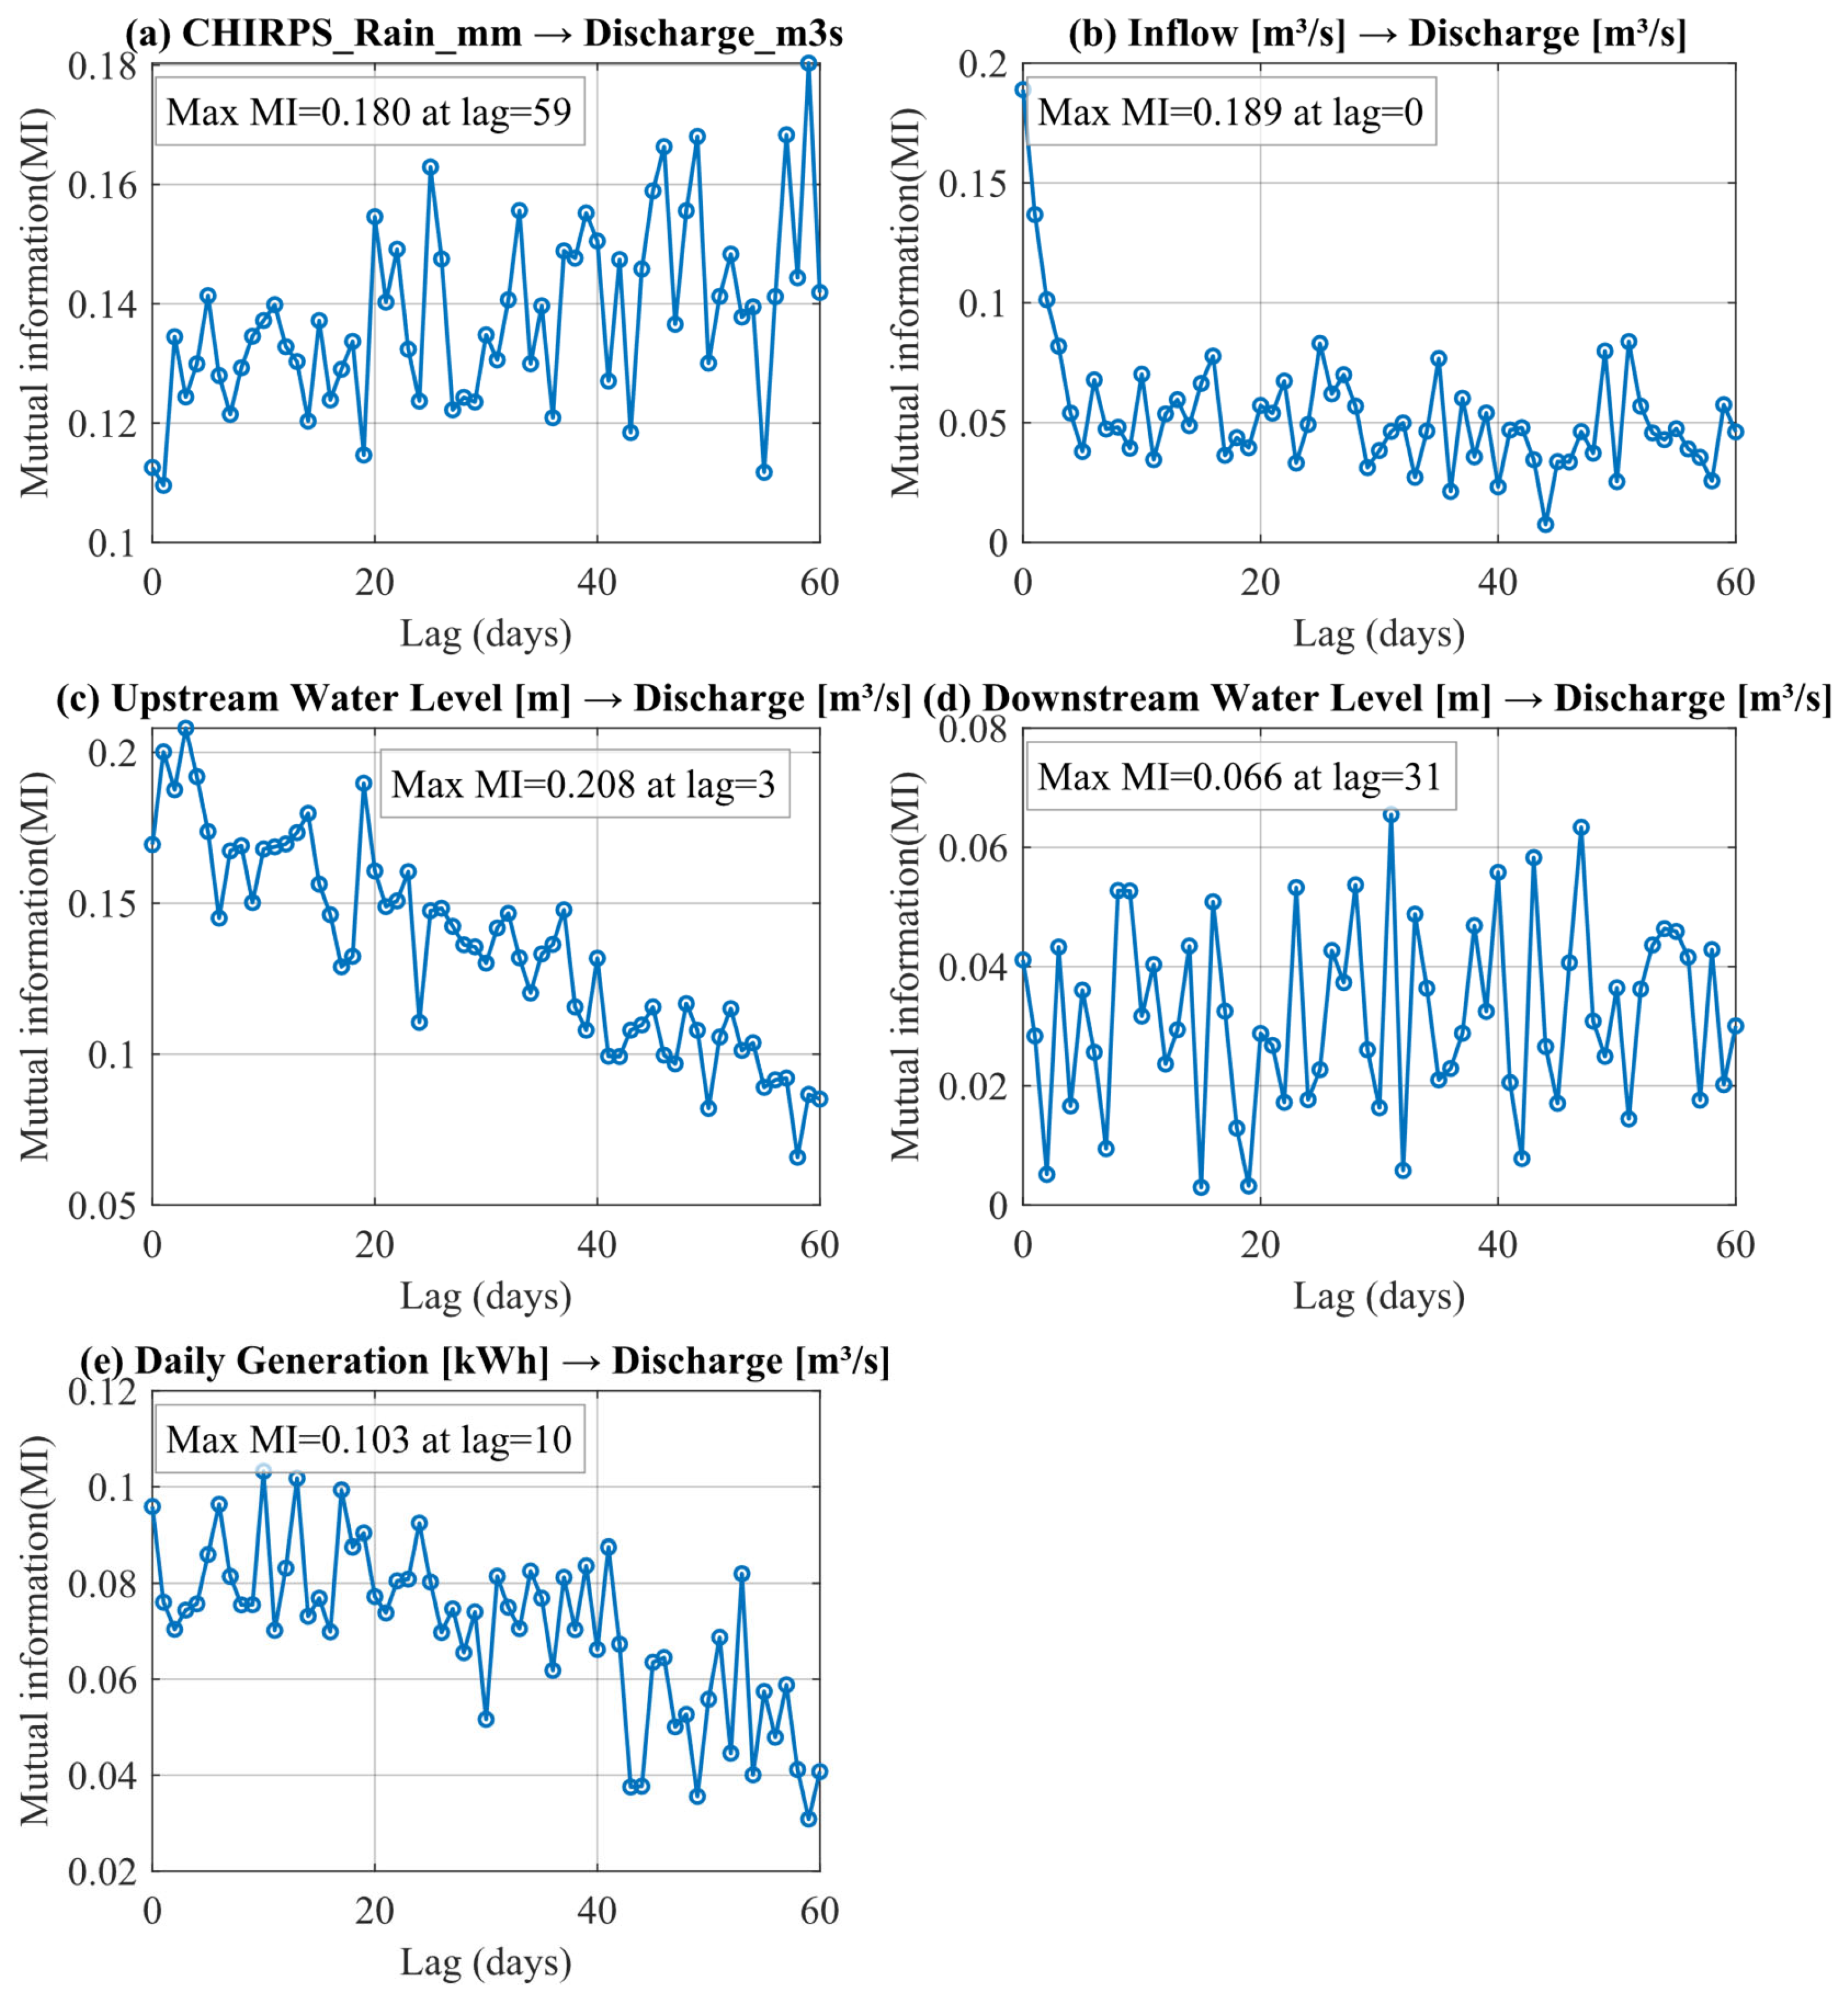
Mutual information provides an important perspective on nonlinear dependencies that cannot be captured by Spearman correlation or the cross-correlation function (Figure 7). Daily generation and inflow show the highest at lag = 0. While inflow represents the hydrological forcing, power generation reflects operational discharge decisions, explaining the strong dependence between generation and discharge. CHIRPS Rain has its maximum at a lag of approximately 59 days, reflecting the hydrological reality that rain needs time to convert to inflow before it can affect discharge.
In general, the results of the multidimensional statistical correlation analysis (ACF, CCF, , and Spearman correlation) clearly show the hydrological operation mechanism of Ba Ha reservoir and the dependence of discharge on input signals and regulation activities. The Spearman matrix shows that discharge is highly correlated with inflow ( = 0.91) and especially with daily power generation (= 0.95), emphasizing the role of power generation as a central regulating force besides the influence of incoming water; while the upstream and downstream water levels show an average correlation, reflecting the role of controlling the water level balance of the reservoir.
Notably, CHIRPS rainfall exhibits the weakest relationship with discharge, characterized by both low linear correlation and delayed nonlinear dependence. The CCF results show weak and asymmetric correlations (max CCF ≈ −0.12 at lag ≈ −45 days), while indicates a delayed nonlinear response (max ≈ 0.180 at lag ≈ 59 days). This reflects the regulated nature of the reservoir system, where rainfall first contributes to inflow generation and storage before discharge is adjusted through operational decisions. ACF analysis shows that discharge has a very strong memory and decreases gradually over multiple lag days, demonstrating the inertial and cycle-based regulation mechanism of the reservoir, not a random response signal. CCF analysis shows that only inflow exhibits a near-instantaneous response (lag ≈ 0), whereas other variables display delayed or weak correlations depending on their operational or hydrological roles, reflecting the almost instantaneous regulatory response to the fluctuations of upstream flow and power generation demand, clear quantitative evidence for the incoming water-immediate discharge operating mechanism of the Ba Ha reservoir. An additional perspective is provided by Mutual Information: inflow exhibits the strongest nonlinear dependence with discharge ( ≈ 0.189 at lag = 0), followed by upstream water level ( ≈ 0.208 at lag ≈ 3 days) and generation ( ≈ 0.103 at lag ≈ 10 days), implying that the relationship with discharge is not only strongly linear but also prominently nonlinear; in addition, rainfall shows maximum ≈ 0.180 at a lag of approximately 59 days, reflecting the sequence from rainfall to flow to discharge. Combining the above results shows that discharge of Ba Ha is the result of the interweaving of hydrological and operational signals, governed by both near-instantaneous feedback (inflow) and delayed operational responses (water level and generation) and long-term inertia. This not only explains the actual discharge behavior of the lake but also sets technical requirements for the forecasting problem: the model must simultaneously exploit both the background trend and the time fluctuations to be able to accurately simulate the lake discharge process.
Similar relationships between reservoir discharge and operational drivers have also been reported in regulated river systems worldwide, where inflow variability and operational decisions jointly control discharge dynamics [6,8]. However, most previous studies primarily focused on hydraulic simulations or basin-scale regulation effects, while the present study demonstrates that multidimensional statistical analysis of operational datasets alone can reveal key discharge-operation dependencies and provide a direct basis for event-based operational severity assessment.
3.3. Operational Severity Index and Discharge Events Classification
The results of identification and analysis of 160 flood discharge events in the period 2018–2025 (Figure 8 and Figure 9) show that the operational severity dynamics strongly depend on three physical factors: peak discharge, rate of increase, and duration. Peak flows are mainly concentrated in the range of 1000–2000 m3/s, but some events exceed the threshold of 3000–4000 m3/s (Figure 8b), which plays a dominant role in the operational severity level. The rate of increase in flow () varies widely, with many increases exceeding 1500 m3/s/day and some extreme values above 3000 m3/s/day (Figure 8d), indicating episodes of pronounced operational severity associated with rapid discharge increases. Although most events were short (1–3 days), some lasted for more than 5–7 days and were accompanied by large total discharges (Figure 8c,e), increasing the operational severity of prolonged high-release conditions.
Figure 7.
Mutual information () between discharge and explanatory variables at different lags, revealing nonlinear dependencies and delayed rainfall effects on discharge.
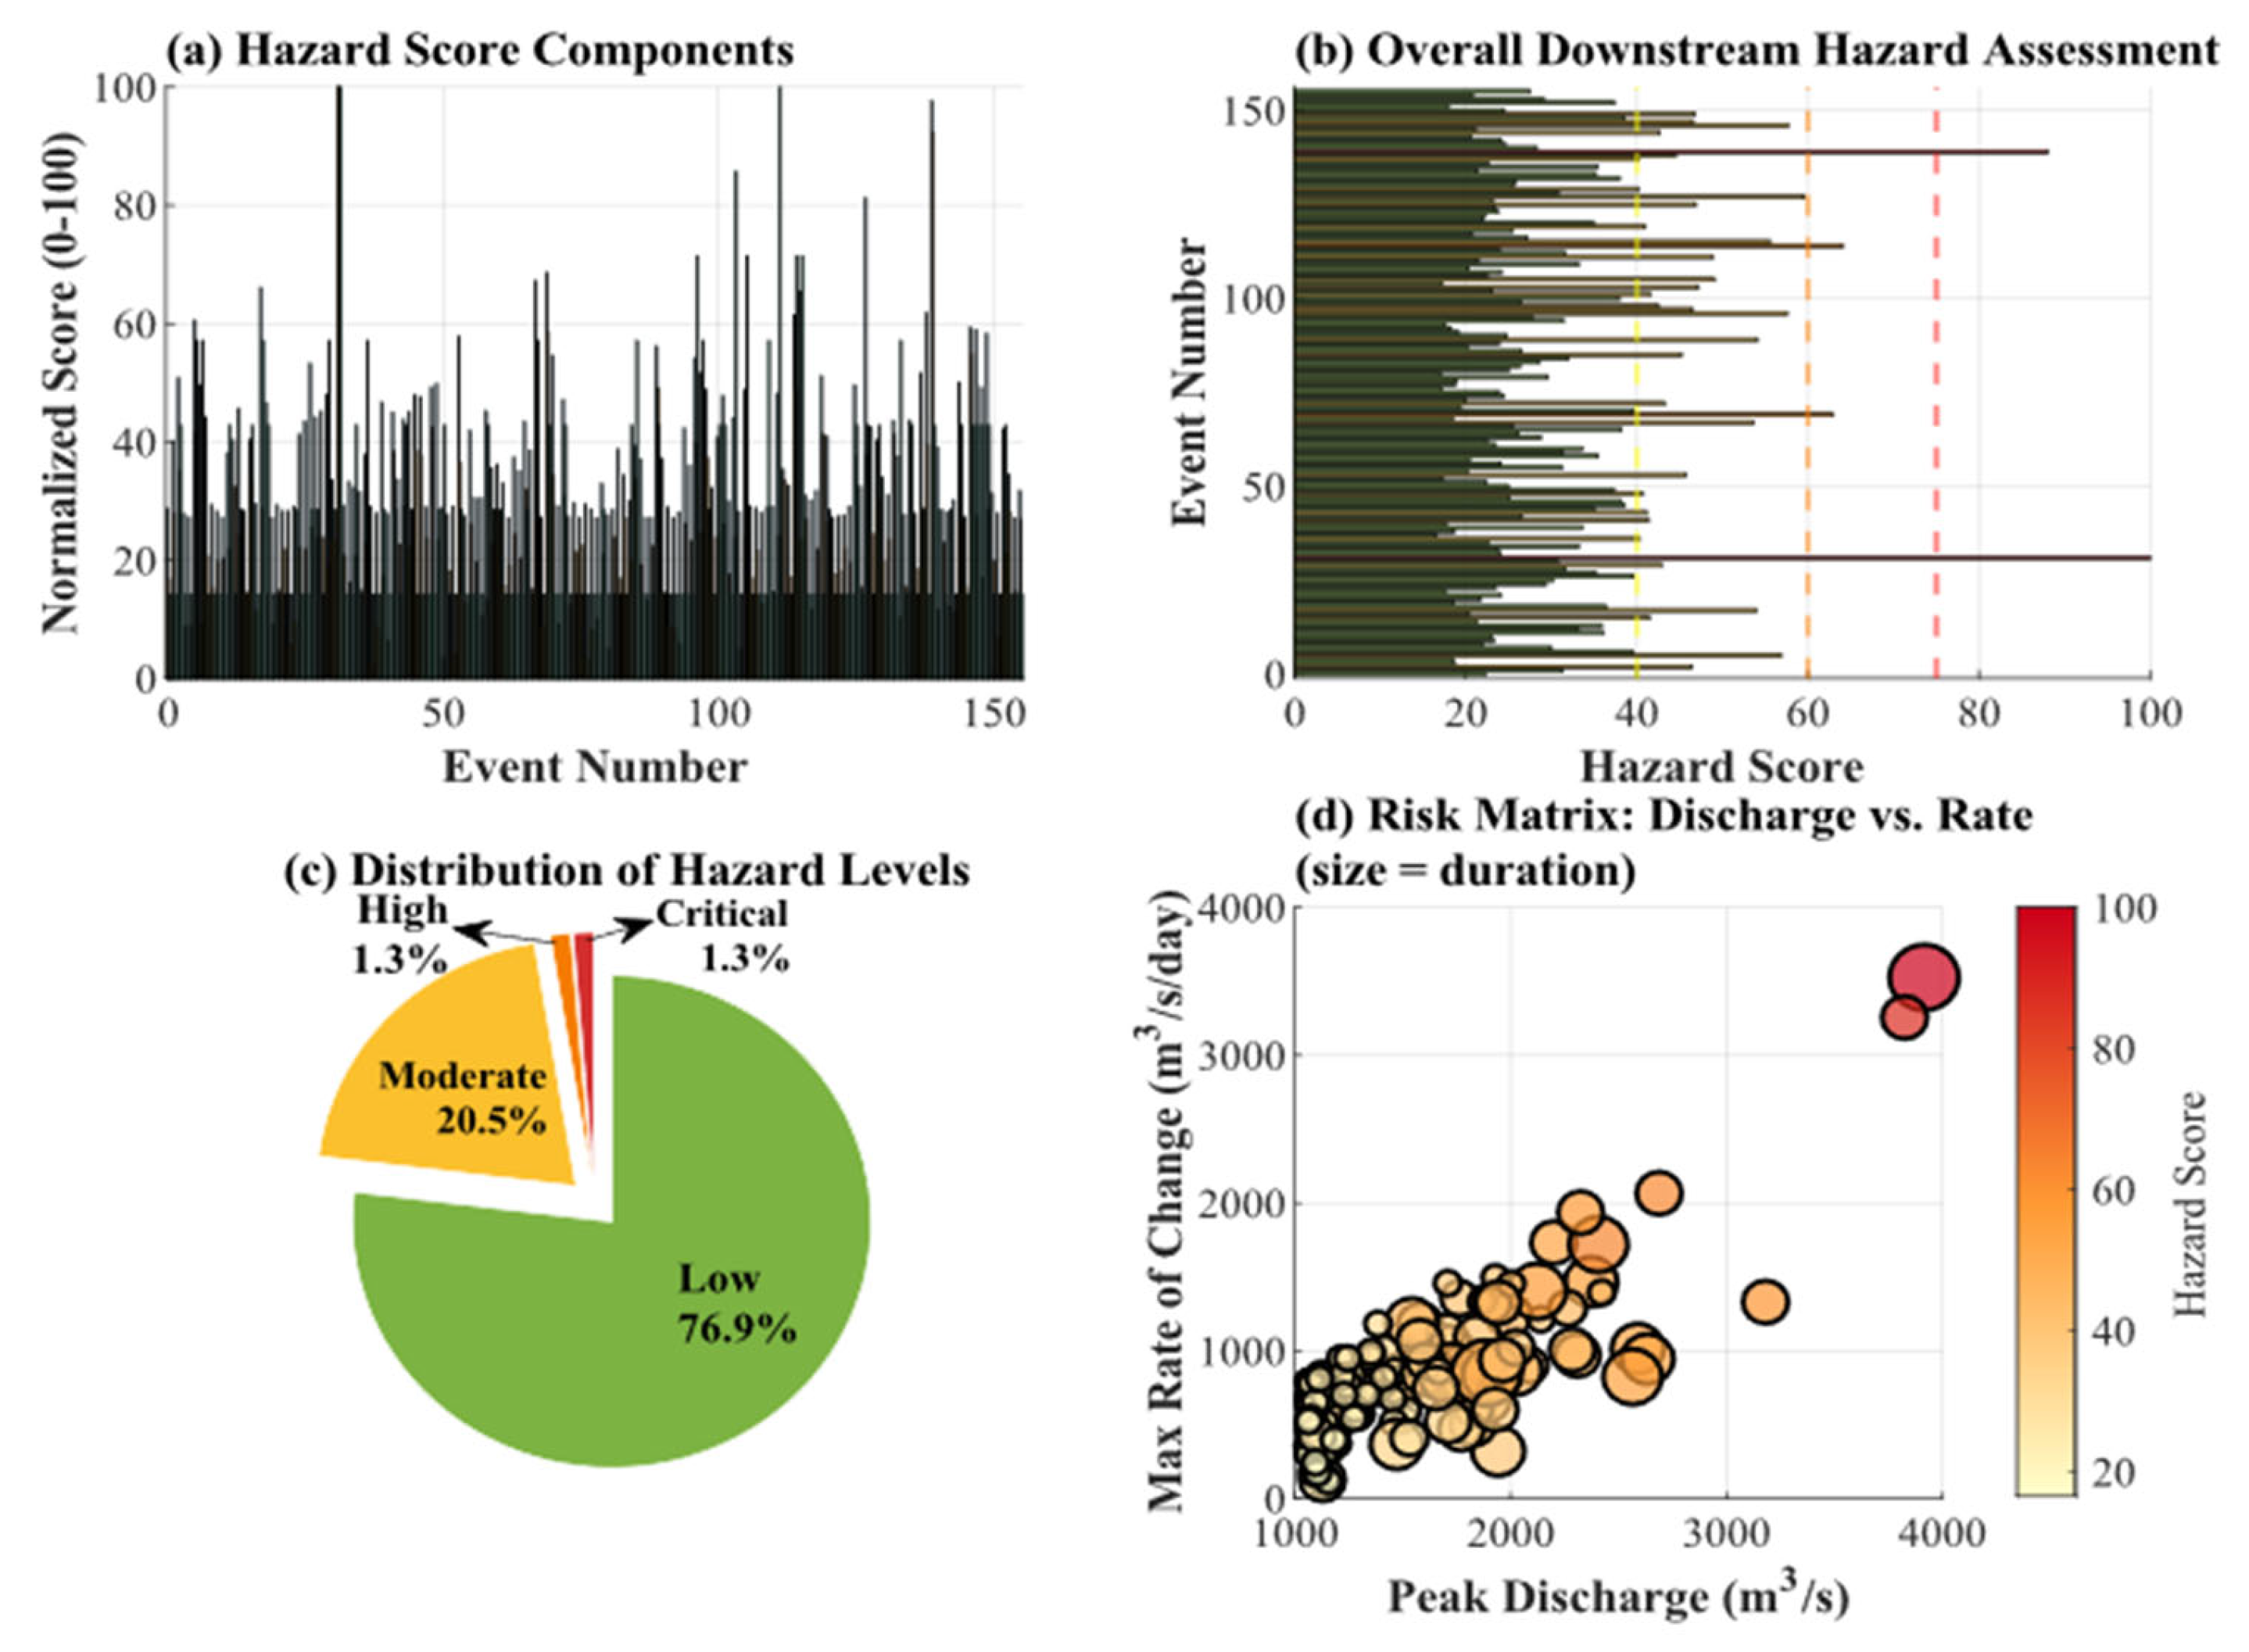
The characteristics and distribution of operational severity across all identified discharge release episodes are synthesized in Figure 9. Figure 9a shows the normalized components of the , including peak discharge, rate of change (), and event duration, illustrating how these three features vary among individual events. Based on their combined effect, Figure 9b ranks discharge episodes according to overall values, providing a comparative view of relative operational severity. Figure 9c further summarizes this information by grouping events into four operational severity classes, revealing that most releases fall within the mild to moderate range, while only a small fraction (~2–3%) are classified as severe to extreme. Figure 9d integrates the three dimensions in a two-dimensional operational severity matrix, where events with high cluster in the upper-right region, characterized by large peak discharges and rapid increases, and are typically associated with longer durations. Together, these panels demonstrate a clear polarization in operational severity, with a limited number of rare but intense release episodes concentrating the highest severity levels.
Figure 8.
Characteristics of identified flood discharge events during 2018–2025: (a) event timeline, (b) peak discharge, (c) event duration, (d) maximum rate of increase (), and (e) total discharged volume per event.
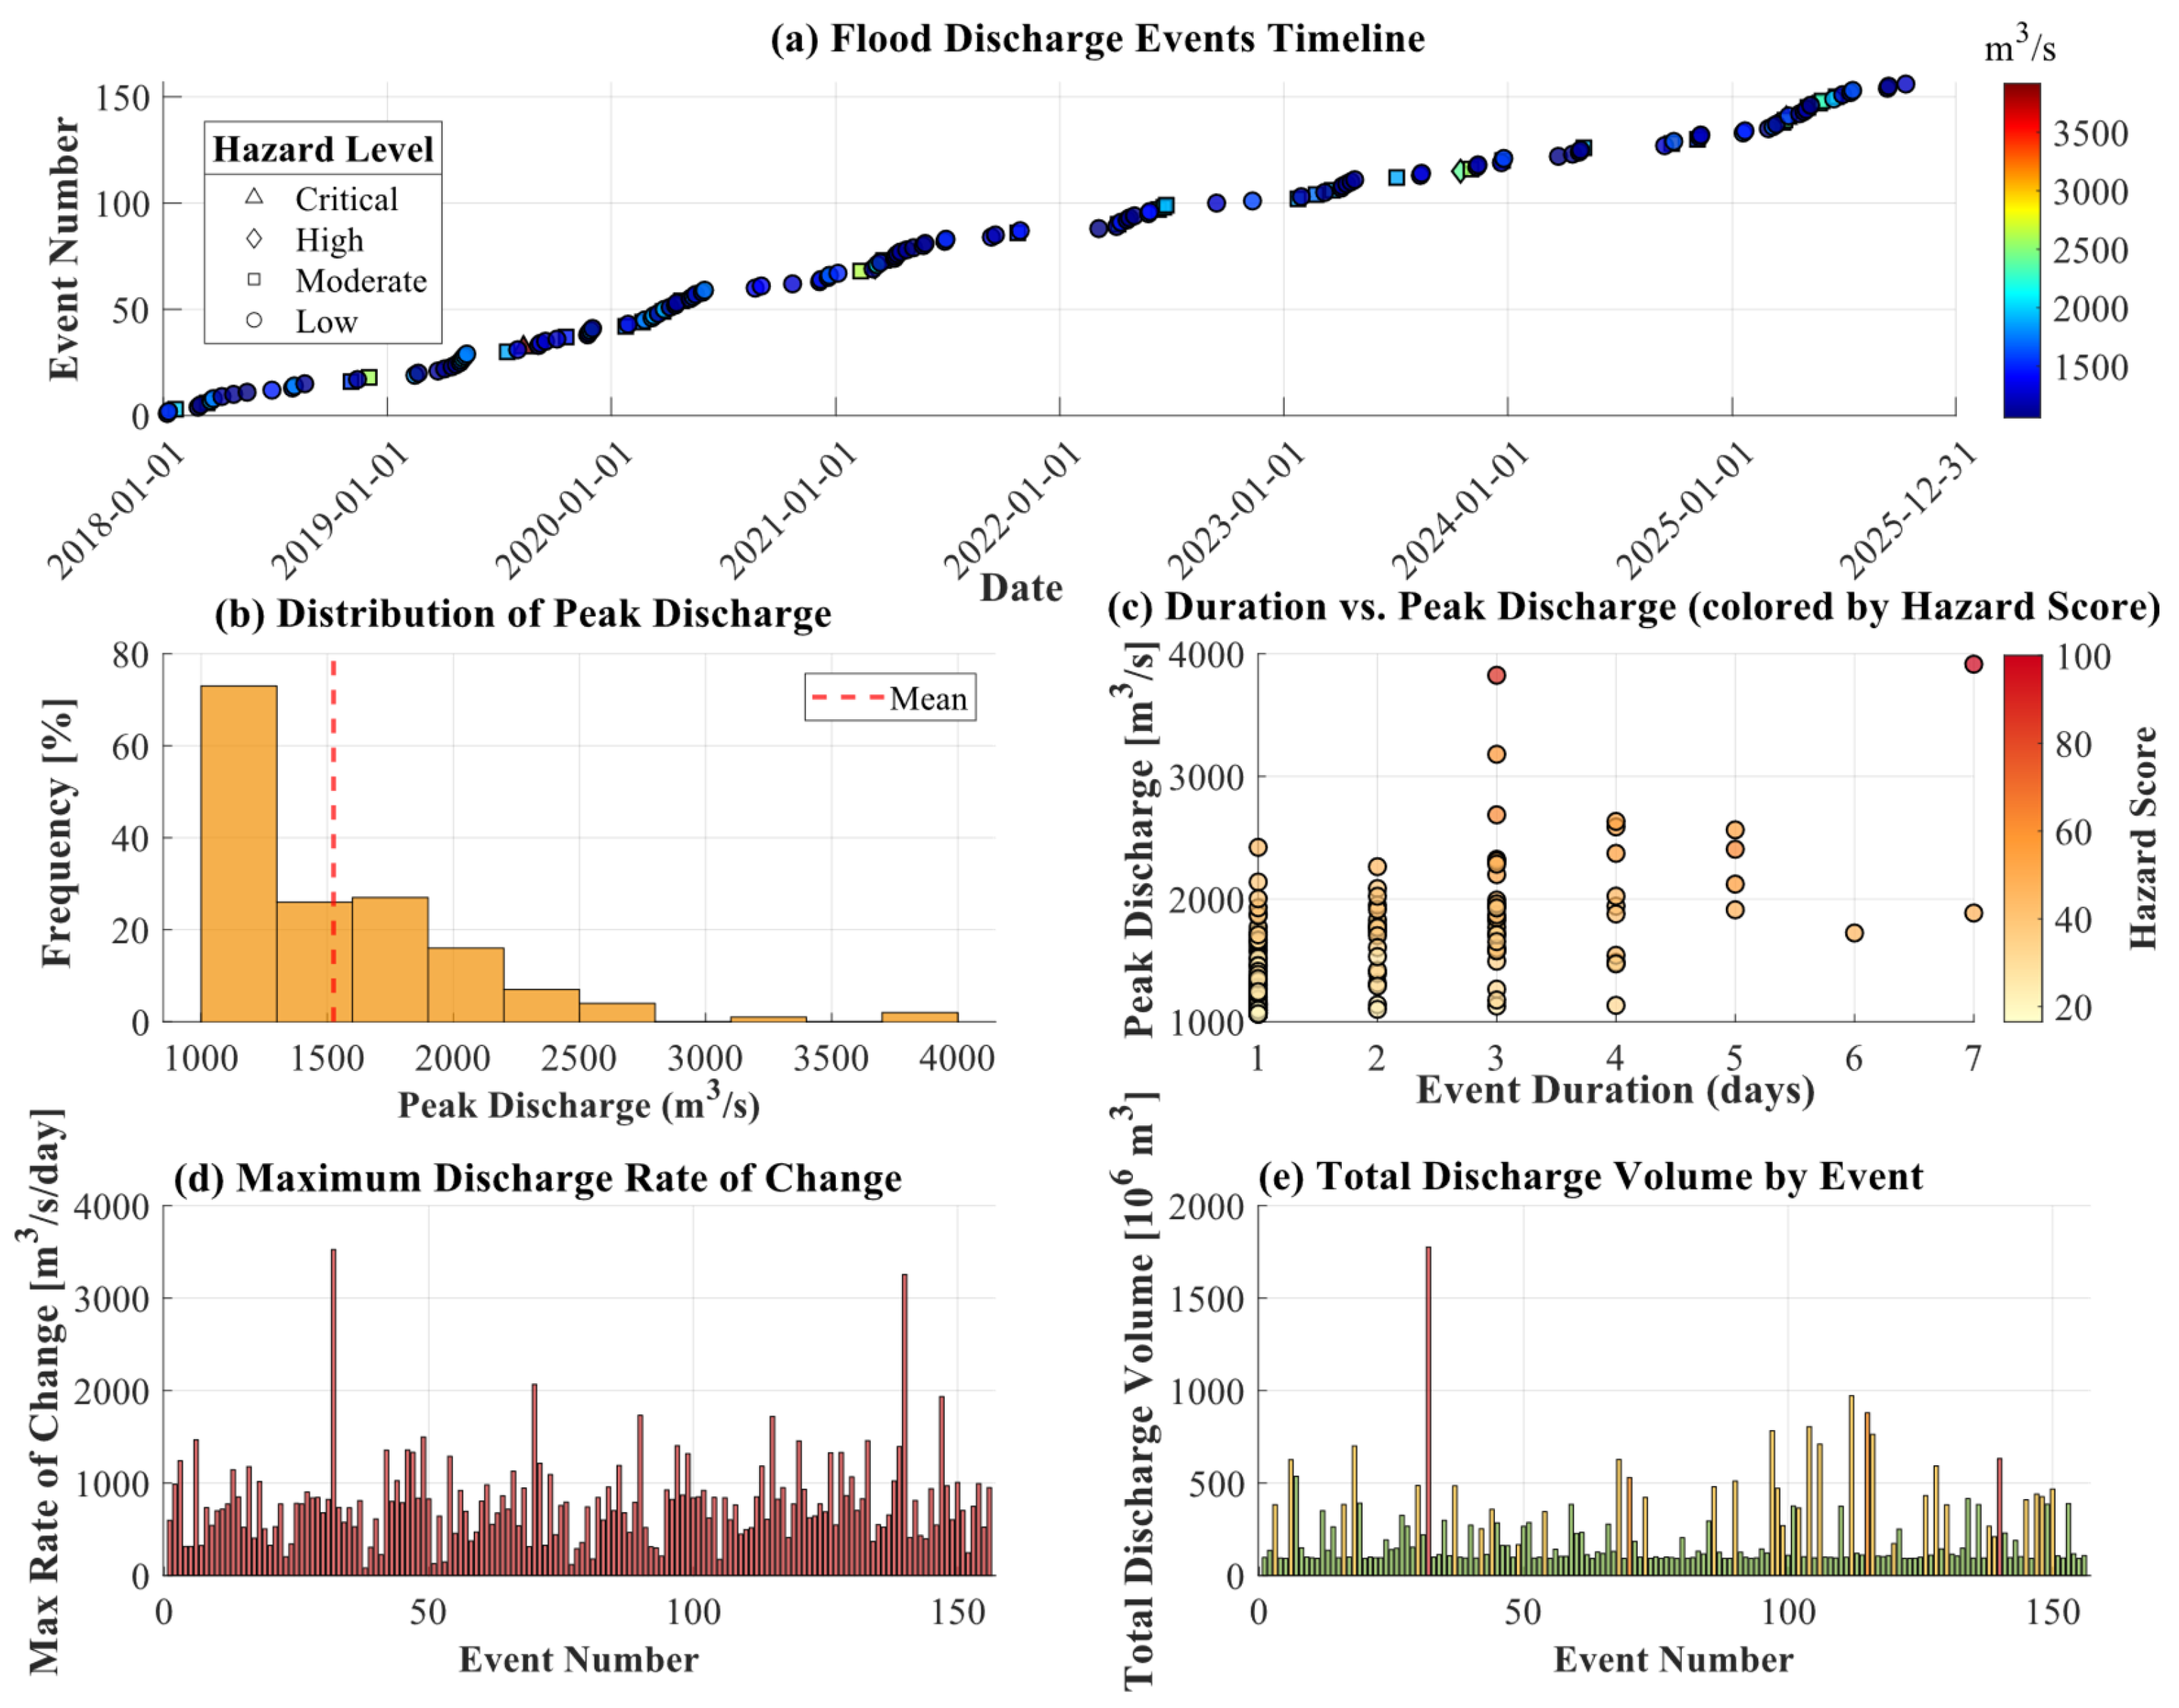
The event timeline (Figure 8a) shows that extreme-severity events are not randomly distributed but coincide with periods of continuous heavy rainfall, at the same time as reservoirs must maintain safe water levels and generate high power, indicating an overlap between hydrological and operational pressures. This confirms that operational severity depends not only on incoming water, but also on reservoir regulation and power generation demands. Furthermore, comparing the total discharges per event (Figure 8e) shows that, although the is based on three independent features, it still reasonably reflects the overall release intensity: extreme events exhibit outstanding total discharged volumes and multi-day persistence.
In summary, the OSI-based operational severity assessment system has shown that operational severity mainly comes from a small number of rare extreme events that increase in intensity rapidly, have large peak discharges, and last for many days. This result is particularly valuable for reservoir operation management, as it allows operators to move beyond continuous monitoring and instead focus on the early identification of periods when discharge behavior transitions from routine operation to high operational severity, characterized by rapid release dynamics. Previous studies on reservoir risk or discharge severity often focused on structural failure scenarios or extreme flood propagation [11,13]. In contrast, the proposed is derived directly from routinely available operational data, enabling continuous monitoring of operational stress without requiring complex hydraulic simulations. This demonstrates the potential of operational-data-driven approaches as a practical complement to traditional methods. This provides a practical complement to traditional flood risk assessment approaches. It should be noted that the severity classification thresholds used in this study (mild, moderate, severe, and extreme) are based on heuristic boundaries and therefore introduce a degree of subjectivity. These thresholds are intended to provide a relative framework for comparing operational severity across events within the study system, rather than to define universal or physically based categories. As such, their applicability to other reservoirs may require local calibration or adjustment. Future work could explore data-driven or impact-based threshold definitions to improve the robustness and transferability of the severity classification.
Figure 9.
Operational severity characteristics of discharge release episodes identified during 2018–2025. (a) OSI Components; (b) Overall Operational Severity Assessment; (c) Distribution of Operational Severity Levels; (d) Operational Severity Matrix: Discharge vs. Rate (size = duration).
3.4. Forecasting Performance (1–7-Day Forecast Horizons)
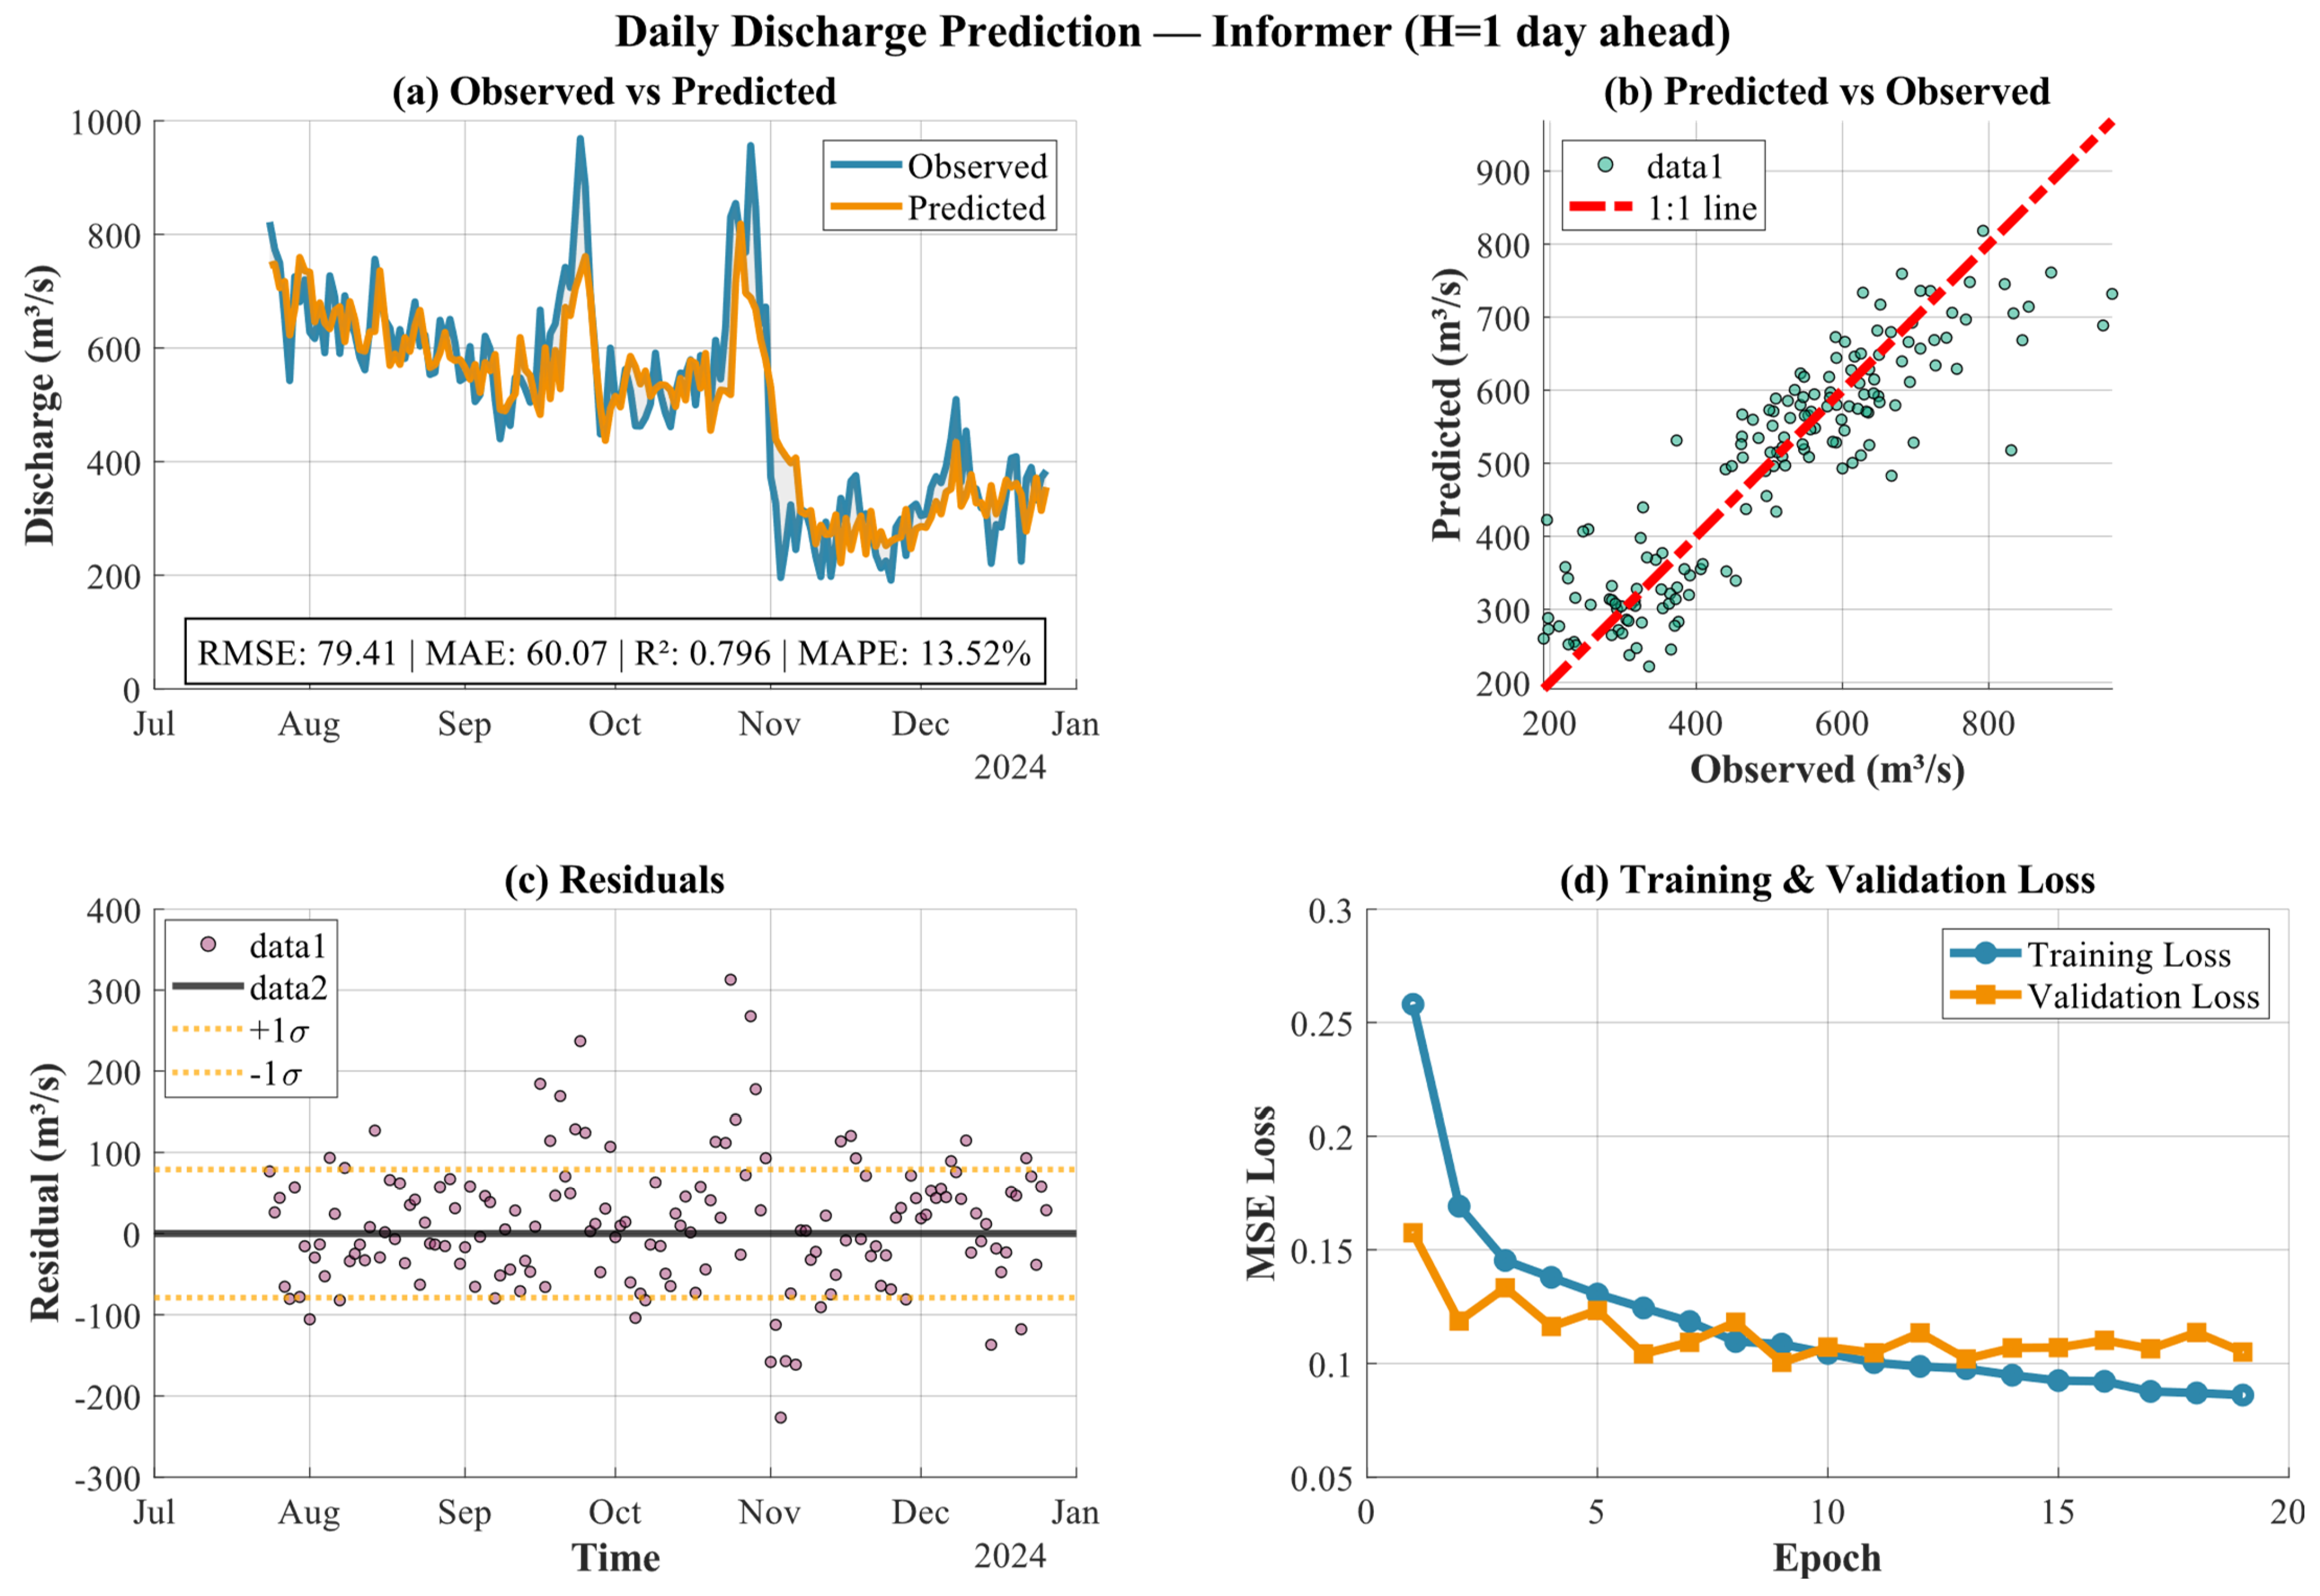
The forecasting results presented in this section are reported on the testing subset (15% of the full dataset), while model training and selection were performed using the training (70%) and validation (15%) subsets, respectively. The 1-day-ahead discharge forecasts reveal clear differences among Autoformer, Informer, and iTransformer in terms of accuracy, stability, and ability to reproduce discharge peaks (Figure 10, Figure A1, Figure A2 and Figure A3). Autoformer reproduces the overall discharge waveform under normal conditions but tends to smooth and lag extreme discharge peaks (Figure A1, Figure A2 and Figure A3), resulting in moderate performance (RMSE ≈ 99 m3/s, ≈ 0.68, shown as in Table 2) despite stable convergence and limited overfitting. Informer delivers the best overall performance at H = 1 day (Figure 10), accurately capturing both the amplitude and timing of daily discharge variations, including most medium discharge peaks, with the lowest errors (RMSE ≈ 78 m3/s, ≈ 0.80, shown as in Table 2) and fast, stable convergence. In contrast, iTransformer mainly tracks the baseline trend while strongly underestimating discharge peaks, showing wider scatter, large negative residuals, and signs of overfitting, leading to the poorest performance among the three models (RMSE ≈ 119 m3/s, ≈ 0.54, shown as in Table 2).
Figure 10.
Model performance assessment of Informer for a 1-day forecasting horizon: (a) Time series of observed and predicted discharge, (b) predicted–observed scatter with 1:1 line, (c) residual analysis with ±1σ envelope to assess bias and dispersion, and (d) training/validation loss curves during model training for each forecasting horizon.
Table 2.
Performance comparison of deep learning models for discharge forecasting at multiple horizons.
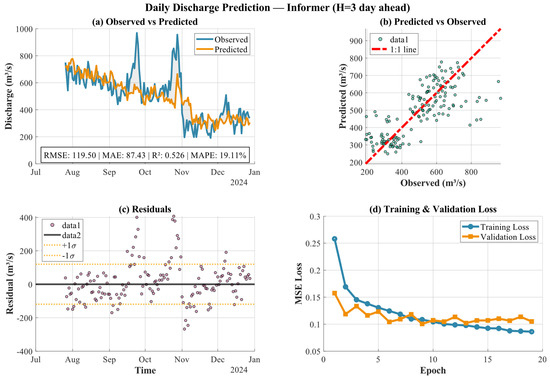
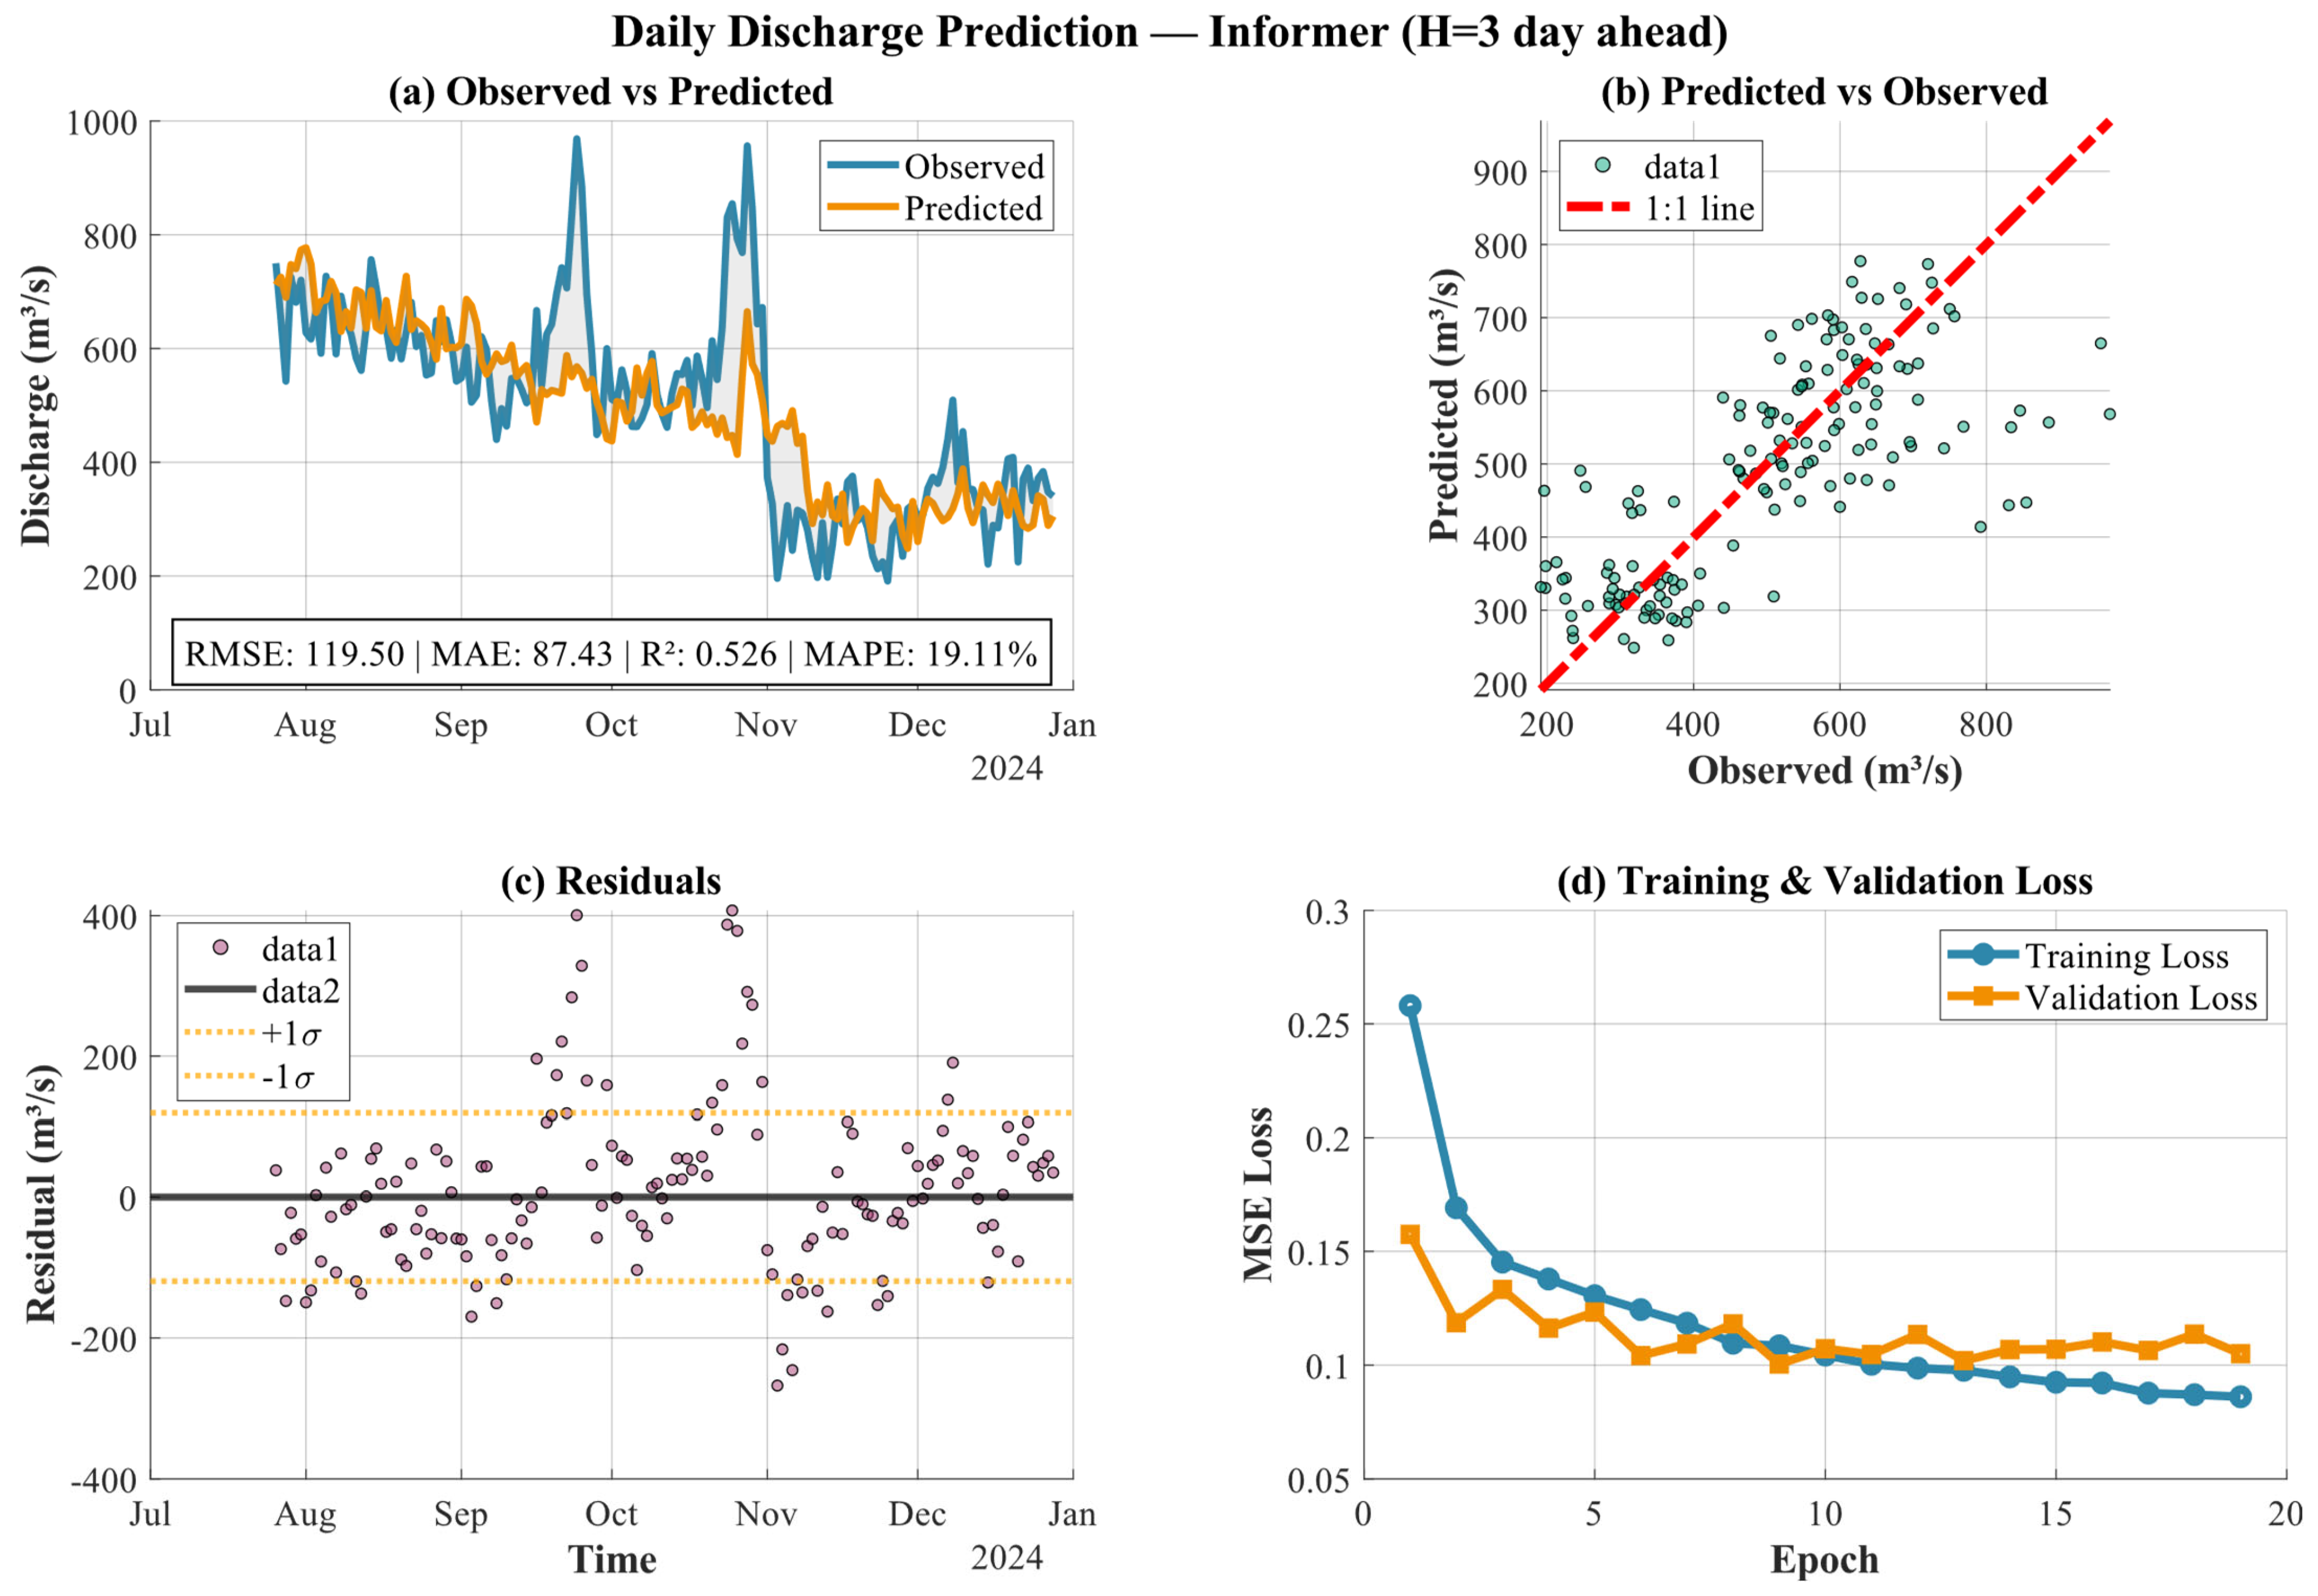
When the forecast horizon increases to 3 days (Figure 11, Figure A4, Figure A5 and Figure A6), model performance degrades for all models, but to different extents. Autoformer maintains the overall trend but increasingly underestimates peaks and loses phase accuracy (RMSE ≈ 113 m3/s, ≈ 0.58). Informer remains robust at H = 3 days (Figure 11), with residuals more tightly distributed and better performance in the operationally relevant discharge range (350–750 m3/s), despite partial peak smoothing (RMSE ≈ 113 m3/s, ≈ 0.57). By contrast, iTransformer performance deteriorates sharply, with strong peak clipping, large errors (RMSE ≈ 159 m3/s), and clear overfitting behavior, indicating limited suitability for short-to-medium-term discharge forecasting under rapidly varying reservoir operations.
Figure 11.
Model performance assessment of Informer for a 3-day forecasting horizon: (a) Time series of observed and predicted discharge, (b) predicted–observed scatter with 1:1 line, (c) residual analysis with ±1σ envelope to assess bias and dispersion, and (d) training/validation loss curves during model training for each forecasting horizon.
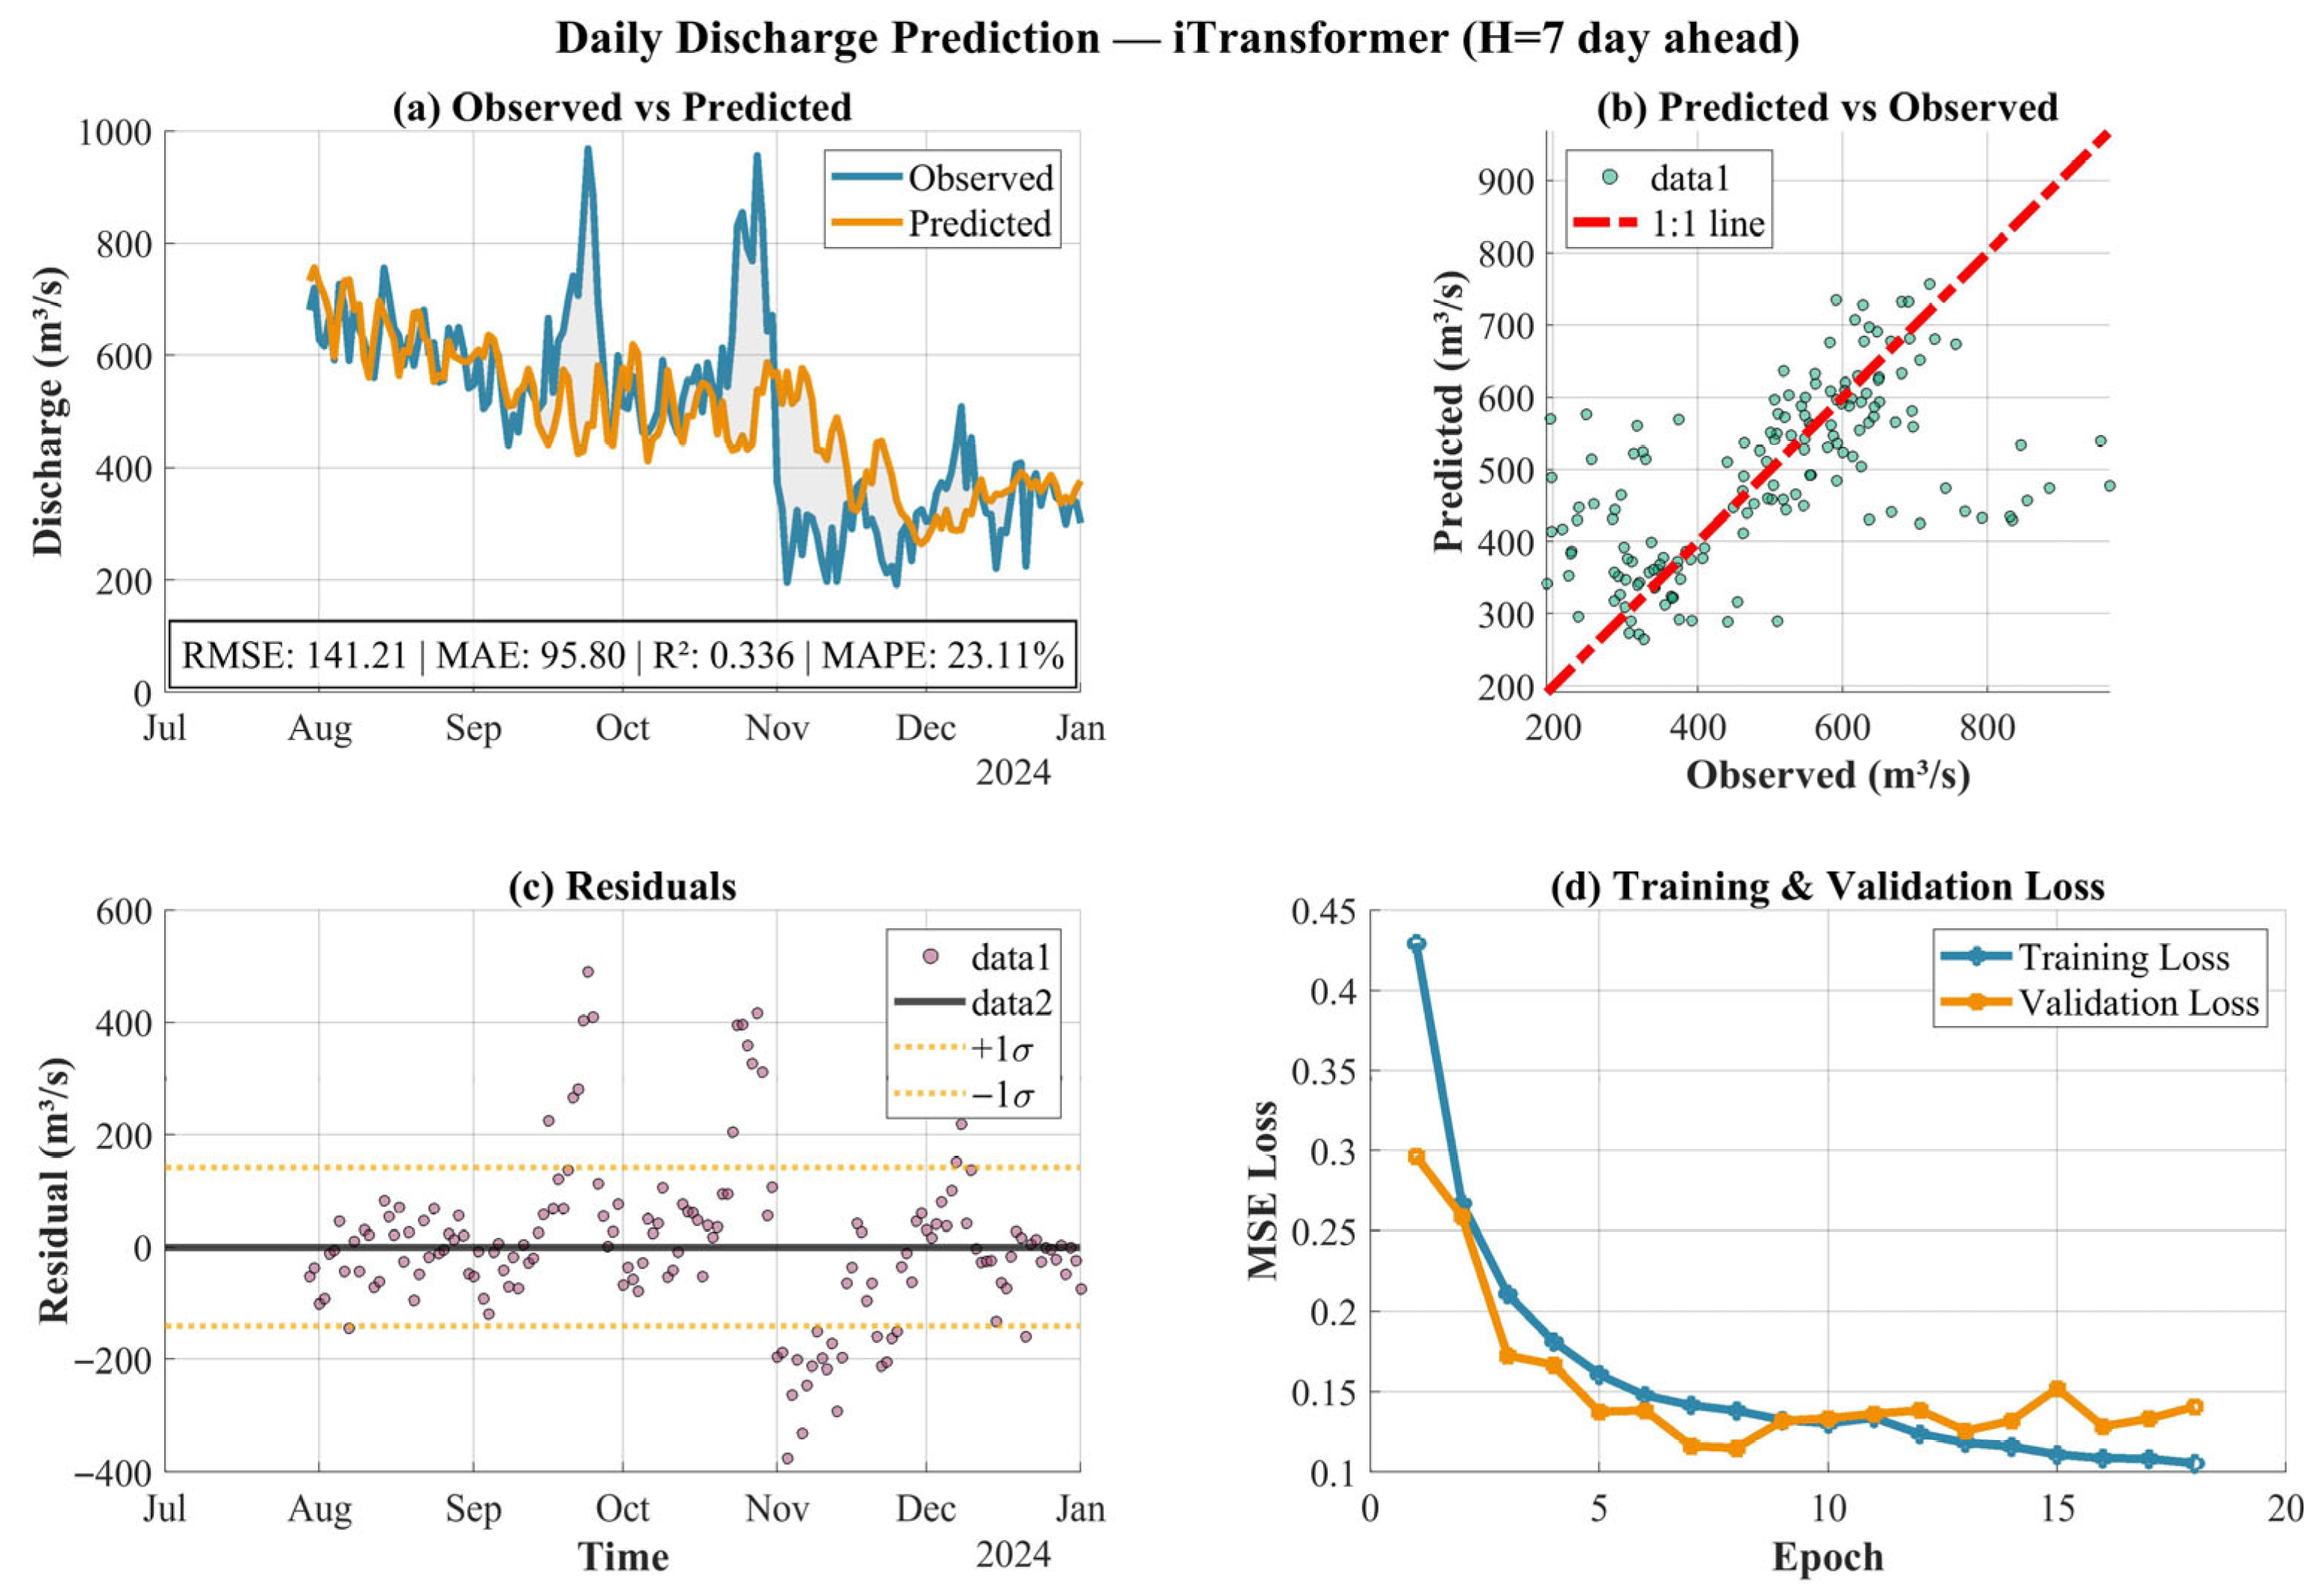
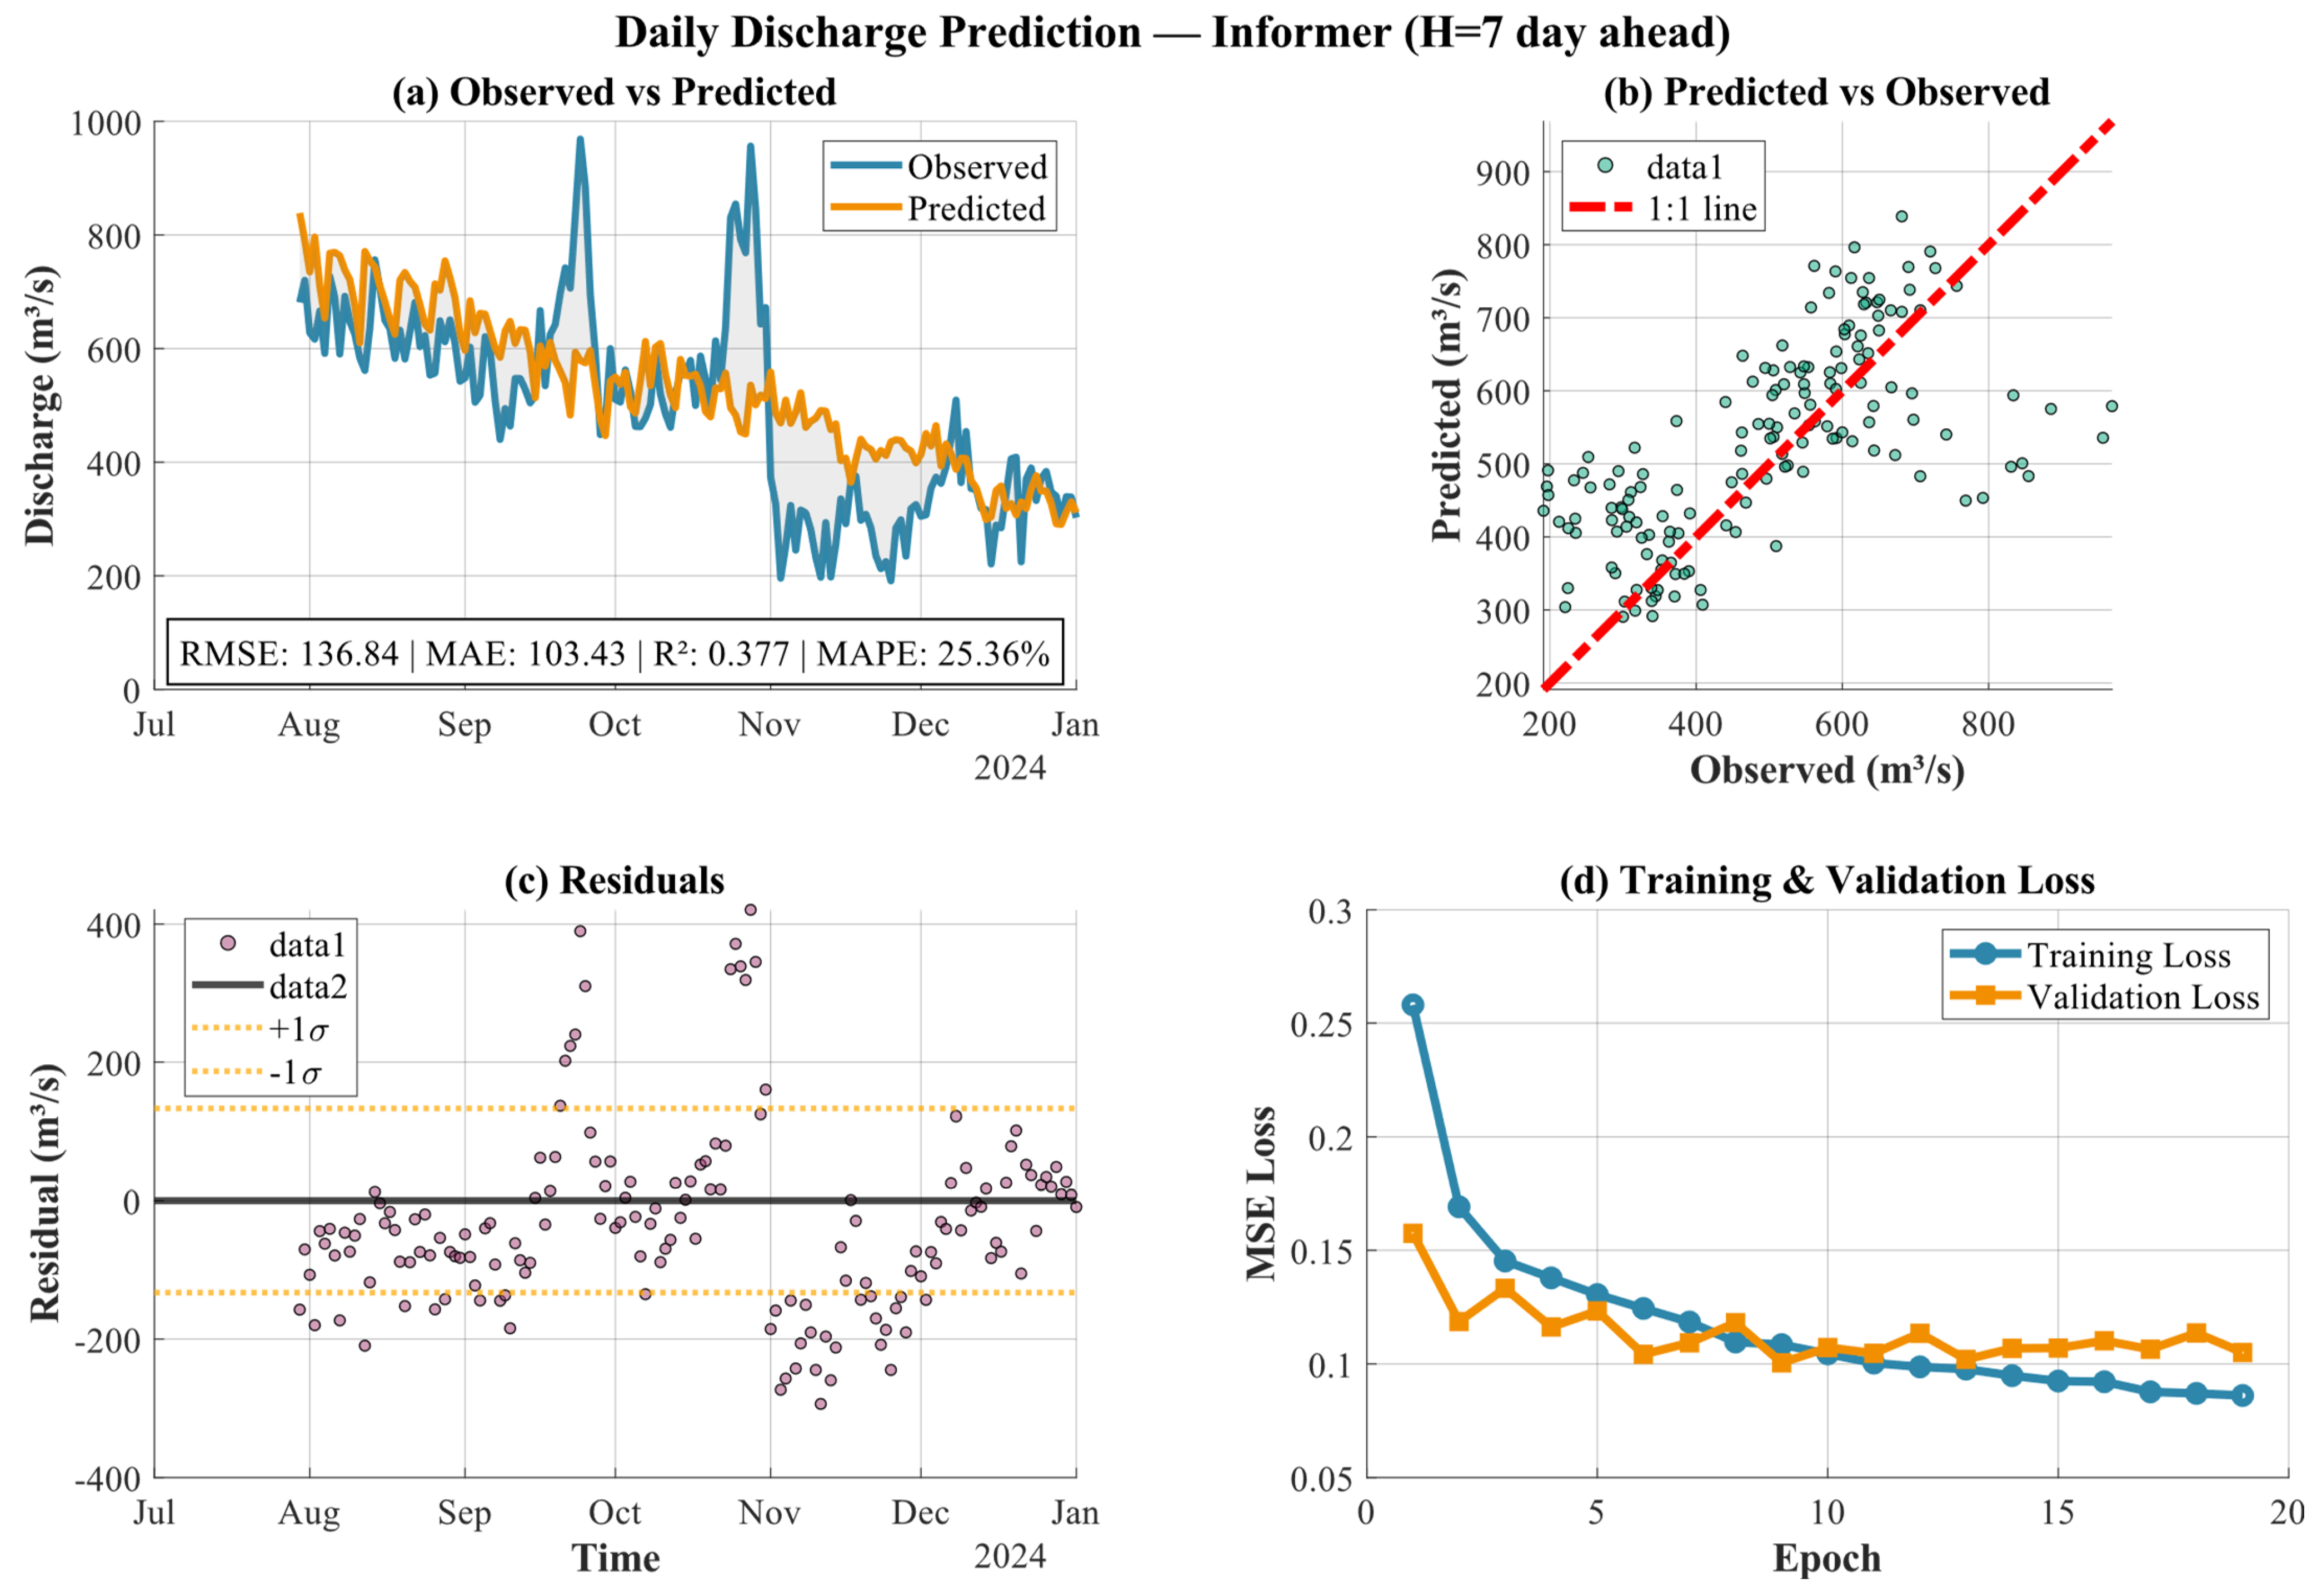
At the 7-day forecast horizon (Figure 12, Figure A3 and Figure A6), all models exhibit substantial performance degradation. Autoformer retains the long-term discharge trend but strongly smooths short-term fluctuations (RMSE ≈ 164 m3/s, ≈ 0.10, shown as in Table 2), whereas Informer continues to outperform the other models and remains comparatively robust at H = 7 days (Figure 12), better preserving medium-scale variability and maintaining more stable training behavior (RMSE ≈ 135 m3/s, ≈ 0.40, shown as in Table 2). iTransformer shows the strongest deterioration, with nearly complete loss of discharge peak representation, severe underestimation, and negative explanatory power ( ≈ −0.10), confirming its limited applicability for long-horizon forecasting in highly fluctuating discharge regimes.
Figure 12.
Model performance assessment of Informer for a 7-day forecasting horizon: (a) Time series of observed and predicted discharge, (b) predicted-observed scatter with 1:1 line, (c) residual analysis with ±1σ envelope to assess bias and dispersion, and (d) training/validation loss curves during model training for each forecasting horizon.
Overall, comparison across all forecast horizons (H = 1, 3, and 7 days) indicates that Informer is the most suitable model for short-term early warning (1–3 days) owing to its superior ability to capture both the timing and amplitude of discharge fluctuations. Autoformer, while less responsive to extremes, demonstrates greater stability and trend retention at longer horizons (≥7 days), making it more appropriate for medium- to long-term operational planning. These results support a complementary operational strategy, in which Informer is used for short-term discharge warning, and Autoformer provides longer-range discharge guidance within a unified forecasting framework. Similar applications of machine learning and deep learning models for reservoir or river discharge forecasting have been reported in recent studies [15,20]. Consistent with those findings, the results here confirm the ability of transformer-based architectures to capture complex hydrological patterns. However, unlike many existing studies, the present analysis explicitly shows that forecast skill is strongly horizon-dependent and that extreme discharge peaks remain difficult to reproduce. This highlights a key limitation of purely data-driven approaches in highly regulated systems.
It is also important to note that model performance decreases under high-flow conditions, particularly for discharges exceeding approximately 800 m3/s, as observed in Figure 12. This behavior is consistent across all evaluated models and reflects a common limitation of data-driven approaches in capturing rare and extreme events. Such high-flow conditions are relatively underrepresented in the training data and are often associated with abrupt operational decisions, making them difficult to predict accurately. Rather than contradicting the study motivation, this finding highlights the critical need for specialized modeling strategies targeting extreme conditions. Future work could explore extreme-aware training schemes, data augmentation techniques, or hybrid physics-AI approaches to improve predictive skill for high-impact discharge events. This horizon-dependent behavior can be interpreted in relation to both reservoir dynamics and model architecture. The statistical analysis shows that discharge is characterized by near-instantaneous response to inflow (max CCF ≈ 0.58 at lag = 0), delayed responses to operational variables (e.g., upstream water level at lag ≈ 3 days and generation at lag ≈ 4 days), and strong temporal persistence. Under these conditions, Informer performs best at short lead times by capturing recent shocks and abrupt changes, while Autoformer becomes more suitable at longer horizons due to its decomposition-based representation of smoother temporal structures. In contrast, iTransformer applies attention across variables rather than along the temporal dimension, which limits its ability to capture rapid temporal regime shifts and abrupt discharge peaks associated with reservoir operation. This explains its weaker performance, particularly under highly variable and extreme discharge conditions. All three models are evaluated simultaneously under identical experimental settings. For clarity and conciseness, only representative figures are shown in the main text, while additional diagnostic plots are provided in the Appendix A.
Overall, these results provide additional evidence that data-driven forecasting in regulated reservoirs is inherently more complex than in natural river systems. Compared to previous studies, this work highlights the critical role of operational controls and reinforces the need for hybrid approaches to better represent extreme and non-stationary discharge behavior.
Beyond the specific case study, these findings contribute to a broader understanding of data-driven hydrological forecasting. Similar limitations in capturing extreme events have been reported in recent studies using deep learning models, particularly in systems with strong human regulation or non-stationary dynamics. This suggests that the challenge is not model-specific but reflects a more fundamental limitation of purely data-driven approaches under rapidly changing operational regimes. Compared to studies in natural river systems, where model performance is often more stable, the results here highlight the additional complexity introduced by reservoir operations. Therefore, the findings emphasize the need for hybrid or physics-informed approaches that can better account for abrupt regime shifts and operational constraints in regulated basins.
4. Conclusions
This study developed a comprehensive framework based on reservoir operation data to analyze high flow discharge dynamics and assess operational severity at Ba Ha hydropower reservoir in the period 2018–2025. The results show that the reservoir exhibits strong temporal persistence while responding rapidly to inflow and operational drivers, with power generation and inflow identified as the dominant controls. The multi-method time series analysis (ACF, CCF, , and Spearman correlation) further confirms that discharge dynamics arise from the combined influence of hydrological forcing and operational regulation. Compared with previous reservoir studies that relied primarily on hydraulic modeling or optimization frameworks [9,10,15], this study demonstrates that routinely collected operational data can be directly transformed into quantitative indicators of discharge severity and forecasting signals.
The proposed , based on peak discharge, rate of increase, and duration, effectively characterizes event-based discharge severity. More than 160 discharge events were identified, with a small number of extreme events dominating overall operational severity. This result highlights that routinely monitored operational data can be leveraged to detect high-risk discharge conditions and support early identification of critical release events.
From a forecasting perspective, the results show that Transformer-based models can reproduce discharge dynamics with varying performance depending on forecast horizon. Informer provides the highest accuracy for short-term prediction, while Autoformer demonstrates greater stability at longer horizons. However, all models show reduced skill under extreme discharge conditions, highlighting the challenges of purely data-driven approaches in highly regulated systems.
Overall, the findings demonstrate that routinely available reservoir operation data can be transformed into actionable information for discharge severity assessment and short-term forecasting without the need for complex hydraulic modeling. This provides a practical basis for real-time monitoring and early warning in regulated river systems.
In conclusion, this study not only sheds light on reservoir discharge dynamics through the exploitation of real-time operational data but also proposes a feasible methodological framework for flood discharge event identification, operational severity quantification, and downstream discharge forecasting without the need for complex hydraulic modeling. The results demonstrate strong potential for supporting early warning and operational severity management in reservoir systems where discharge regimes are influenced by both hydrological variability and power generation demand. By transforming routinely available operational data into quantitative indicators for real-time risk awareness and decision-making, this approach also contributes to the objectives of the United Nations Sustainable Development Goals, particularly SDG 6 (Clean Water and Sanitation) and SDG 13 (Climate Action).
Despite these contributions, several limitations should be acknowledged. First, the analysis focuses on a single reservoir and does not account for inter-reservoir interactions within a broader cascade system. Second, the forecasting framework operates at a daily time step and does not explicitly capture sub-daily dynamics or leverage complementary data sources. Third, the study does not directly quantify downstream impacts in terms of inundation extent or exposure. These limitations highlight several directions for future research. Extending the framework to multi-reservoir systems, integrating the OSI with hydraulic or remote sensing-based discharge information, and refining operational severity indicators using multi-criteria or damage-based calibration would improve system realism and applicability. In addition, the development of hybrid physics–AI and extreme-aware forecasting models may enhance the representation of abrupt discharge events. Finally, embedding the proposed framework into a decision-support system, co-developed with reservoir operators, would facilitate the translation of research outcomes into practical early warning and operational management tools.
Although demonstrated at the Ba Ha reservoir, the proposed framework is designed to be transferable to other regulated reservoirs where operational datasets are available, providing a practical tool for analyzing discharge dynamics and supporting early-warning-oriented reservoir management.
Overall, the results highlight that forecast skill in highly regulated reservoirs is inherently horizon-dependent, reflecting the interaction between abrupt operational release decisions and persistent storage dynamics. This explains why models emphasizing short-term signal extraction outperform at short lead times, while those favoring smoother temporal structure become more suitable at longer horizons. Importantly, the systematic underestimation of extreme discharge peaks across models reveals a key limitation of purely data-driven approaches in capturing rare but operationally critical events. These findings suggest that future forecasting frameworks may benefit from integrating data-driven models with process-informed or hybrid approaches to better represent rapid regime shifts in regulated river systems.
The main findings of this study can be summarized as follows:
- First, operational severity in regulated reservoirs is dominated by a small number of rare but high-impact discharge events characterized by rapid release, high peak discharge, and multi-day persistence.
- Second, the discharge dynamics of the Ba Ha reservoir reflect a strongly regulated system, where near-instantaneous response to inflow (lag ≈ 0), with delayed responses for other operational variables and operational decisions play a central role alongside hydrological forcing.
- Third, the forecasting performance of Transformer-based models is strongly horizon-dependent, with Informer excelling at short lead times and Autoformer providing more stable long-range predictions.
- Finally, all models show reduced skill under extreme discharge conditions, indicating that purely data-driven approaches remain limited in capturing rare but operationally critical events in highly regulated reservoir systems.
Author Contributions
Conceptualization, N.T.H.; methodology, N.T.H. and V.Q.T.; validation, N.T.H. and V.Q.T.; formal analysis, N.T.H.; resources, N.T.H. and H.H.L.; data curation, N.T.H.; writing—original draft preparation, N.T.H. and V.Q.T.; writing—review and editing, N.T.H., V.Q.T. and H.H.L.; visualization, N.T.H. and V.Q.T.; supervision, H.H.L.; project administration, H.H.L.; funding acquisition, N.T.H. All authors have read and agreed to the published version of the manuscript.
Funding
This research received no external funding.
Institutional Review Board Statement
Not applicable.
Informed Consent Statement
Not applicable.
Data Availability Statement
Data will be made available on request.
Acknowledgments
We acknowledge Nguyen Tat Thanh University, Ho Chi Minh City, Vietnam for supporting this study.
Conflicts of Interest
The authors declare that they have no conflict of interest.
Abbreviations
The following abbreviations are used in this manuscript:
| ACF | Autocorrelation Function |
| CHIRPS | Climate Hazards Group Infrared Precipitation with Stations |
| CCF | Cross-correlation Function |
| DROP | Data-driven Reservoir Operation Prediction |
| GPM | Global Precipitation Measurement |
| HEC-RAS | Hydrologic Engineering Center’s River Analysis System |
| MAE | Mean Absolute Error |
| MAPE | Mean Absolute Percentage Error |
| MI | Mutual Information |
| MSWEP | Multi-Source Weighted-Ensemble Precipitation |
| OSI | Operational Severity Index |
| PERSIANN | Precipitation Estimation from Remotely Sensed Information using Artificial Neural Networks |
| RMSE | Root Mean Square Error |
| SDG | Sustainable Development Goal |
| TMPA | TRMM Multisatellite Precipitation Analysis |
| TRMM | Tropical Rainfall Measuring Mission |
Appendix A
Figure A1.
Detailed diagnostic plots for the Autoformer model at a 1-day forecast horizon, shown to provide additional visual diagnostics and to avoid redundancy in the main text.
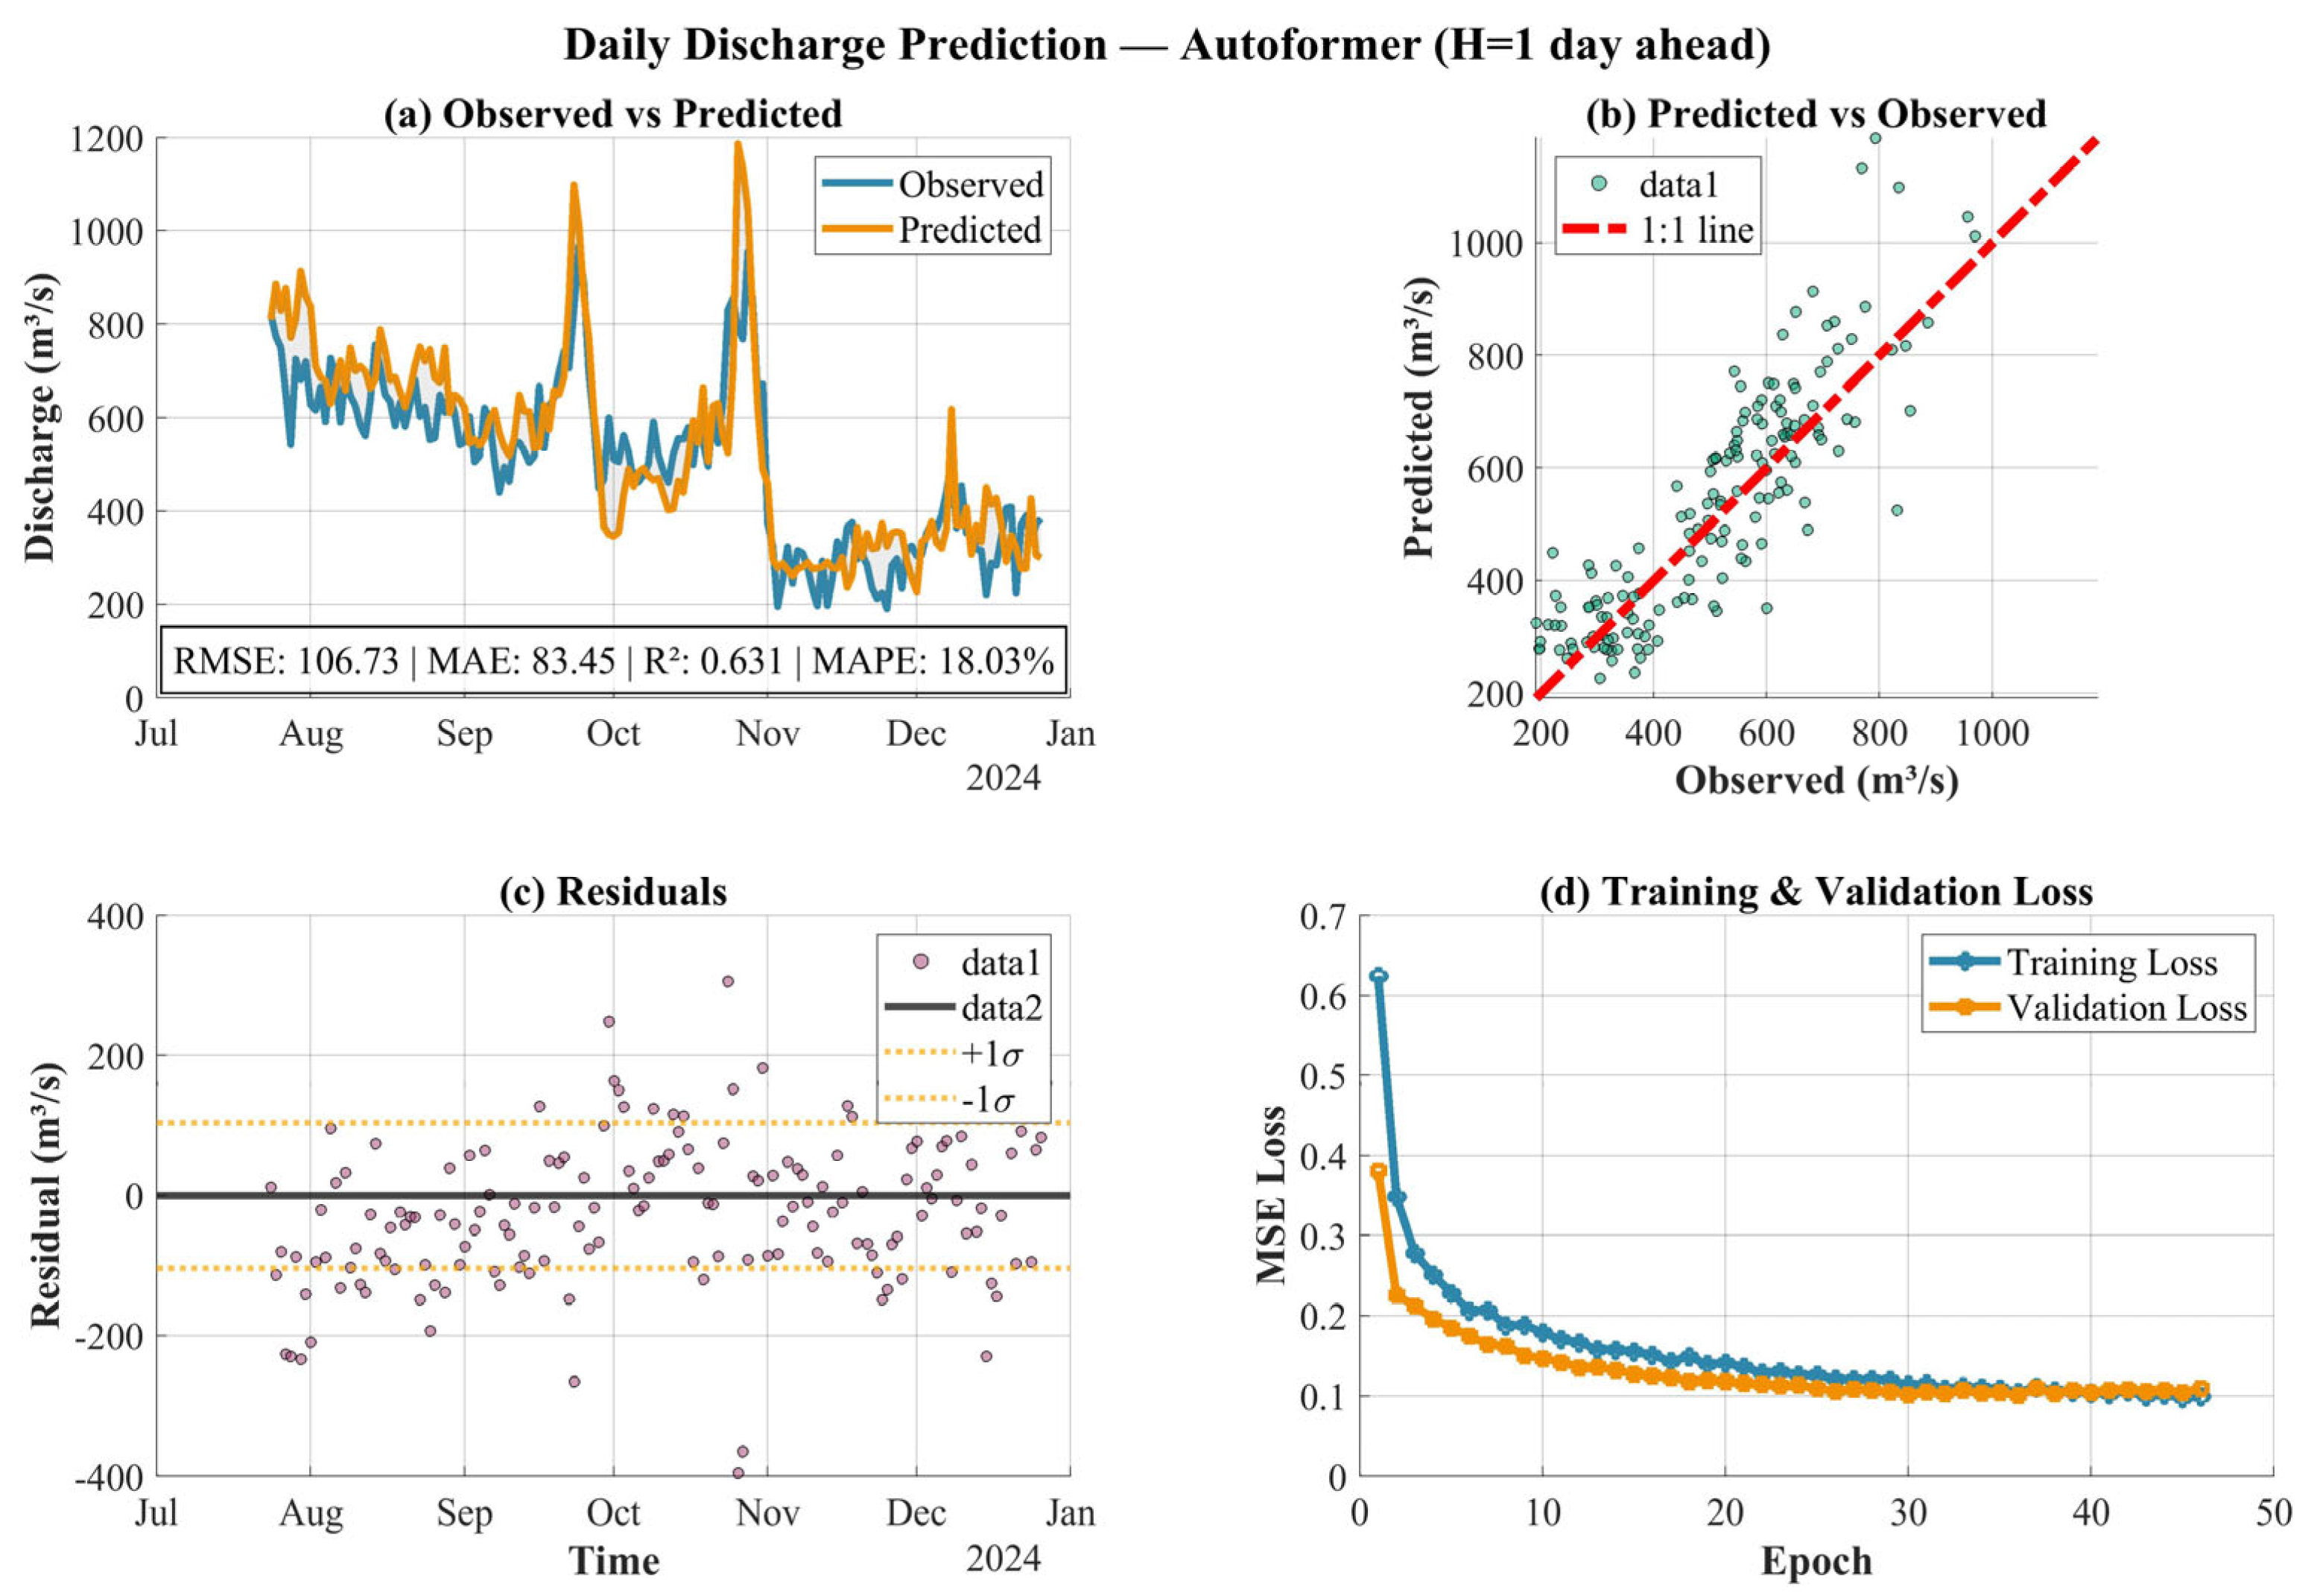
Figure A2.
Same as Figure A1, but for a 3-day forecast horizon.
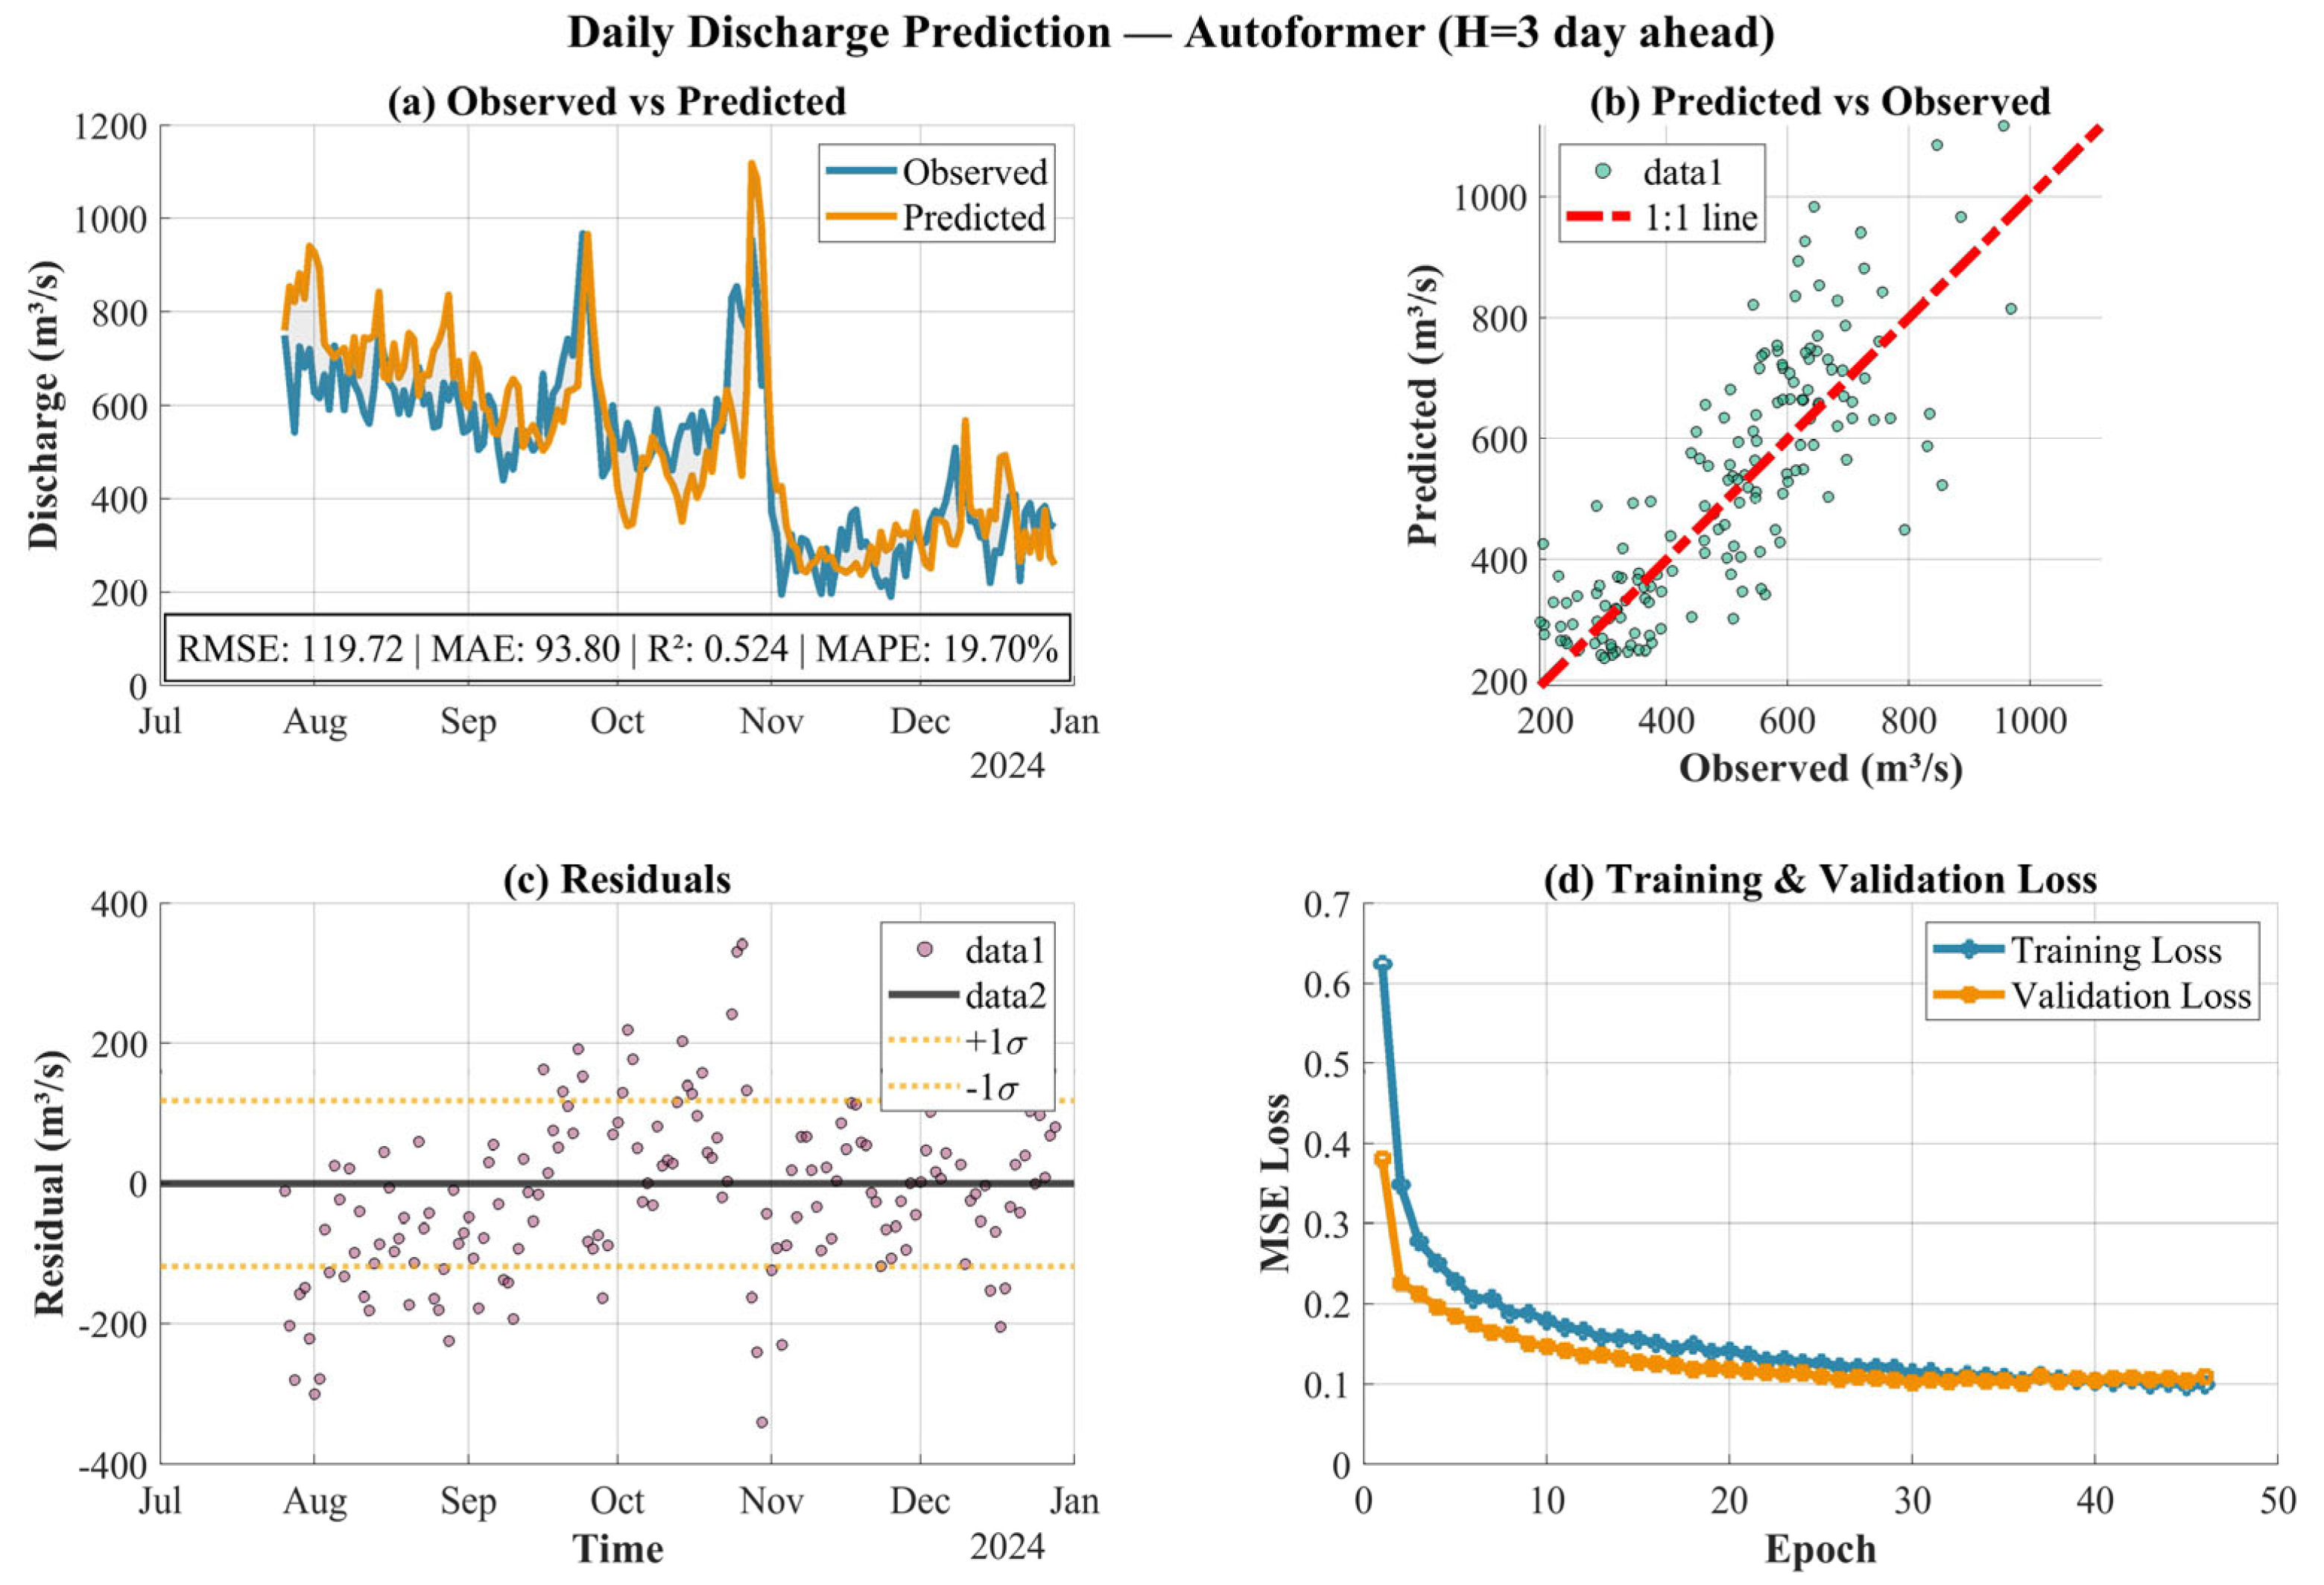
Figure A3.
Same as Figure A1, but for a 7-day forecast horizon.
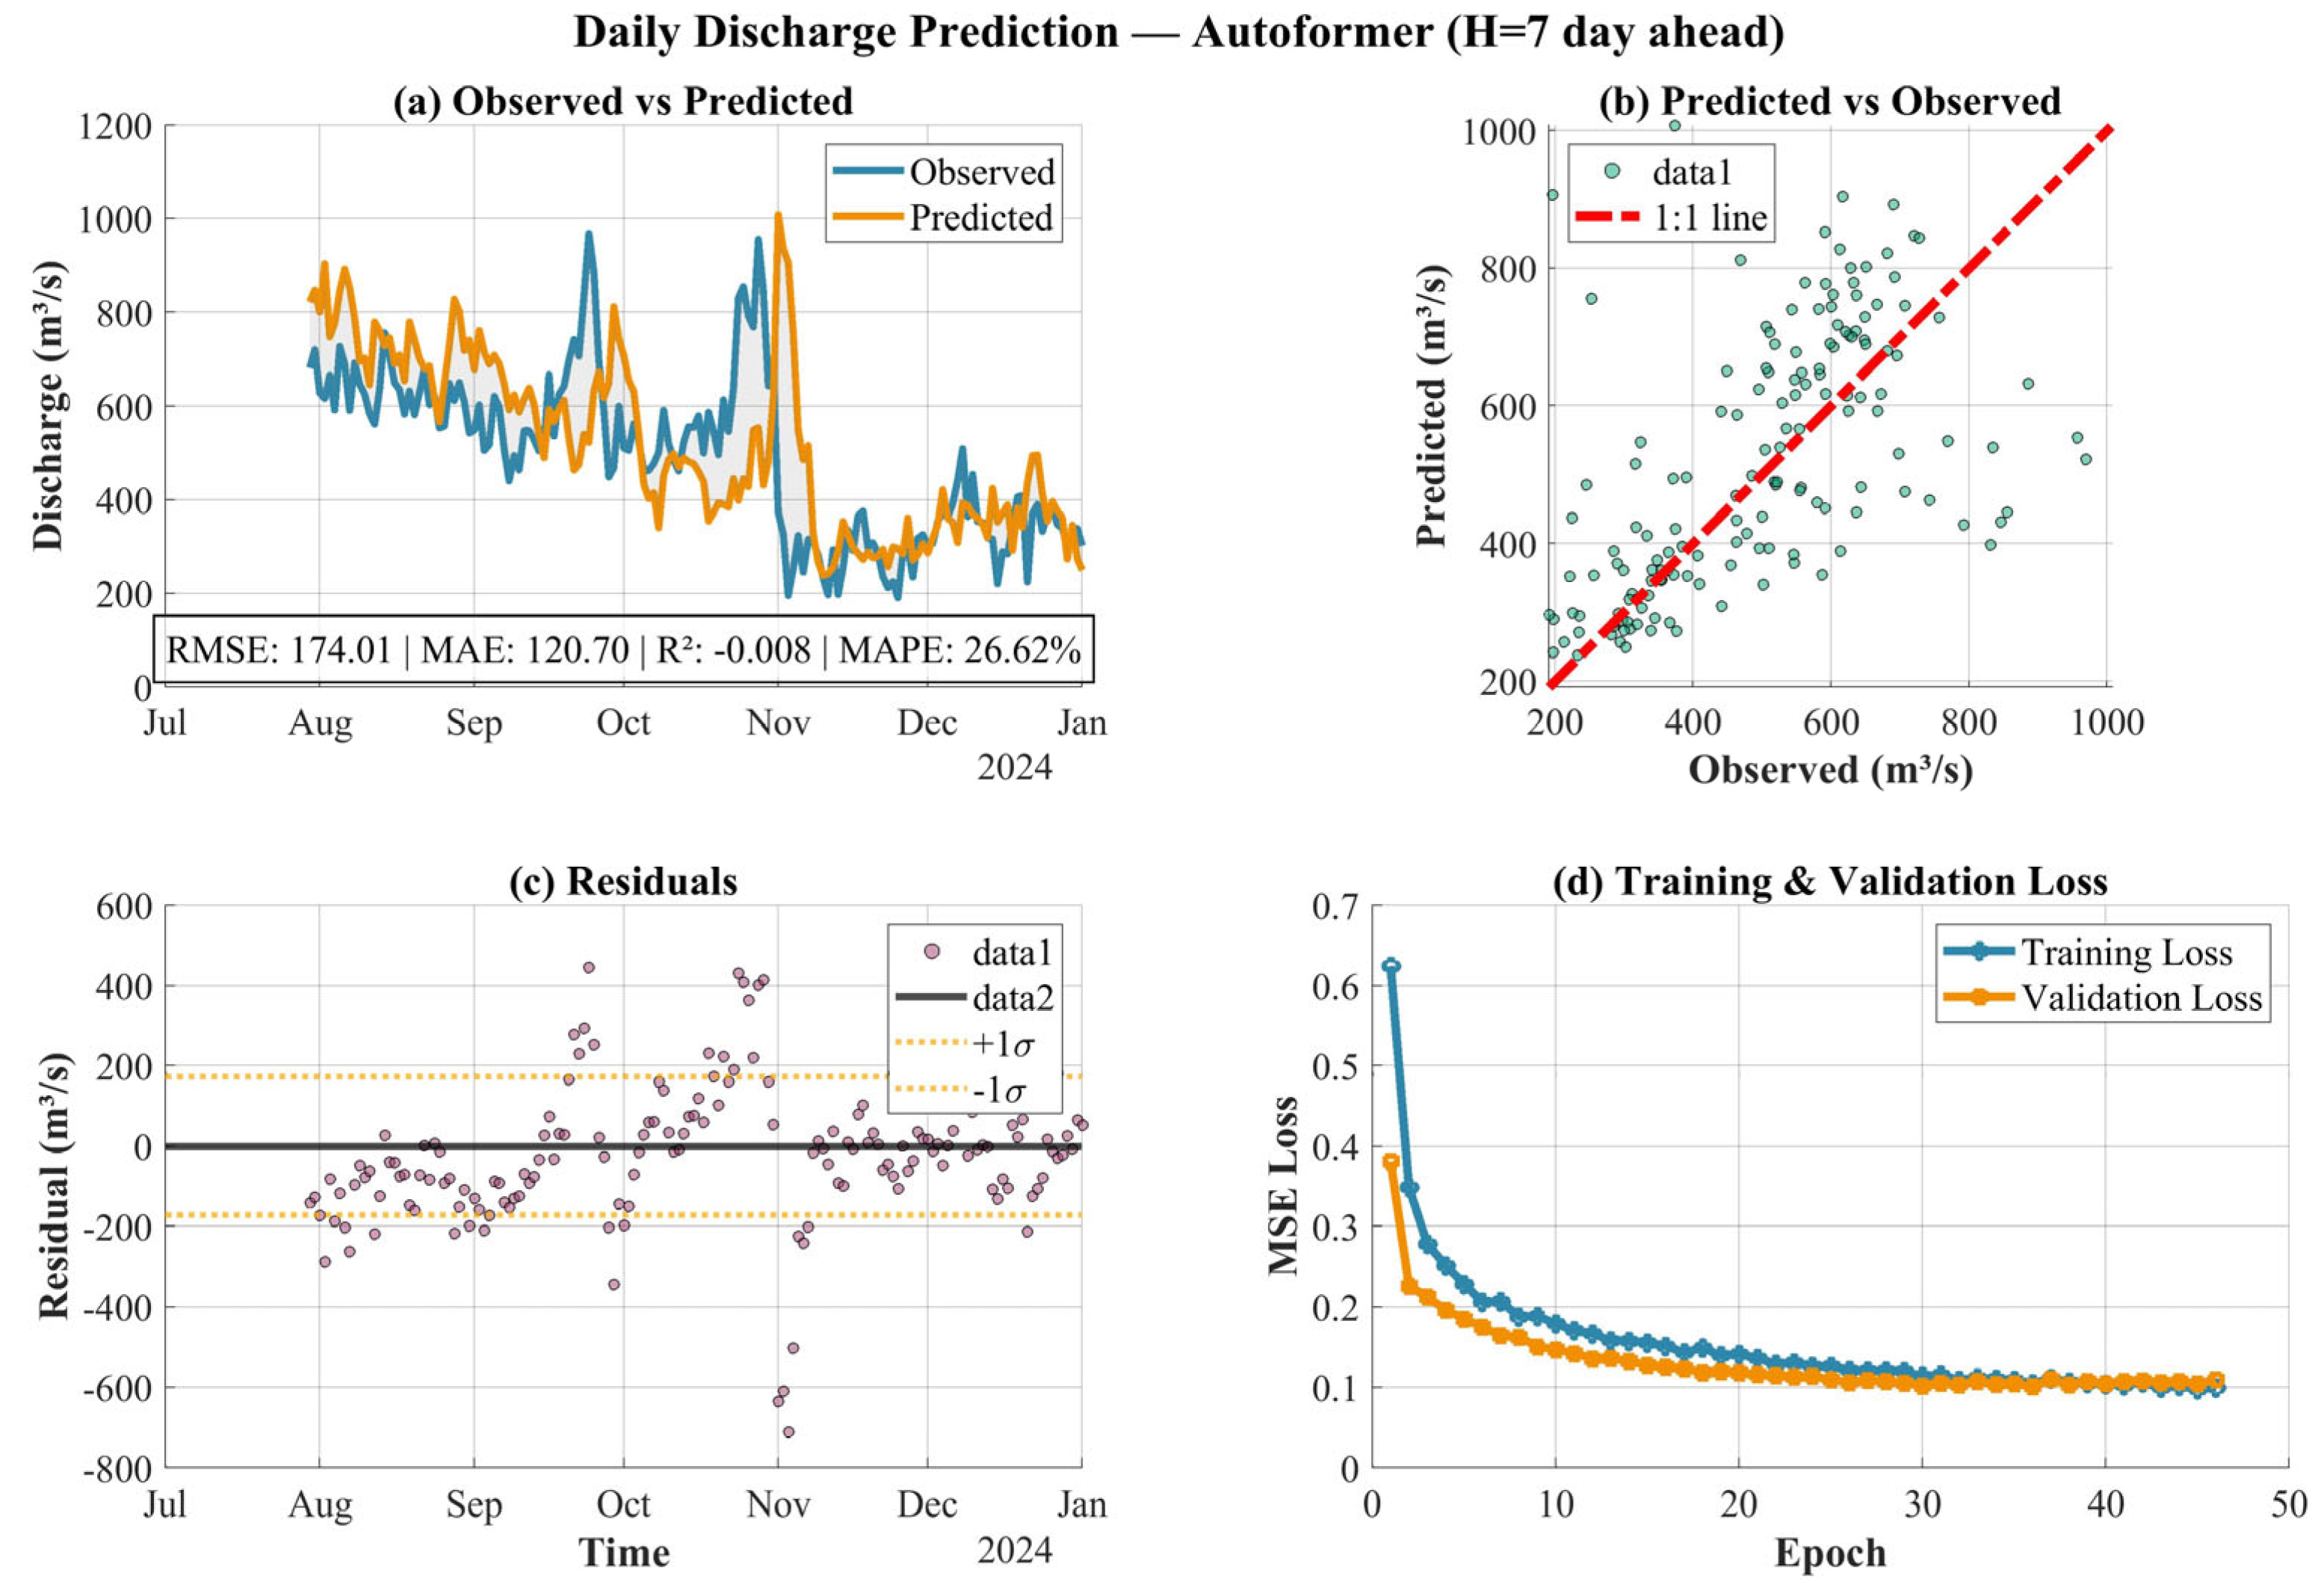
Figure A4.
Detailed diagnostic plots for the iTransformer model at a 1-day forecast horizon, shown to provide additional visual diagnostics and to avoid redundancy in the main text.
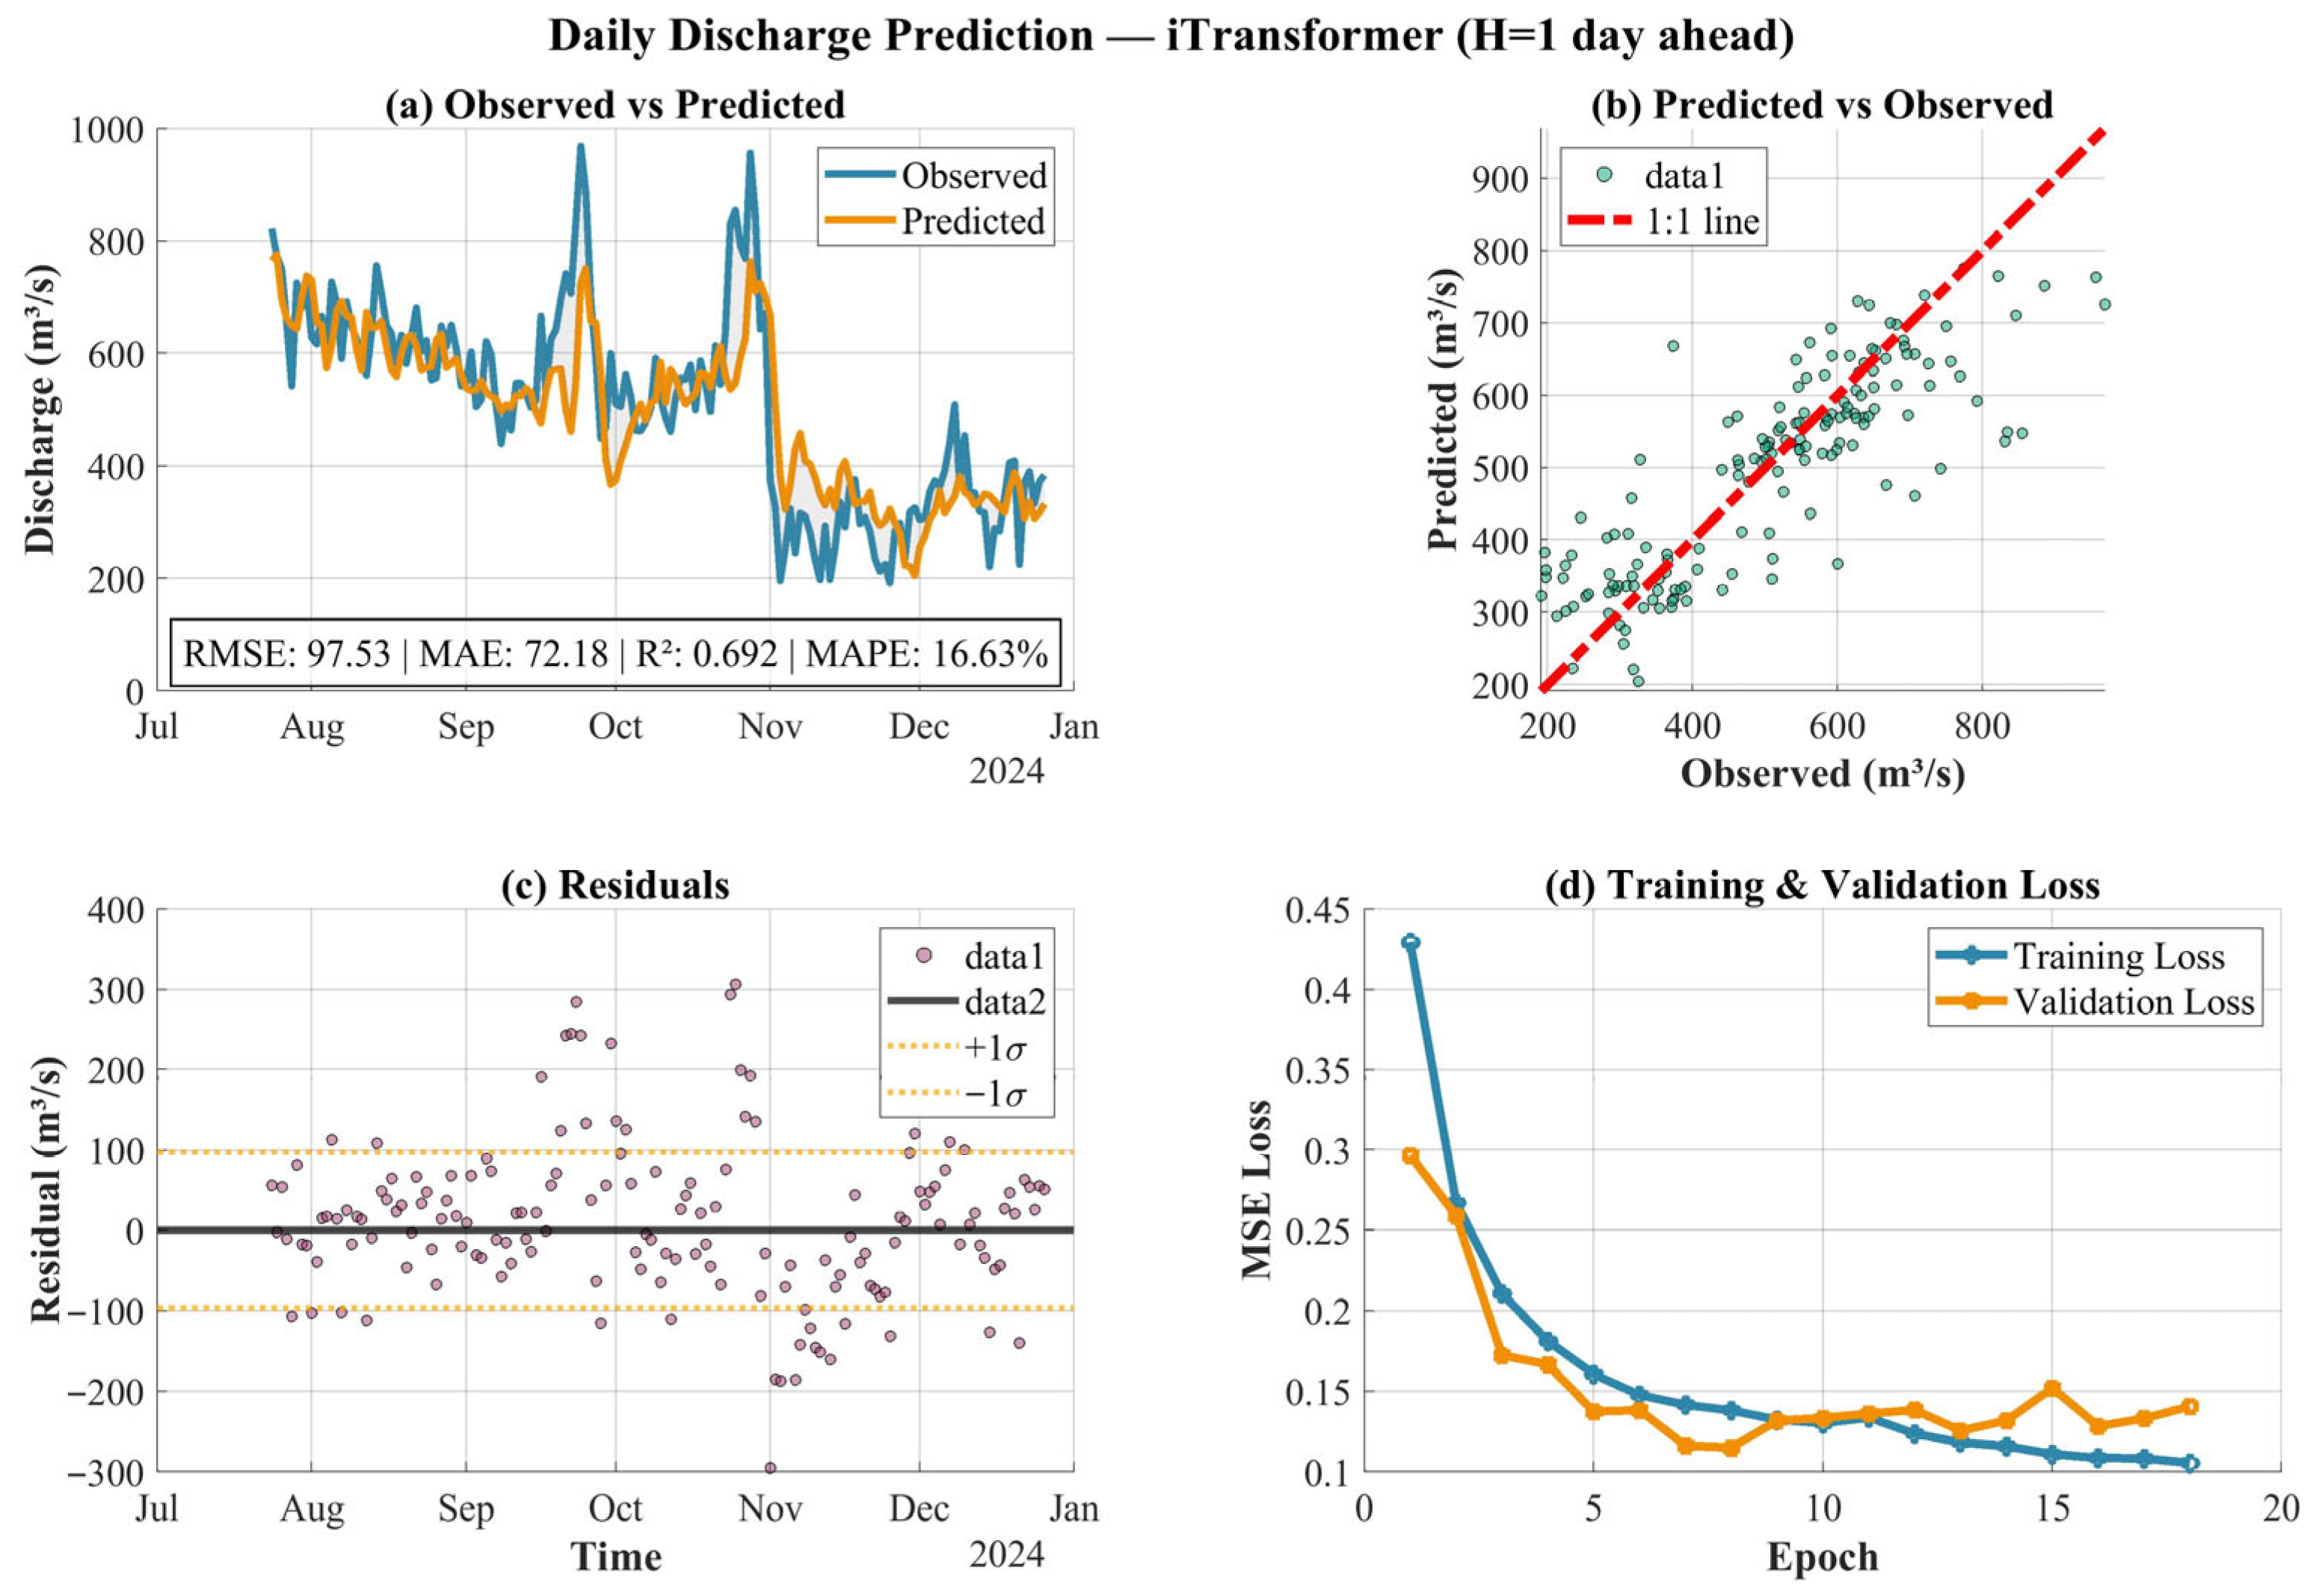
Figure A5.
Same as Figure A4, but for a 3-day forecast horizon.
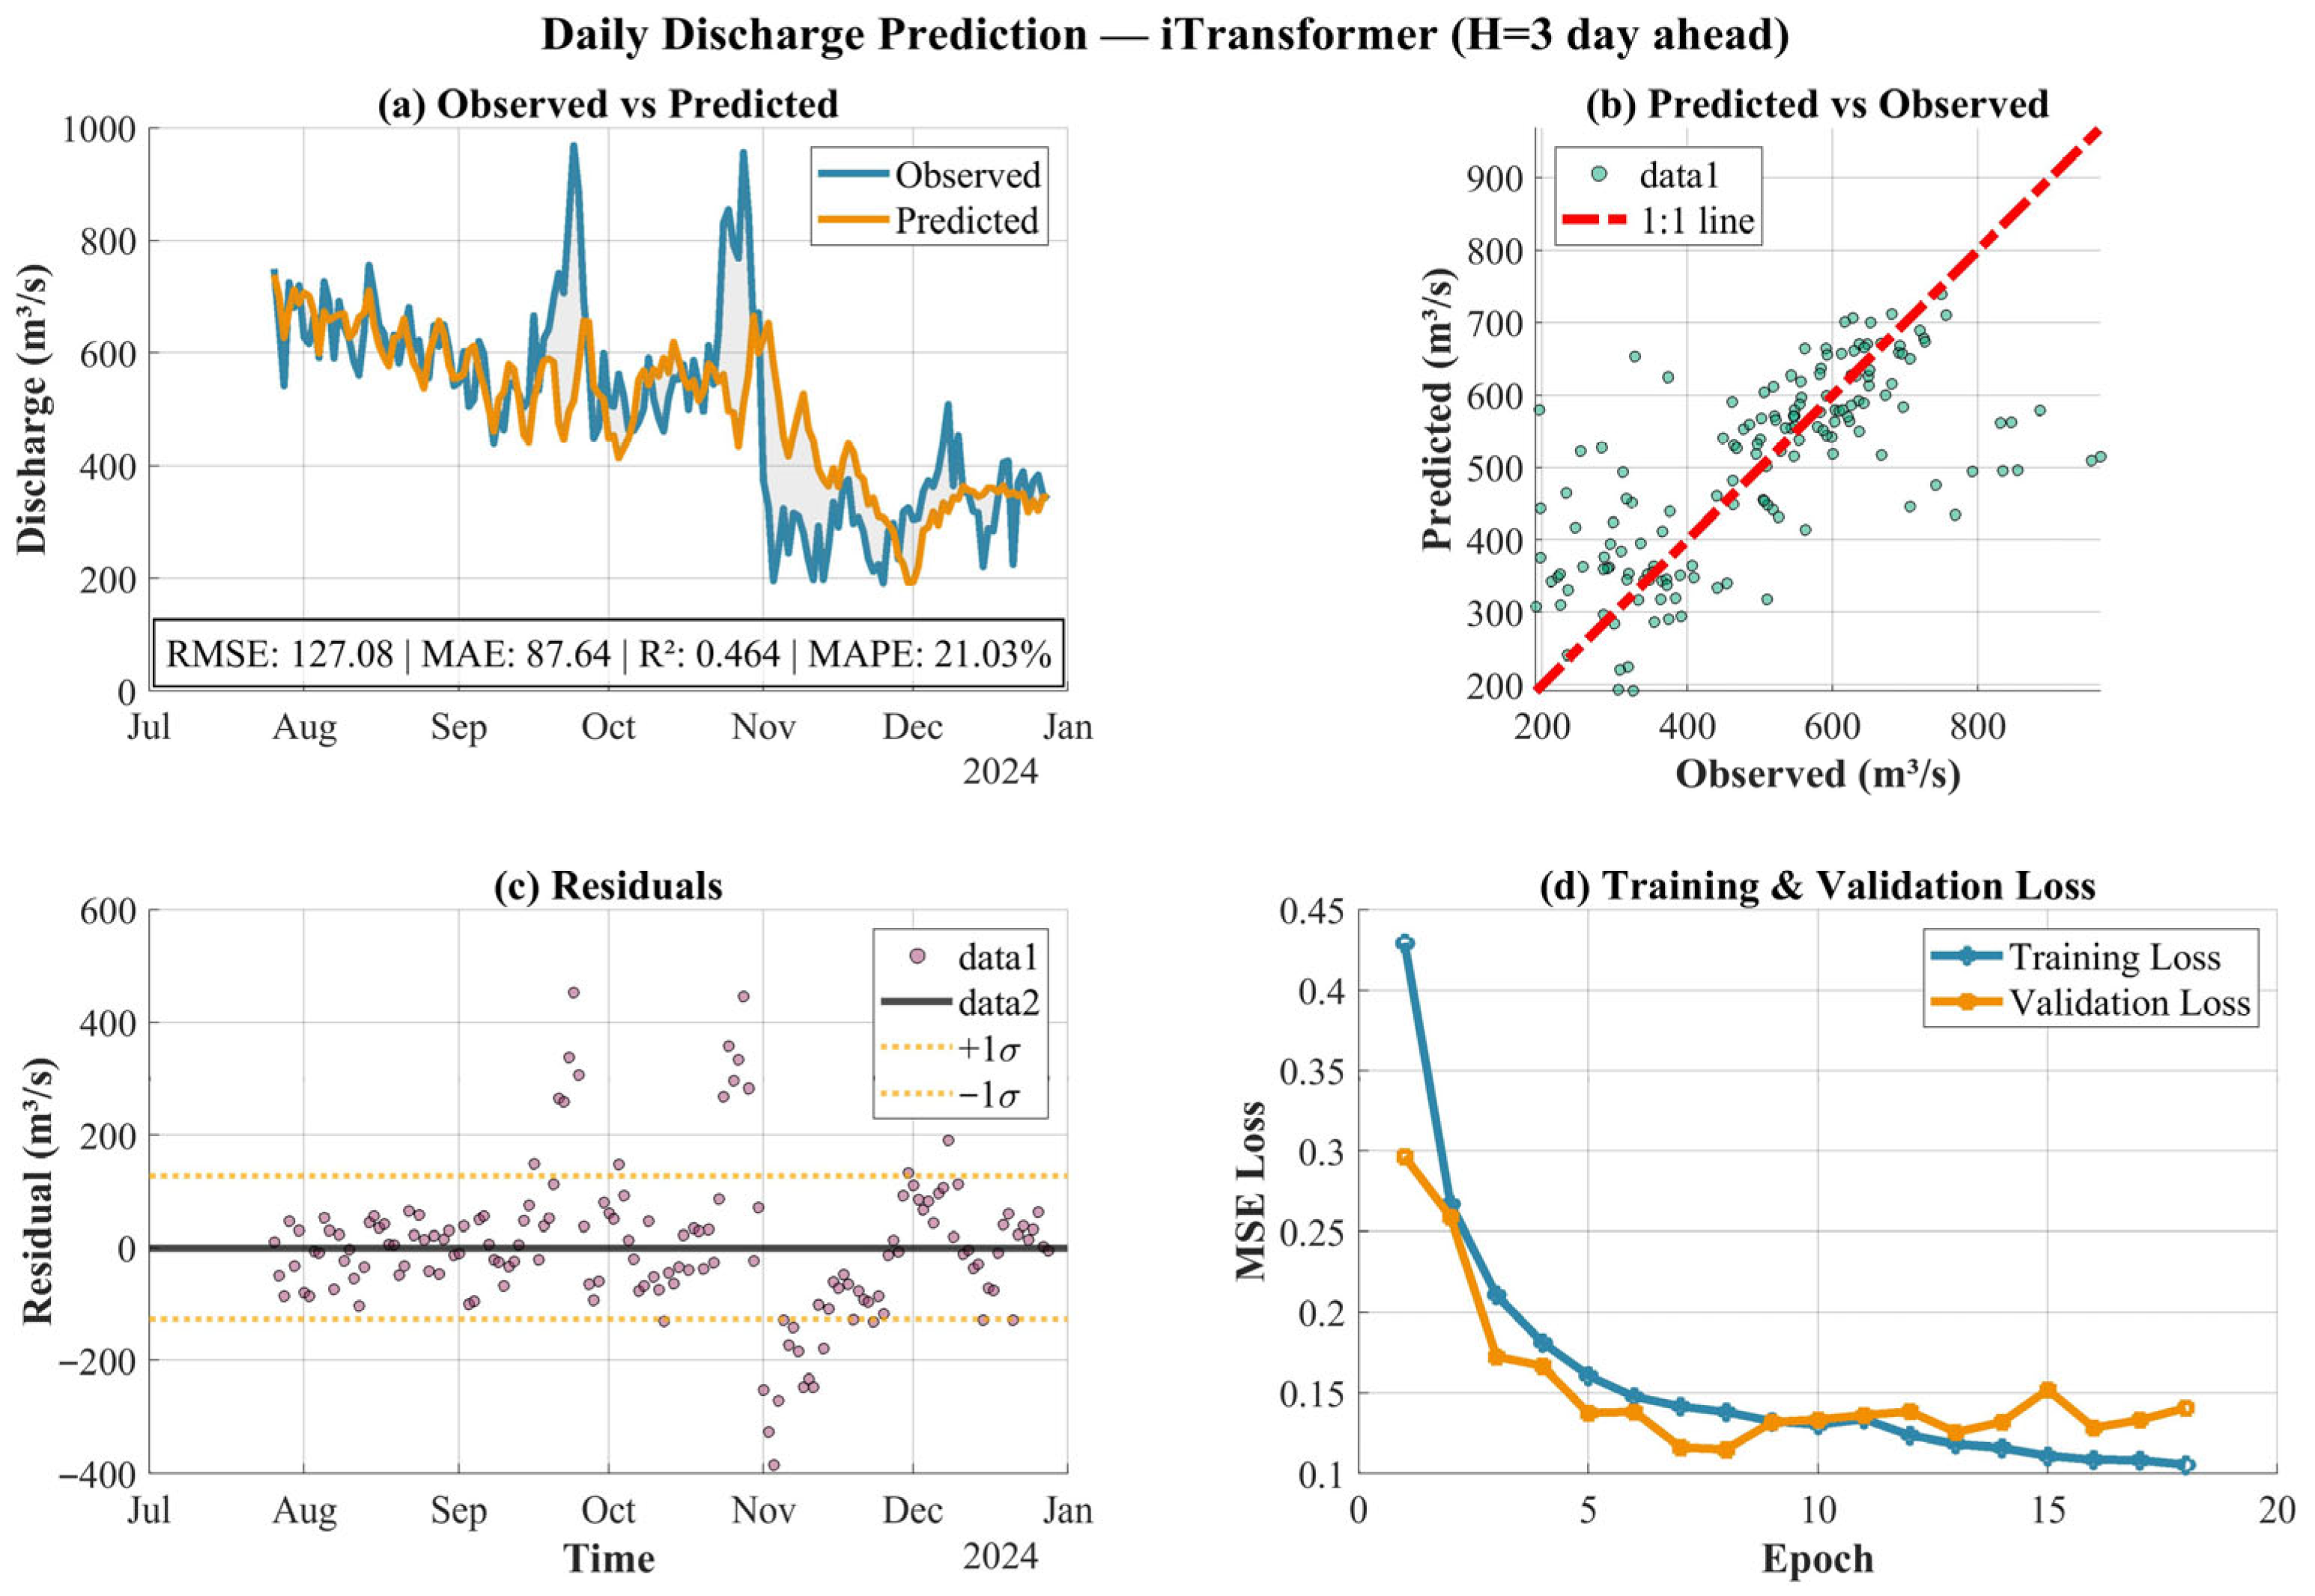
Figure A6.
Same as Figure A4, but for a 7-day forecast horizon.
References
- Schmitt, R.J.P.; Rosa, L. Dams for hydropower and irrigation: Trends, challenges, and alternatives. Renew. Sustain. Energy Rev. 2024, 199, 114439. [Google Scholar] [CrossRef] [Scilit]
- Ilmi, A. Sustainable dam development: Balancing hydropower, water management, and environmental conservation in a changing climate. Water Manag. Environ. Conserv. Chang. Clim. 2025. [Google Scholar] [CrossRef] [Scilit]
- Weinberg, J.; Gerten, D.; Stenzel, F. Mitigation measures in energy systems. In The Essential Drop to Reach Net-Zero: Unpacking Freshwater’s Role in Climate Change Mitigation; Stockholm International Water Institute: Stockholm, Sweden, 2022. [Google Scholar]
- Wasti, A.; Ray, P.; Wi, S.; Folch, C.; Ubierna, M.; Karki, P. Climate change and the hydropower sector: A global review. WIREs Clim. Change 2022, 13, e757. [Google Scholar] [CrossRef] [Scilit]
- Vegad, U.; Mishra, V. Climate change and effectiveness of dams in flood mitigation in India. npj Nat. Hazards 2025, 2, 63. [Google Scholar] [CrossRef] [Scilit]
- Graf, W.L. Downstream hydrologic and geomorphic effects of large dams on American rivers. Geomorphology 2006, 79, 336–360. [Google Scholar] [CrossRef] [Scilit]
- Hall, J.; Arheimer, B.; Borga, M.; Brázdil, R.; Claps, P.; Kiss, A.; Kjeldsen, T.R.; Kriaučiūnienė, J.; Kundzewicz, Z.W.; Lang, M.; et al. Understanding flood regime changes in Europe: A state-of-the-art assessment. Hydrol. Earth Syst. Sci. 2014, 18, 2735–2772. [Google Scholar] [CrossRef] [Scilit]
- Grill, G.; Lehner, B.; Thieme, M.; Geenen, B.; Tickner, D.; Antonelli, F.; Macedo, H.E. Mapping the world’s free-flowing rivers. Nature 2019, 569, 215–221. [Google Scholar] [CrossRef] [Scilit] [PubMed]
- Horritt, M.S.; Bates, P.D. Evaluation of 1D and 2D numerical models for predicting river flood inundation. J. Hydrol. 2002, 268, 87–99. [Google Scholar] [CrossRef] [Scilit]
- Teng, J.; Jakeman, A.J.; Vaze, J.; Croke, B.F.W.; Dutta, D.; Kim, S. Flood inundation modelling: A review of methods, recent advances and uncertainty analysis. Environ. Model. Softw. 2017, 90, 201–216. [Google Scholar] [CrossRef] [Scilit]
- Walder, J.S.; O’Connor, J.E. Methods for predicting peak discharge of floods caused by failure of natural and constructed earthen dams. Water Resour. Res. 1997, 33, 2337–2348. [Google Scholar] [CrossRef] [Scilit]
- Khaddor, I.; Achab, M.; Soumali, M.R.; Benjbara, A.; Alaoui, A.H. The impact of the construction of a dam on flood management. Civ. Eng. J. 2021, 7, 343–356. [Google Scholar] [CrossRef] [Scilit]
- Froehlich, D.C. Peak flood discharge from a landslide dam outburst. Nat. Hazards Rev. 2022, 23, 04022001. [Google Scholar] [CrossRef] [Scilit]
- Micovic, Z.; Hartford, D.N.; Schaefer, M.G.; Barker, B.L. A non-traditional approach to the analysis of flood hazard for dams. Stoch. Environ. Res. Risk Assess. 2016, 30, 559–581. [Google Scholar] [CrossRef] [Scilit]
- Wannasin, C.; Brauer, C.C.; Uijlenhoet, R.; Van Verseveld, W.J.; Weerts, A.H. Daily flow simulation in Thailand part II: Unraveling effects of reservoir operation. J. Hydrol. Reg. Stud. 2021, 34, 100792. [Google Scholar] [CrossRef] [Scilit]
- Wannasin, C.; Brauer, C.C.; Uijlenhoet, R.; Torfs, P.J.J.F.; Weerts, A.H. Machine learning for real-time reservoir operation simulation: Comparing input variables and algorithms for the Sirikit Reservoir, Thailand. J. Hydroinform. 2024, 26, 3151–3171. [Google Scholar] [CrossRef] [Scilit]
- Sadki, M.; Munier, S.; Boone, A.; Ricci, S. Implementation and sensitivity analysis of a dam-reservoir operation model (DROP v1.0) over Spain. Geosci. Model. Dev. 2023, 16, 427–448. [Google Scholar] [CrossRef] [Scilit]
- Qiu, H.; Chen, L.; Zhou, J.; He, Z.; Zhang, H. Risk analysis of water supply–hydropower generation–environment nexus in the cascade reservoir operation. J. Clean. Prod. 2021, 283, 124239. [Google Scholar] [CrossRef] [Scilit]
- Turner, S.W.; Voisin, N. Simulation of hydropower at subcontinental to global scales: A state-of-the-art review. Environ. Res. Lett. 2022, 17, 023002. [Google Scholar] [CrossRef] [Scilit]
- Dash, S.S.; Sahoo, B.; Raghuwanshi, N.S. An integrated reservoir operation framework for enhanced water resources planning. Sci. Rep. 2023, 13, 21720. [Google Scholar] [CrossRef] [Scilit]
- Ogunjo, S.; Olusola, A.; Olusegun, C. Predicting river discharge in the Niger River Basin: A deep learning approach. Appl. Sci. 2023, 14, 12. [Google Scholar] [CrossRef] [Scilit]
- Nauditt, A.; Firoz, A.B.M.; Trinh, V.Q.; Fink, M.; Stolpe, H.; Ribbe, L. Hydrological drought risk assessment in an anthropogenically impacted tropical catchment, Central Vietnam. In Land Use and Climate Change Interactions in Central Vietnam: LUCCi; Springer: Singapore, 2017; pp. 223–239. [Google Scholar]
- Firoz, A.B.M.; Nauditt, A.; Fink, M.; Ribbe, L. Quantifying human impacts on hydrological drought using a combined modelling approach in a tropical river basin in central Vietnam. Hydrol. Earth Syst. Sci. 2018, 22, 547–565. [Google Scholar] [CrossRef] [Scilit]
- Ha, D.T.; Coynelb, A. Impact of Tranh river 2 hydroelectric dam on sediment load on the thu Bon River of Quang Nam province. UED J. Soc. Sci. Humanit. Educ. 2019, 9, 7–11. [Google Scholar]
- Nguyen, B.Q.; Kantoush, S.; Binh, D.V.; Saber, M.; Vo, D.N.; Sumi, T. Understanding the anthropogenic development impacts on long-term flow regimes in a tropical river basin, Central Vietnam. Hydrol. Sci. J. 2023, 68, 341–354. [Google Scholar] [CrossRef] [Scilit]
- Nguyen, T.H.; Gourbesville, P. Sizing Flood Control Storage of Reservoirs System in the Vu Gia Thu Bon Catchment. In Advances in Hydroinformatics: Models for Complex and Global Water Issues—Practices and Expectations; Springer Nature: Singapore, 2022; pp. 1065–1079. [Google Scholar]
- Van Tra, T.; Thuy, N.T.; Thanh, N.T. Studying the impacts of deep uncertainties on water resources system in Ba River Basin through the combined use of a climate stress-test and land use change. J. Hydrol. Reg. Stud. 2023, 50, 101587. [Google Scholar] [CrossRef] [Scilit]
- Ho, T.M.H.; Van-Tan, P.; Le, N.Q.; Nguyen, Q.T. Extreme climatic events over Vietnam from observational data and RegCM3 projections. Clim. Res. 2011, 49, 87–100. [Google Scholar] [CrossRef] [Scilit]
- Phuong, D.N.D.; Huyen, N.T.; Liem, N.D.; Hong, N.T.; Cuong, D.K.; Loi, N.K. On the use of an innovative trend analysis methodology for temporal trend identification in extreme rainfall indices over the Central Highlands, Vietnam. Theor. Appl. Climatol. 2022, 147, 835–852. [Google Scholar] [CrossRef] [Scilit]
- Funk, C.; Peterson, P.; Landsfeld, M.; Pedreros, D.; Verdin, J.; Shukla, S.; Husak, G.; Rowland, J.; Harrison, L.; Hoell, A.; et al. The climate hazards infrared precipitation with stations—A new environmental record for monitoring extremes. Sci. Data 2015, 2, 150066. [Google Scholar] [CrossRef] [Scilit] [PubMed]
- Beck, H.E.; Vergopolan, N.; Pan, M.; Levizzani, V.; van Dijk, A.I.; Weedon, G.P.; Brocca, L.; Pappenberger, F.; Huffman, G.J.; Wood, E.F. Global-Scale Evaluation of 22 Precipitation Datasets Using Gauge Observations and Hydrological Modeling. Adv. Glob. Change Res. 2020, 69, 625–653. [Google Scholar] [CrossRef] [Scilit]
- Luo, X.; Wu, W.; He, D.; Li, Y.; Ji, X. Hydrological simulation using TRMM and CHIRPS precipitation estimates in the lower Lancang-Mekong river basin. Chin. Geogr. Sci. 2019, 29, 13–25. [Google Scholar] [CrossRef] [Scilit]
- Nguyen, B.Q.; Pham, H.T.; Le, T.H.; Le, M.H.; Nguyen, H.T.; Do, H.X. Four-decades assessment of hydrological drought using streamflow reconstruction in poorly-gauged basins in Vietnam. Adv. Space Res. 2025, 77, 4552–4567. [Google Scholar] [CrossRef] [Scilit]
- Vivó-Truyols, G.; Schoenmakers, P.J. Automatic selection of optimal Savitzky−Golay smoothing. Anal. Chem. 2006, 78, 4598–4608. [Google Scholar] [CrossRef] [Scilit] [PubMed]
- Box, G.E.; Jenkins, G.M.; Reinsel, G.C.; Ljung, G.M. Time Series Analysis: Forecasting and Control; John Wiley & Sons: Hoboken, NJ, USA, 2015. [Google Scholar]
- Chatfield, C.; Xing, H. The Analysis of Time Series: An Introduction with R; Chapman and Hall/CRC: Boca Raton, FL, USA, 2019. [Google Scholar]
- Cover, T.M.; Thomas, J.A.; Chouinard, J.Y.; Moser, S.M. Elements of Information Theory; John Wiley & Sons: Hoboken, NJ, USA, 2006. [Google Scholar]
- Spearman, C. The Proof and Measurement of Association between Two Things. Am. J. Psychol. 1904, 15, 72–101. [Google Scholar] [CrossRef] [Scilit]
- Conover, W.J. Practical Nonparametric Statistics; John Wiley & Sons: Hoboken, NJ, USA, 1999. [Google Scholar]
- Pölz, A.; Blaschke, A.P.; Komma, J.; Farnleitner, A.H.; Derx, J. Transformer versus LSTM: A comparison of deep learning models for karst spring discharge forecasting. Water Resour. Res. 2024, 60, e2022WR032602. [Google Scholar] [CrossRef] [Scilit]
- Azma, A.; Liu, Y.; Rezania, S. A hybrid WPD–SSA machine learning transformer for modeling nonlinear dynamics of flow systems. J. Water Process Eng. 2026, 82, 109448. [Google Scholar] [CrossRef] [Scilit]
- Shi, T.; Shide, K. A comparative analysis of LSTM, GRU, and Transformer models for construction cost prediction with multidimensional feature integration. J. Asian Archit. Build. Eng. 2026, 25, 634–649. [Google Scholar] [CrossRef] [Scilit]
- Wu, H.; Xu, J.; Wang, J.; Long, M. Autoformer: Decomposition transformers with auto-correlation for long-term series forecasting. Adv. Neural Inf. Process. Syst. 2021, 34, 22419–22430. [Google Scholar]
- Zhou, H.; Zhang, S.; Peng, J.; Zhang, S.; Li, J.; Xiong, H.; Zhang, W. Informer: Beyond efficient transformer for long sequence time-series forecasting. In Proceedings of the AAAI Conference on Artificial Intelligence; Scientific Research: Wuhan, China, 2021; Volume 35, pp. 11106–11115. [Google Scholar] [CrossRef] [Scilit]
- Liu, Y.; Hu, T.; Zhang, H.; Wu, H.; Wang, S.; Ma, L.; Long, M. itransformer: Inverted transformers are effective for time series forecasting. arXiv 2023, arXiv:2310.06625. [Google Scholar] [CrossRef] [Scilit]

Disclaimer/Publisher’s Note: The statements, opinions and data contained in all publications are solely those of the individual author(s) and contributor(s) and not of MDPI and/or the editor(s). MDPI and/or the editor(s) disclaim responsibility for any injury to people or property resulting from any ideas, methods, instructions or products referred to in the content. |
© 2026 by the authors. Licensee MDPI, Basel, Switzerland. This article is an open access article distributed under the terms and conditions of the Creative Commons Attribution (CC BY) license.