
Evolution of Rainfall Characteristics in Catalonia, Spain, Using a Moving-Window Approach (1950–2022)

 ,
,  ,
,
Abstract
1. Introduction
2. Materials and Methods
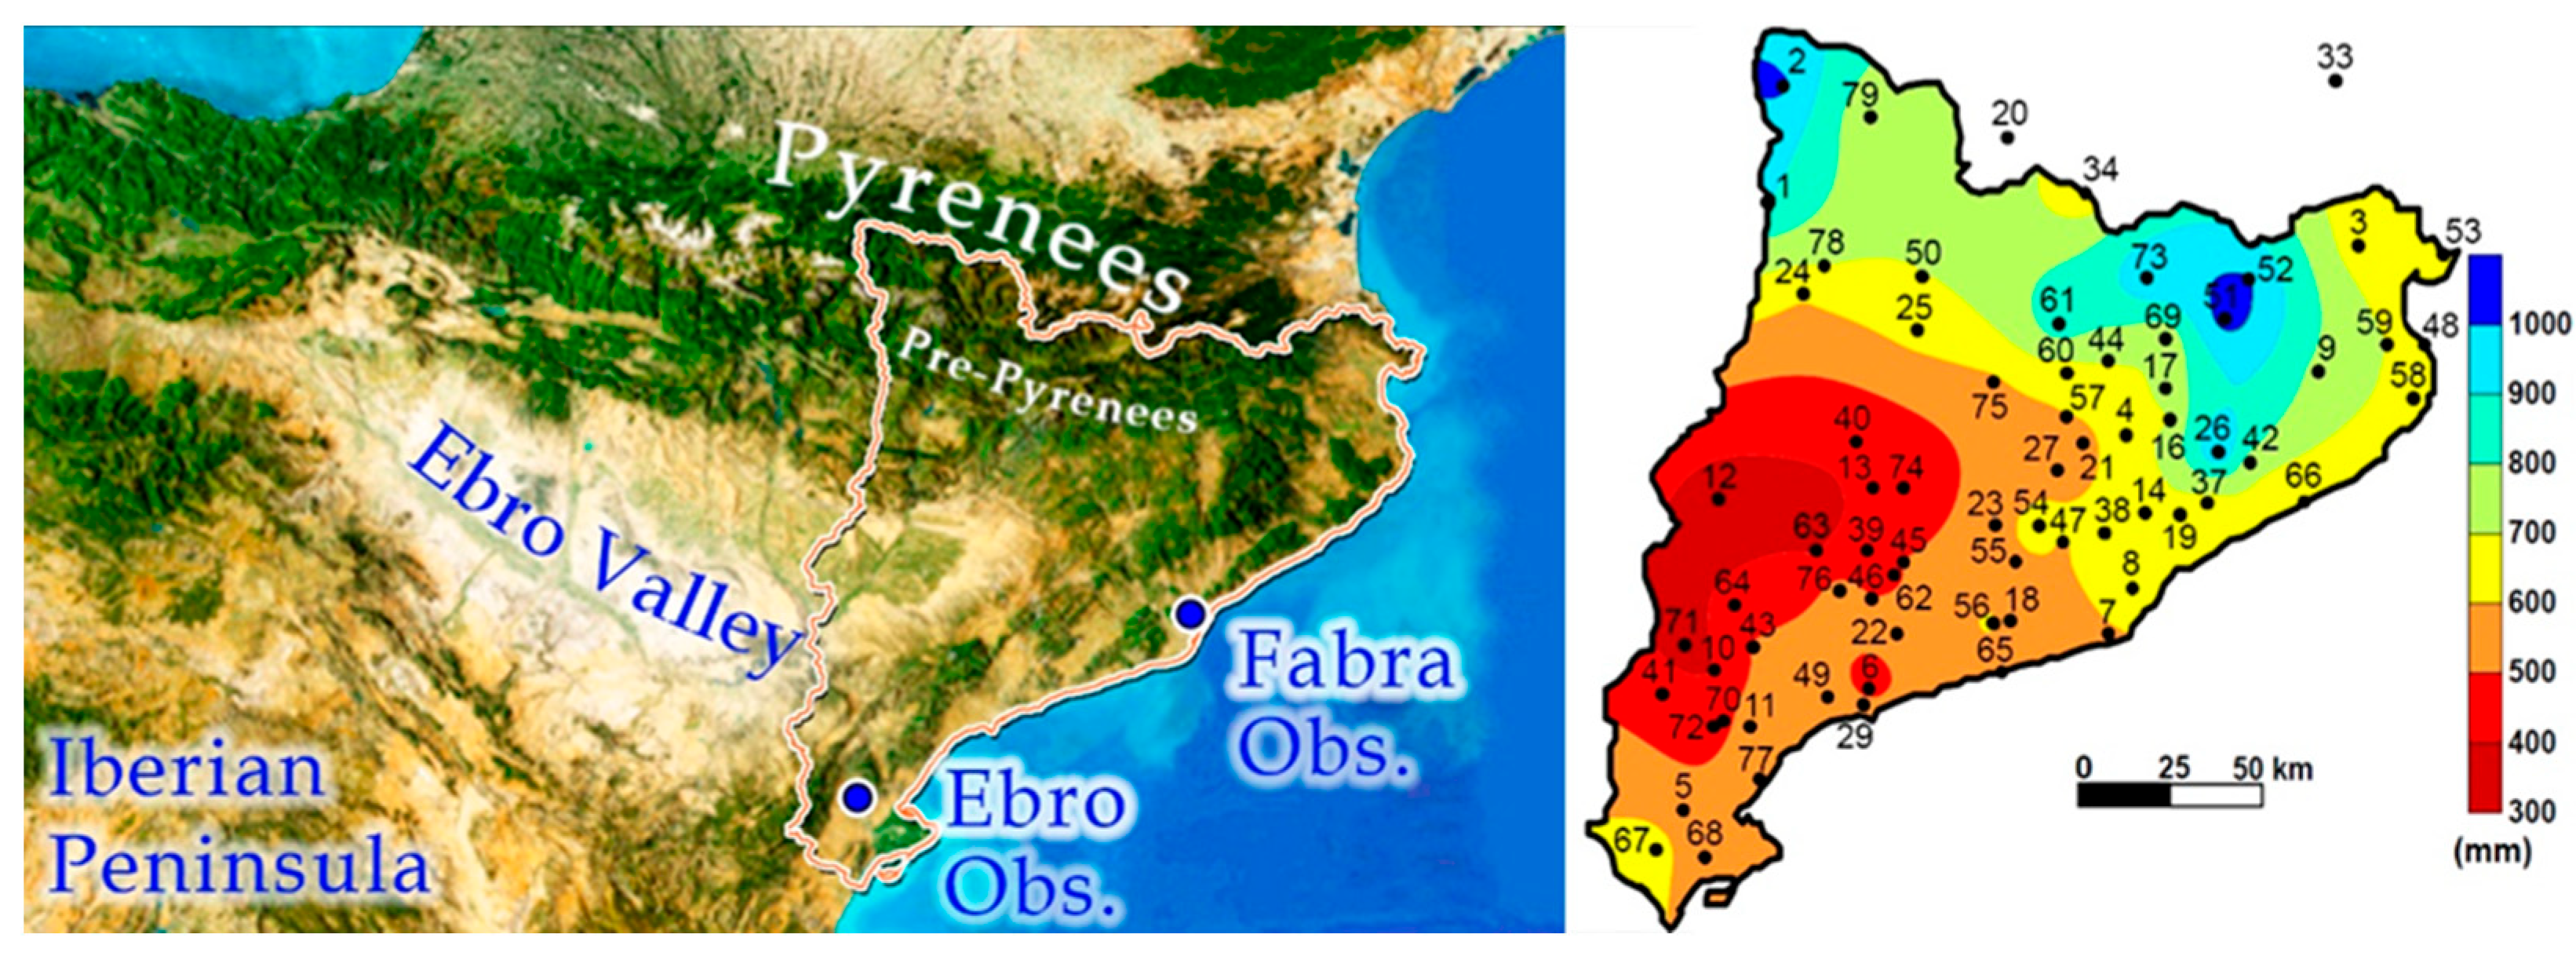
2.1. Database
2.2. Methodology
2.2.1. Main Characteristics of Each 31-Years Window
2.2.2. Trends Within Each 31-Years Window
2.2.3. Trends of Moving Window Characteristics
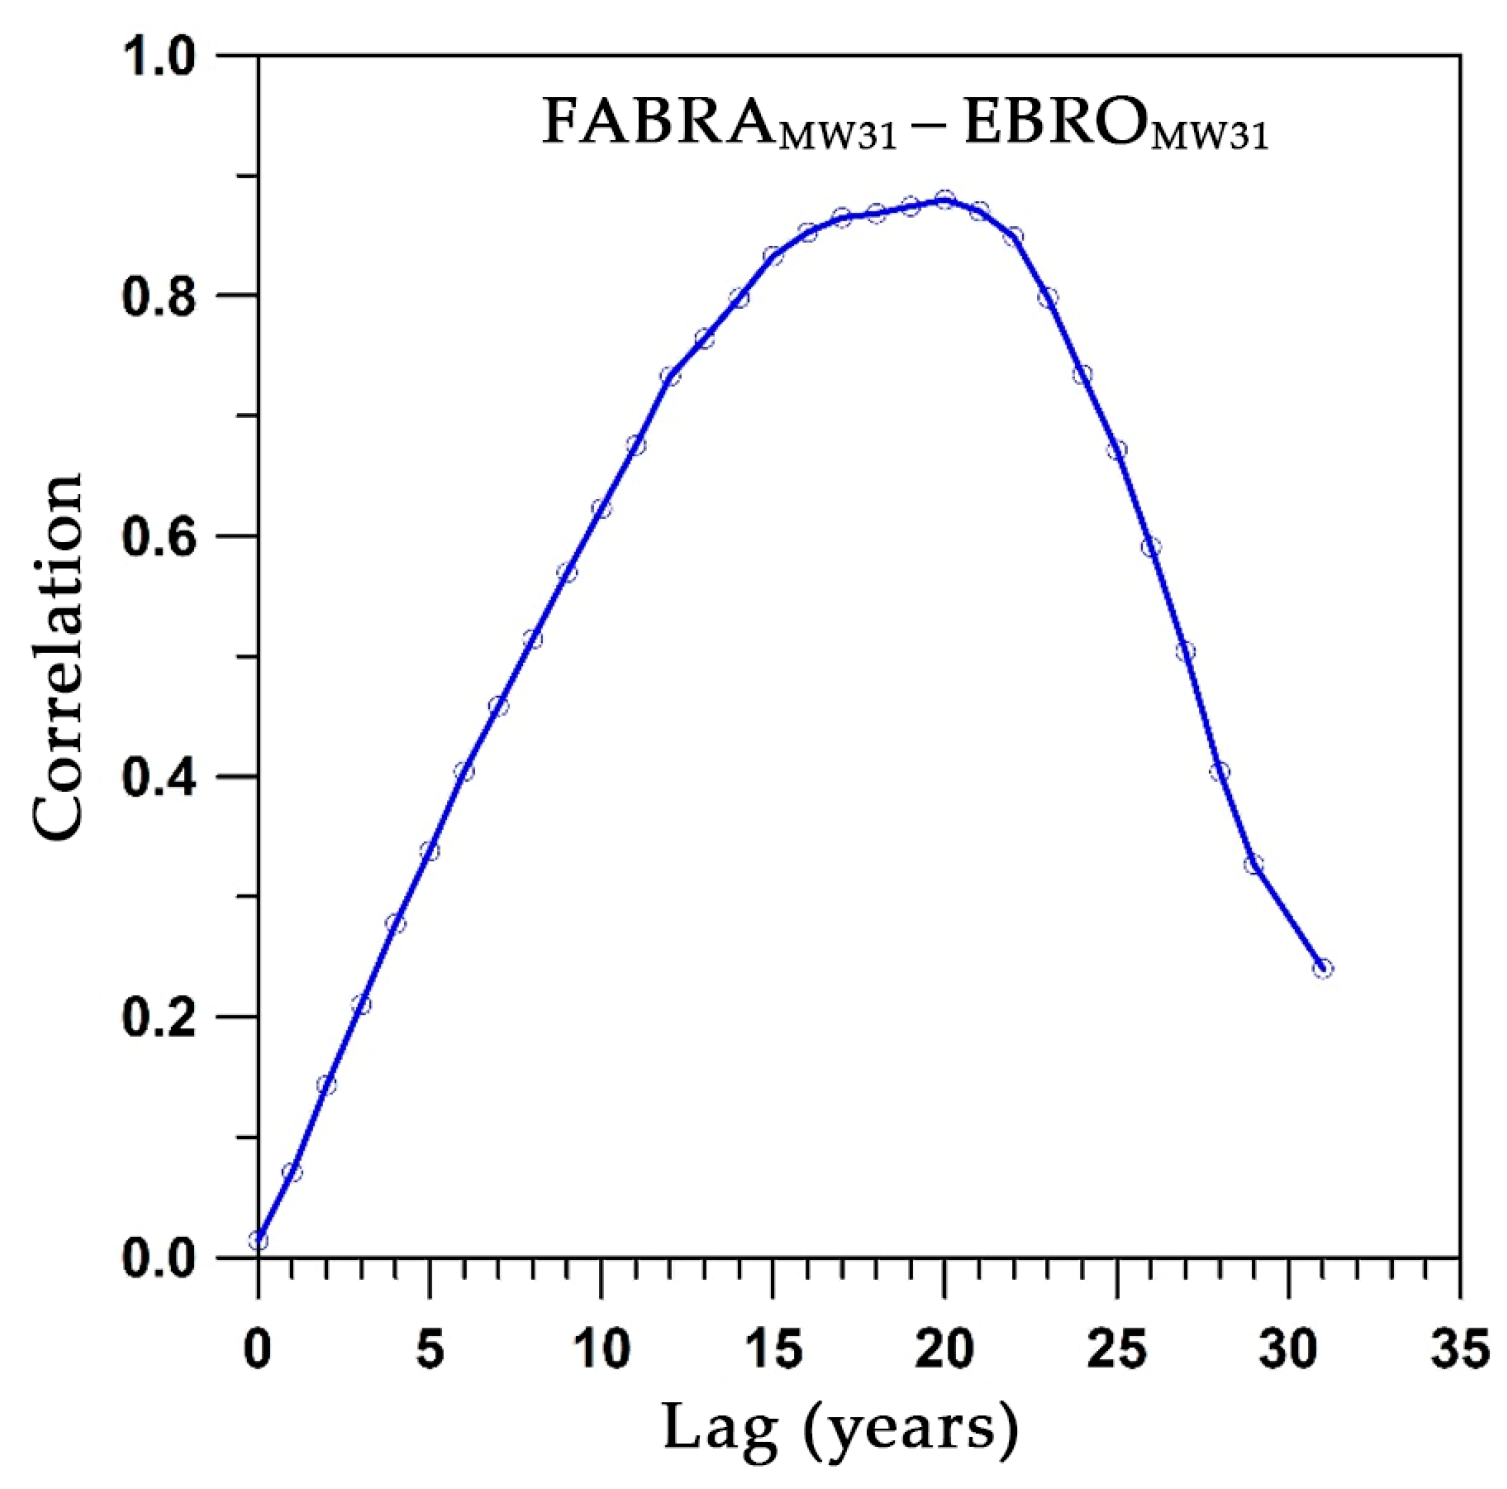
2.2.4. Two Centennial Series and Correlation with NAO and AMO
3. Results
3.1. Annual Amounts
3.1.1. First Insight
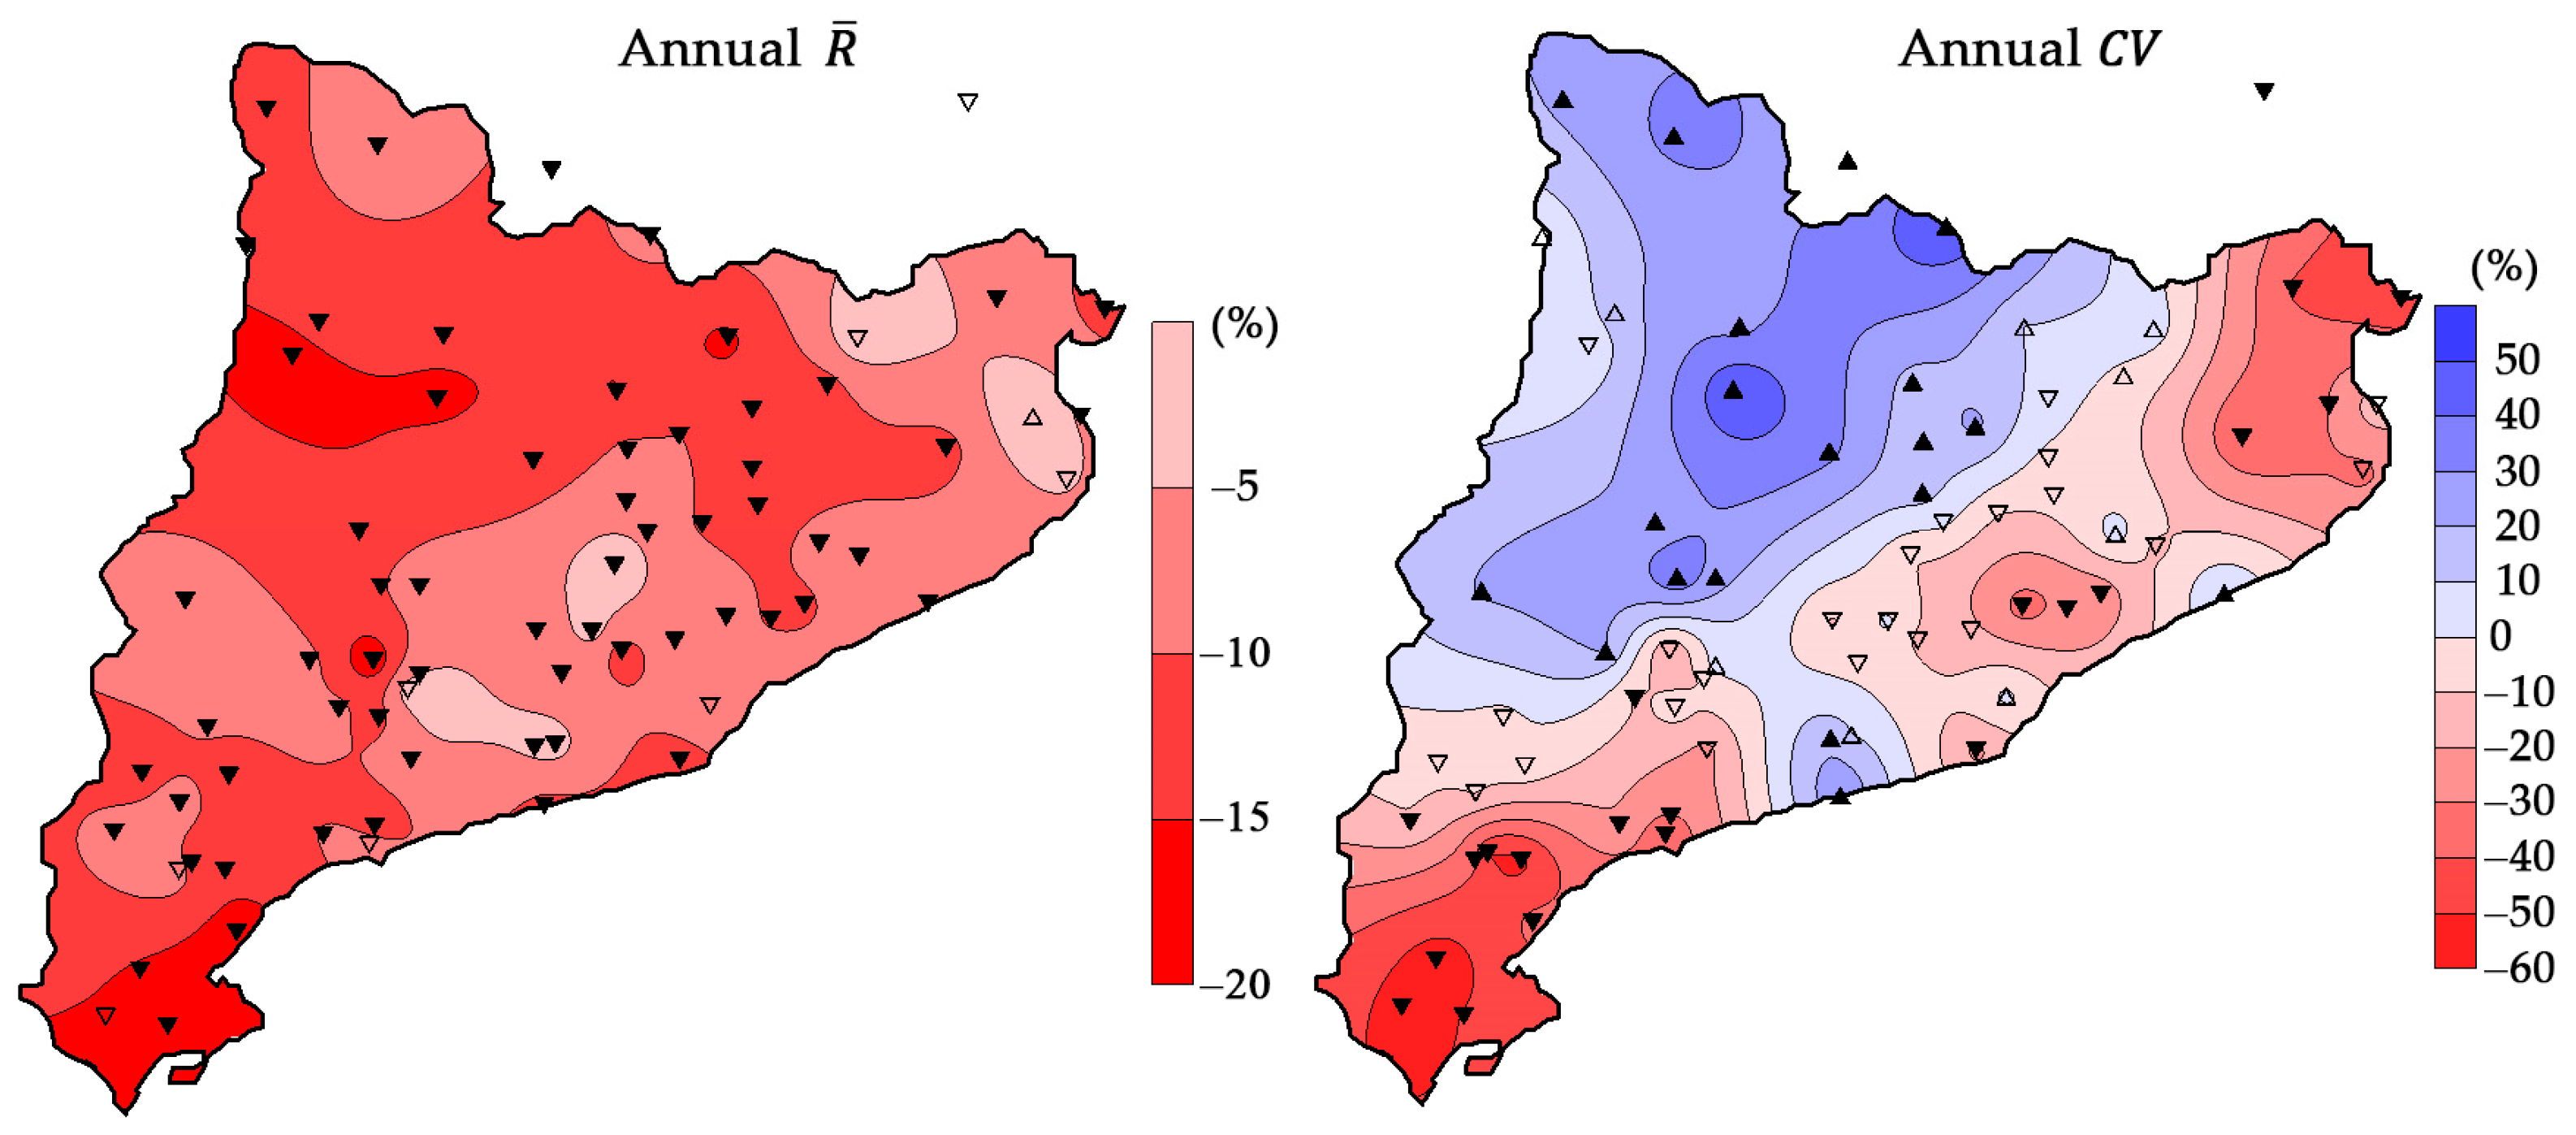
3.1.2. Mean Annual Rainfall and for Each Window and Station
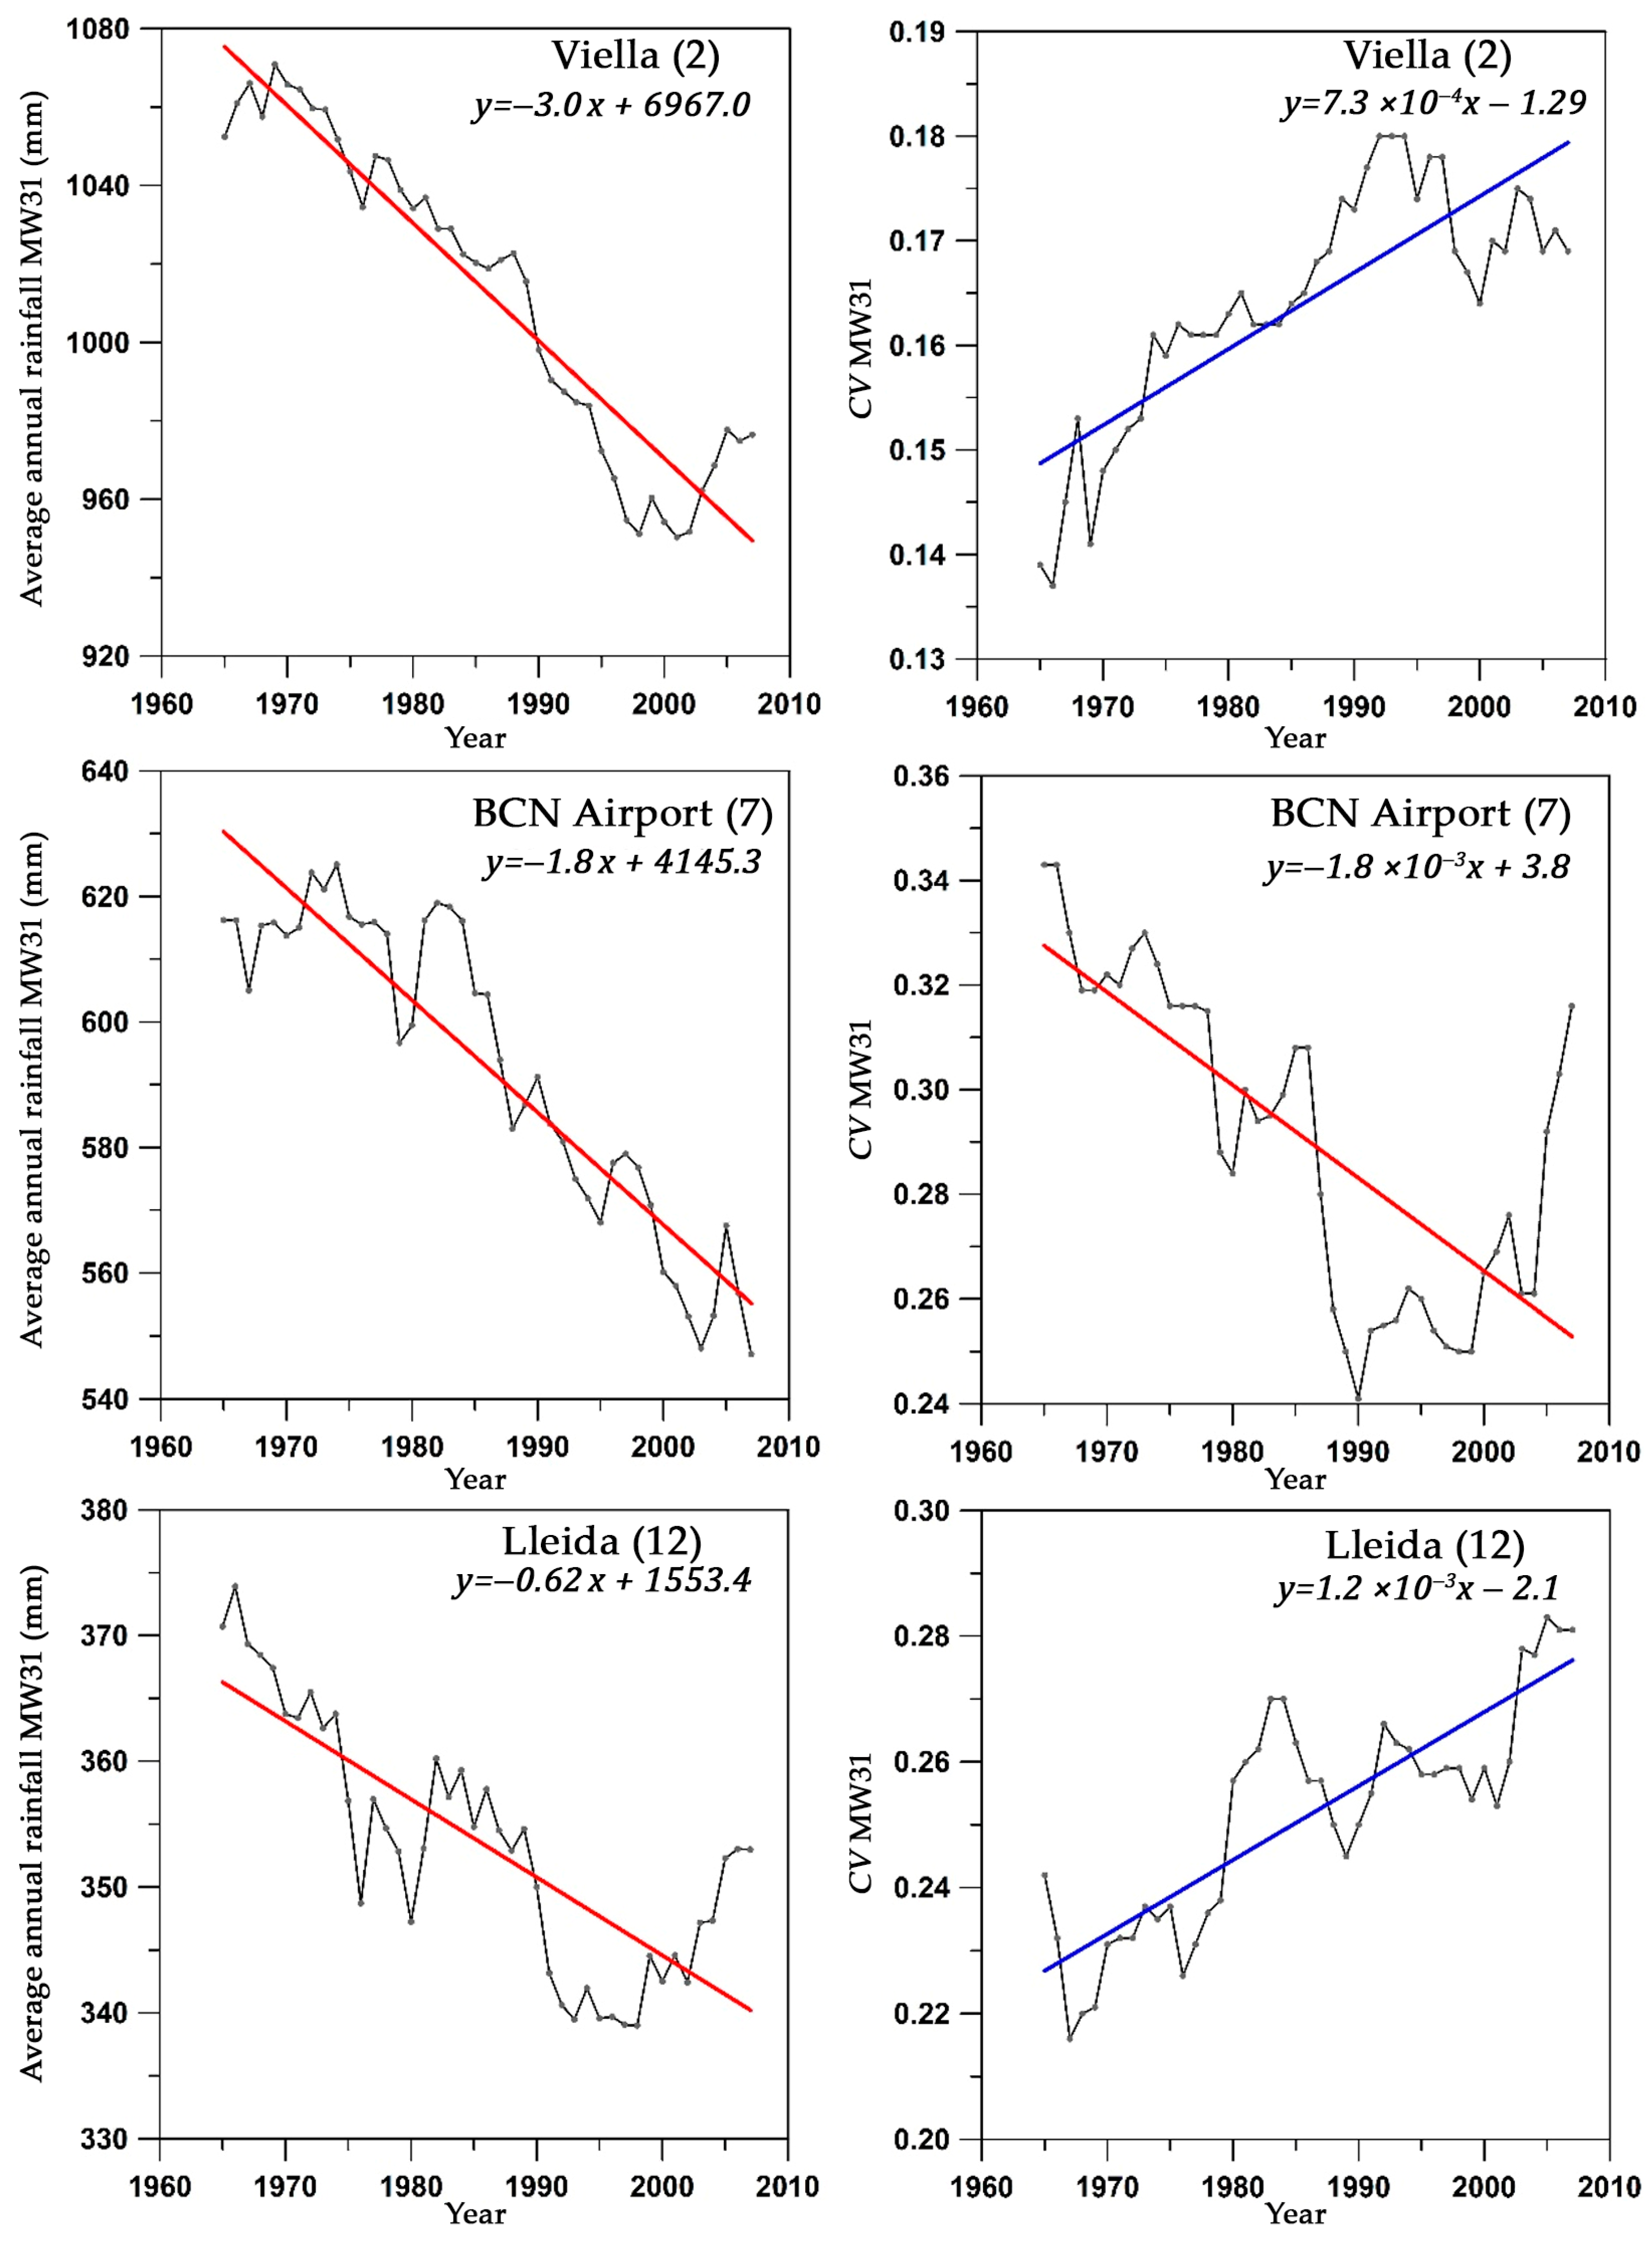
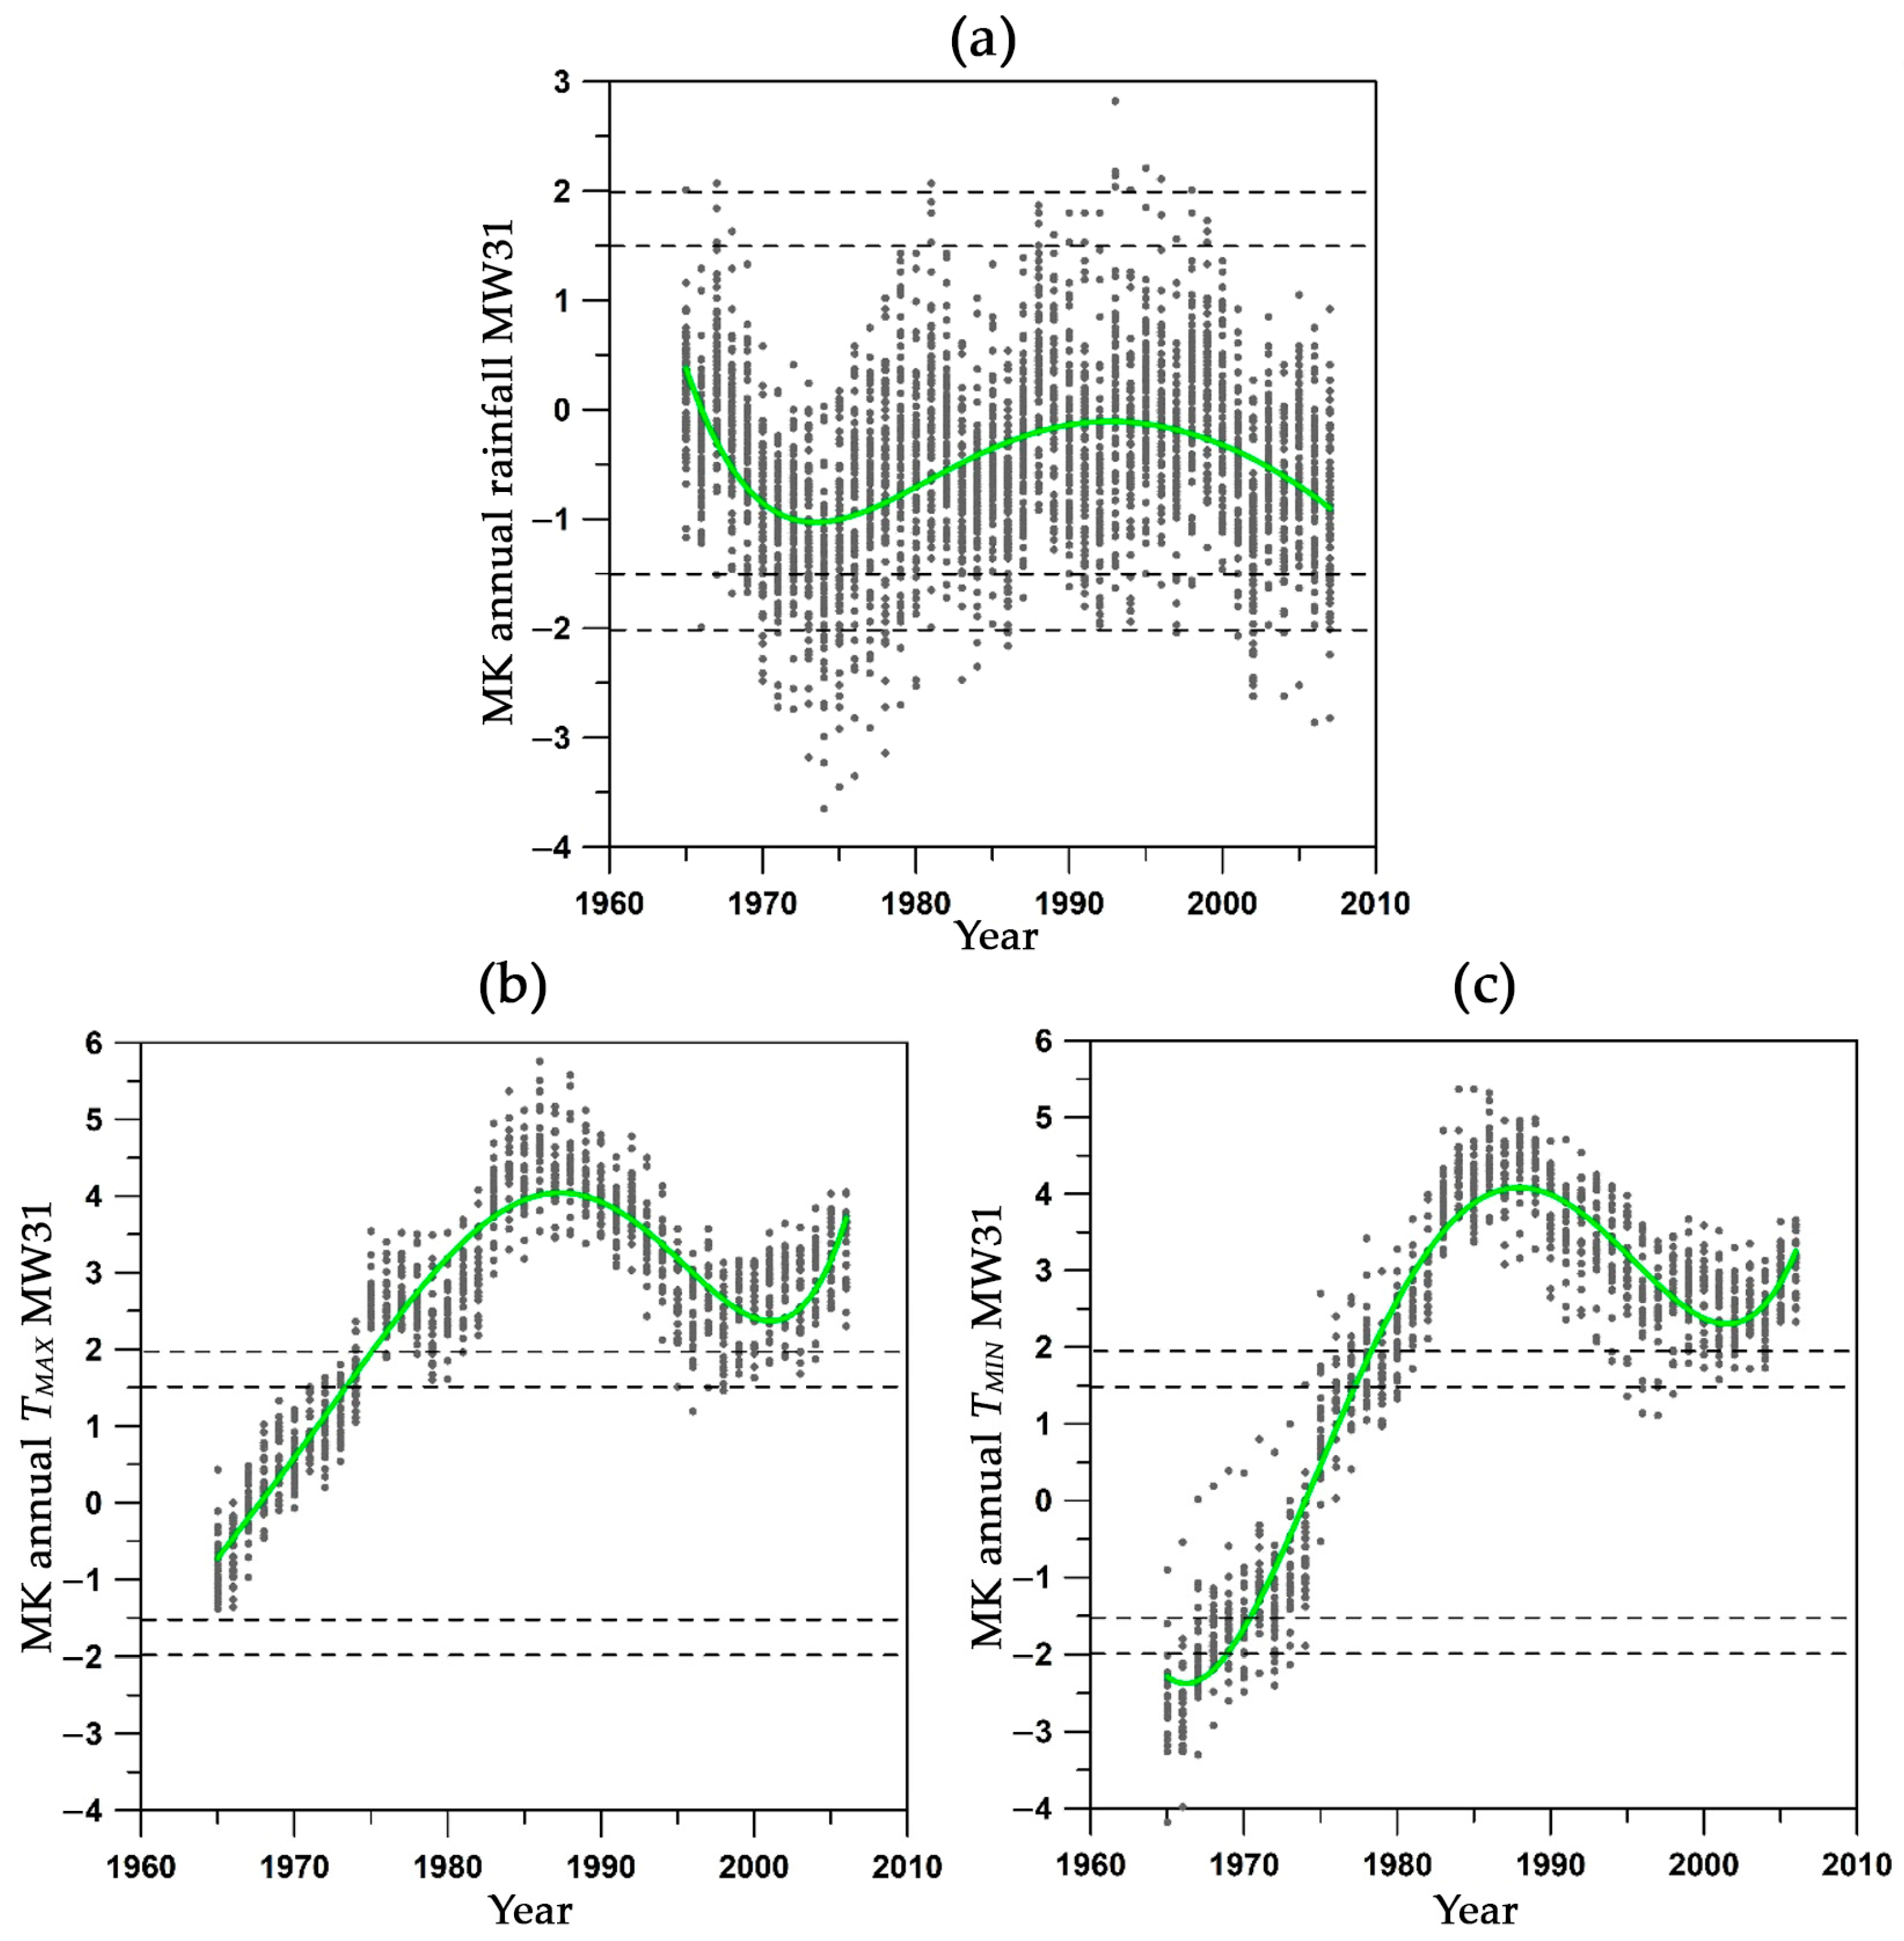
3.1.3. Trends of Annual Amounts Within Each 31-Years Window
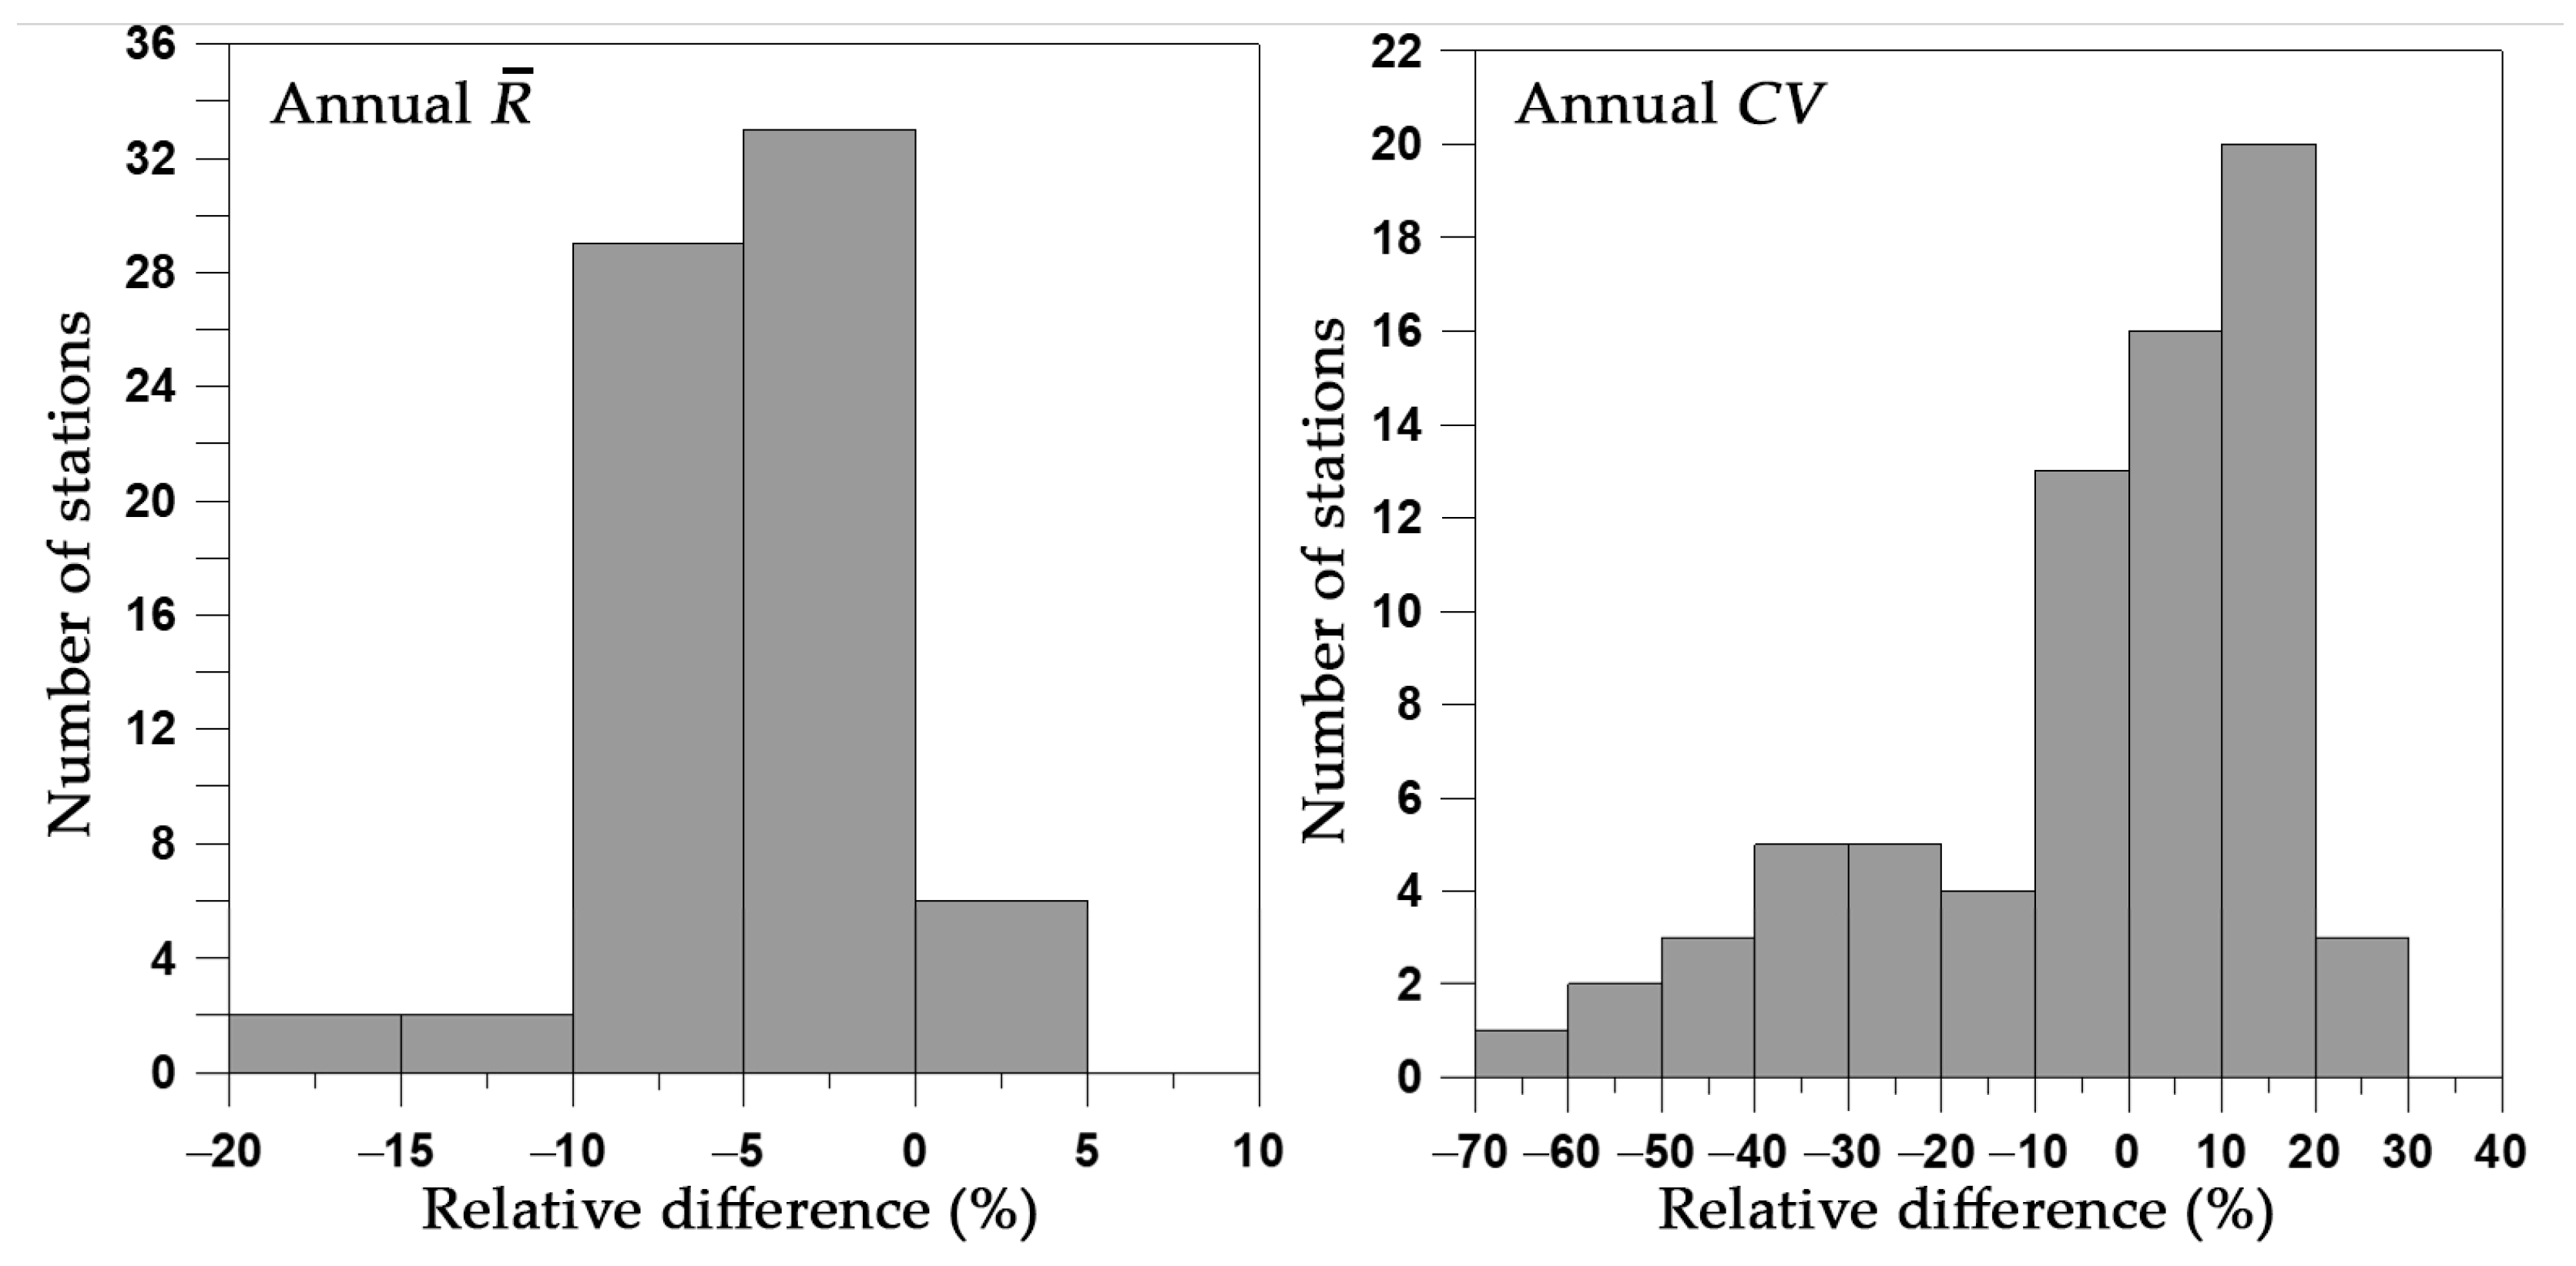
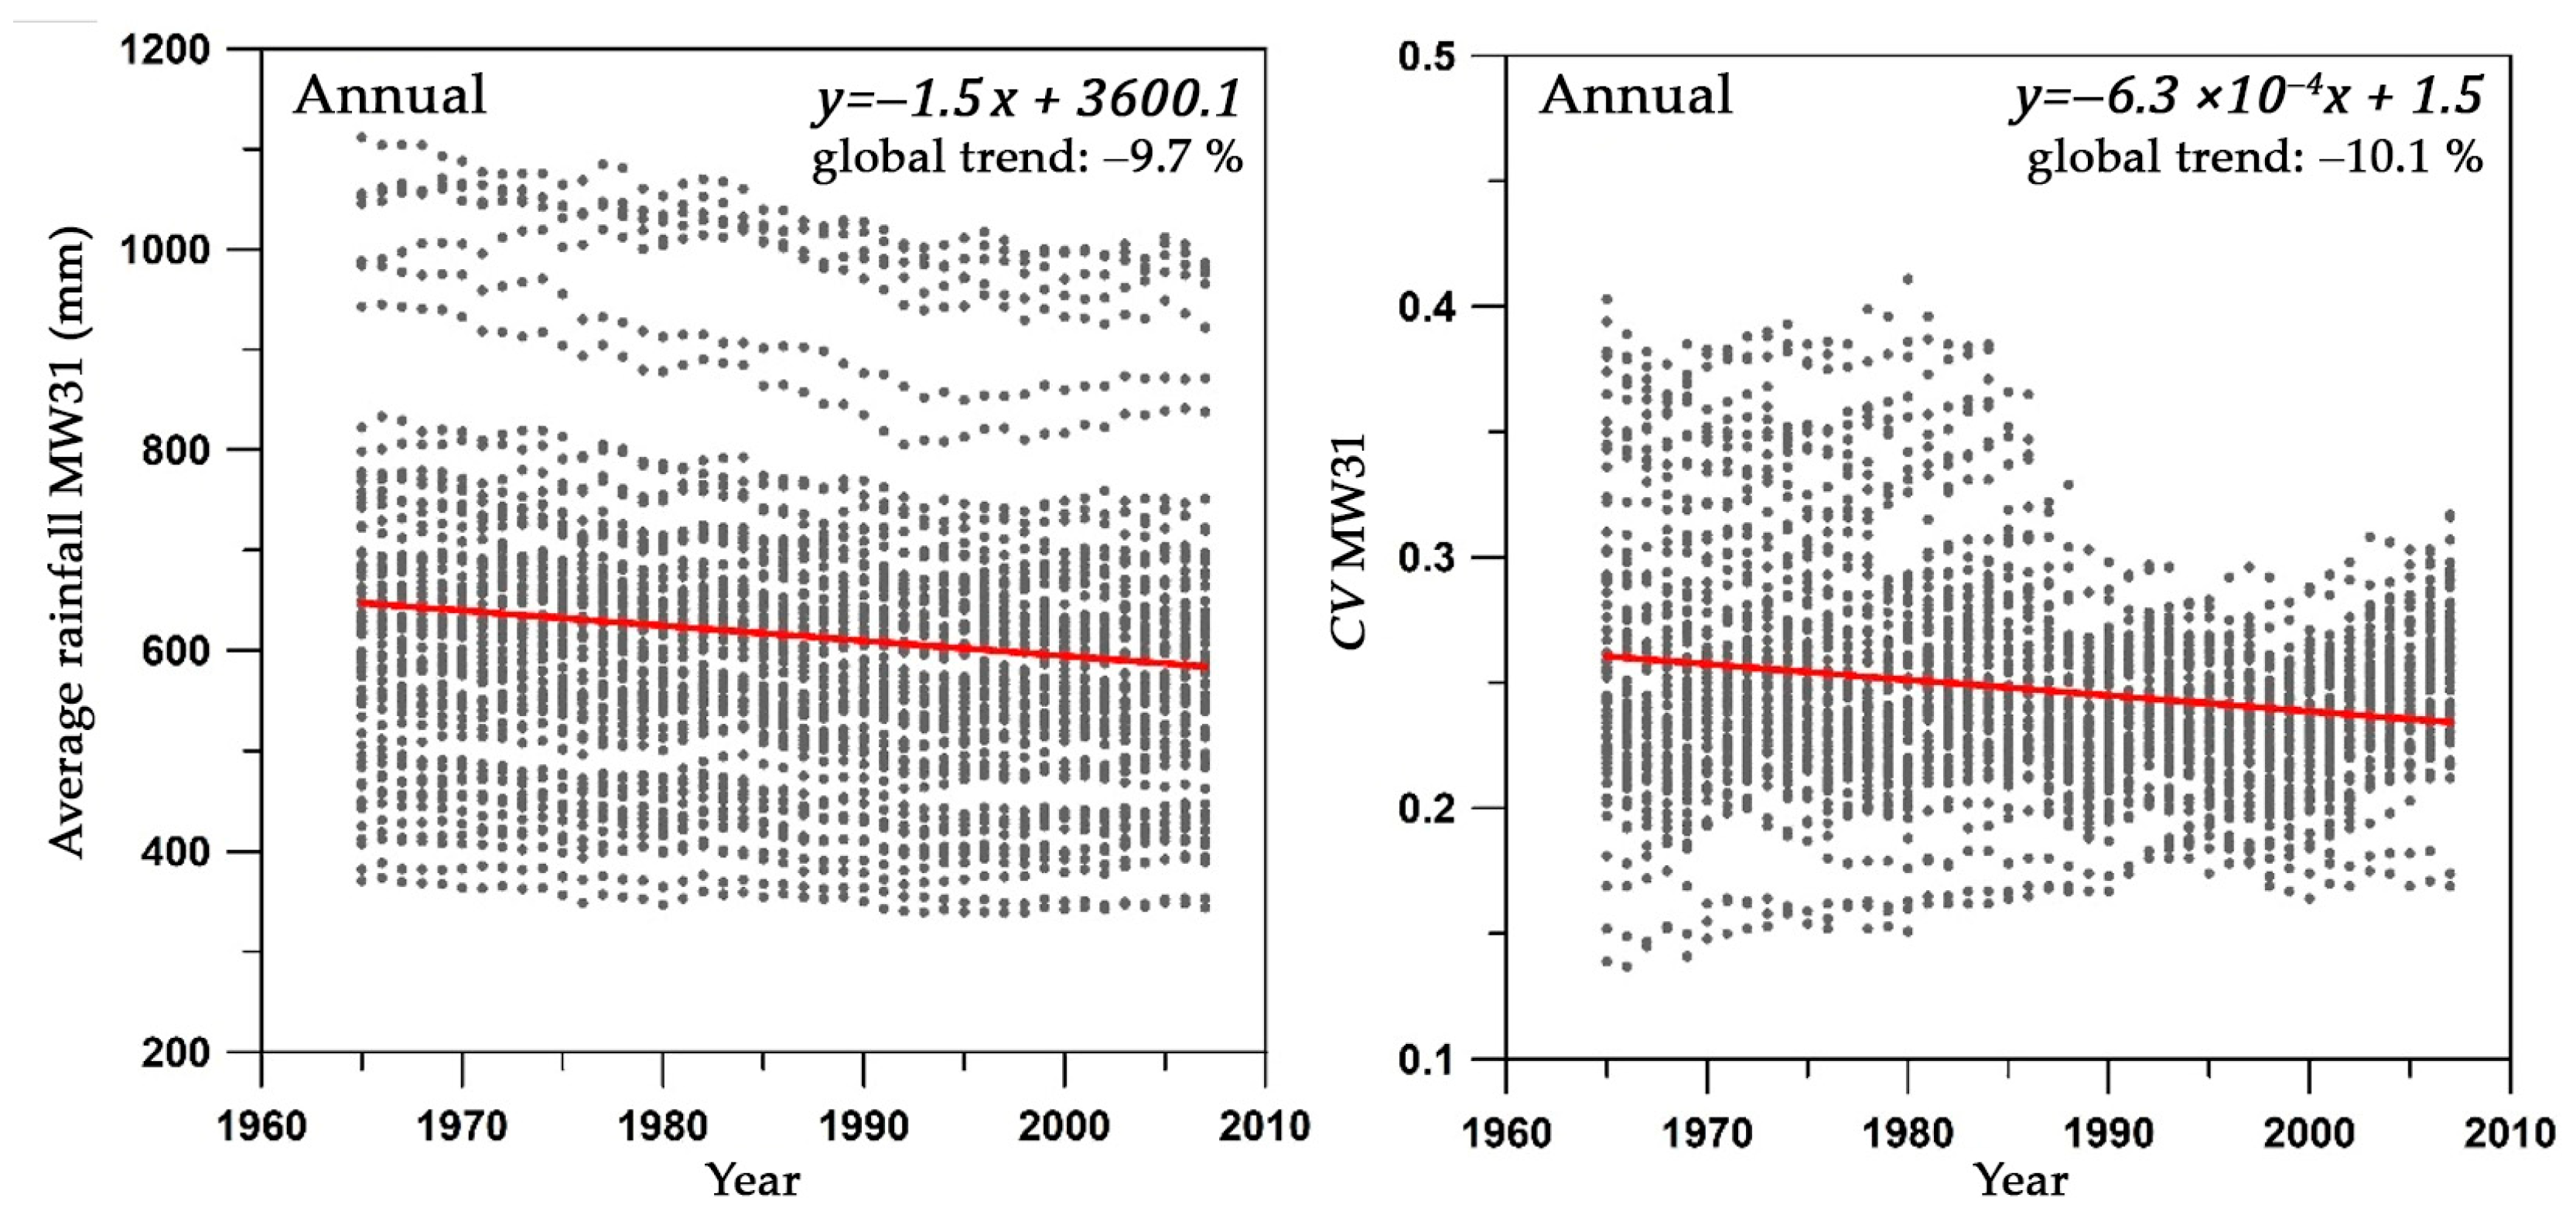
3.1.4. Trends in Characteristics of Annual Moving Windows
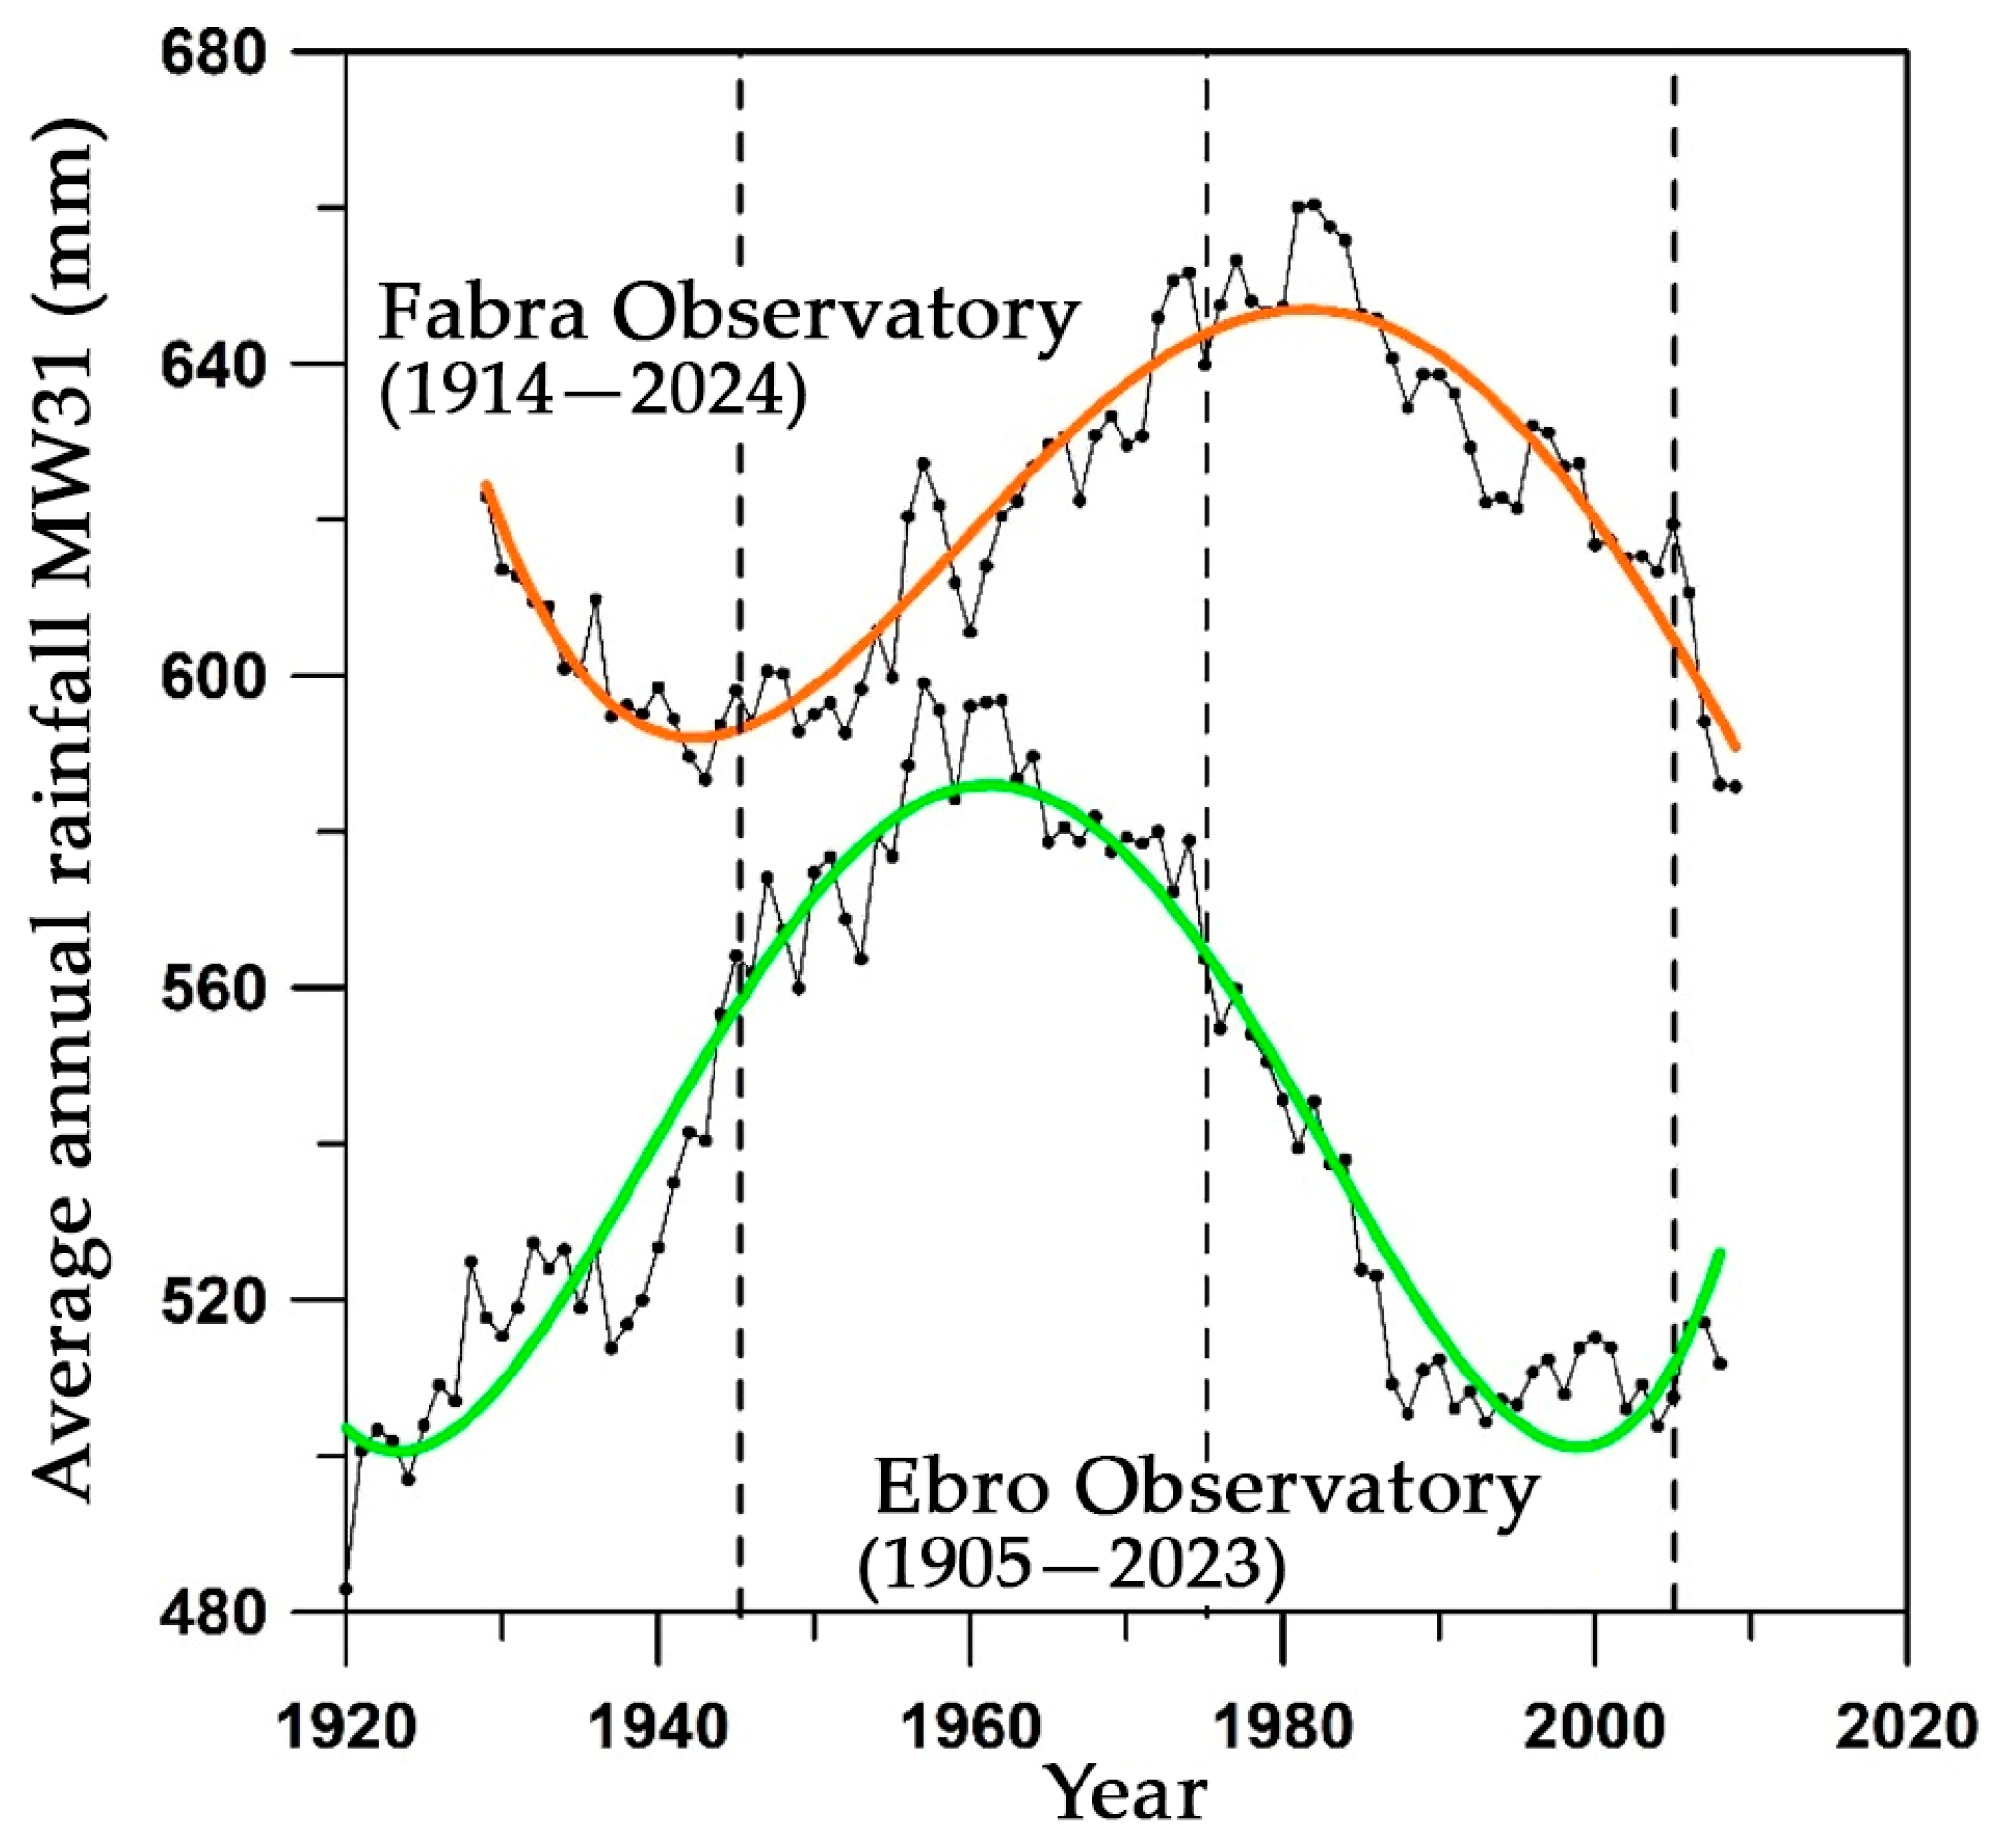
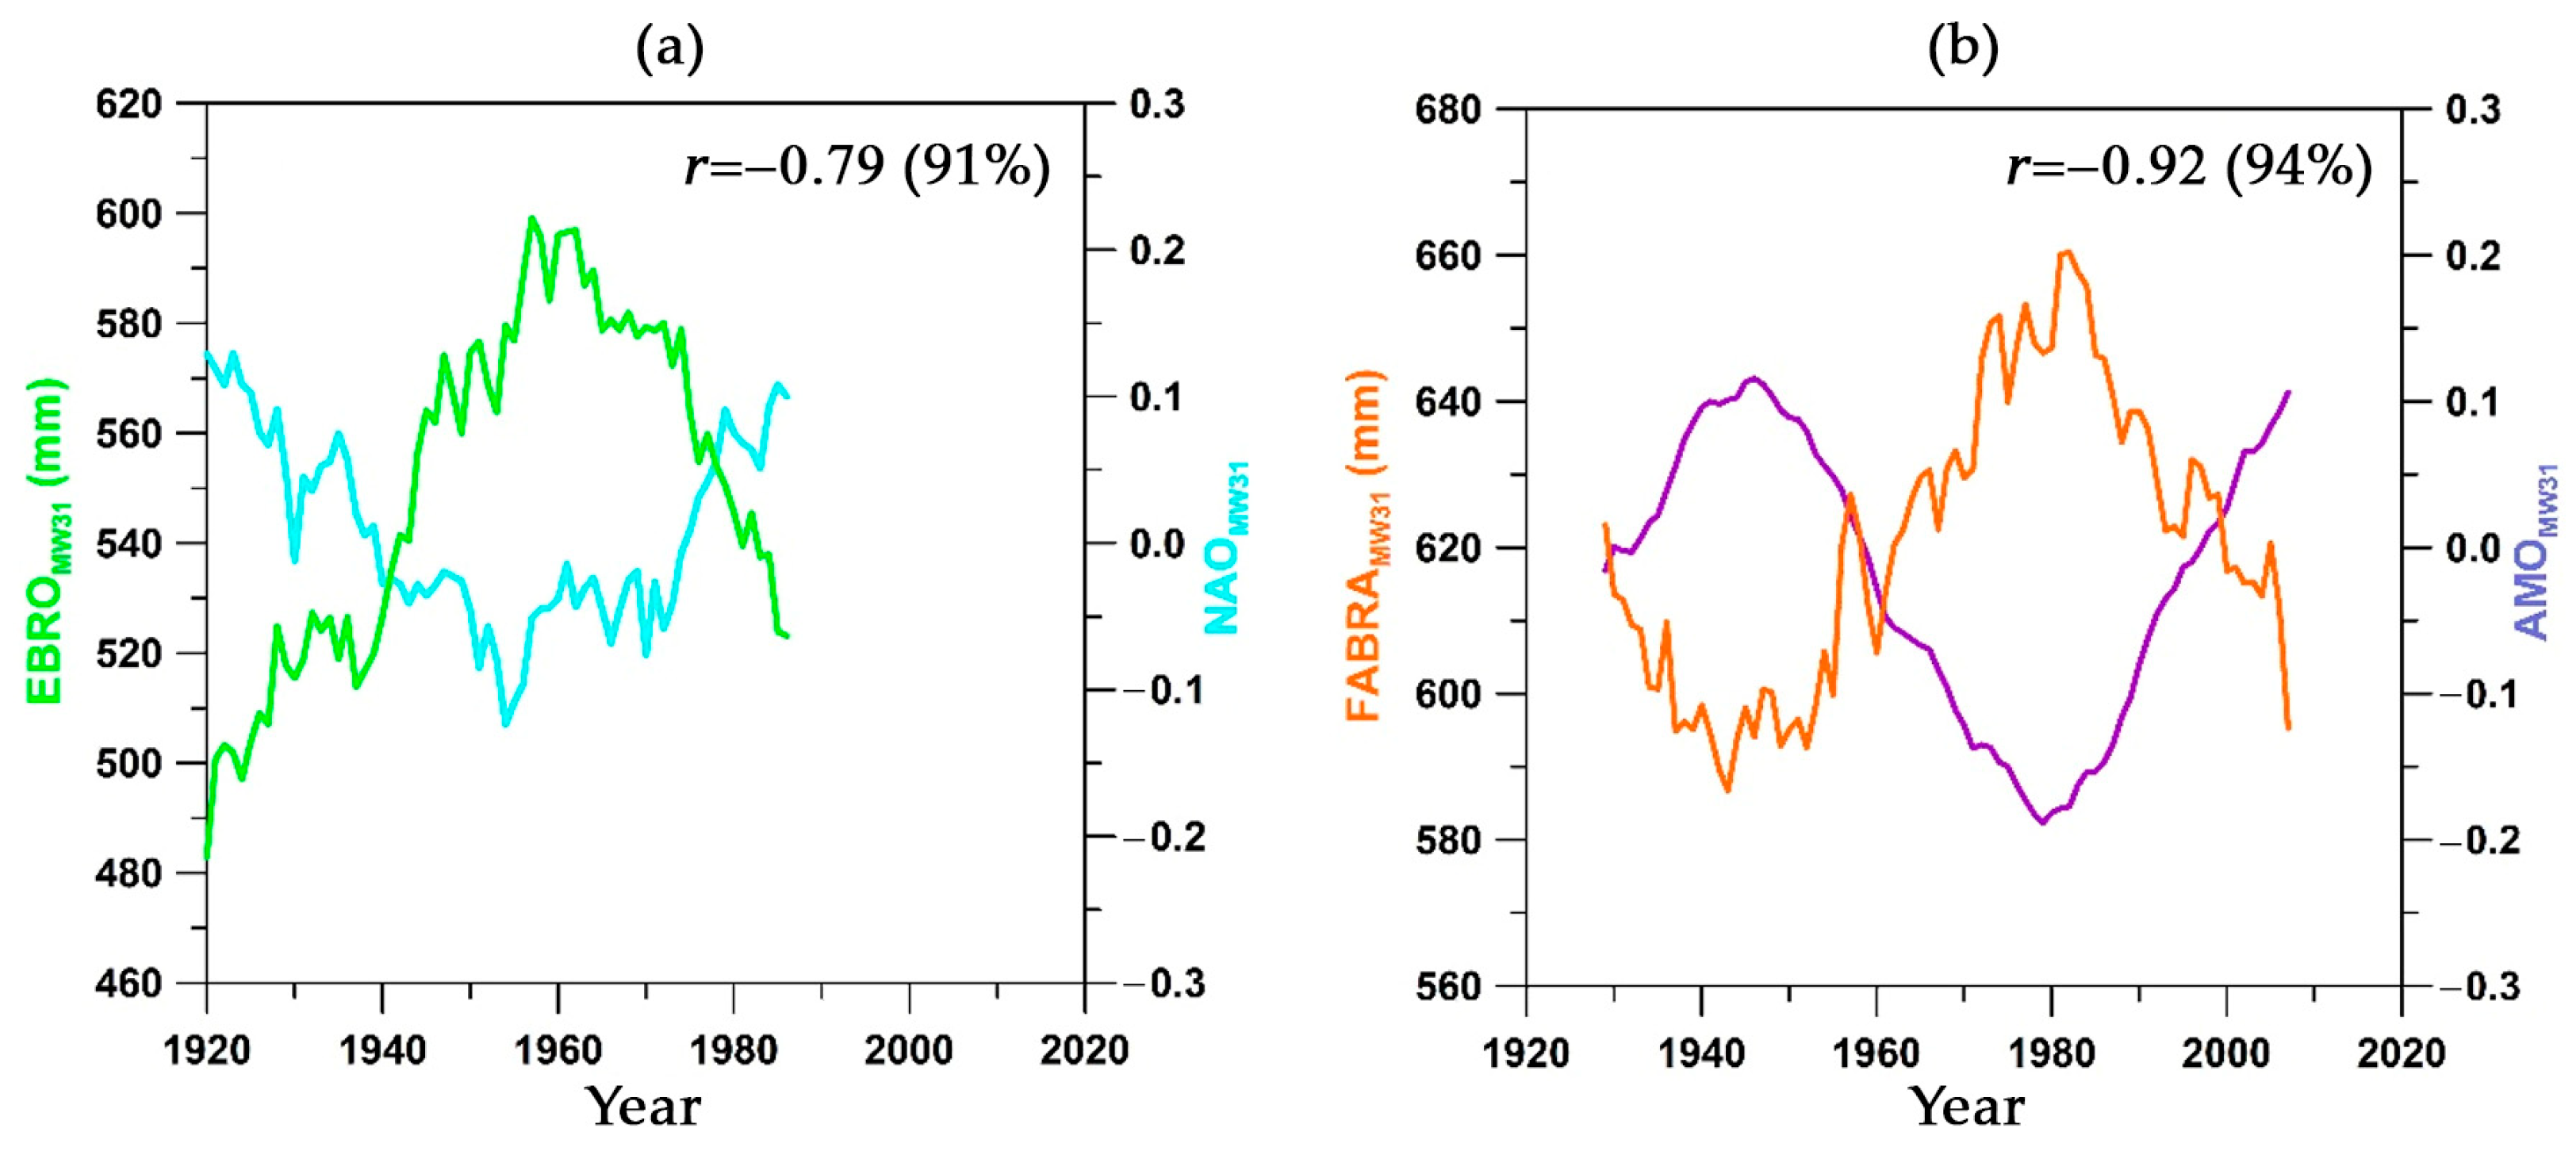
3.1.5. Two Centennial Series and Correlation with NAO and AMO
3.2. Seasonal Amounts
3.2.1. Mean Seasonal Rainfall and for Each Window and Station
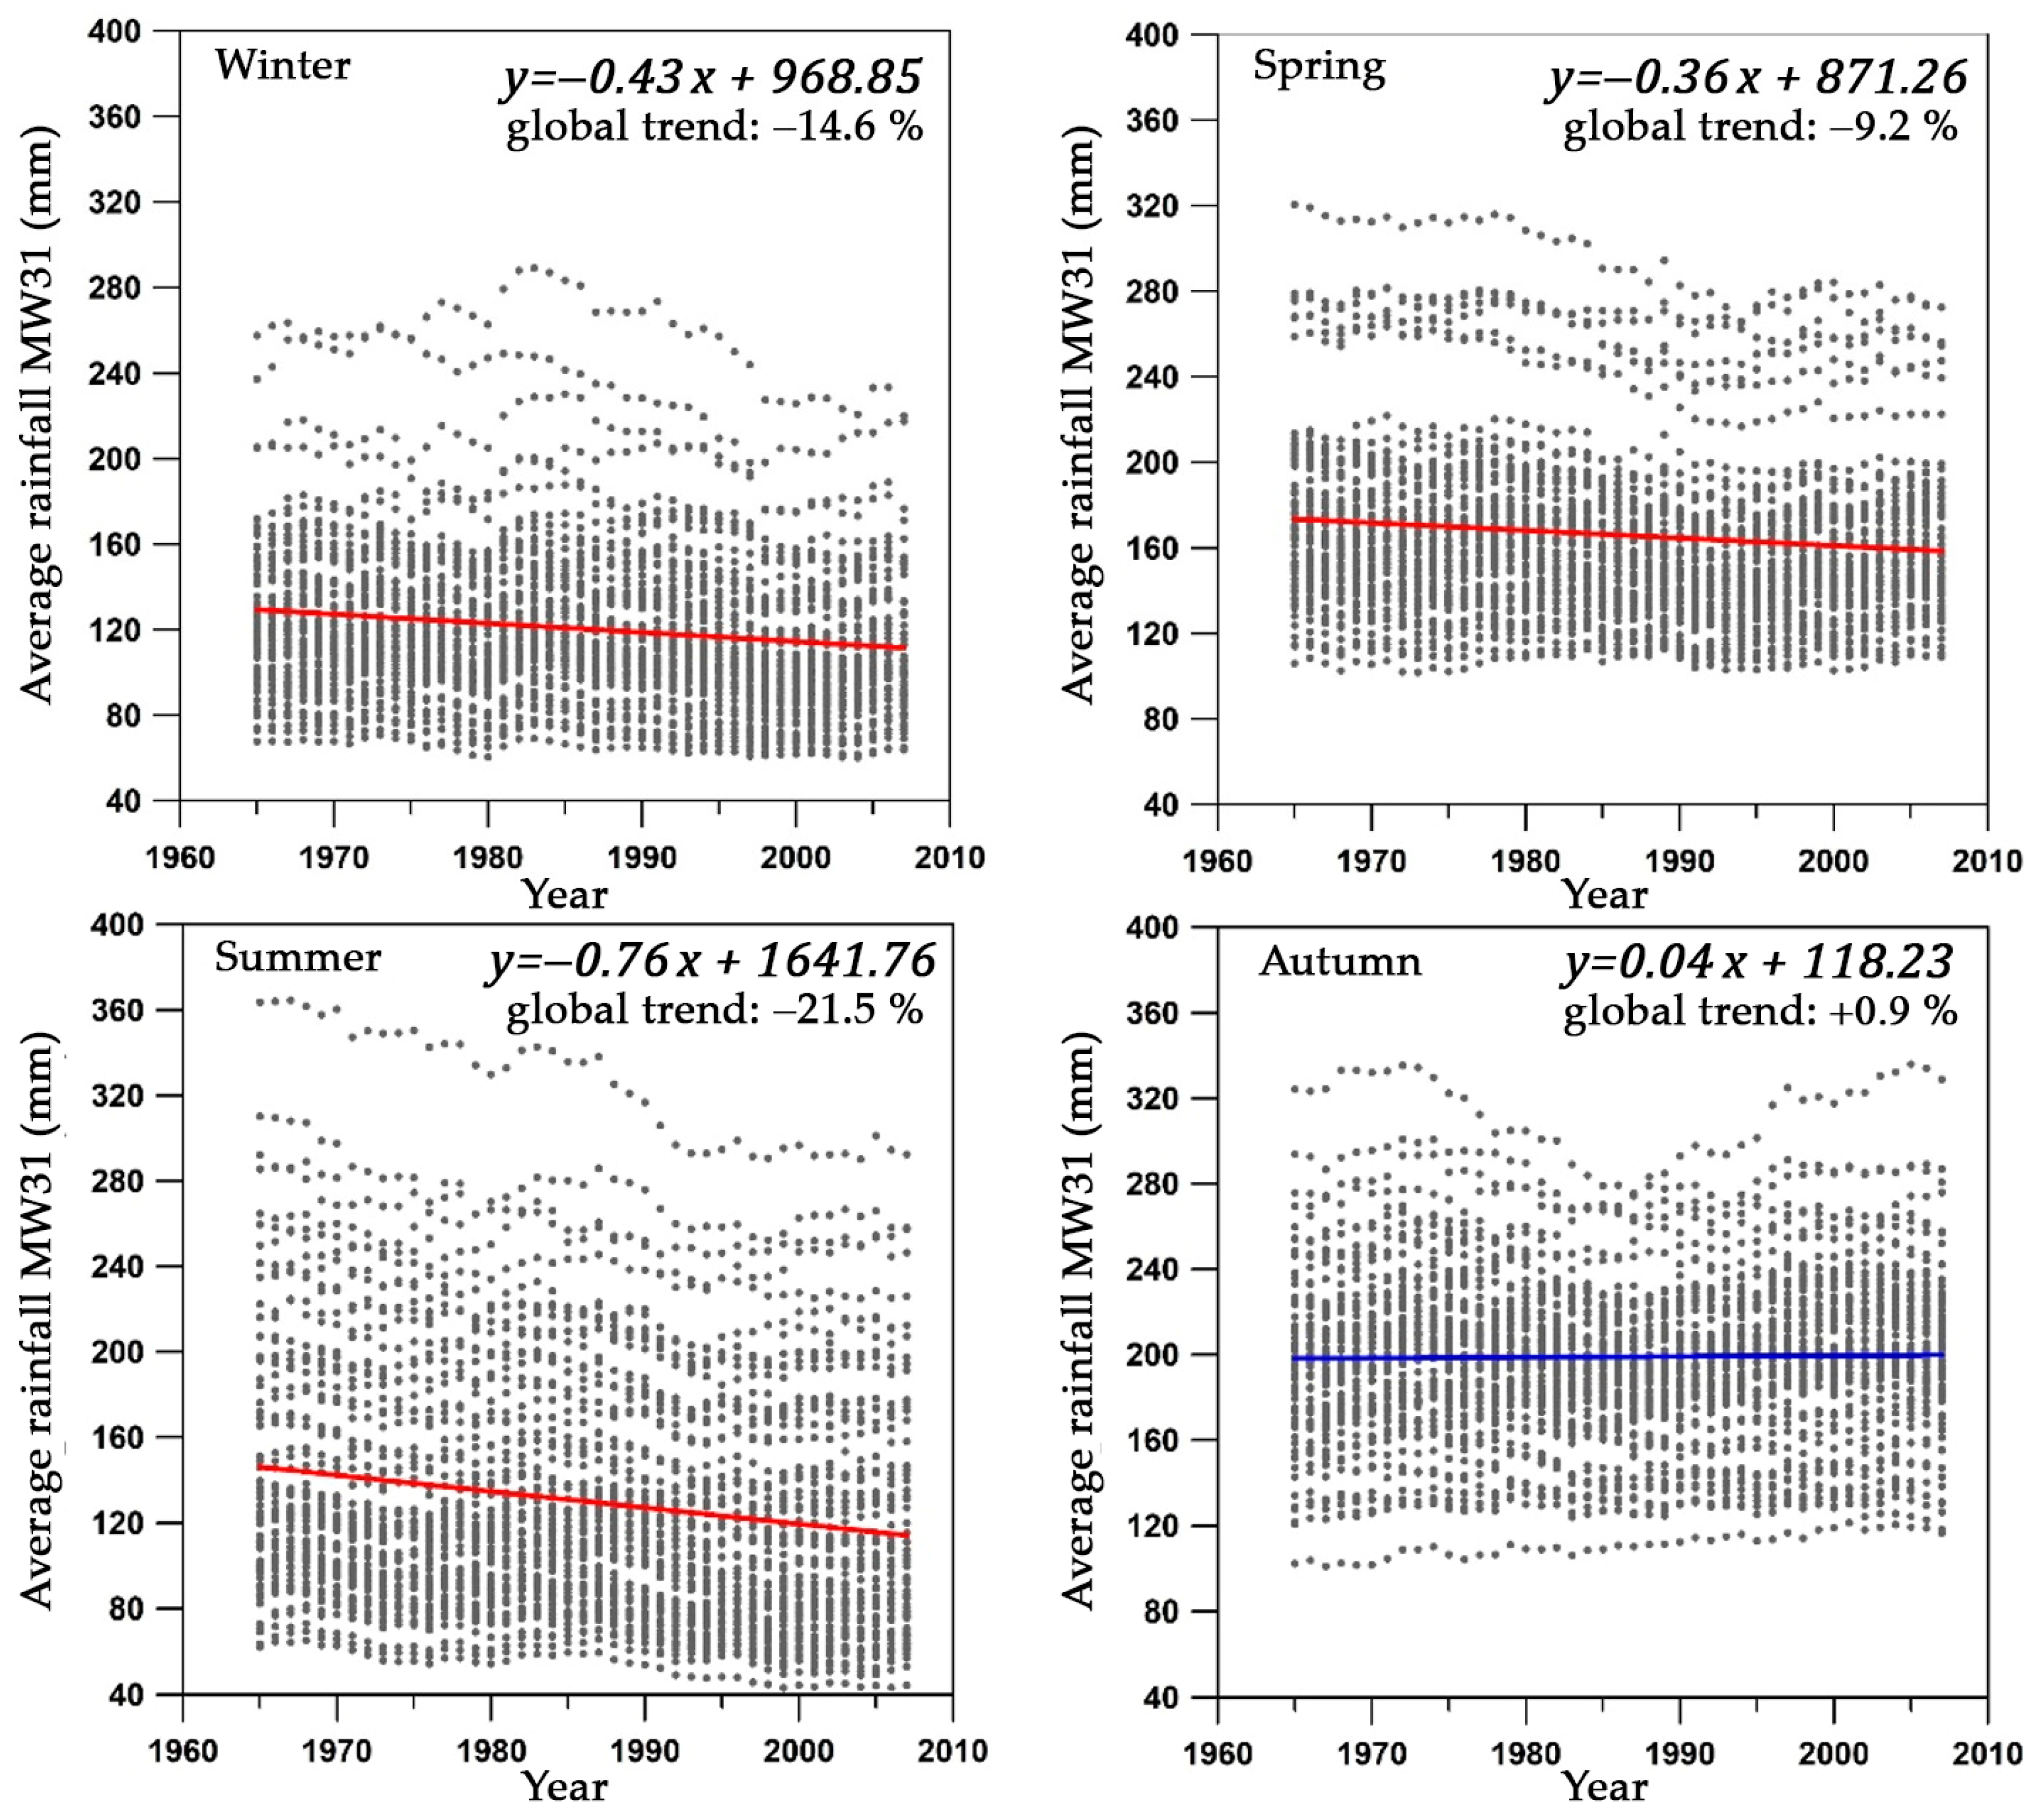
3.2.2. Trends in Seasonal Amounts Within Each 31-Year Window
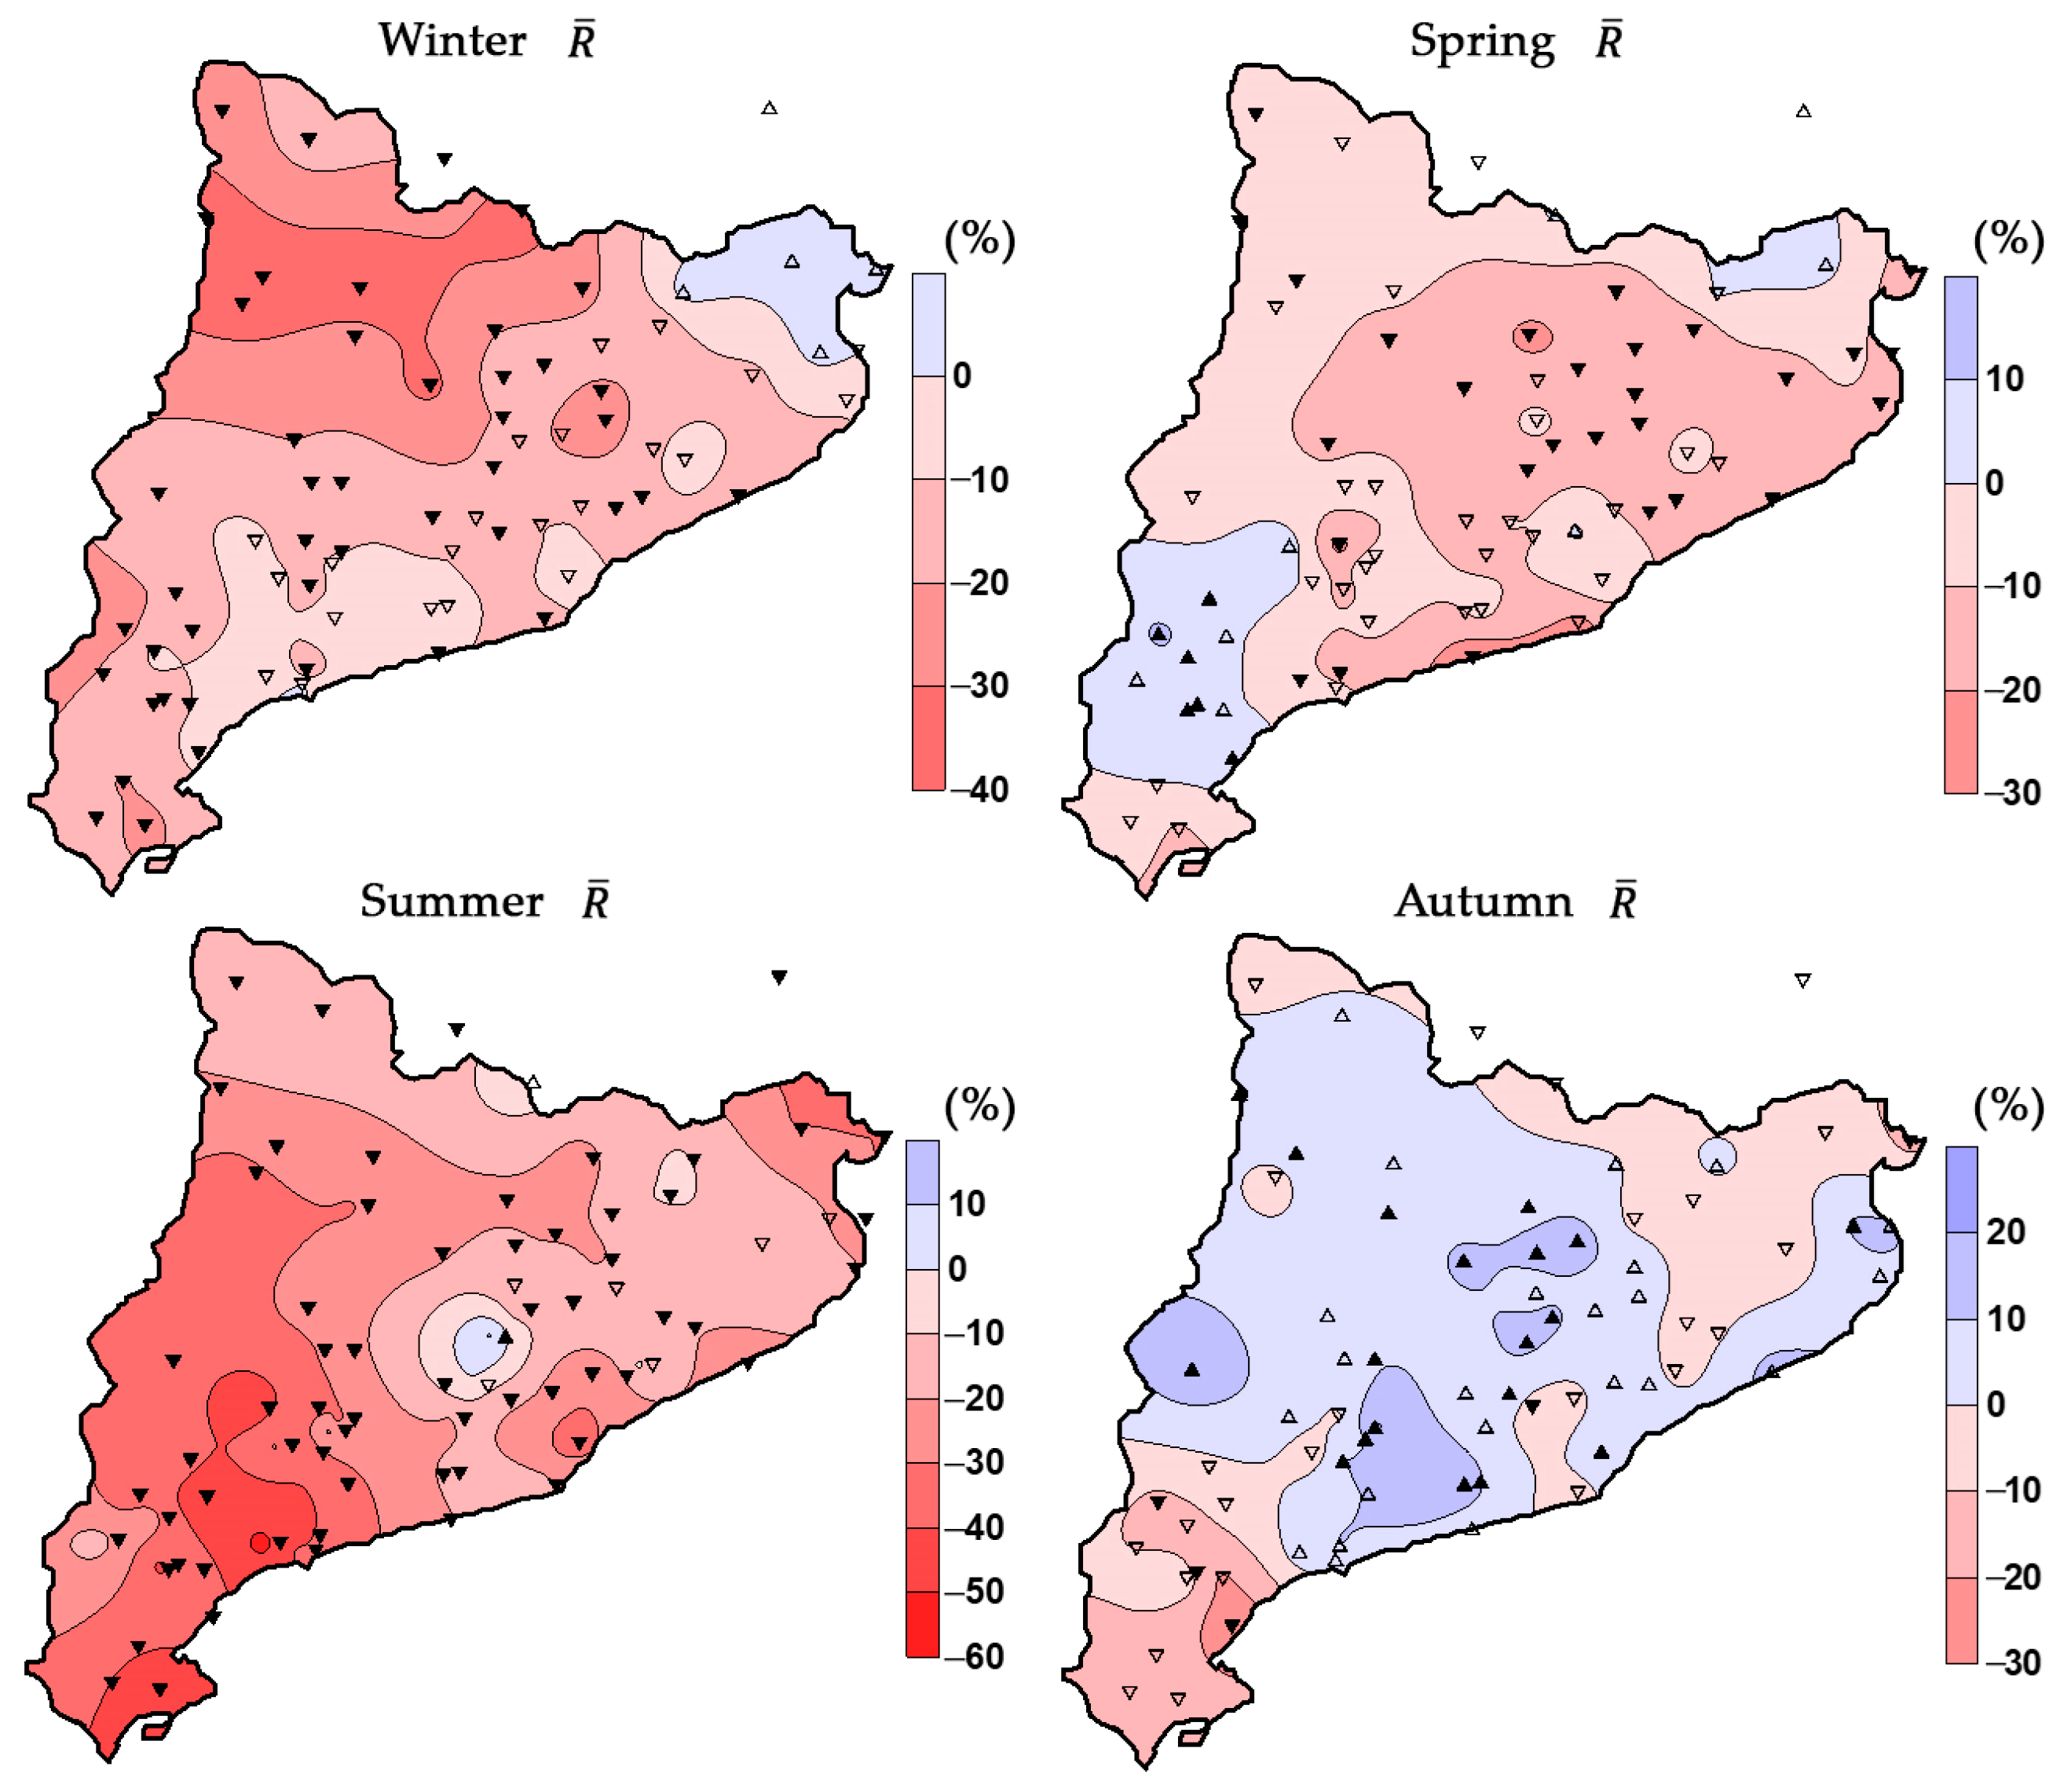
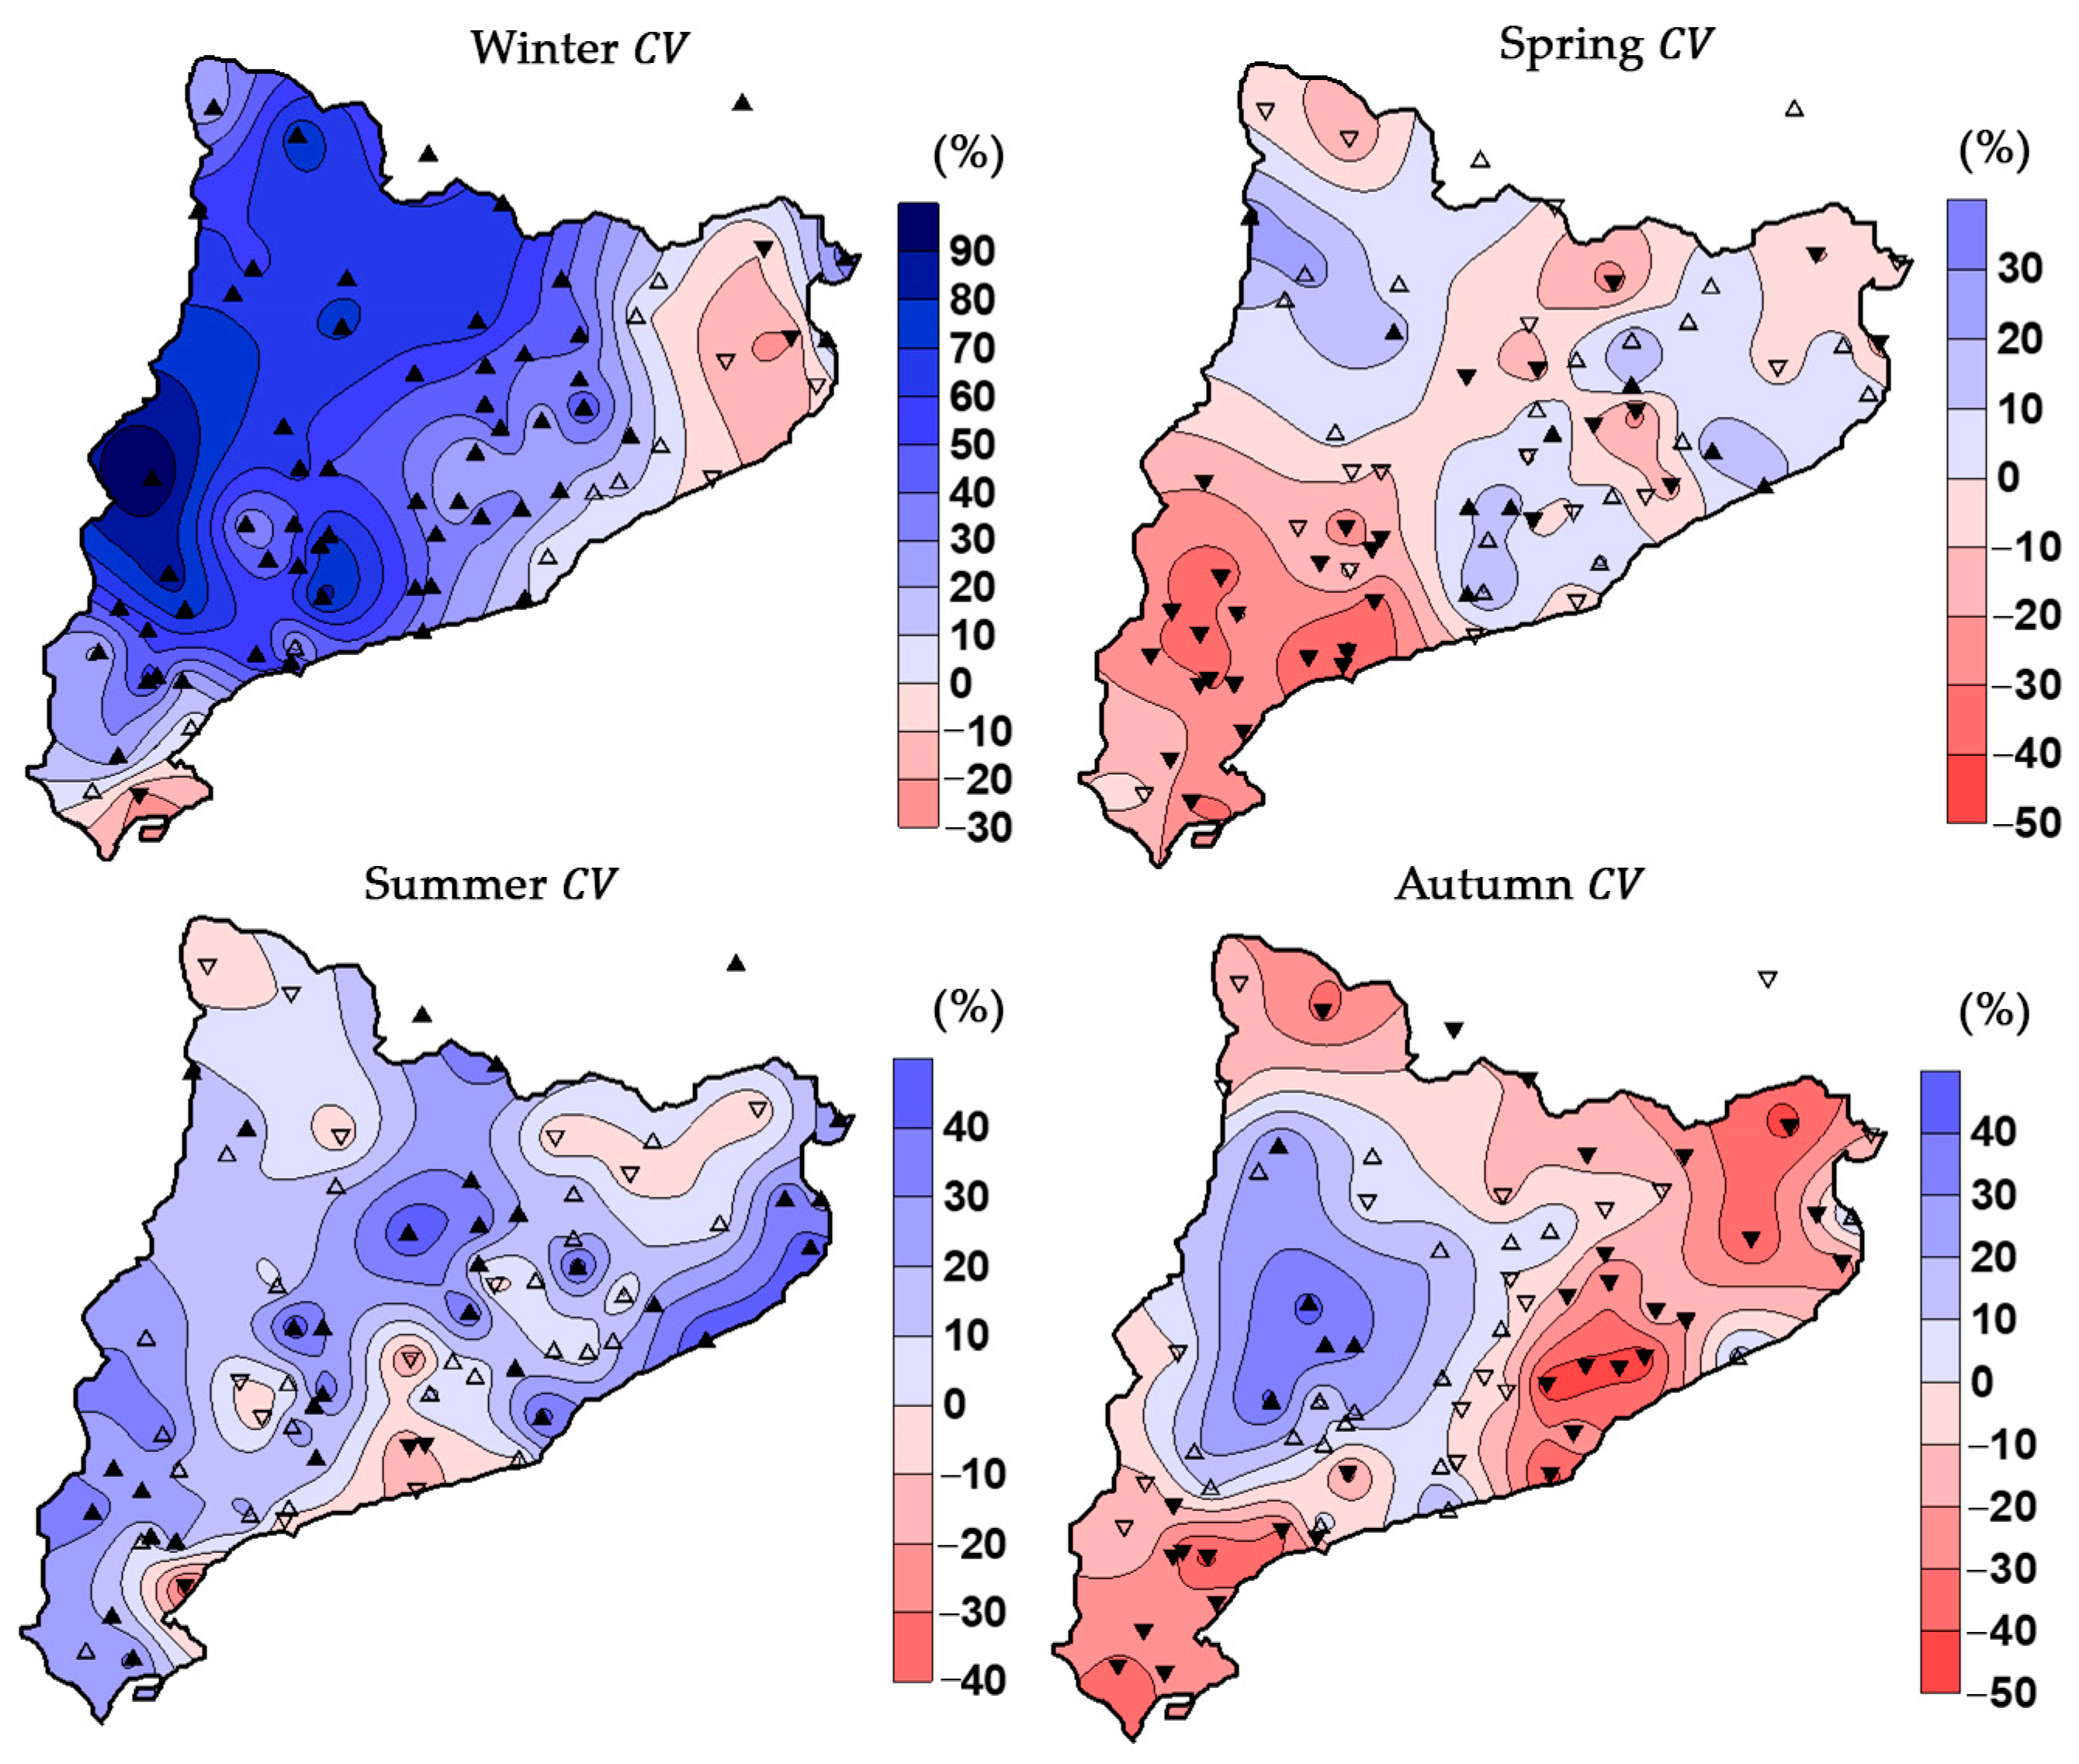
3.2.3. Trends in the Characteristics of Seasonal Moving Windows
3.3. Monthly Amounts
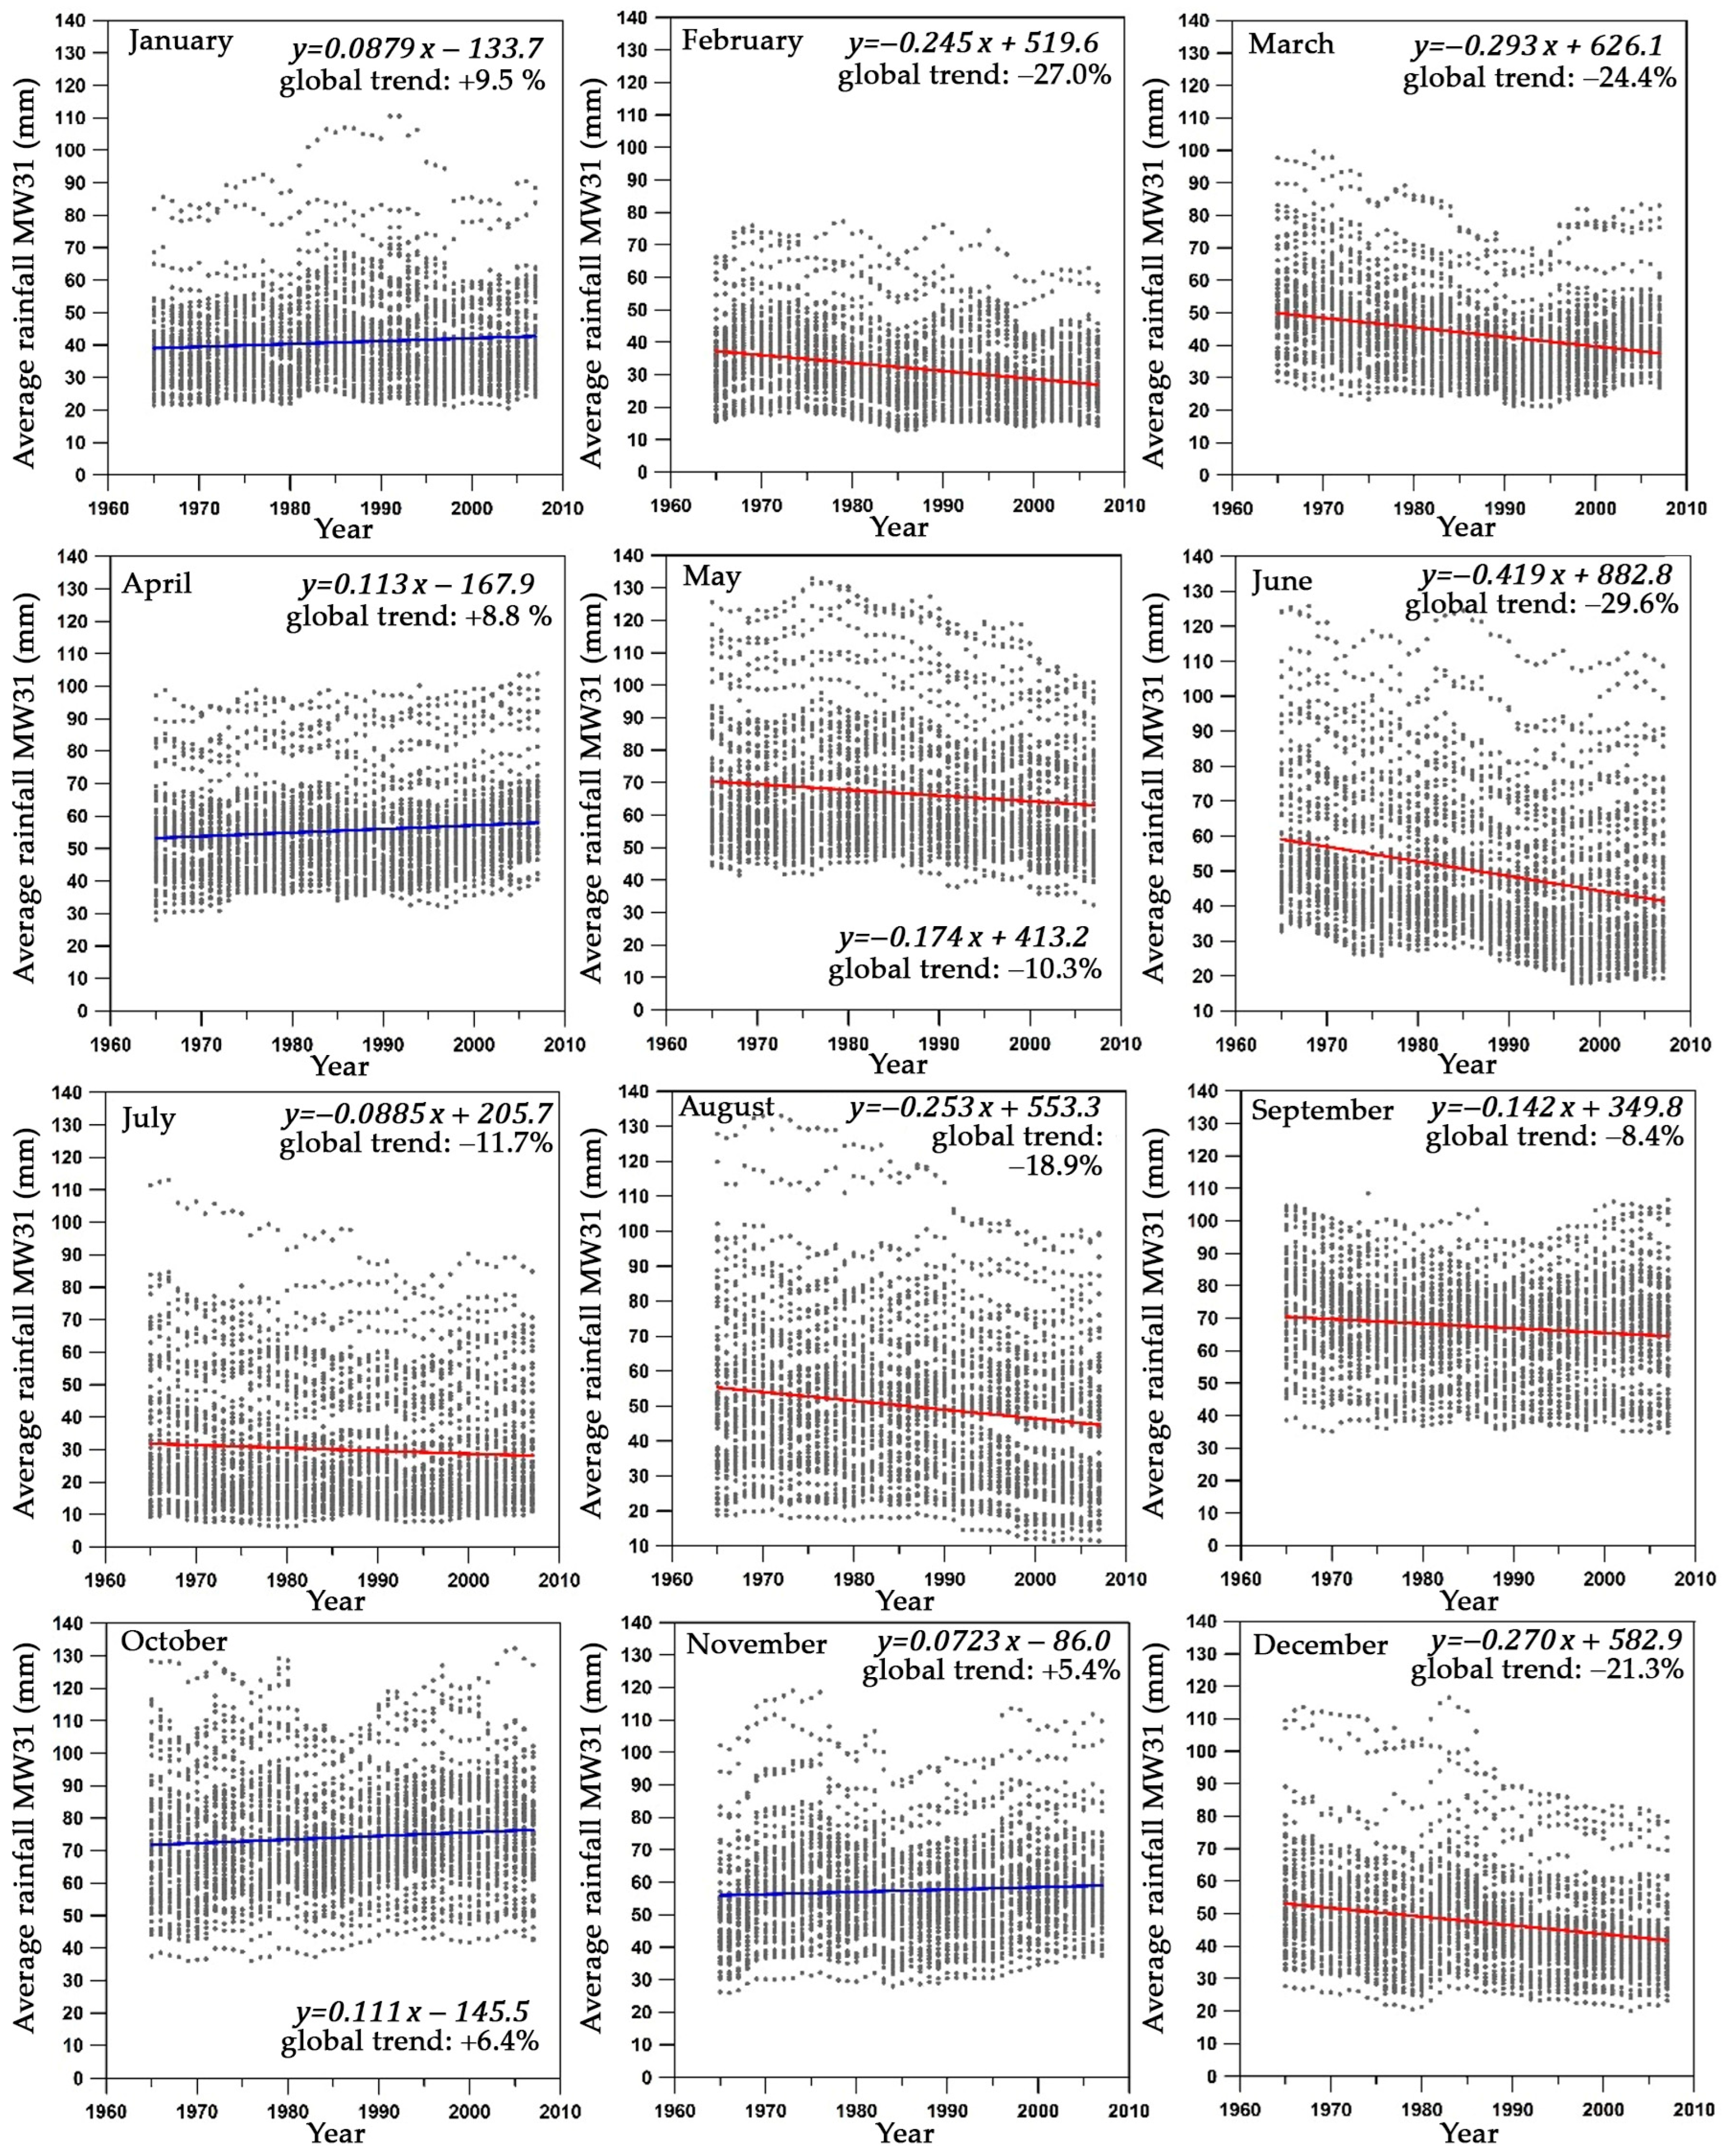
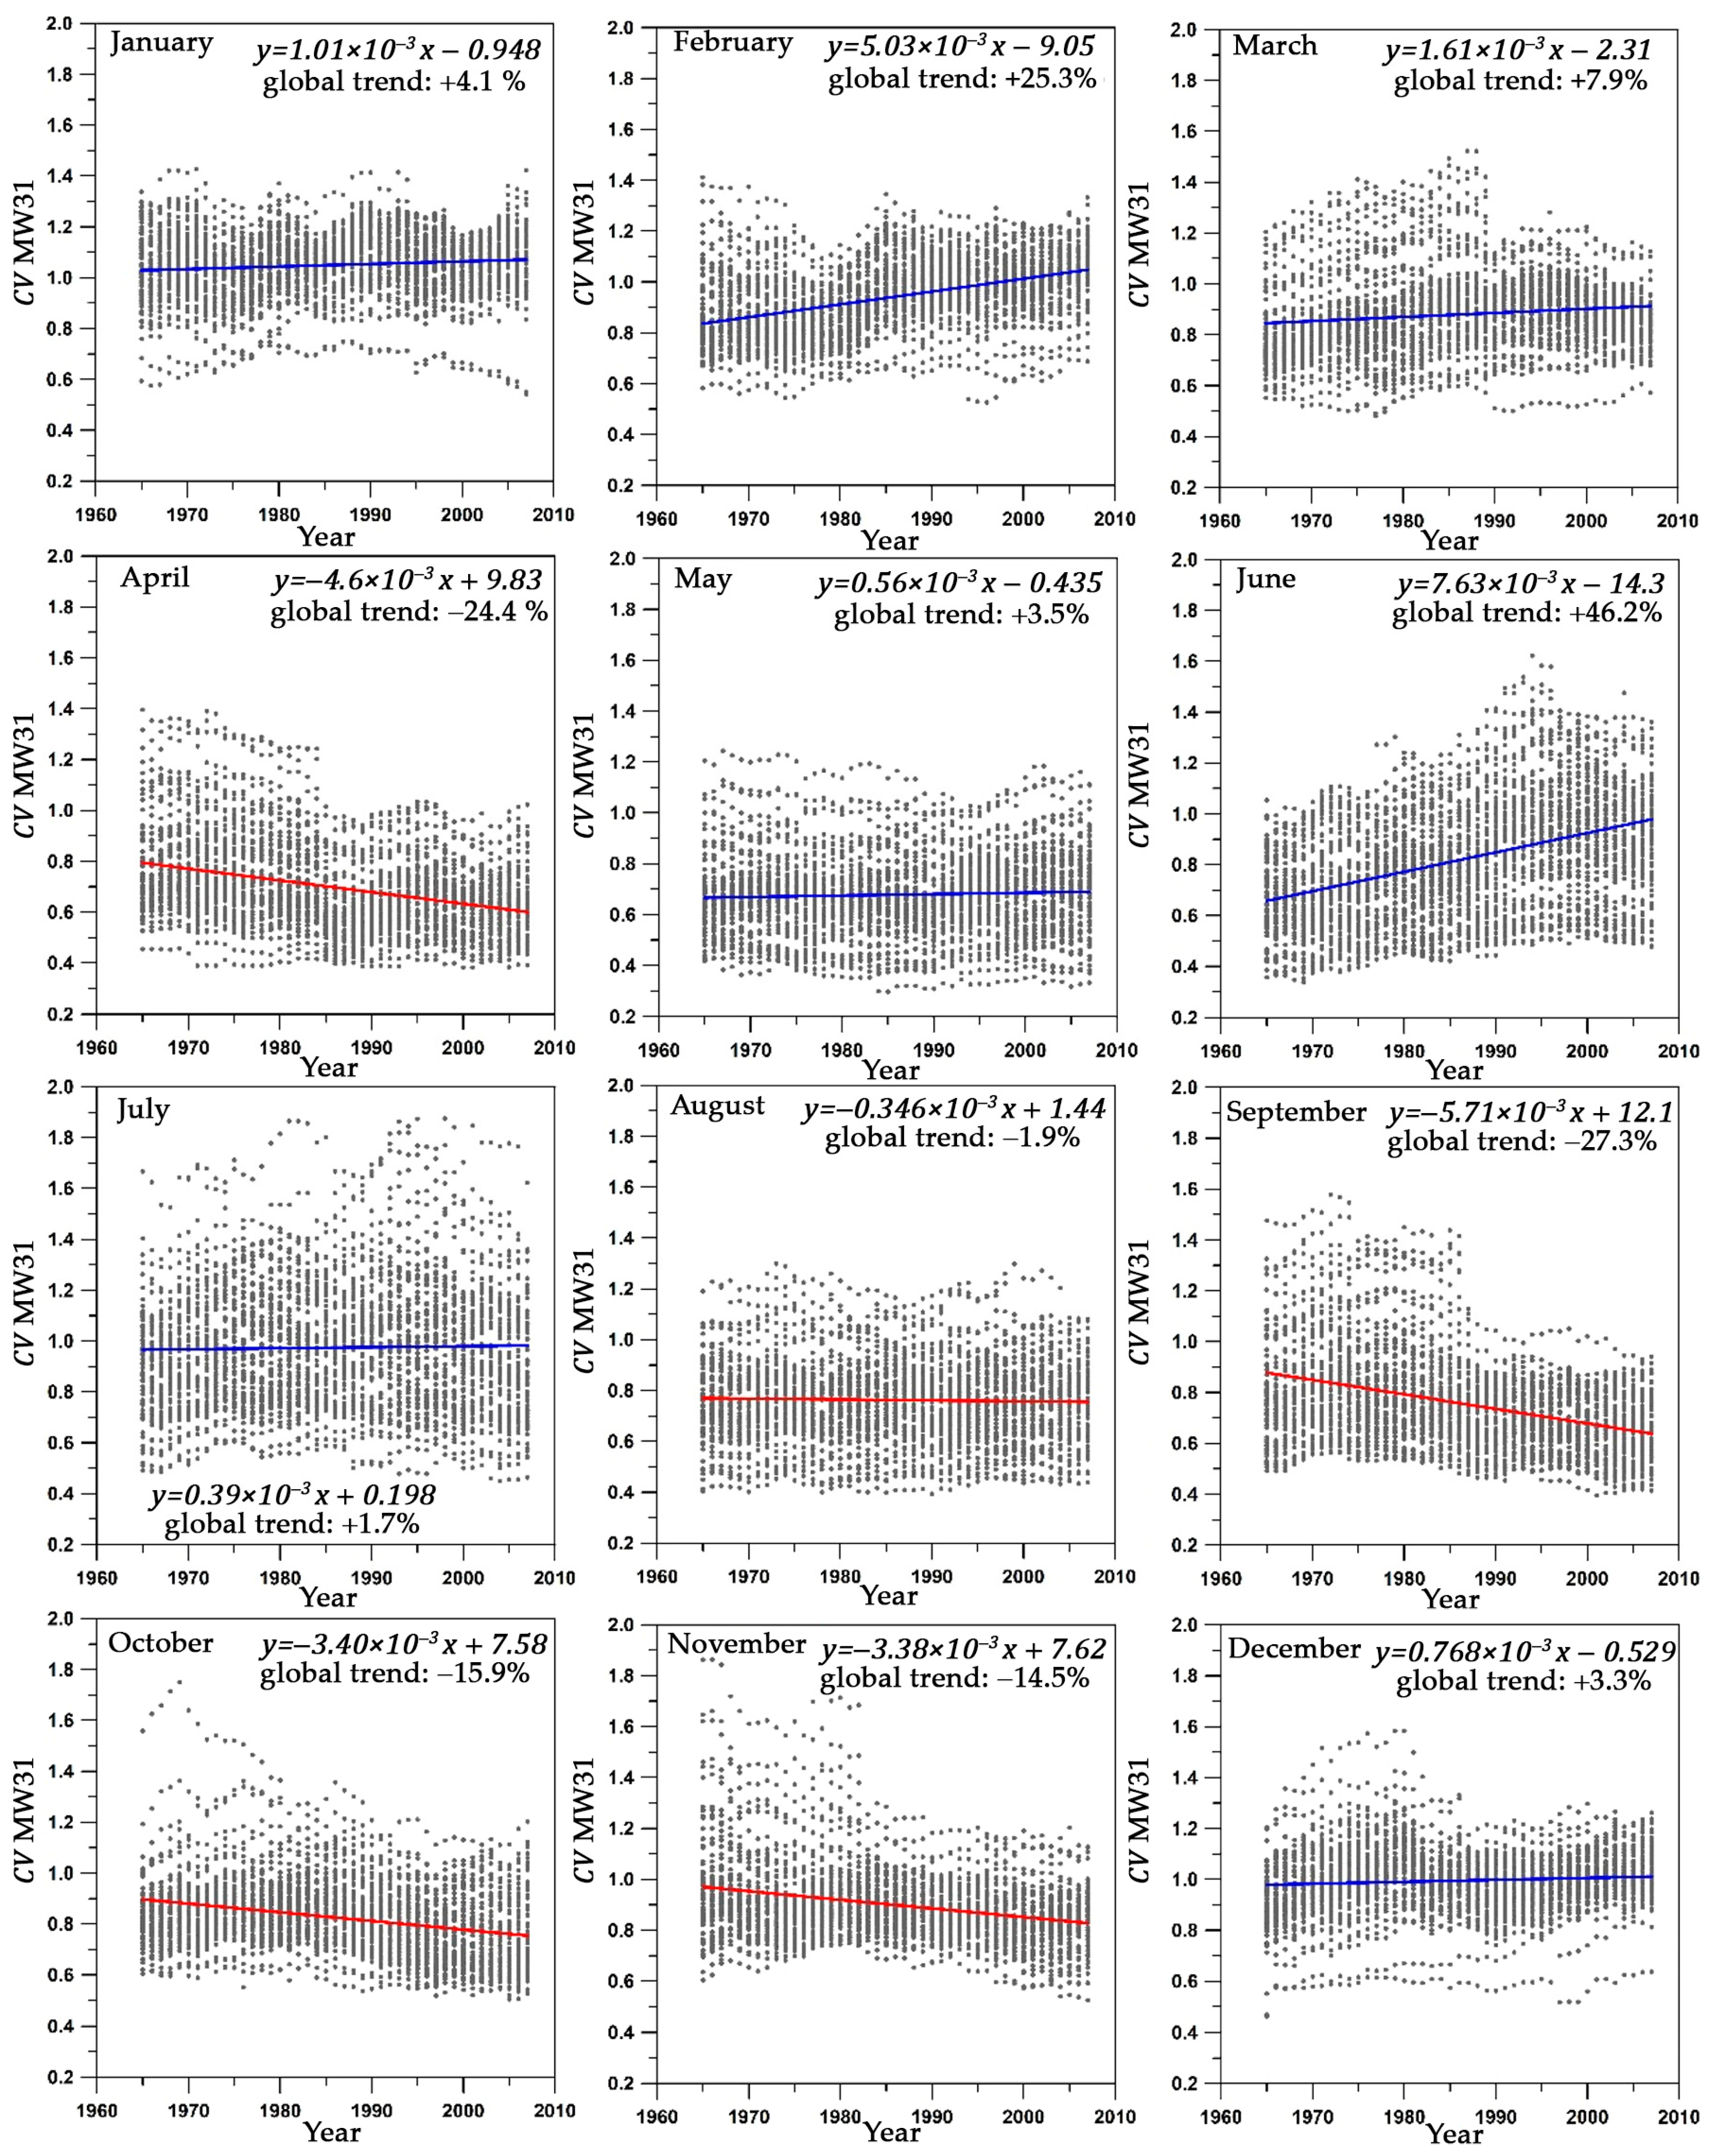
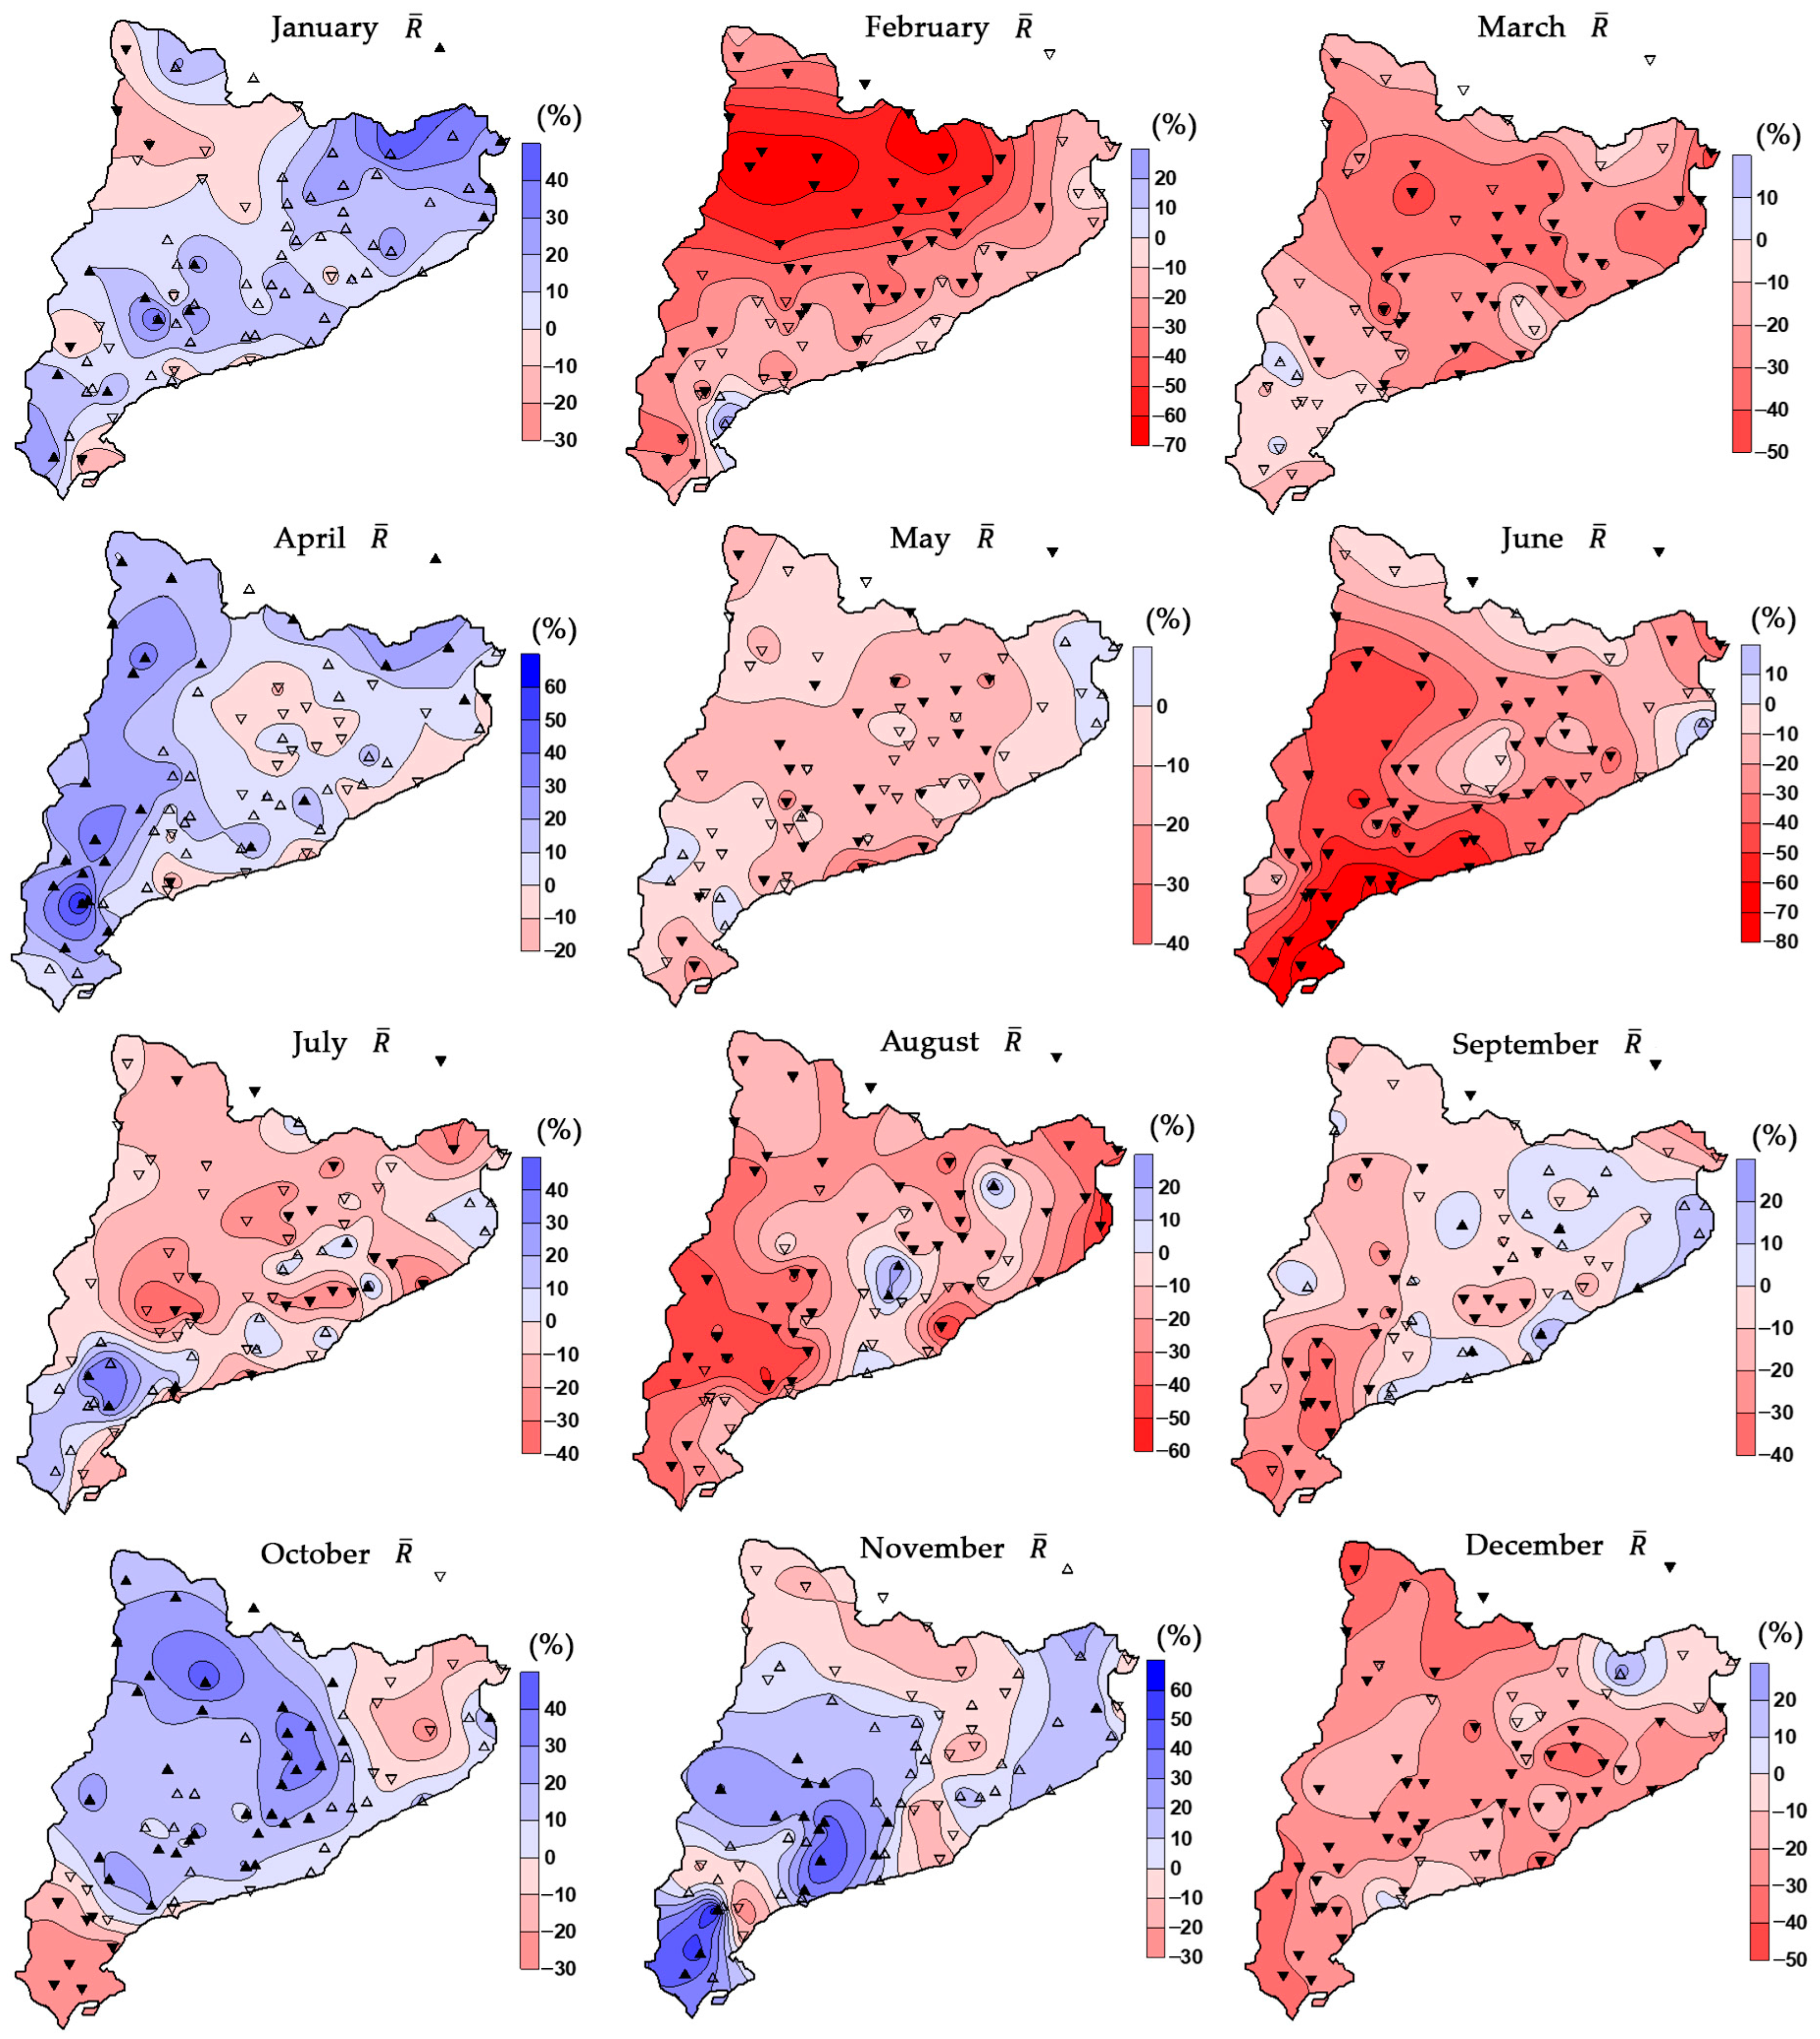
3.3.1. Mean Monthly Rainfall and for Each Window and Station
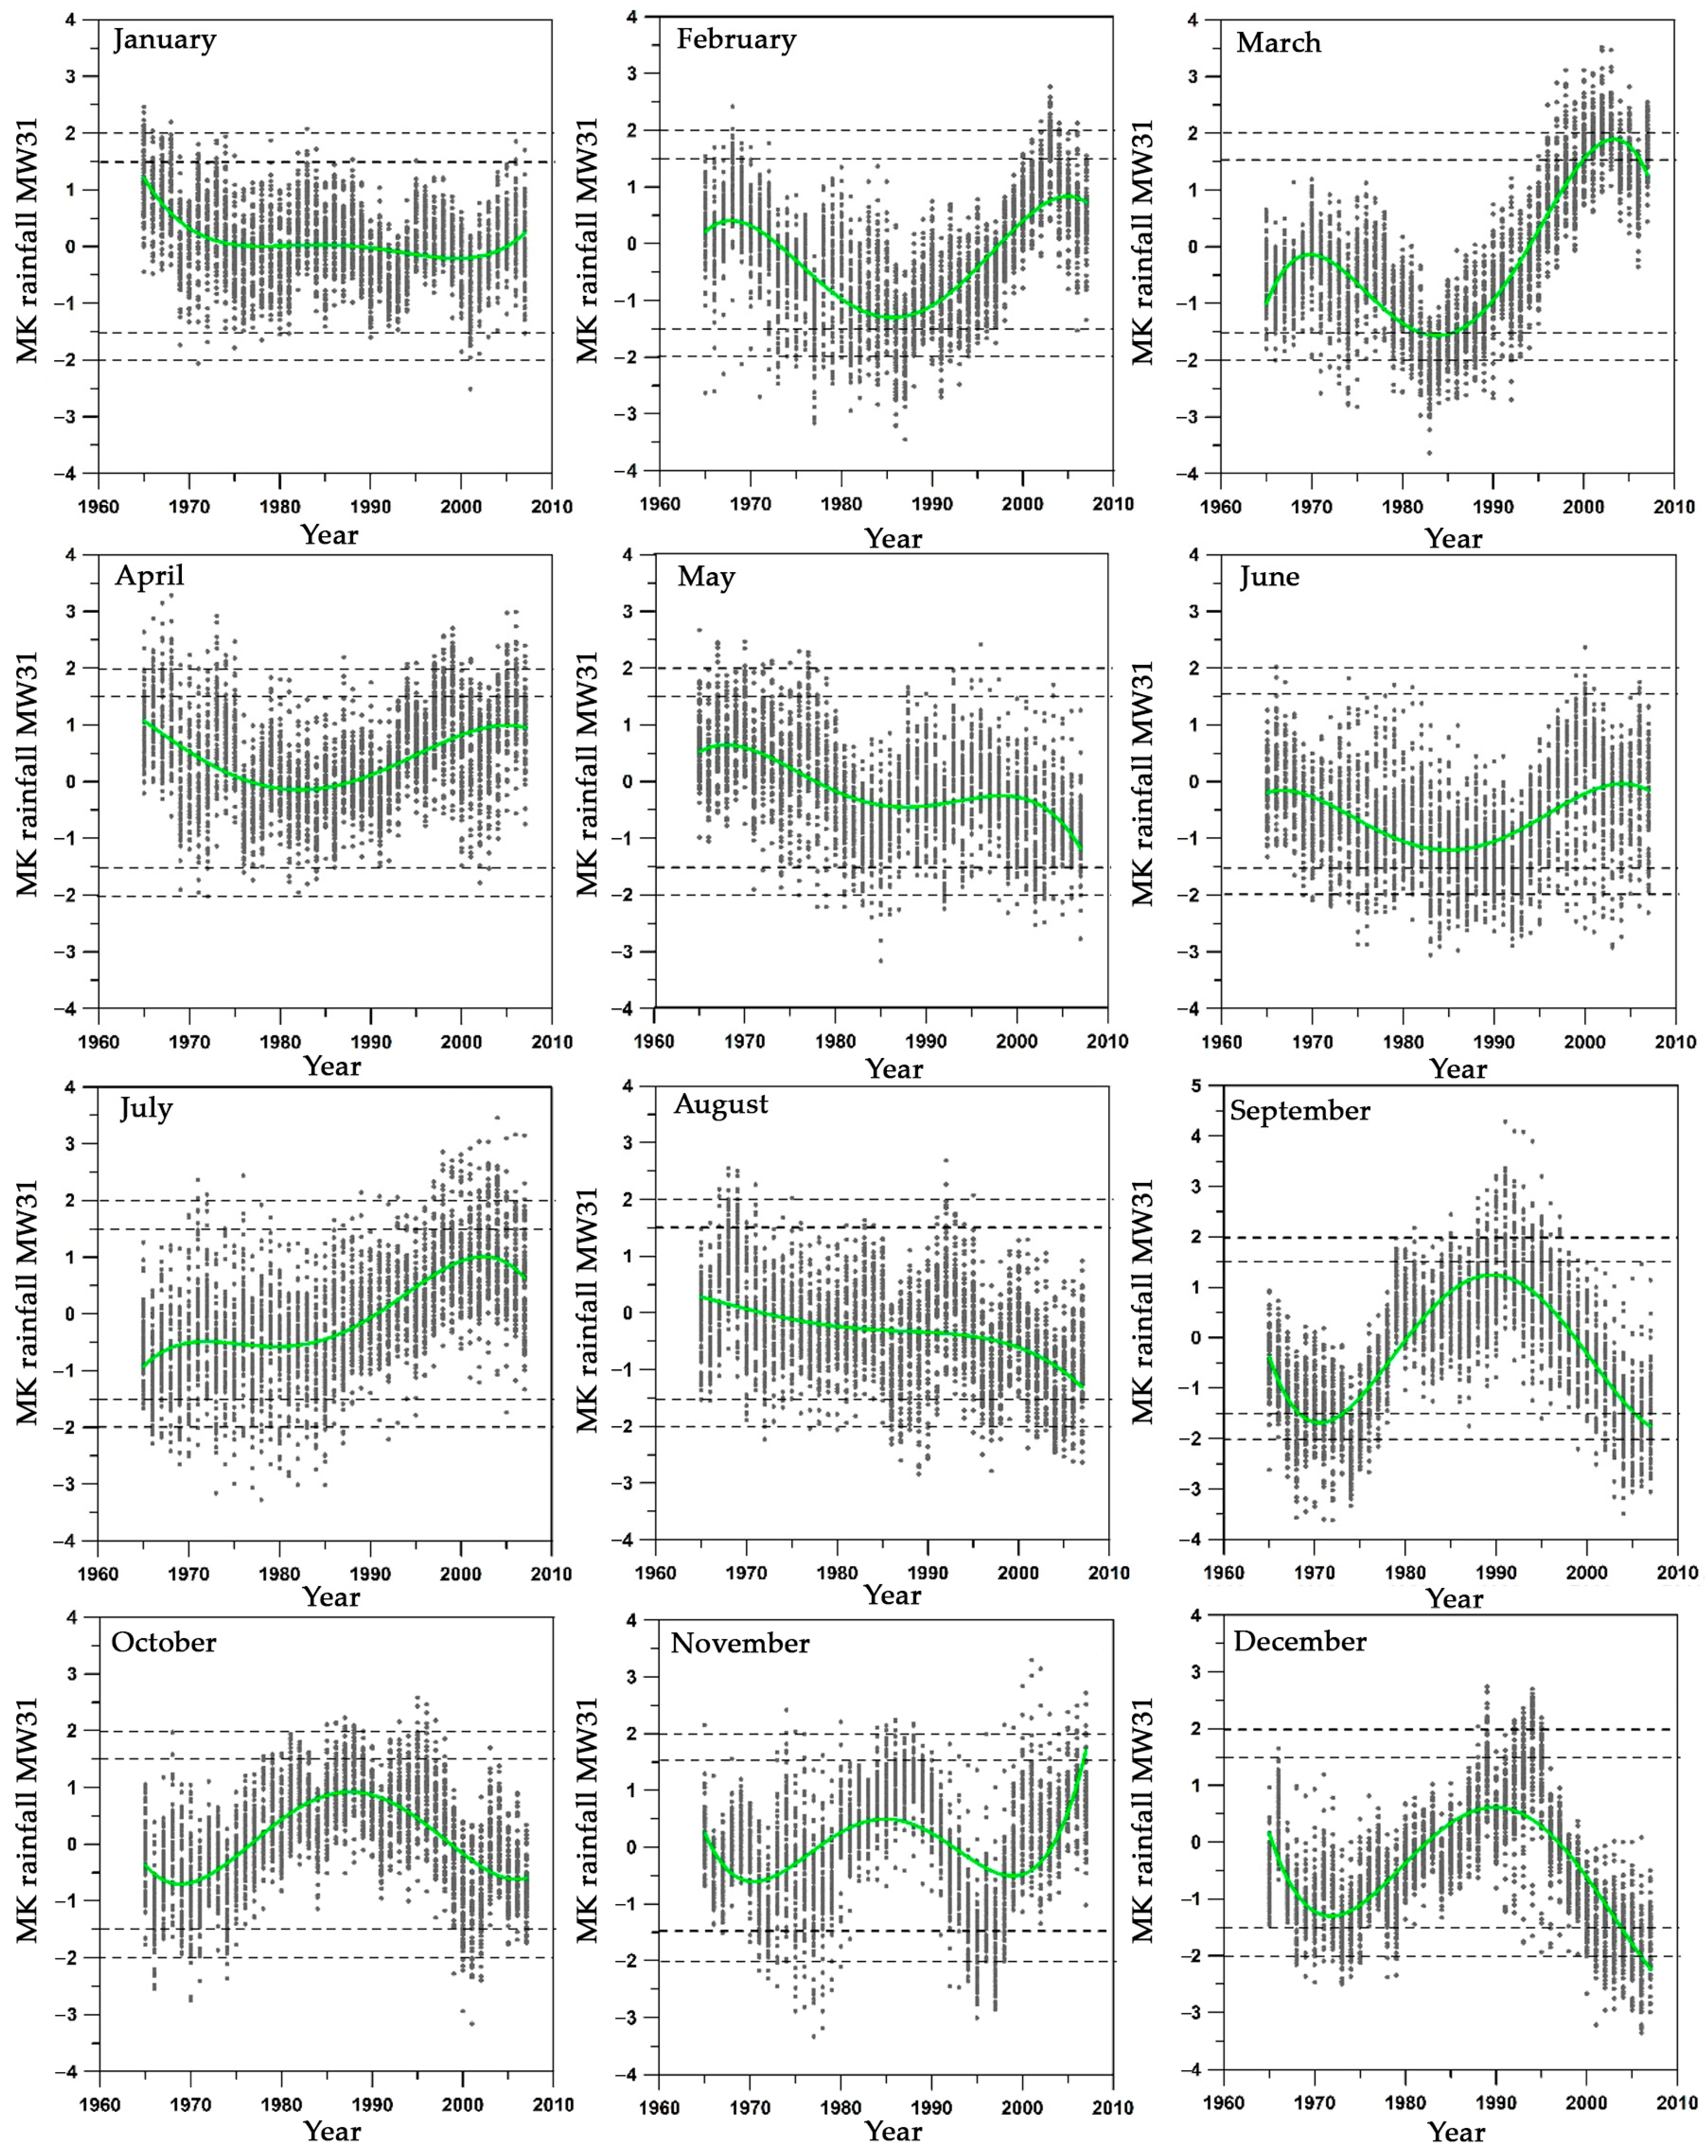
3.3.2. Trends of Monthly Amounts Within Each 31-Year Window
3.3.3. Trends in Characteristics of Monthly Moving Windows
4. Discussion
5. Conclusions
Author Contributions
Funding
Data Availability Statement
Acknowledgments
Conflicts of Interest
References
- IPCC. Cross-Chapter Paper 4: Mediterranean Region. In Climate Change 2022: Impacts, Adaptation and Vulnerability. Contribution of Working Group II to the Sixth Assessment Report of the Intergovernmental Panel on Climate Change; Pörtner, H.-O., Roberts, D.C., Tignor, M., Poloczanska, E.S., Mintenbeck, K., Alegría, A., Craig, M., Langsdorf, S., Löschke, S., Möller, V., et al., Eds.; Cambridge University Press: Cambridge, UK, 2022; Available online: https://www.ipcc.ch/report/ar6/wg2/chapter/ccp4/ (accessed on 13 July 2025).
- Longobardi, A.; Villani, P. Trend analysis of annual and seasonal rainfall time series in the Mediterranean area. Int. J. Climatol. 2010, 30, 1538–1546. [Google Scholar] [CrossRef]
- Gudmundsson, L.; Senevirante, S.I. Anthropogenic climate change affects meteorological drought risk in Europe. Envirom. Res. Lett. 2016, 11, 044005. [Google Scholar] [CrossRef]
- Caloiero, T.; Coscarelli, R.; Ferrari, E.; Mancini, M. Precipitation change in Southern Italy linked to global scale oscillation indexes. Nat. Hazards Earth Syst. Sci. 2011, 11, 1683–1694. [Google Scholar] [CrossRef]
- Senent-Aparicio, J.; López-Ballesteros, A.; Jimeno-Sáez, P.; Pérez-Sánchez, J. Recent precipitation trends in Peninsular Spain and implications for water infrastructure design. J. Hydrol. Reg. 2023, 45, 101308. [Google Scholar] [CrossRef]
- Merino, A.; López, L.; Hermida, L.; Sánchez, J.L.; García-Ortega, E.; Gascón, E.; Fernández-González, S. Identification of drougth phases in a 110-year record from Western Mediterranean basin: Trends, anomalies and periodicity analysis for Iberian Peninsula. Glob. Planet. Change 2015, 113, 96–108. [Google Scholar] [CrossRef]
- De Luis, M.; González-Hidalgo, J.C.; Longares, L.A.; Štepánek, P. Seasonal precipitation trends in the Mediterranean Iberian Peninsula in second half of 20th century. Int. J. Climatol. 2009, 29, 1312–1323. [Google Scholar] [CrossRef]
- Arellano, B.; Zheng, Q.; Roca, J. Analysis of Climate Change Effects on Precipitation and Temperature Trends in Spain. Land 2025, 14, 85. [Google Scholar] [CrossRef]
- Peña-Angulo, D.; Vicente-Serrano, S.M.; Domínguez-Castro, F.; Murphy, C.; Reig, F.; Tramblay, Y.; Trigo, R.M.; Luna, M.Y.; Turco, M.; Noguera, I.; et al. Long-term precipitation in Southwestern Europe reveals no clear trend attributable to anthropogenic forcing. Environ. Res. Lett. 2020, 15, 9. [Google Scholar] [CrossRef]
- Platikanov, S.; López, J.F.; Martrat, B.; Martín-Vide, J.; Tauler, R. Temporal and spatial relationships between climatic indices and precipitation zones in Europe, Spain and Catalonia. Int. J. Climatol. 2024, 45, e8699. [Google Scholar] [CrossRef]
- André, J.; D’Andrea, F.; Drobinski, P.; Muller, C. Regimes of precipitation change over Europe and the Mediterranean. J. Geophys. Res. 2024, 129, e2023JD040413. [Google Scholar] [CrossRef]
- Zittis, G.; Bruggeman, A.; Lelieveld, J. Revisiting future extreme precipitation trends in the Mediterranean. Weather Clim. Extrem. 2021, 34, 100380. [Google Scholar] [CrossRef] [PubMed]
- Miró, J.J.; Estrela, M.J.; Caselles, V.; Gómez, I. Spatial and temporal rainfall changes in the Júcar and Segura basins (1955–2016): Fine-scale trends. Int. J. Climatol. 2018, 38, 4699–4722. [Google Scholar] [CrossRef]
- Miró, J.J.; Lemus-Canovas, M.; Serrano-Notivoli, R.; Olcina-Cantos, J.; Estrela, M.J.; Martín-Vide, J.; Sarricolea, P.; Meseguer-Ruiz, O. A component-based approximation for trend detection of intense rainfall in the Spanish Mediterranean coast. Weather Clim. Extrem. 2022, 38, 100513. [Google Scholar] [CrossRef]
- Ribes, A.; Thao, S.; Vautard, R.; Dubuisson, B.; Somot, S.; Colin, J.; Planton, S.; Soubeyroux, J.M. Observed increase in extreme daily rainfall in the French Mediterranean. Clim. Dyn. 2019, 52, 1095–1114. [Google Scholar] [CrossRef]
- Blanchet, J.; Blanc, A.; Creutin, J.D. Explaining recent trends in extreme precipitation in the Southwestern Alps by changes in atmospheric influences. Weather Clim. Extrem. 2021, 33, 100356. [Google Scholar] [CrossRef]
- Nouaceur, Z.; Murarescu, O.; Muratoreanu, G. Statistical analysis of heavy rains and floods around the French Mediterranean basin over one half a century of observations. Geosciences 2022, 12, 447. [Google Scholar] [CrossRef]
- Blanchet, J.; Creutin, J.D. Instrumental agreement and retrospective analysis of trends in precipitation extremes in the French Mediterranean Region. Environ. Res. Lett. 2022, 17, 074011. [Google Scholar] [CrossRef]
- Khomsi, K.; Mahe, G.; Tramblay, Y.; Sinan, M.; Snoussi, M. Trends in rainfall and temperature extremes in Morocco. Nat. Hazards Earth Sys. Sci. 2015, 16, 1079–1090. [Google Scholar] [CrossRef]
- Ouatiki, H.; Boudhar, A.; Ouhinou, A.; Arioua, A.; Hssaisoune, M.; Bouamri, H.; Benabdelouahab, T. Trend analysis of rainfall and drought over the Oum Er-Rbia River Basin in Morocco during 1970–2010. Arab. J. Geosci. 2019, 12, 128. [Google Scholar] [CrossRef]
- Hadria, R.; Boudhar, A.; Ouatiki, H.; Lebrini, Y.; Elmansouri, L.; Gadouali, F.; Lionboui, H.; Benabdelouahab, T. Combining use of TRMM and ground observations of annual precipitations for meteorological drought trends monitoring in Morocco. Am. J. Remote Sens. 2019, 7, 25–34. [Google Scholar] [CrossRef]
- González-Hidalgo, J.C.; Beguería, S.; Peña-Angulo, D.; Trullenque, V. Catalogue and analysis of extraordinary precipitation events in the Spanish mainland, 1916–2022. Int. J. Climatol. 2025, 45, e8785. [Google Scholar] [CrossRef]
- Merino, A.; Fernández-Vaquero, M.; López, L.; Fernández-González, S.; Hermida, L.; Sánchez, J.L.; García-Ortega, E.; Gascón, E. Large-scale patterns of daily precipitation extremes on the Iberian Peninsula. Int. J. Climatol. 2016, 36, 3873–3891. [Google Scholar] [CrossRef]
- Serrano-Notivoli, R.; Beguería, S.; Saz, M.A.; de Luis, M. Recent trends reveal decreasing intensity of daily precipitation in Spain. Int. J. Climatol. 2018, 38, 4211–4224. [Google Scholar] [CrossRef]
- Casas-Castillo, M.C.; Llabrés-Brustenga, A.; Rius, A.; Rodríguez-Solà, R.; Navarro, X. A single scaling parameter as a first approximation to describe the rainfall pattern of a place: Application on Catalonia. Acta Geophys. 2018, 66, 415–424. [Google Scholar] [CrossRef]
- Casas-Castillo, M.C.; Rodríguez-Solà, R.; Llabrés-Brustenga, A.; García-Marín, A.P.; Estévez, J.; Navarro, X. A simple scaling analysis of rainfall in Andalusia (Spain) under different precipitation regimes. Water 2022, 14, 1303. [Google Scholar] [CrossRef]
- Llasat, M.C.; Marcos, R.; Turco, M.; Gilabert, J.; Llasat-Botija, M. Trends in flash flood events versus convective precipitation in the Mediterranean region: The case of Catalonia. J. Hydrol. 2016, 541, 24–37. [Google Scholar] [CrossRef]
- Llasat, M.C.; del Moral, A.; Cortés, M.; Rigo, T. Convective precipitation trends in the Spanish Mediterranean region. Atmos. Res. 2021, 257, 105581. [Google Scholar] [CrossRef]
- Casas-Castillo, M.C.; Rodríguez-Solà, R.; Lana, X.; Serra, C.; Martínez, M.D.; Biere, R.; Arellano, B.; Roca, J. Consecuencias hidrológicas del cambio climático en entornos urbanos. In XIII CTV 2019 Proceedings: XIII International Conference on Virtual City and Territory: “Challenges and Paradigms of the Contemporary City”, UPC, Barcelona, Spain, 2–4 October 2019; CPSV: Barcelona, Spain, 2019; p. 8291. [Google Scholar] [CrossRef]
- Esbrí, L.; Rigo, T.; Llasat, M.C.; Aznar, B. Identifying storm hotspots and the most unsettled areas in Barcelona by analysing significant rainfall episodes from 2013 to 2018. Water 2021, 13, 1730. [Google Scholar] [CrossRef]
- Casas-Castillo, M.C.; Navarro, X.; Rodríguez-Solà, R. Rainfall organization and storm tracking in urban Barcelona, NE Spain, using a high-resolution rain gauge network. Hydrology 2025, 12, 178. [Google Scholar] [CrossRef]
- Casas-Castillo, M.C.; Llabrés-Brustenga, A.; Rodríguez-Solà, R.; Rius, A.; Redaño, À. Scaling properties of rainfall as a basis for intensity-duration-frequency relationships and their spatial distribution in Catalunya, NE Spain. Climate 2025, 13, 37. [Google Scholar] [CrossRef]
- Lana, X.; Serra, C.; Burgueño, A. Patterns of monthly rainfall shortage and excess in terms of the standardized precipitation index for Catalonia (NE Spain). Int. J. Climatol. 2001, 21, 1669–1691. [Google Scholar] [CrossRef]
- Serra, C.; Burgueño, A.; Martínez, M.D.; Lana, X. Trends in dry spells across Catalonia (NE Spain) during the second half of the 20th century. Theor. Appl. Climatol. 2006, 85, 165–183. [Google Scholar] [CrossRef]
- Lana, X.; Martínez, M.D.; Burgueño, A.; Serra, C.; Martín-Vide, J.; Gómez, L. Distributions of long dry spells in the Iberian Peninsula, years 1951–1990. Int. J. Climatol. 2006, 26, 1999–2021. [Google Scholar] [CrossRef]
- González-Hidalgo, J.C.; Trullenque-Blanco, V.; Beguería, S.; Peña-Angulo, D. Seasonal precipitation changes in the western Mediterranean Basin: The case of the Spanish mainland, 1916–2015. Int. J. Climatol. 2024, 44, 1800–1815. [Google Scholar] [CrossRef]
- Lana, X.; Serra, C.; Casas-Castillo, M.C.; Rodríguez-Solà, R.; Prohom, M. Two Centuries of Monthly Rainfall in Barcelona (NE Spain): Disparity Trends, Correlation of Autumnal Rainfall with the WeMO Index and Its Contribution to Annual Amounts. Climate 2024, 12, 166. [Google Scholar] [CrossRef]
- Martín-Vide, J.; Moreno-García, M.C. Análisis de la serie secular de precipitación anual del Observatorio Fabra (Barcelona) (1914–2020). Geographicalia 2021, 73, 81–94. [Google Scholar] [CrossRef]
- World Meteorological Organization. WMO Climatological Normals. Available online: https://community.wmo.int/en/activity-areas/climate-services/climate-products-and-initiatives/wmo-climatological-normals (accessed on 6 July 2025).
- Servei Meteorològic de Catalunya (Generalitat de Catalunya). Climatologia, Dades i Productes Climàtics. Sèries Climàtiques des de 1950. Available online: https://www.meteo.cat/wpweb/climatologia/dades-i-productes-climatics/series-climatiques-des-de-1950/ (accessed on 13 July 2025).
- Llabrés-Brustenga, A.; Rius, A.; Rodríguez-Solà, R.; Casas-Castillo, M.C.; Redaño, À. Quality control process of the daily rainfall series available in Catalonia from 1855 to the present. Theor. Appl. Climatol. 2019, 137, 2715–2729. [Google Scholar] [CrossRef]
- Prohom, M.; Domonkos, P.; Cunillera, J.; Barrera-Escoda, A.; Busto, M.; Herrero-Anaya, M.; Aparicio, A.; Reynés, J. CADTEP: A new daily quality-controlled and homogenized climate database for Catalonia (1950–2021). Int. J. Climatol. 2023, 43, 4771–4789. [Google Scholar] [CrossRef]
- Reial Acadèmia de Ciències i Arts de Barcelona (RACAB). Meteorologia. Dades Meteorològiques i Climàtiques. Available online: https://observatorifabra.cat/meteorologia/dades-metereologiques-i-climatiques/ (accessed on 13 July 2025).
- Portal de Datos del Observatori de l’Ebre: Dades Climàtiques. Precipitació. Available online: https://www.obsebre.es/es/es-datos-climaticos/en-precipitacion (accessed on 13 July 2025).
- National Oceanic and Atmospheric Administration, NOAA, U.S. Government. Physical Science Laboratory: 20CR Climate Indices: North Atlantic Oscillation (NAO). Available online: https://psl.noaa.gov/data/20thC_Rean/timeseries/monthly/NAO/ (accessed on 15 January 2025).
- Sneyers, R. On the Statistical Analysis of Series of Observations; Technical Note No. 143, WMO No. 415; World Meteorological Organization: Geneva, Switzerland, 1990; 192p, Available online: https://library.wmo.int/idurl/4/30743 (accessed on 13 July 2025).
- Hamed, K.H.; Rao, A.R. A Modified Mann-Kendall Trend Test for Autocorrelated Data. J. Hydrol. 1998, 204, 182–196. [Google Scholar] [CrossRef]
- Pyper, B.J.; Peterman, R.M. Comparison of methods to account for autocorrelation in correlation analyses of fish data. Can. J. Fish. Aquat. Sci. 1998, 55, 2127–2140. [Google Scholar] [CrossRef]
- Li, J.; Sun, C.; Jin, F. NAO implicated as a predictor of Northern Hemisphere mean temperature multidecadal variability. Geophys. Res. Lett. 2013, 40, 5497–5502. [Google Scholar] [CrossRef]
- Martín-Vide, J.; López-Bustins, J.A. The Western Mediterranean Oscillation and rainfall in the Iberian Peninsula. Int. J. Climatol. 2006, 26, 1455–1475. [Google Scholar] [CrossRef]
- Ríos-Cornejo, D.; Penas, A.; Álvarez-Esteban, R.; del Río, S. Links between teleconnection patterns and precipitation in Spain. Atmos. Res. 2015, 156, 14–28. [Google Scholar] [CrossRef]
- Martínez-Artigas, J.; Lemus-Cánovas, M.; López-Bustins, J.A. Precipitation in peninsular Spain: Influence of teleconnection indices and spatial regionalisation. Int. J. Climatol. 2020, 41, E1320–E1335. [Google Scholar] [CrossRef]
- Sun, C.; Li, J.; Jin, F. A delayed oscillator model for the quasi-periodic multidecadal variability of the NAO. Clim. Dym. 2015, 45, 2083–2099. [Google Scholar] [CrossRef]
- Luterbacher, J.; Schmutz, C.; Gyalistras, D.; Xoplaki, E.; Wanner, H. Reconstruction of monthly NAO and EU indices back to AD 1675. Geophys. Res. Lett. 1999, 26, 2745–2748. [Google Scholar] [CrossRef]
- Benetó, P.; Khodayar, S. On the need for improved knowledge on the regional-to-local precipitation variability in eastern Spain under climate change. Atmos. Res. 2023, 290, 106795. [Google Scholar] [CrossRef]
- González-Hidalgo, J.C.; Lopez-Bustins, J.A.; Štepánek, P.; Martín-Vide, J.; de Luis, M. Monthly precipitation trends on the Mediterranean fringe of the Iberian Peninsula during the second-half of the twentieth century (1951–2000). Int. J. Climatol. 2009, 29, 1415–1429. [Google Scholar] [CrossRef]
- Lana, X.; Casas-Castillo, M.C.; Rodríguez-Solà, R.; Serra, C.; Martínez, M.D.; Kirchner, R. Rainfall regime trends at annual and monthly scales in Catalonia (NE Spain) and indications of CO2 emissions effects. Theor. Appl. Climatol. 2021, 146, 981–996. [Google Scholar] [CrossRef]
- González-Hidalgo, J.C.; Brunetti, M.; de Luis, M. A new tool for monthly precipitation analysis in Spain: MOPREDAS database (monthly precipitation trends December 1945–November 2005). Int. J. Climatol. 2011, 31, 715–731. [Google Scholar] [CrossRef]
- Gajić-Čapka, M. Periodicity of annual precipitation in different climate regions of Croatia. Theor. Appl. Climatol. 1994, 49, 213–226. [Google Scholar] [CrossRef]
- Seip, K.L.; Grøn, Ø.; Wang, H. The North Atlantic Oscillations: Cycle Times for the NAO, the AMO and the AMOC. Climate 2019, 7, 43. [Google Scholar] [CrossRef]
- Paredes, D.; Trigo, R.M.; Garcia-Herrera, R.; Trigo, I.F. Understanding precipitation changes in Iberia in early spring: Weather typing and storm-tracking approaches. J. Hydrometeorol. 2006, 7, 101–113. [Google Scholar] [CrossRef]
- Gleissberg, W. The eighty-year solar cycle in auroral frequency numbers. J. Br. Astron. Assoc. 1965, 75, 227–231. Available online: https://adsabs.harvard.edu/pdf/1967SoPh....2..231G (accessed on 13 July 2025).
- Peristykh, A.N.; Damon, P.E. Persistence of the Gleissberg 88-year solar cycle over the last 12,000 years: Evidence from cosmogenic isotopes. J. Geophys. Res. 2003, 108, SSH 1-1–SSH 1-15. [Google Scholar] [CrossRef]
- Burroughs, W.J. Weather Cycles Real or Imaginary, 2nd ed.; Cambridge University Press: Cambridge, UK, 2003; 330p, ISBN 9780521528221. [Google Scholar]
- Hameed, S.; Yeh, W.M.; Li, M.T.; Cess, R.D.; Wang, W.C. An analysis of periodicities in the 1470 to 1974 Beijing precipitation record. Geophys. Res. Lett. 1983, 10, 436–439. [Google Scholar] [CrossRef]
- Yousef, S.M. The solar Wolf-Gleyssberg cycle and its influence on the earth. In Proceedings of the International Conference for Environment Hazard (ICEHM2000), Cairo, Egypt, 9–12 September 2000; pp. 267–293. Available online: https://www.virtualacademia.com/pdf/cli267_293.pdf (accessed on 13 July 2025).


| Code | Name | UTM X (km) | UTM Y (km) | Altitude (m.a.s.l.) | Code | Name | UTM X (km) | UTM Y (km) | Altitude (m.a.s.l.) |
|---|---|---|---|---|---|---|---|---|---|
| 1 | El Pont de Suert | 314.390 | 4696.649 | 823 | 44 | Prats de Lluçanès | 419.397 | 4651.026 | 701 |
| 2 | Vielha | 319.403 | 4729.904 | 975 | 45 | Rocafort | 356.457 | 4593.22 | 560 |
| 3 | Figueres | 496.369 | 4684.011 | 31 | 46 | Montblanc | 346.606 | 4582.81 | 340 |
| 4 | Moià | 424.938 | 4629.639 | 735 | 47 | Esparraguera | 405.436 | 4599.078 | 187 |
| 5 | Ebro Observatory | 288.703 | 4522.022 | 49 | 48 | Torroella | 516.672 | 4655.775 | 2 |
| 6 | Reus Airport | 345.585 | 4556.658 | 73 | 49 | Montbrió | 333.136 | 4554.598 | 132 |
| 7 | Barcelona Airport | 419.544 | 4572.631 | 3 | 50 | Organyà | 362.27 | 4675.133 | 566 |
| 8 | Fabra Observatory | 426.879 | 4585.783 | 412 | 51 | La Vall d’en Bas | 455.339 | 4663.113 | 510 |
| 9 | Girona | 484.094 | 4648.026 | 72 | 52 | Castellfollit | 462.603 | 4674.424 | 296 |
| 10 | Flix | 298.285 | 4562.288 | 53 | 53 | Cadaqués | 522.557 | 4681.476 | 24 |
| 11 | Tivissa | 309.325 | 4546.042 | 313 | 54 | El Bruc | 398.259 | 4603.715 | 489 |
| 12 | Lleida | 299.694 | 4611.309 | 192 | 55 | St. Quintí de Mediona | 390.919 | 4593.443 | 325 |
| 13 | Tàrrega | 347.109 | 4614.634 | 380 | 56 | Castellví | 384.319 | 4575.694 | 198 |
| 14 | Caldes | 430.803 | 4607.309 | 176 | 57 | Balsareny | 406.601 | 4635.019 | 327 |
| 16 | Malla– Torrellebreta | 438.458 | 4634.027 | 570 | 58 | Palafrugell | 513.318 | 4640.267 | 64 |
| 17 | Vic | 437.077 | 4643.040 | 499 | 59 | Jafre | 505.127 | 4655.771 | 15 |
| 18 | Vilafranca | 389.362 | 4576.479 | 176 | 60 | Puig-Reig | 406.818 | 4647.462 | 455 |
| 19 | Granollers | 441.629 | 4606.726 | 202 | 61 | Berga | 404.203 | 4661.652 | 704 |
| 20 | Ransol | 388.463 | 4715.122 | 1645 | 62 | Sarral | 353.598 | 4589.634 | 467 |
| 21 | Sallent | 411.665 | 4627.476 | 278 | 63 | Els Omellons | 329.778 | 4596.644 | 385 |
| 22 | Valls | 354.383 | 4572.742 | 230 | 64 | La Granadella | 305.008 | 4580.475 | 505 |
| 23 | Igualada | 384.760 | 4603.934 | 333 | 65 | Cubelles | 386.684 | 4561.776 | 17 |
| 24 | Tremp | 325.636 | 4670.183 | 473 | 66 | Malgrat | 479.729 | 4610.62 | 2 |
| 25 | Oliana | 360.703 | 4659.884 | 490 | 67 | Mas de Barberans | 280.386 | 4510.733 | 240 |
| 26 | El Turó de l’Home | 453.364 | 4624.999 | 1668 | 68 | Amposta | 295.436 | 4508.513 | 3 |
| 27 | Manresa | 403.719 | 4619.630 | 291 | 69 | Torelló | 437.113 | 4657.362 | 508 |
| 29 | Vila-seca | 344.301 | 4552.210 | 53 | 70 | Benissanet | 301.215 | 4547.698 | 32 |
| 33 | Perpinyà | 489.425 | 4731.437 | 44 | 71 | Riba-roja | 289.19 | 4569.44 | 76 |
| 34 | Puigcerdà | 412.395 | 4699.199 | 1214 | 72 | Miravet | 298.143 | 4546.014 | 43 |
| 37 | Llinars | 449.806 | 4610.209 | 198 | 73 | Campdevànol | 431.279 | 4674.834 | 738 |
| 38 | Terrassa | 418.373 | 4601.603 | 290 | 74 | Cervera | 356.469 | 4614.555 | 554 |
| 39 | Rocallaura | 345.288 | 4596.651 | 645 | 75 | Riner | 384.044 | 4644.945 | 830 |
| 40 | Agramunt | 341.843 | 4627.918 | 337 | 76 | Vimbodí | 336.933 | 4585.049 | 446 |
| 41 | Vilalba | 282.449 | 4555.323 | 442 | 77 | L’Ametlla de Mar | 312.141 | 4531.061 | 93 |
| 42 | Breda | 463.111 | 4621.813 | 169 | 78 | La Pobla de Segur | 332.041 | 4678.363 | 508 |
| 43 | Cabacers | 310.237 | 4568.904 | 357 | 79 | Esterri | 346.296 | 4721.003 | 957 |
(mm) | (mm) | (mm) | (mm) | |||||
|---|---|---|---|---|---|---|---|---|
| Annual | 339.0 | 1111.8 | 615.7 | 156.9 | 0.14 | 0.41 | 0.25 | 0.042 |
| Winter | 60.1 | 289.2 | 120.5 | 37.3 | 0.34 | 0.81 | 0.58 | 0.086 |
| Spring | 101.8 | 320.5 | 166.0 | 40.6 | 0.20 | 0.81 | 0.45 | 0.094 |
| Summer | 43.1 | 364.5 | 130.2 | 59.9 | 0.26 | 0.84 | 0.51 | 0.114 |
| Autumn | 101.2 | 336.0 | 199.0 | 39.4 | 0.30 | 0.83 | 0.47 | 0.091 |
| January | 20.5 | 110.6 | 40.9 | 13.2 | 0.54 | 1.43 | 1.05 | 0.131 |
| February | 12.9 | 77.2 | 32.1 | 11.8 | 0.53 | 1.41 | 0.94 | 0.147 |
| March | 21.2 | 99.6 | 43.7 | 12.7 | 0.48 | 1.52 | 0.88 | 0.158 |
| April | 28.1 | 103.9 | 55.6 | 13.6 | 0.38 | 1.40 | 0.70 | 0.174 |
| May | 32.3 | 133.0 | 66.7 | 18.5 | 0.30 | 1.24 | 0.68 | 0.161 |
| June | 17.9 | 125.8 | 50.3 | 20.8 | 0.34 | 1.62 | 0.82 | 0.235 |
| July | 6.4 | 113.0 | 30.0 | 19.3 | 0.45 | 1.87 | 0.97 | 0.253 |
| August | 11.4 | 133.0 | 50.0 | 21.8 | 0.39 | 1.30 | 0.76 | 0.163 |
| September | 34.8 | 108.5 | 67.5 | 14.8 | 0.40 | 1.58 | 0.76 | 0.194 |
| October | 36.0 | 132.3 | 74.1 | 16.9 | 0.50 | 1.75 | 0.83 | 0.153 |
| November | 26.0 | 119.0 | 57.5 | 14.6 | 0.52 | 1.86 | 0.90 | 0.154 |
| December | 20.1 | 116.6 | 47.4 | 14.6 | 0.46 | 1.58 | 0.99 | 0.129 |
(mm/y) | (mm/y) | (mm/y) | (mm/y) | |||||
|---|---|---|---|---|---|---|---|---|
| Annual | −14.8 | 8.93 | −1.72 | 2.74 | −3.59 | 2.72 | −0.51 | 0.83 |
| Winter | −6.23 | 7.68 | −0.42 | 1.27 | −3.26 | 2.89 | −0.42 | 0.86 |
| Spring | −7.59 | 4.99 | −0.10 | 1.68 | −3.43 | 2.48 | −0.09 | 1.13 |
| Summer | −5.82 | 3.70 | −0.72 | 1.08 | −3.32 | 2.92 | −0.53 | 0.84 |
| Autumn | −7.97 | 6.31 | −0.47 | 2.21 | −3.60 | 2.97 | −0.16 | 1.05 |
| January | −3.43 | 4.28 | 0.14 | 0.72 | −2.52 | 2.47 | 0.08 | 0.70 |
| February | −2.89 | 2.77 | −0.13 | 0.60 | −3.45 | 2.77 | −0.28 | 1.03 |
| March | −3.06 | 2.96 | −0.18 | 0.91 | −3.64 | 3.52 | −0.18 | 1.31 |
| April | −2.53 | 2.95 | 0.20 | 0.72 | −2.02 | 3.28 | 0.39 | 0.85 |
| May | −3.75 | 4.19 | −0.12 | 0.81 | −3.16 | 2.67 | −0.14 | 0.88 |
| June | −2.51 | 1.82 | −0.41 | 0.62 | −3.06 | 2.37 | −0.62 | 0.90 |
| July | −2.62 | 2.66 | −0.07 | 0.53 | −3.28 | 3.46 | −0.04 | 1.02 |
| August | −3.23 | 2.08 | −0.24 | 0.65 | −2.84 | 2.69 | −0.33 | 0.88 |
| September | −5.35 | 4.28 | −0.43 | 1.37 | −3.62 | 4.28 | −0.26 | 1.31 |
| October | −4.50 | 4.35 | −0.11 | 1.12 | −3.16 | 2.58 | 0.08 | 0.89 |
| November | −4.09 | 3.26 | 0.07 | 1.04 | −3.33 | 3.30 | 0.01 | 1.00 |
| December | −4.76 | 3.42 | −0.44 | 1.04 | −3.35 | 2.74 | −0.47 | 1.05 |
| Number/% | Number/% | Number/% | Number/% | |||||
|---|---|---|---|---|---|---|---|---|
| Annual | 0 | 0.0 | 63 | 87.5 | 19 | 26.4 | 21 | 29.2 |
| Winter | 0 | 0.0 | 45 | 62.5 | 57 | 79.2 | 3 | 4.2 |
| Spring | 6 | 8.3 | 28 | 38.9 | 10 | 13.9 | 29 | 40.3 |
| Summer | 1 | 1.4 | 64 | 88.9 | 32 | 44.4 | 3 | 4.2 |
| Autumn | 19 | 26.4 | 5 | 6.9 | 5 | 6.9 | 31 | 43.1 |
| January | 12 | 16.7 | 4 | 5.5 | 15 | 20.8 | 17 | 23.6 |
| February | 0 | 0.0 | 47 | 65.3 | 41 | 56.9 | 4 | 5.6 |
| March | 0 | 0.0 | 41 | 56.9 | 21 | 29.2 | 1 | 1.4 |
| April | 24 | 33.3 | 2 | 2.8 | 0 | 0.0 | 47 | 65.3 |
| May | 0 | 0.0 | 27 | 37.5 | 21 | 29.2 | 15 | 20.8 |
| June | 0 | 0.0 | 56 | 77.7 | 61 | 84.7 | 0 | 0.0 |
| July | 6 | 8.3 | 19 | 26.4 | 11 | 15.3 | 13 | 18.1 |
| August | 3 | 4.2 | 46 | 63.9 | 18 | 25.0 | 16 | 22.2 |
| September | 5 | 6.9 | 29 | 40.3 | 6 | 8.3 | 39 | 54.2 |
| October | 34 | 47.2 | 7 | 9.7 | 4 | 5.6 | 38 | 52.8 |
| November | 16 | 22.2 | 0 | 0.0 | 7 | 9.7 | 25 | 34.7 |
| December | 0 | 0.0 | 54 | 75.0 | 27 | 37.5 | 2 | 2.8 |
| [56] | [7] | [58] | [57] | [5] | [36] | Present Work | |
|---|---|---|---|---|---|---|---|
| Scale | Monthly | Seasonal | Monthly |
Monthly,
Annual |
Monthly,
Seasonal, Annual |
Seasonal,
Annual |
Monthly,
Seasonal, Annual MW31 |
| Region | Mediterranean Spanish coast | Mediterranean Spanish coast | Spain | Catalonia | Spain | Spain | Catalonia |
| Confidence Label | 95% (+/−) | 95% | 90% (+/−) | 85% (+/−) | 95% (+/−) | 90% (+/−) | 95% (+/−) |
| Annual | 90 (−12.4) | (4.2/26.0) | (0.74/18.00) | (1.2/22.5) | (0.0/87.5) | ||
| Winter | 64 (−7.3) | (0.00/15.00) | (0.6/7.0) | (0.0/62.5) | |||
| Spring | 82 (−19.3) | (0.11/9.60) | (0.8/40.6) | (8.3/38.9) | |||
| Summer | 85 (−22.5) | (0.01/47.71) | (0.4/20.0) | (1.4/88.9) | |||
| Autumn | 61 (−5.2) | (0.89/0.19) | (3.9/1.8) | (26.4/6.9) | |||
| January | (16.3/7.7) | (0.0/6.1) | (1.0/1.0) | (0.0/1.0) | (16.7/5.5) | ||
| February | (18.7/36.1) | (2.4/1.9) | (0.0/30.2) | (0.0/1.0) | (0.0/65.3) | ||
| March | (2.8/72.4) | (0.0/68.9) | (0.0/32.3) | (0.0/27.5) | (0.0/56.9) | ||
| April | (24.8/20.5) | (5.0/3.6) | (19.8/1.0) | (7.5/2.0) | (33.3/2.8) | ||
| May | (12.2/6.2) | (0.0/0.6) | (3.1/8.3) | (0.5/1.0) | (0.0/37.5) | ||
| June | (4.4/42.6) | (0.1/31.8) | (0.0/52.1) | (0.0/65.0) | (0.0/77.7) | ||
| July | (20.8/25.2) | (6.1/6.2) | (5.2/18.8) | (0.0/12.0) | (8.3/26.4) | ||
| August | (19.3/9.0) | (1.6/5.1) | (0.0/15.6) | (1.0/2.5) | (4.2/63.9) | ||
| September | (13.7/19.6) | (1.3/0.3) | (3.1/7.3) | (7.5/4.0) | (6.9/40.3) | ||
| October | (3.0/34.3) | (33.7/1.4) | (1.0/5.2) | (1.5/2.5) | (47.2/9.7) | ||
| November | (5.1/6.2) | (3.3/0.0) | (7.3/1.0) | (0.5/1.0) | (22.2/0.0) | ||
| December | (2.9/18.6) | (0.0/0.8) | (2.1/31) | (0.0/4.0) | (0.0/75.0) |
Disclaimer/Publisher’s Note: The statements, opinions and data contained in all publications are solely those of the individual author(s) and contributor(s) and not of MDPI and/or the editor(s). MDPI and/or the editor(s) disclaim responsibility for any injury to people or property resulting from any ideas, methods, instructions or products referred to in the content. |
© 2025 by the authors. Licensee MDPI, Basel, Switzerland. This article is an open access article distributed under the terms and conditions of the Creative Commons Attribution (CC BY) license (https://creativecommons.org/licenses/by/4.0/).
Share and Cite
Serra, C.; Casas-Castillo, M.d.C.; Rodríguez-Solà, R.; Periago, C. Evolution of Rainfall Characteristics in Catalonia, Spain, Using a Moving-Window Approach (1950–2022). Hydrology 2025, 12, 194. https://doi.org/10.3390/hydrology12070194
Serra C, Casas-Castillo MdC, Rodríguez-Solà R, Periago C. Evolution of Rainfall Characteristics in Catalonia, Spain, Using a Moving-Window Approach (1950–2022). Hydrology. 2025; 12(7):194. https://doi.org/10.3390/hydrology12070194
Chicago/Turabian StyleSerra, Carina, María del Carmen Casas-Castillo, Raül Rodríguez-Solà, and Cristina Periago. 2025. "Evolution of Rainfall Characteristics in Catalonia, Spain, Using a Moving-Window Approach (1950–2022)" Hydrology 12, no. 7: 194. https://doi.org/10.3390/hydrology12070194
APA StyleSerra, C., Casas-Castillo, M. d. C., Rodríguez-Solà, R., & Periago, C. (2025). Evolution of Rainfall Characteristics in Catalonia, Spain, Using a Moving-Window Approach (1950–2022). Hydrology, 12(7), 194. https://doi.org/10.3390/hydrology12070194