
Integrating the PLUS-InVEST Model to Project Water Conservation Dynamics and Decipher Climatic Drivers in the Chengdu–Chongqing Economic Zone Under Multiple Future Scenarios

 ,
,  ,
, 
 ,
,
Abstract
1. Introduction
2. Materials and Methods
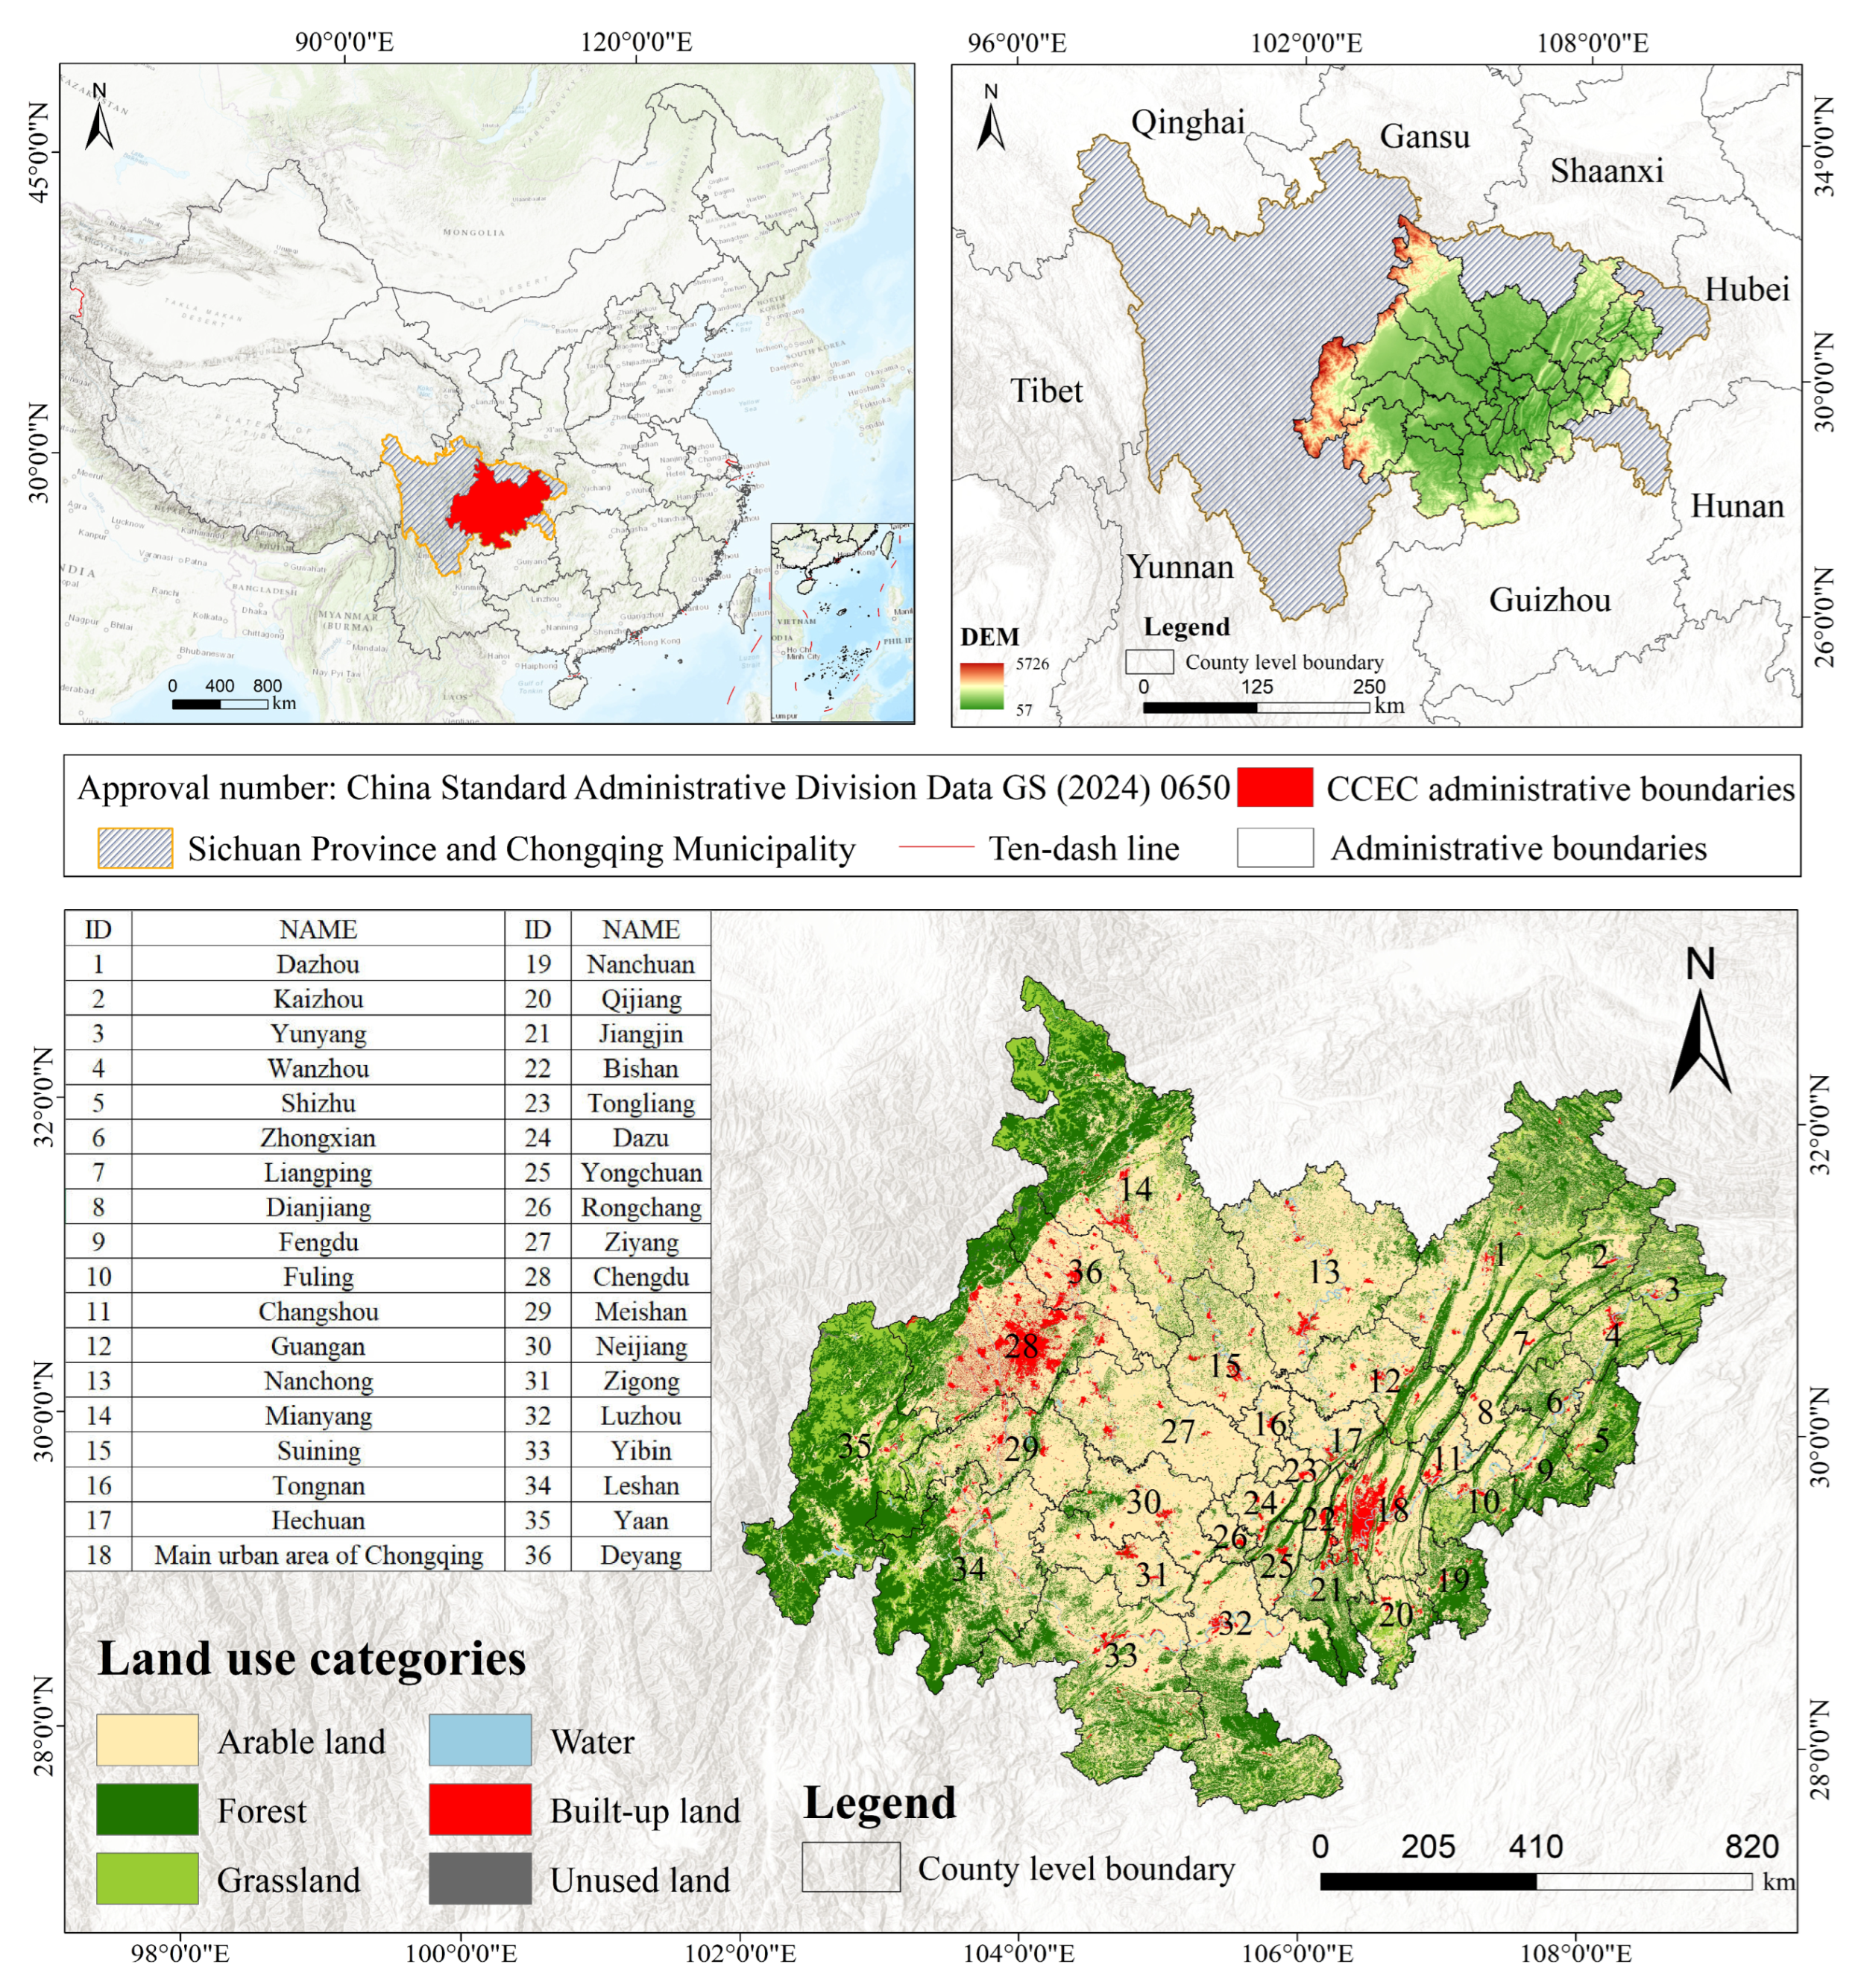
2.1. Study Area
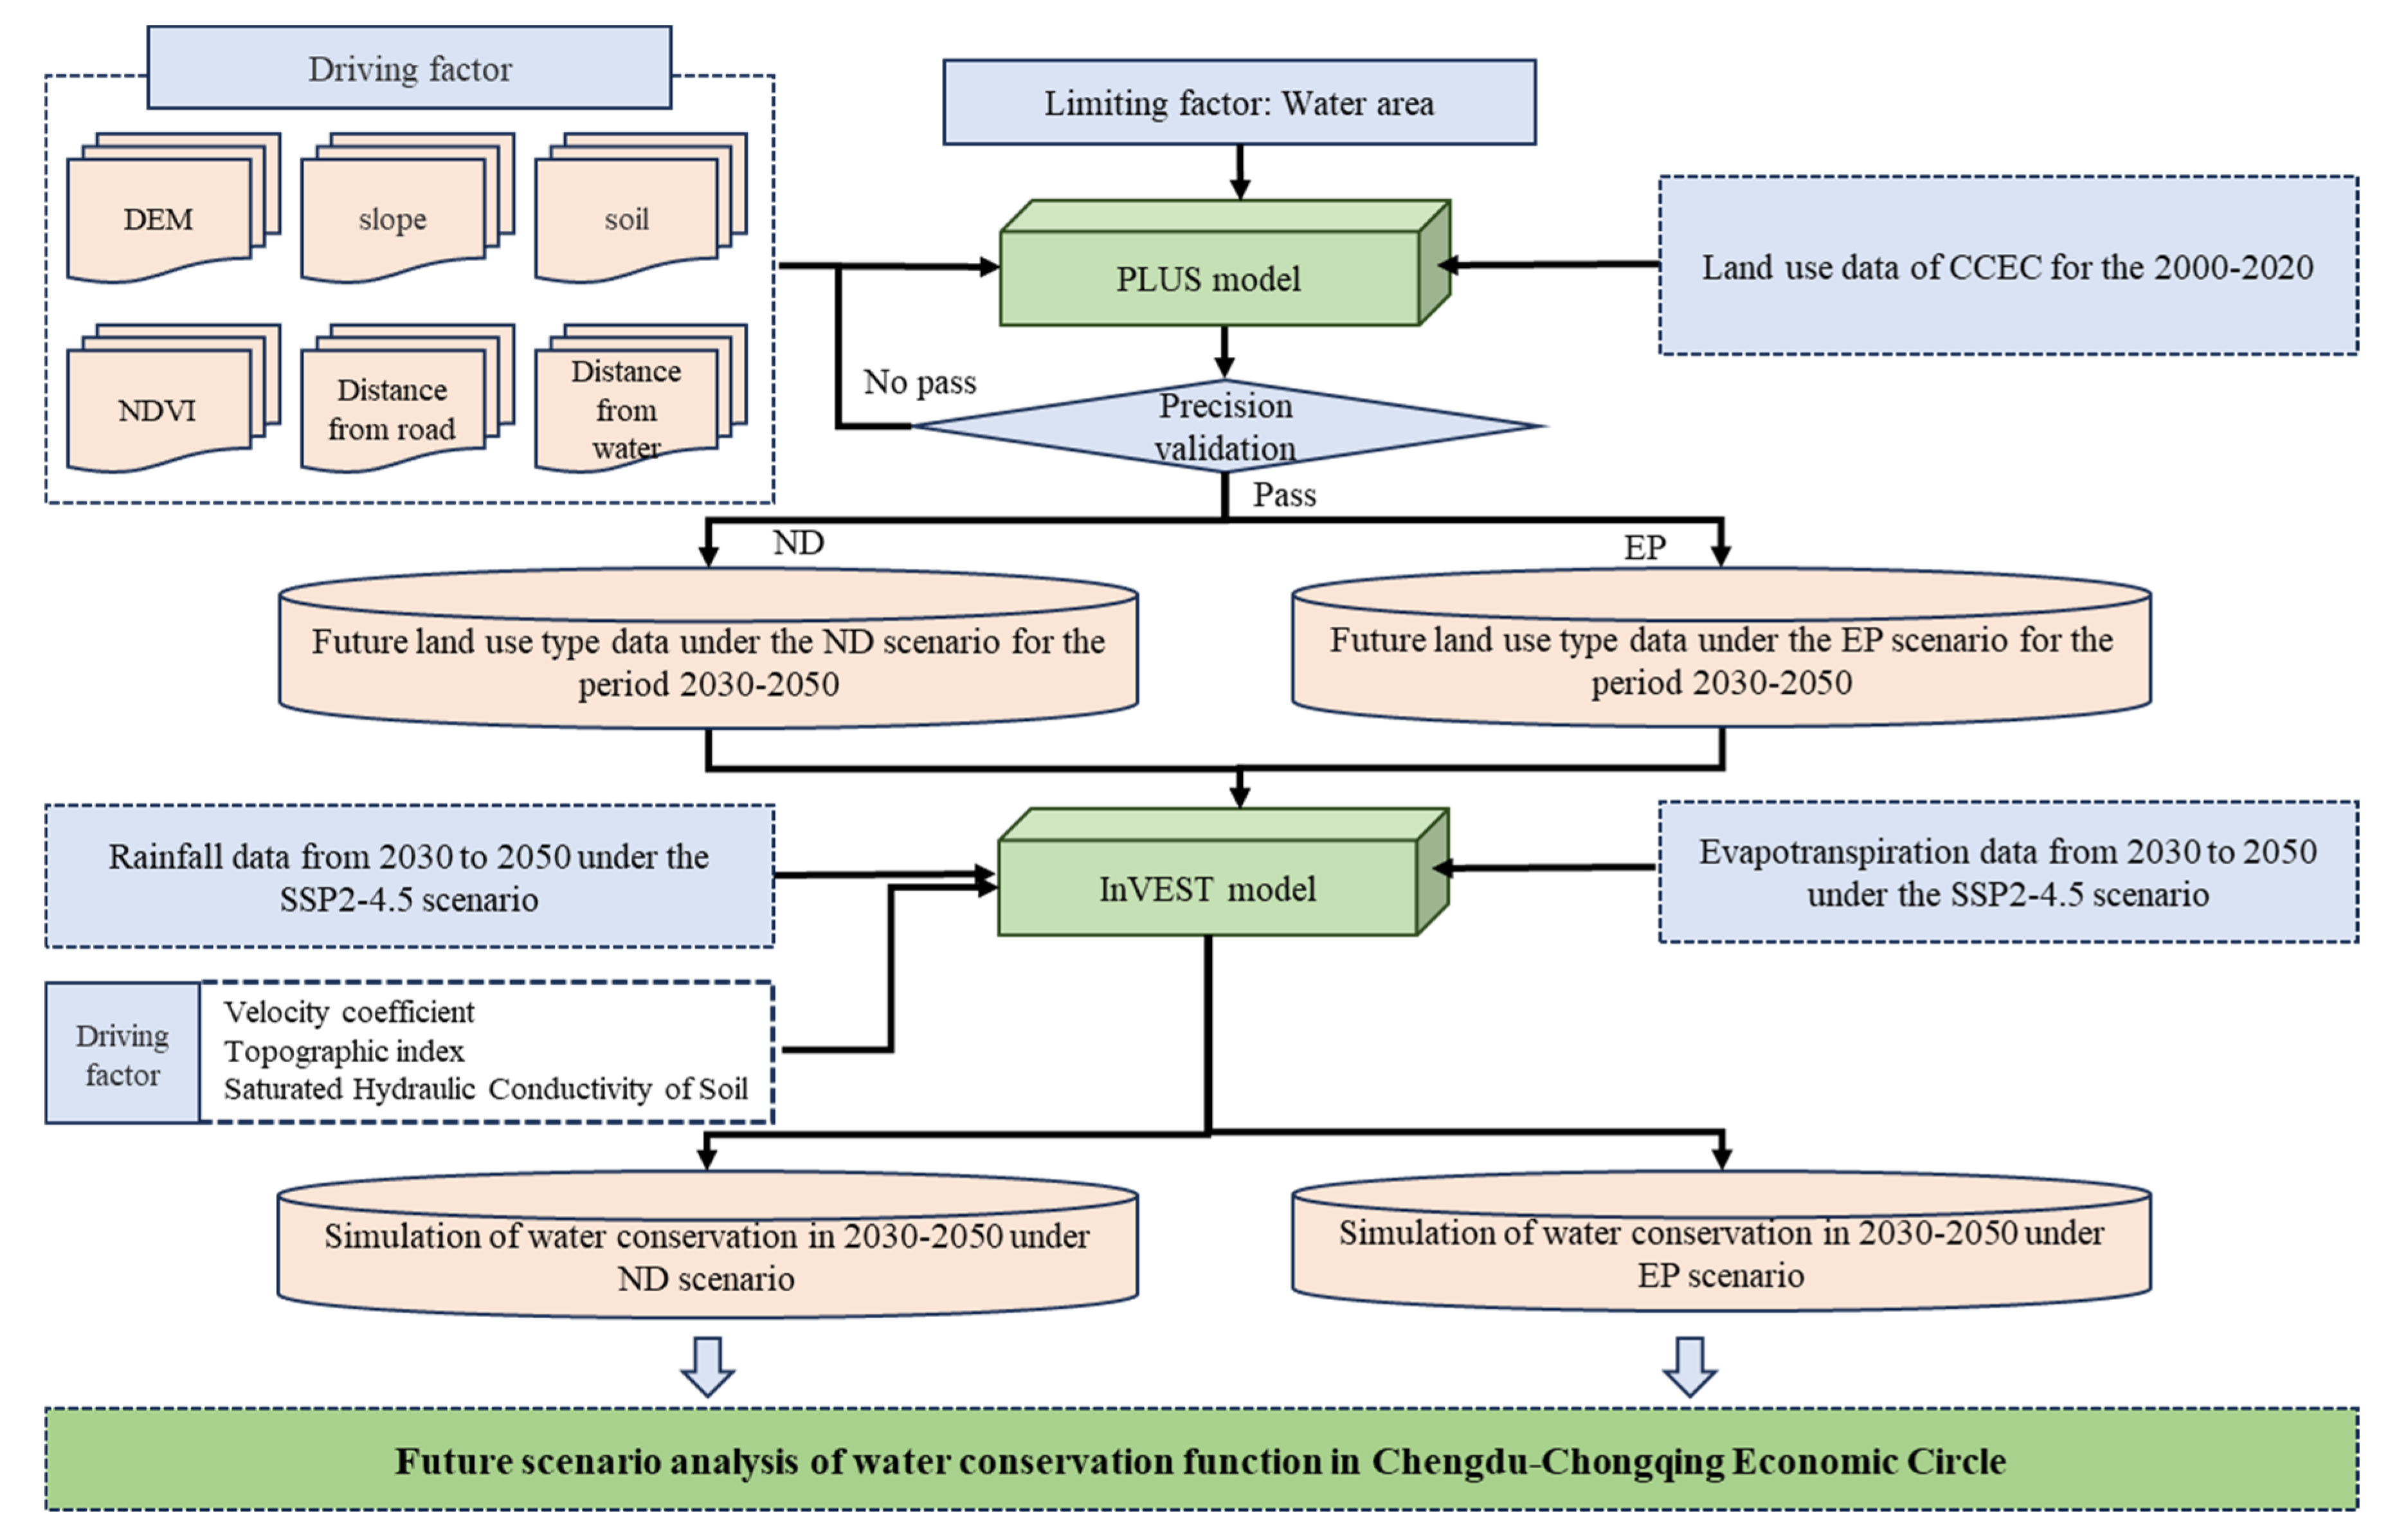
2.2. Methodology
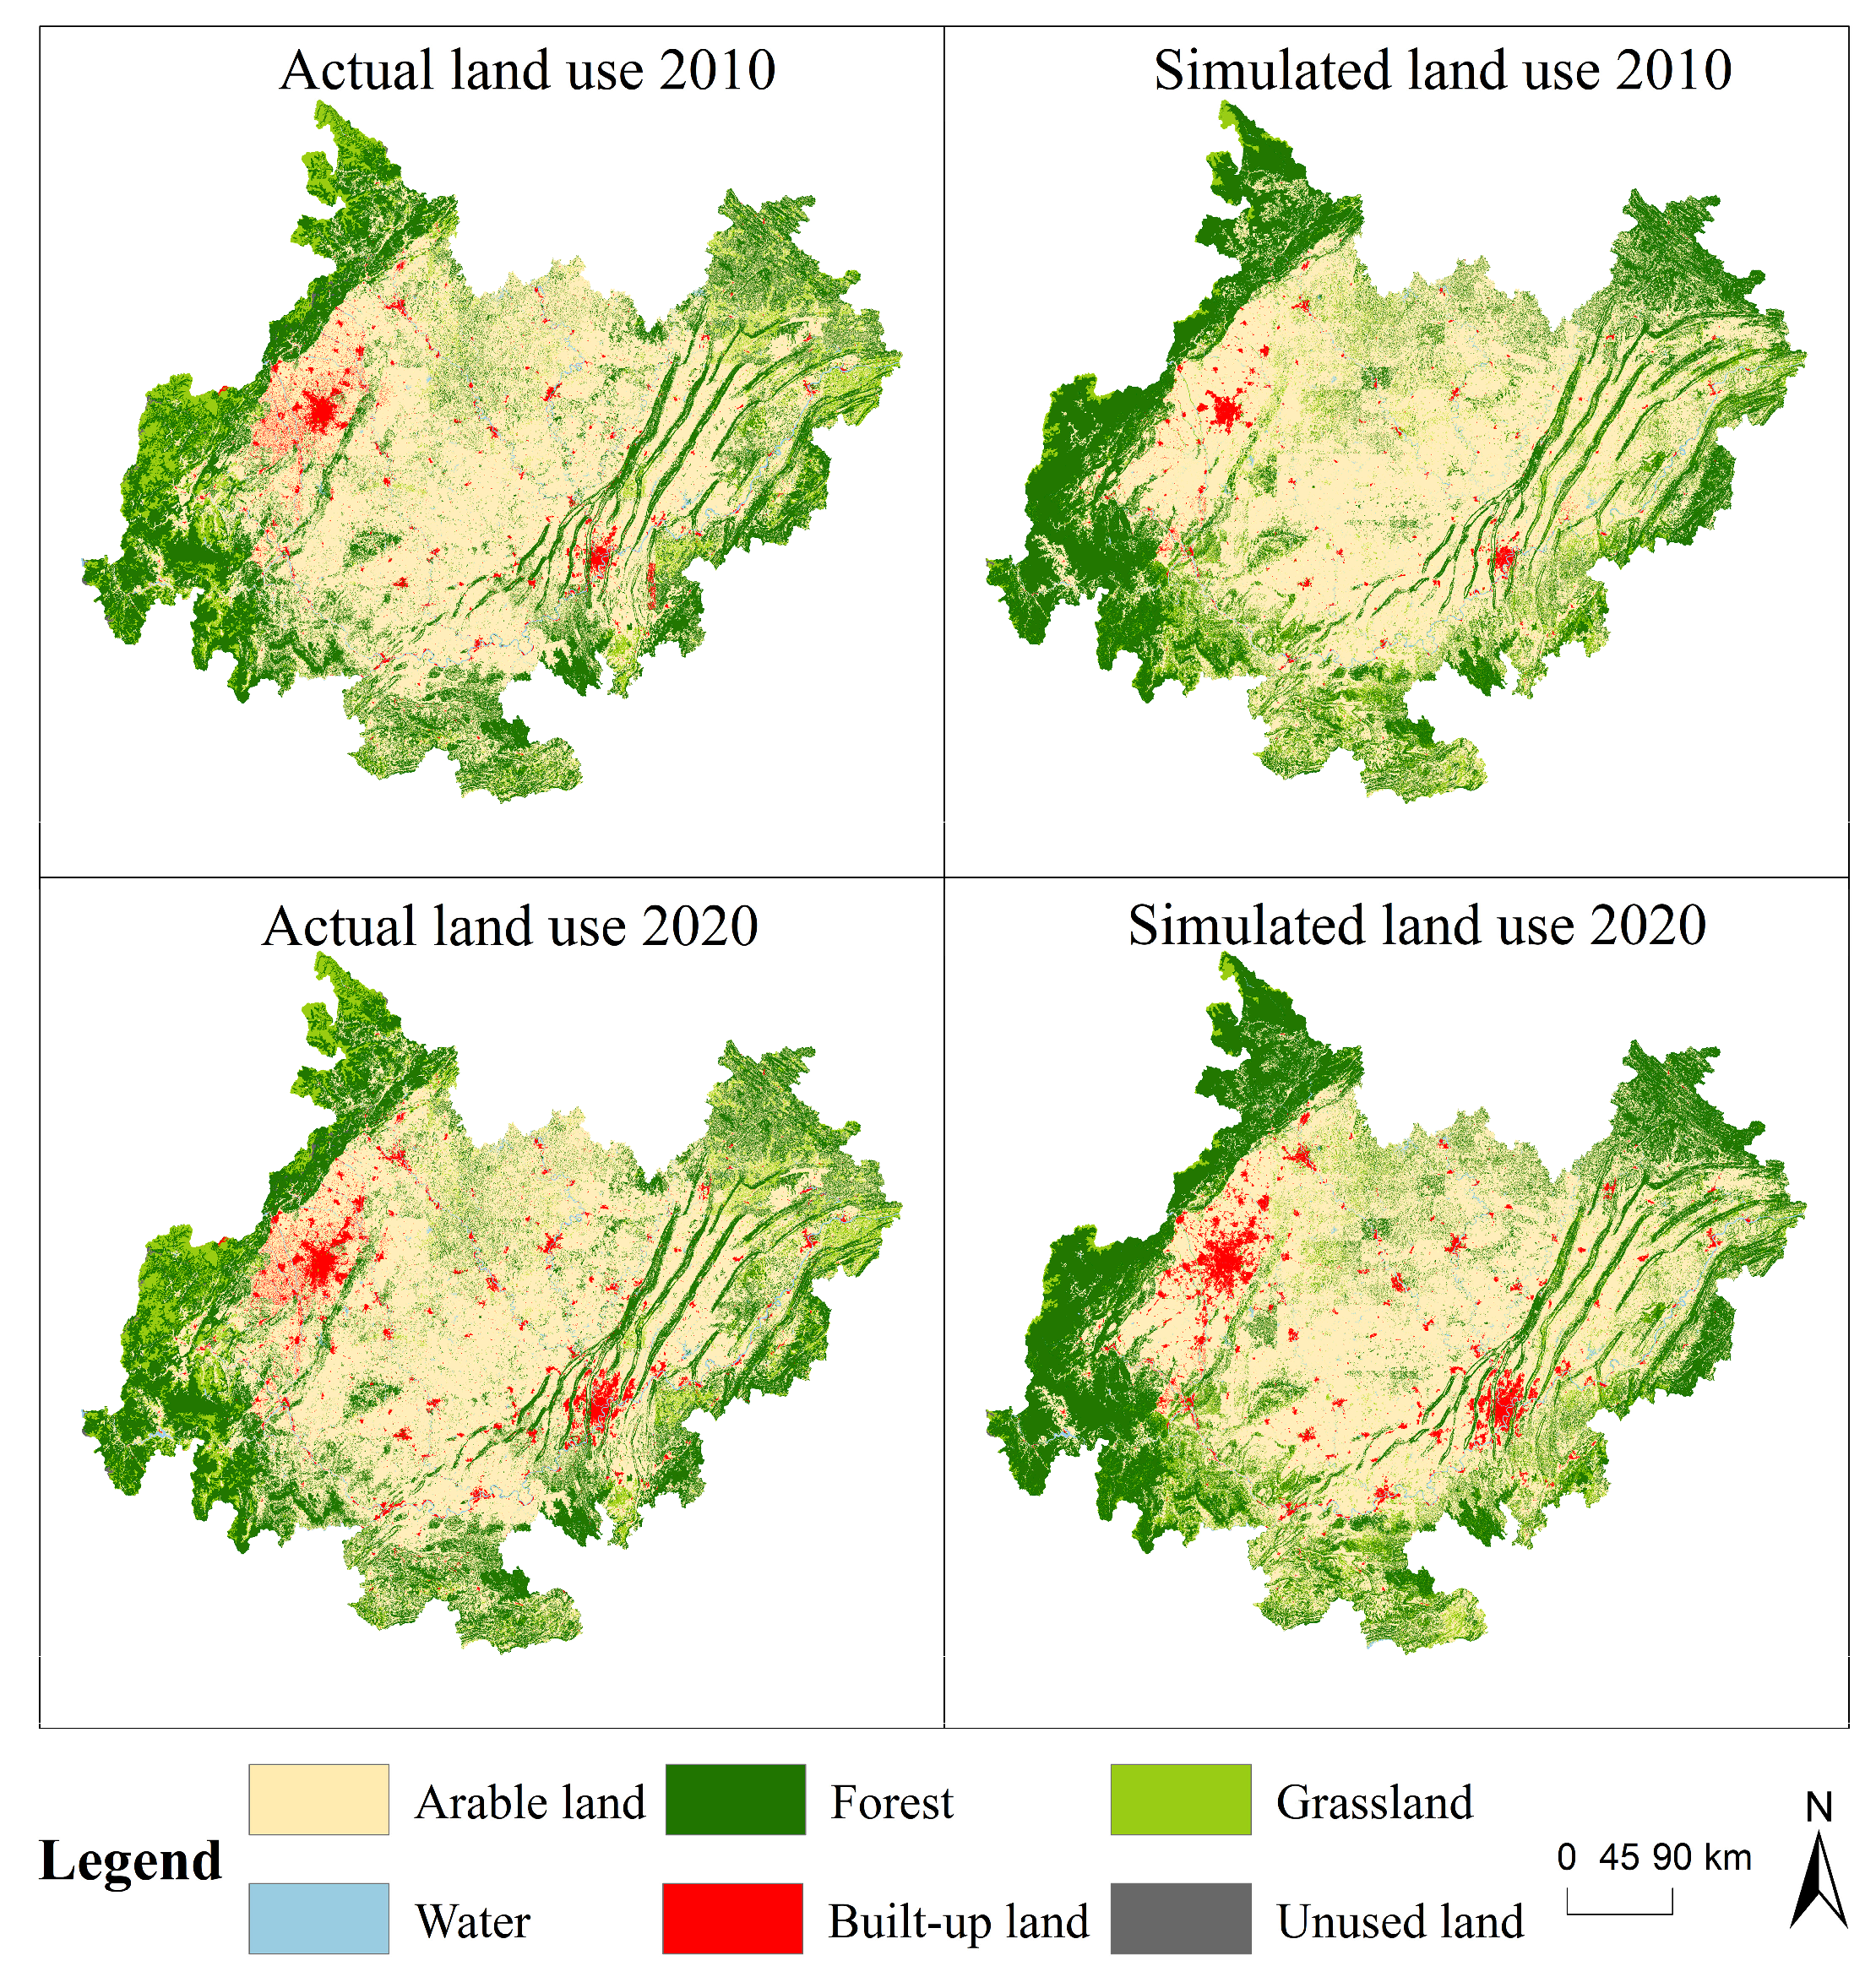
2.2.1. PLUS Model
- Phase 1: Calibration and Validation
- Phase 2: Predictive Simulation
2.2.2. InVEST Model
- (1)
- Water Yield Calculation Module
- (2)
- Water Conservation Capacity Calculation Module
2.2.3. Spatial Autocorrelation
2.2.4. Hot Spot Analysis
2.3. Data Sources
3. Results and Analysis
3.1. Analysis of Land Use Evolution Trends in the Chengdu–Chongqing Economic Zone
3.1.1. Evolution of Land Use Status
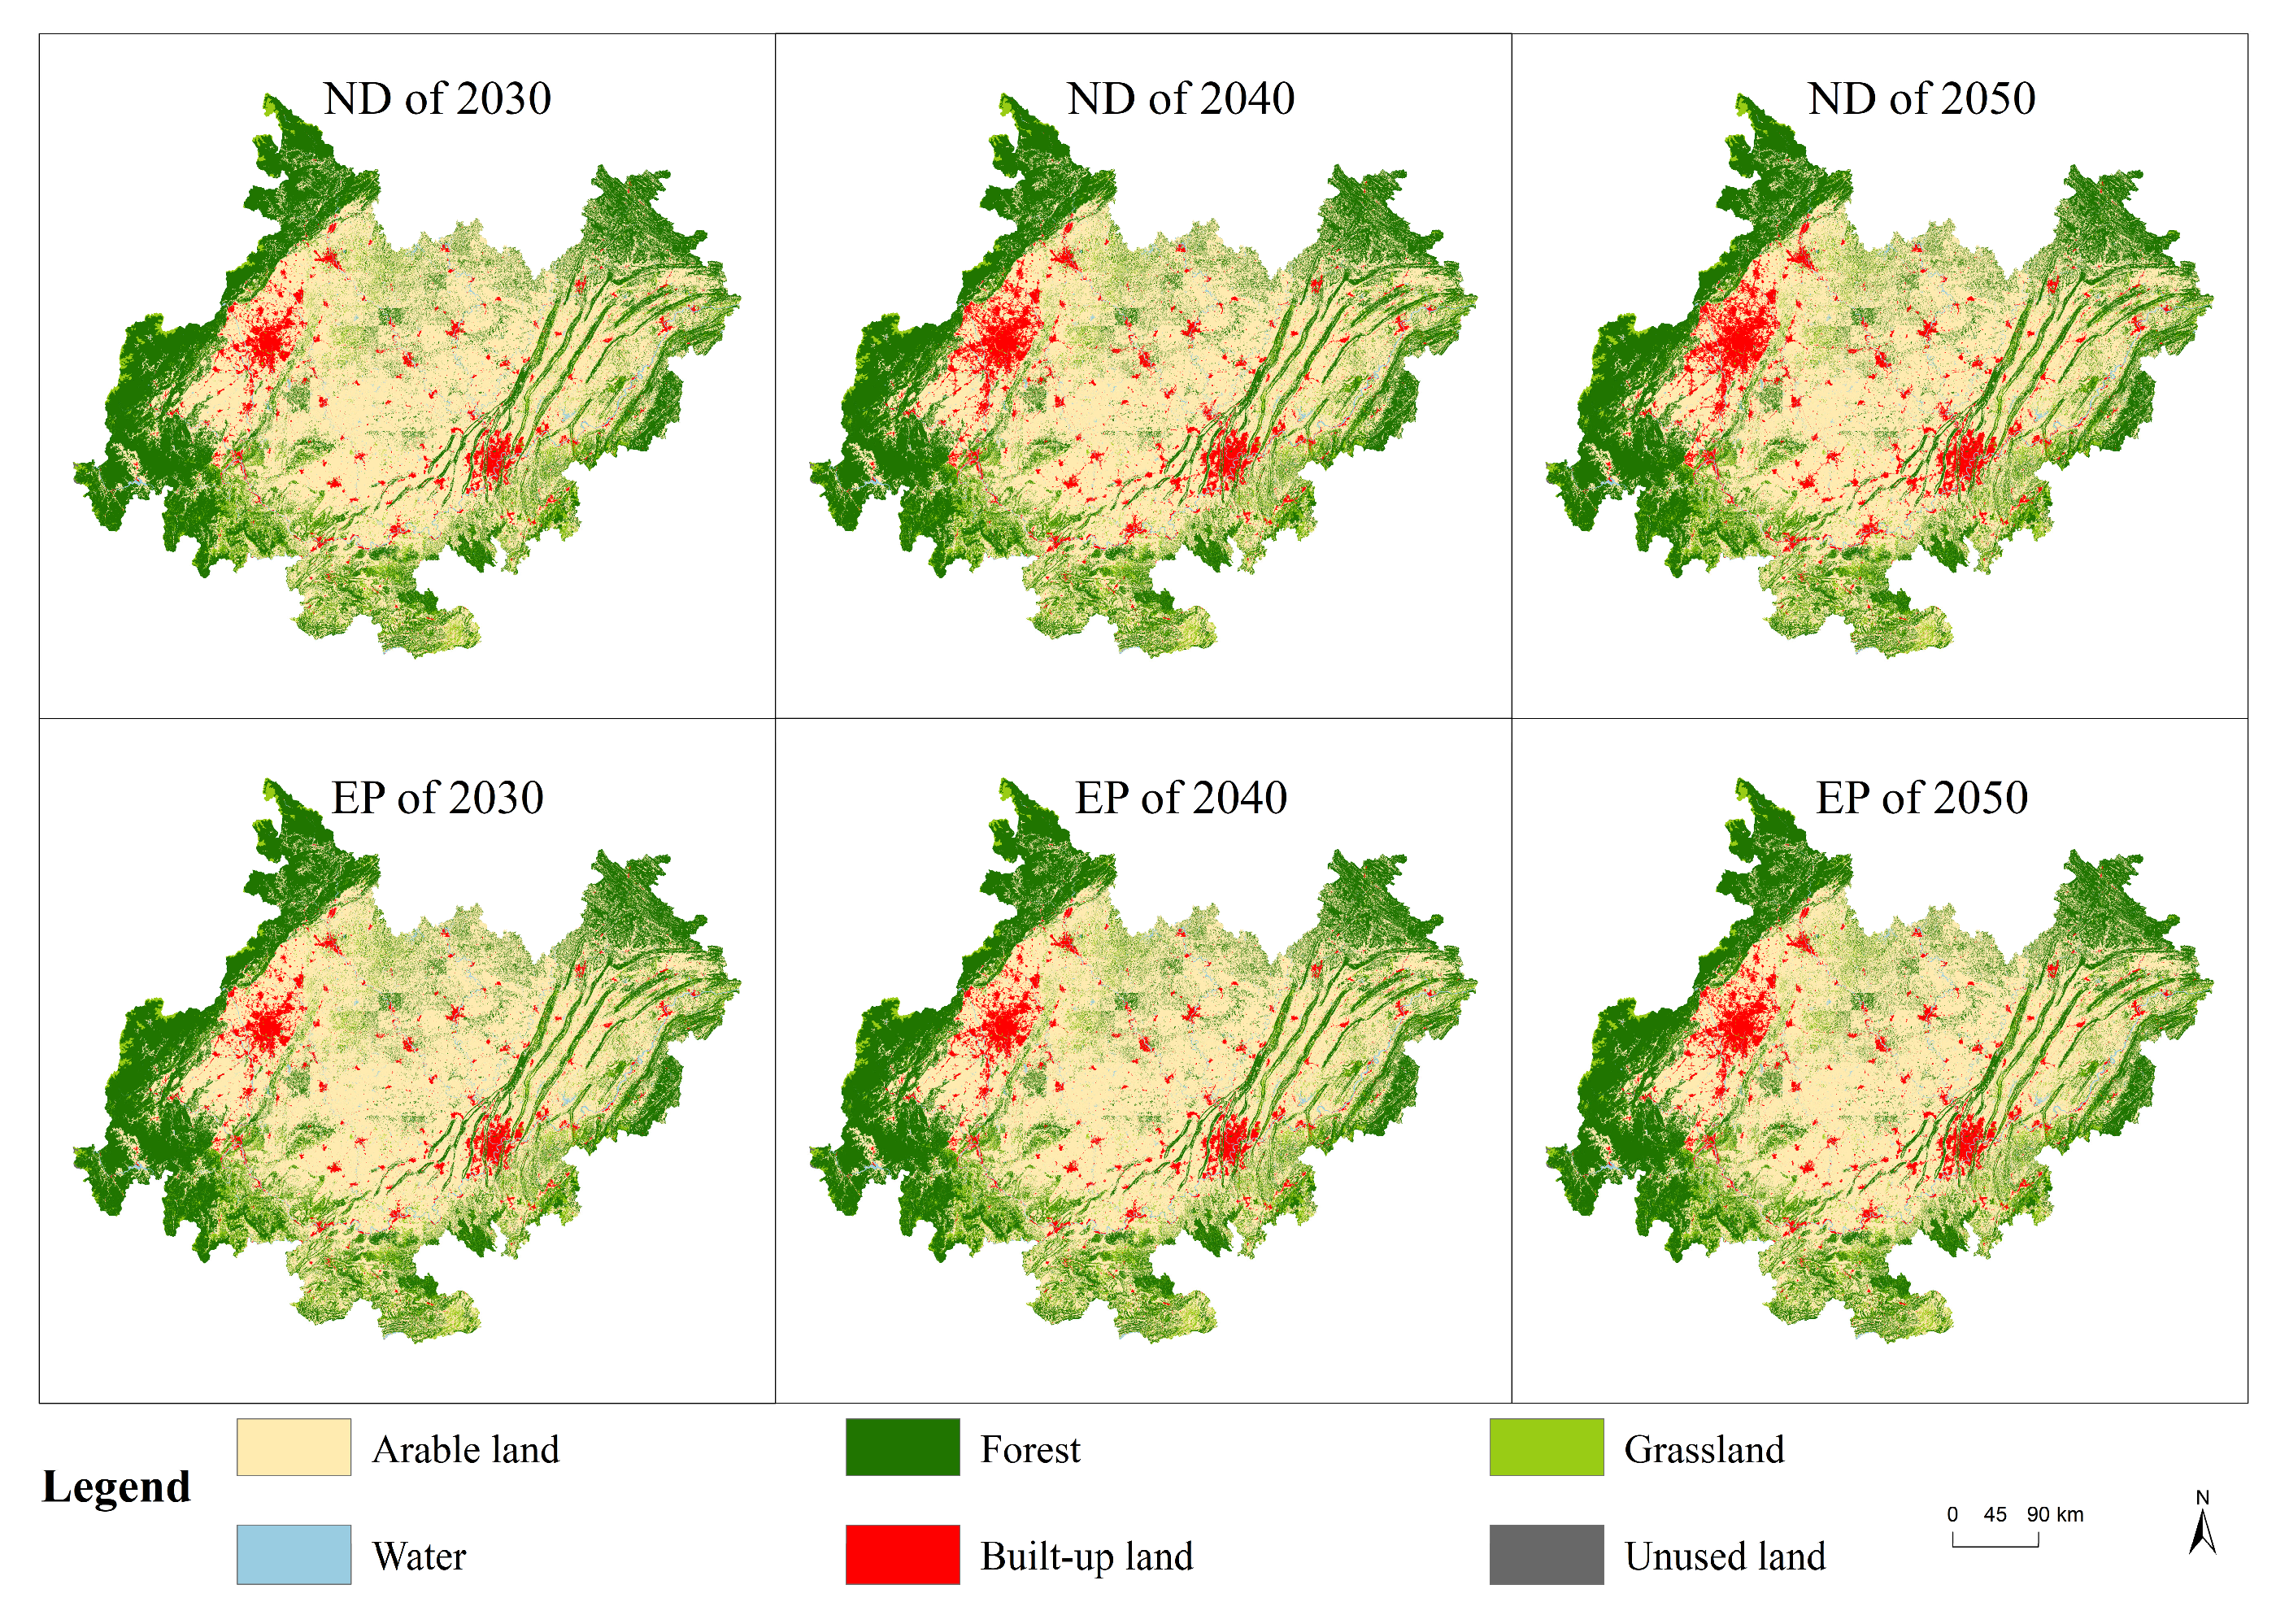
3.1.2. Land Use Evolution Trends Under Future Scenarios
3.2. Analysis of Water Conservation Function Evolution Trends
3.2.1. Evolution of Water Conservation Function
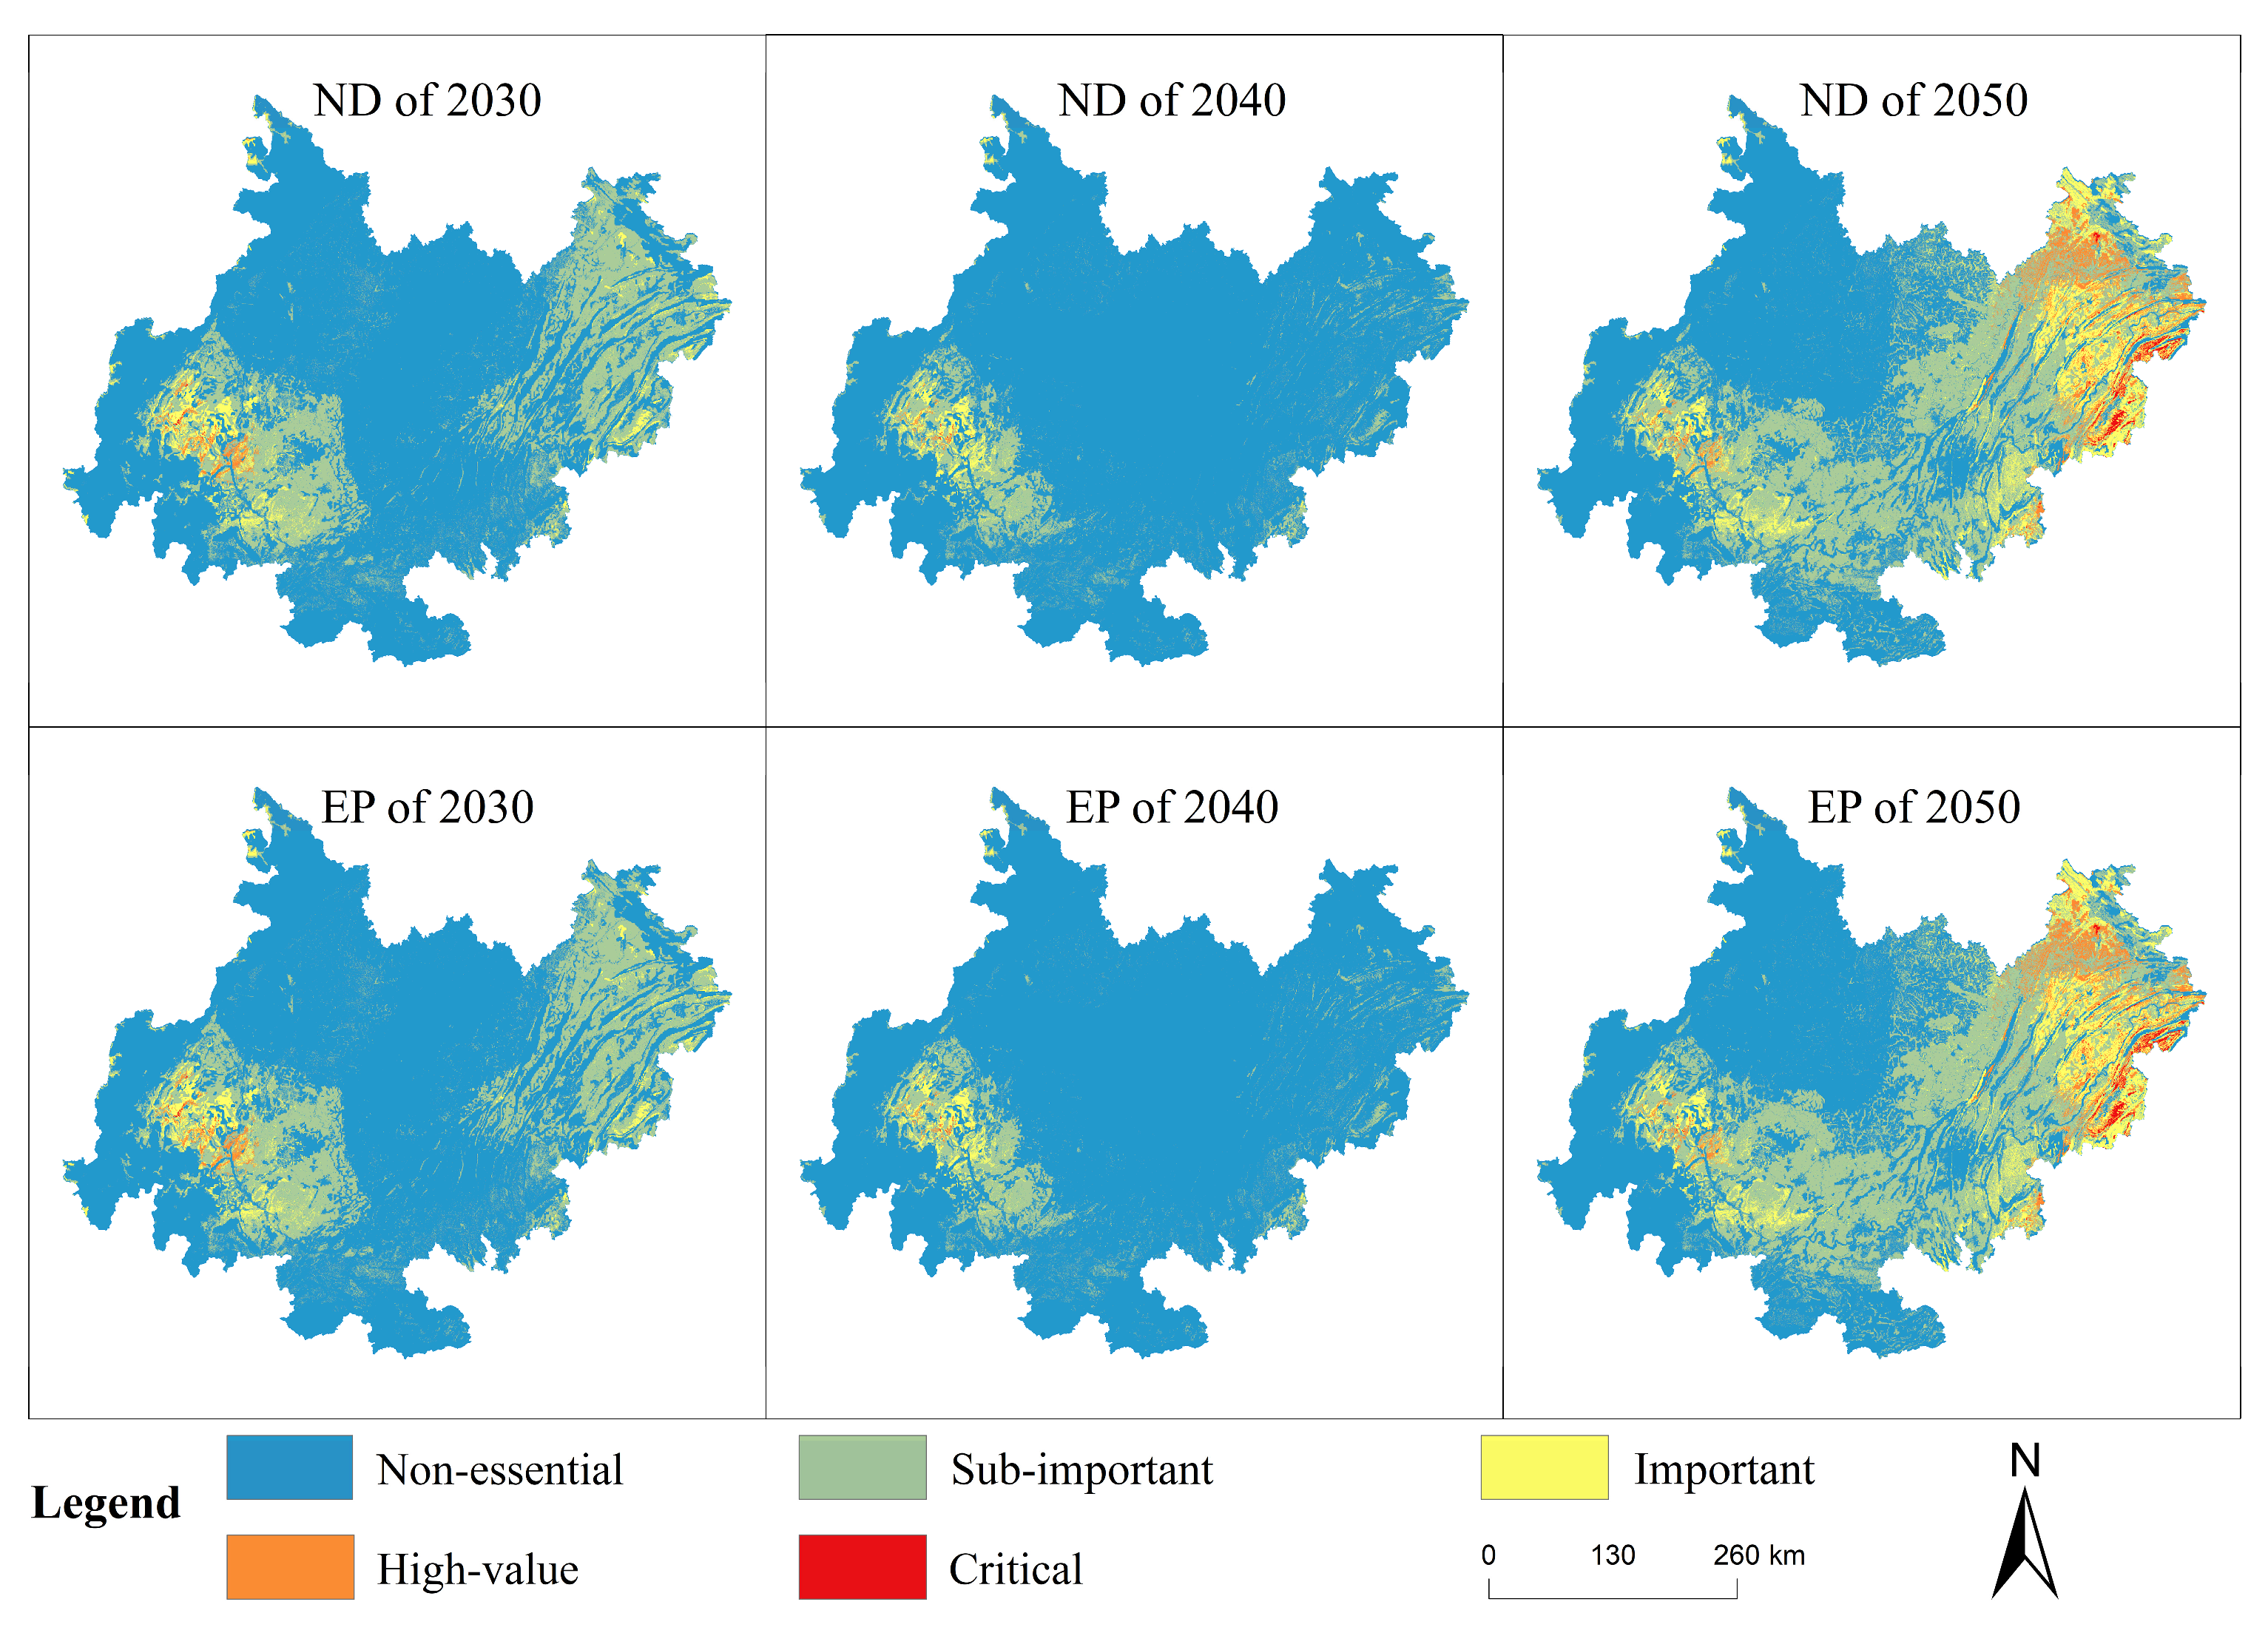
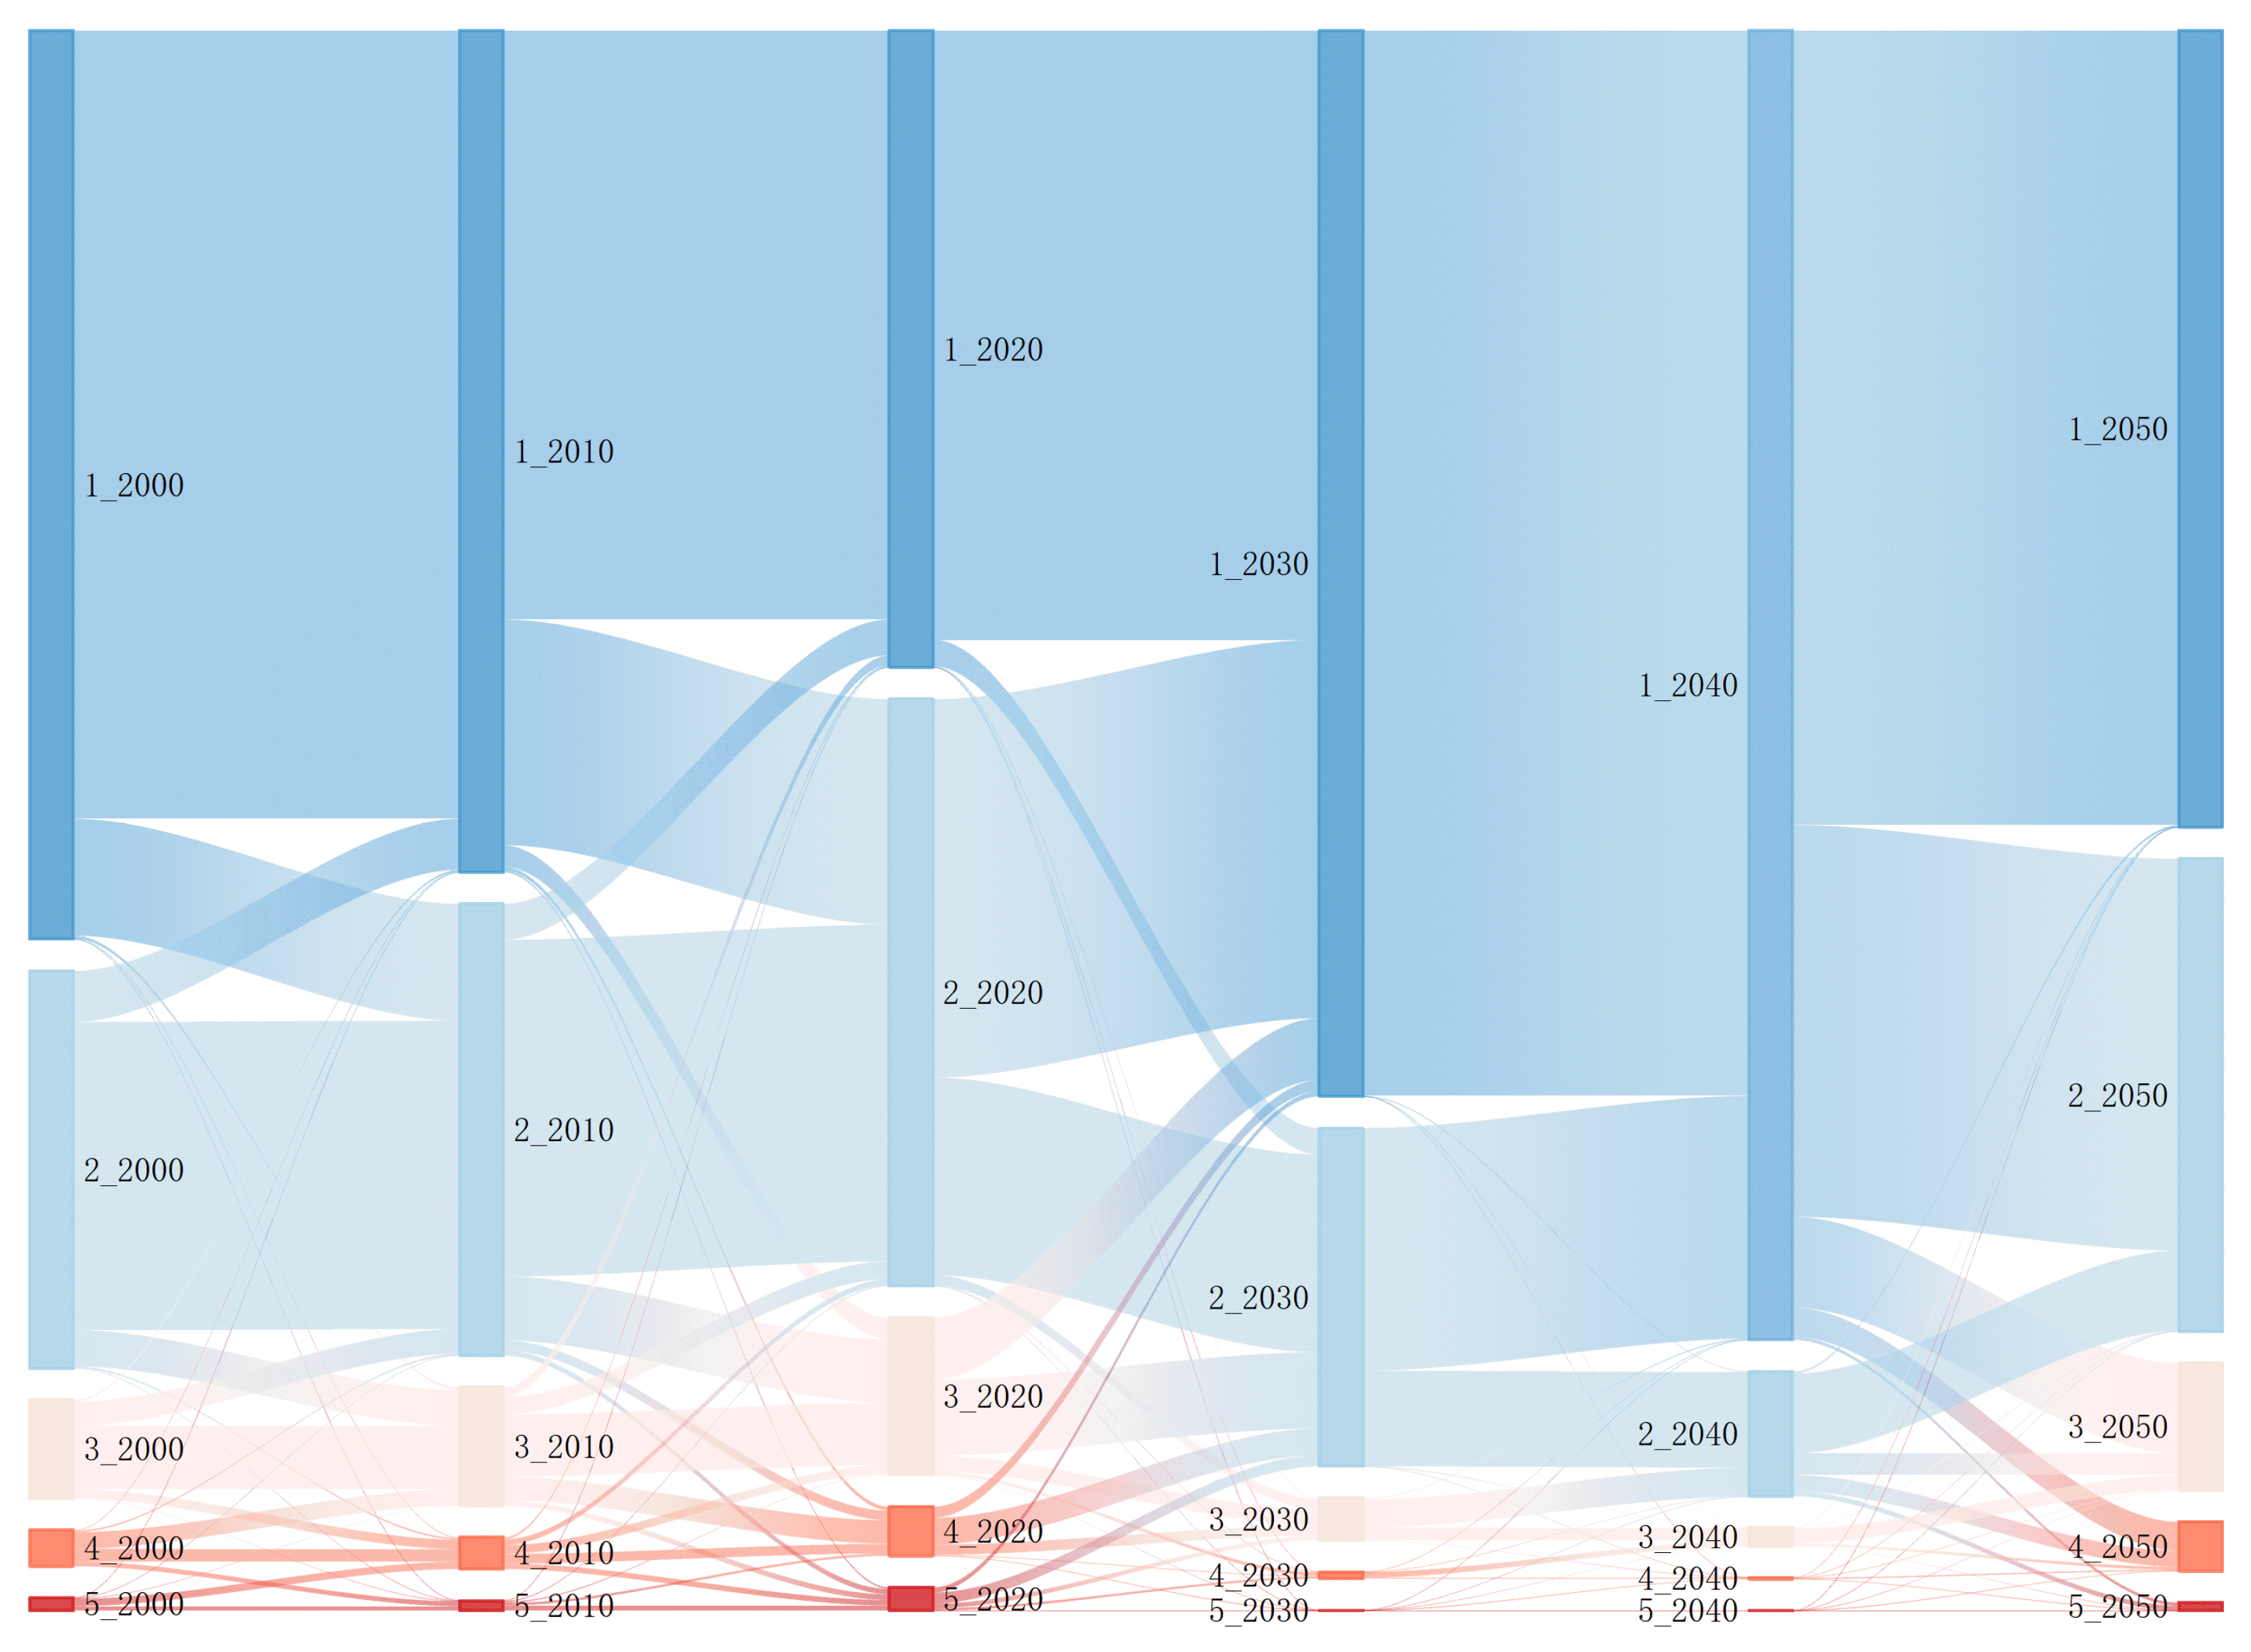
3.2.2. Water Conservation Function Levels Evolution Trends Under Future Scenarios
3.3. Analysis of Spatial Aggregation Characteristics of Water Conservation Function
3.3.1. Spatial Autocorrelation Analysis of Water Conservation Function in the Chengdu–Chongqing Economic Zone
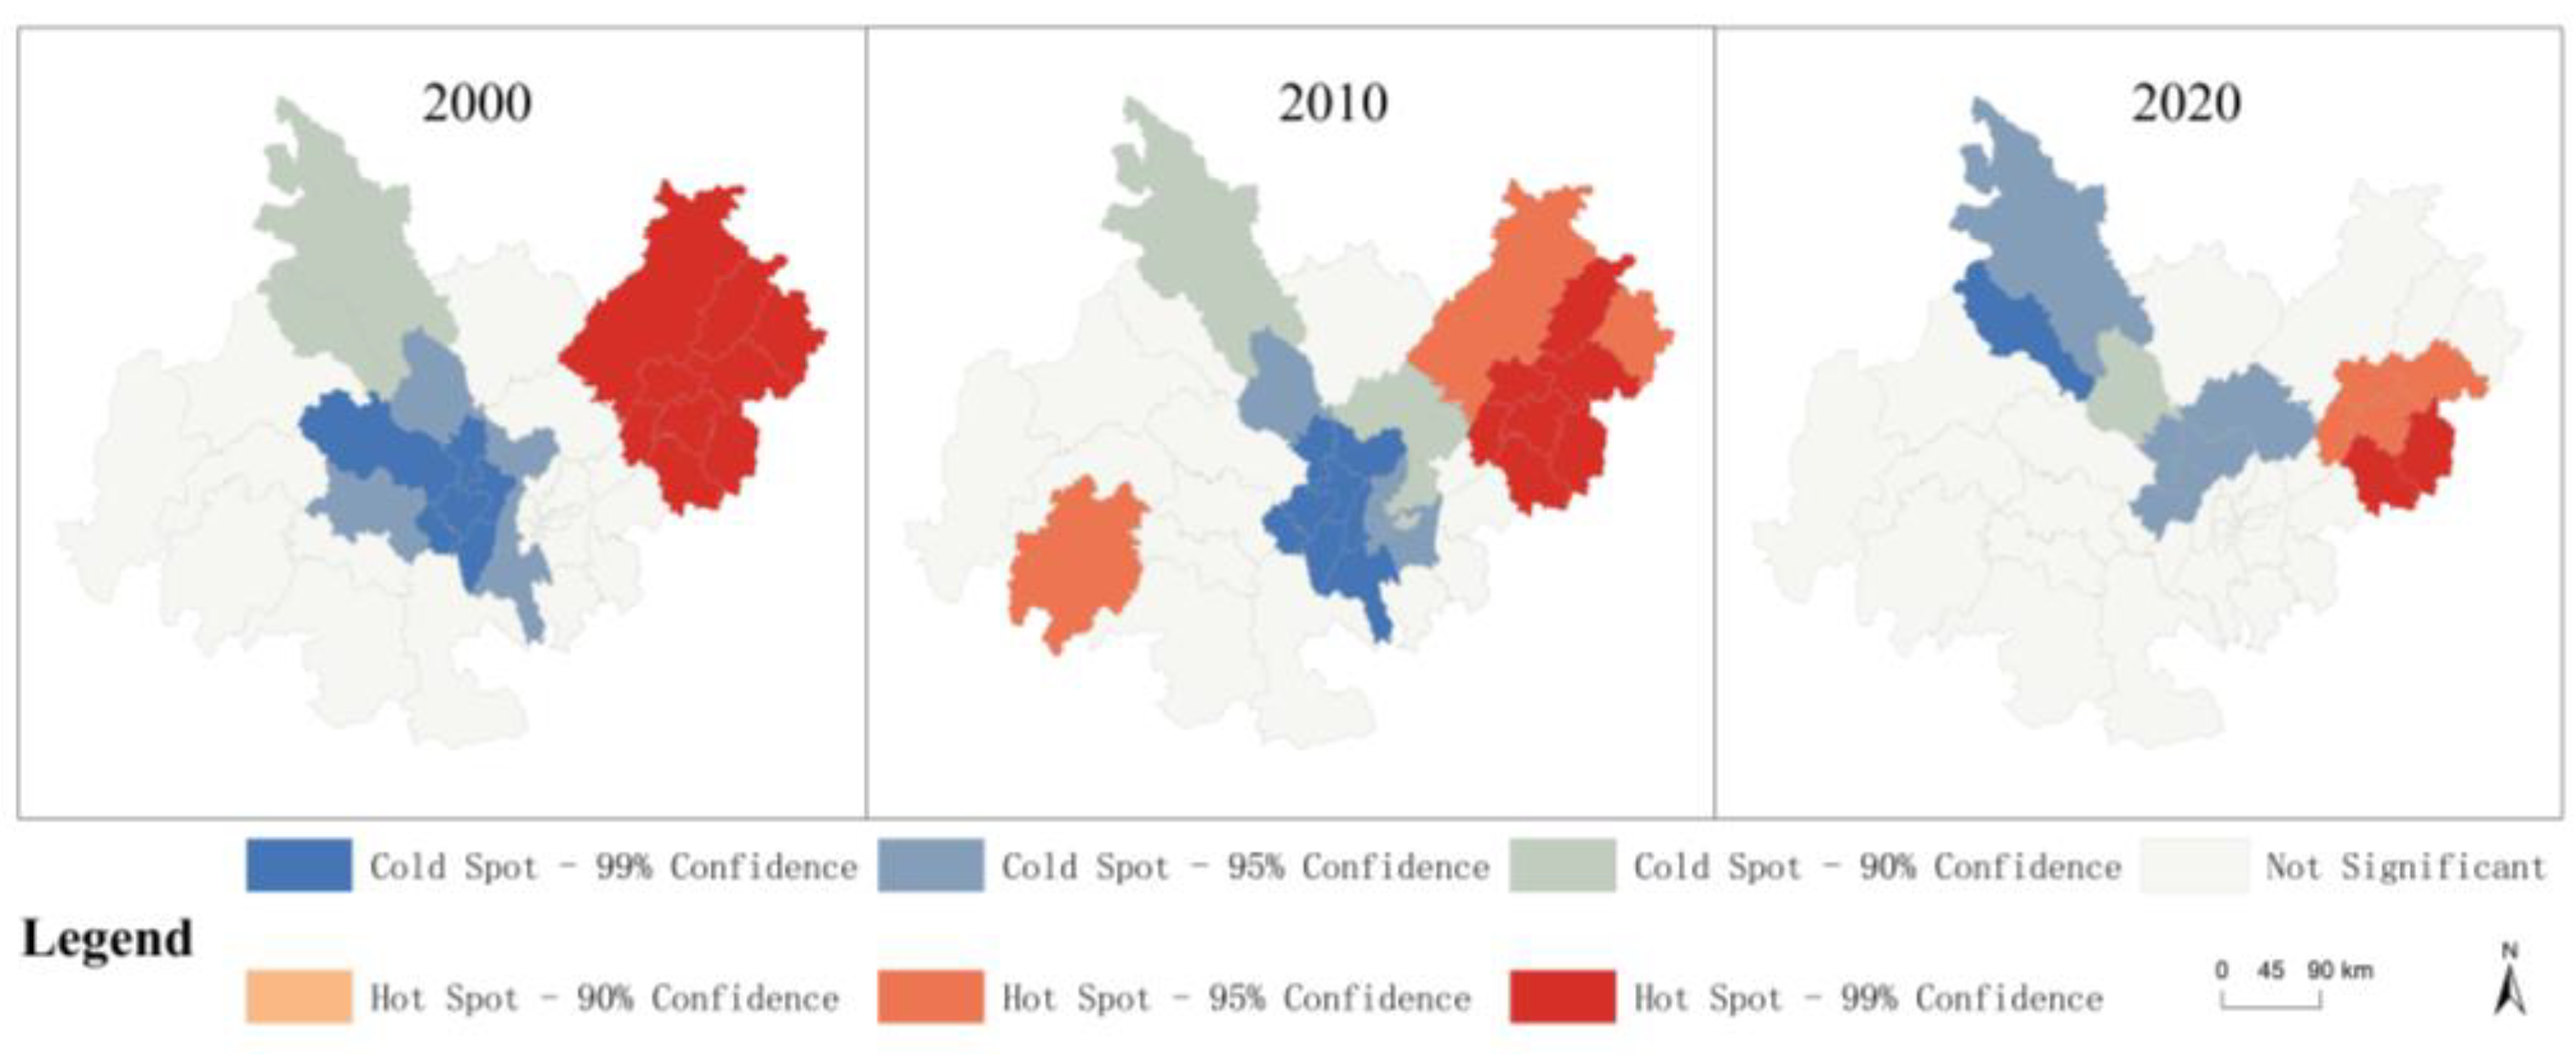
3.3.2. Current Spatial Aggregation Characteristics of Water Conservation Function in the Chengdu–Chongqing Economic Zone
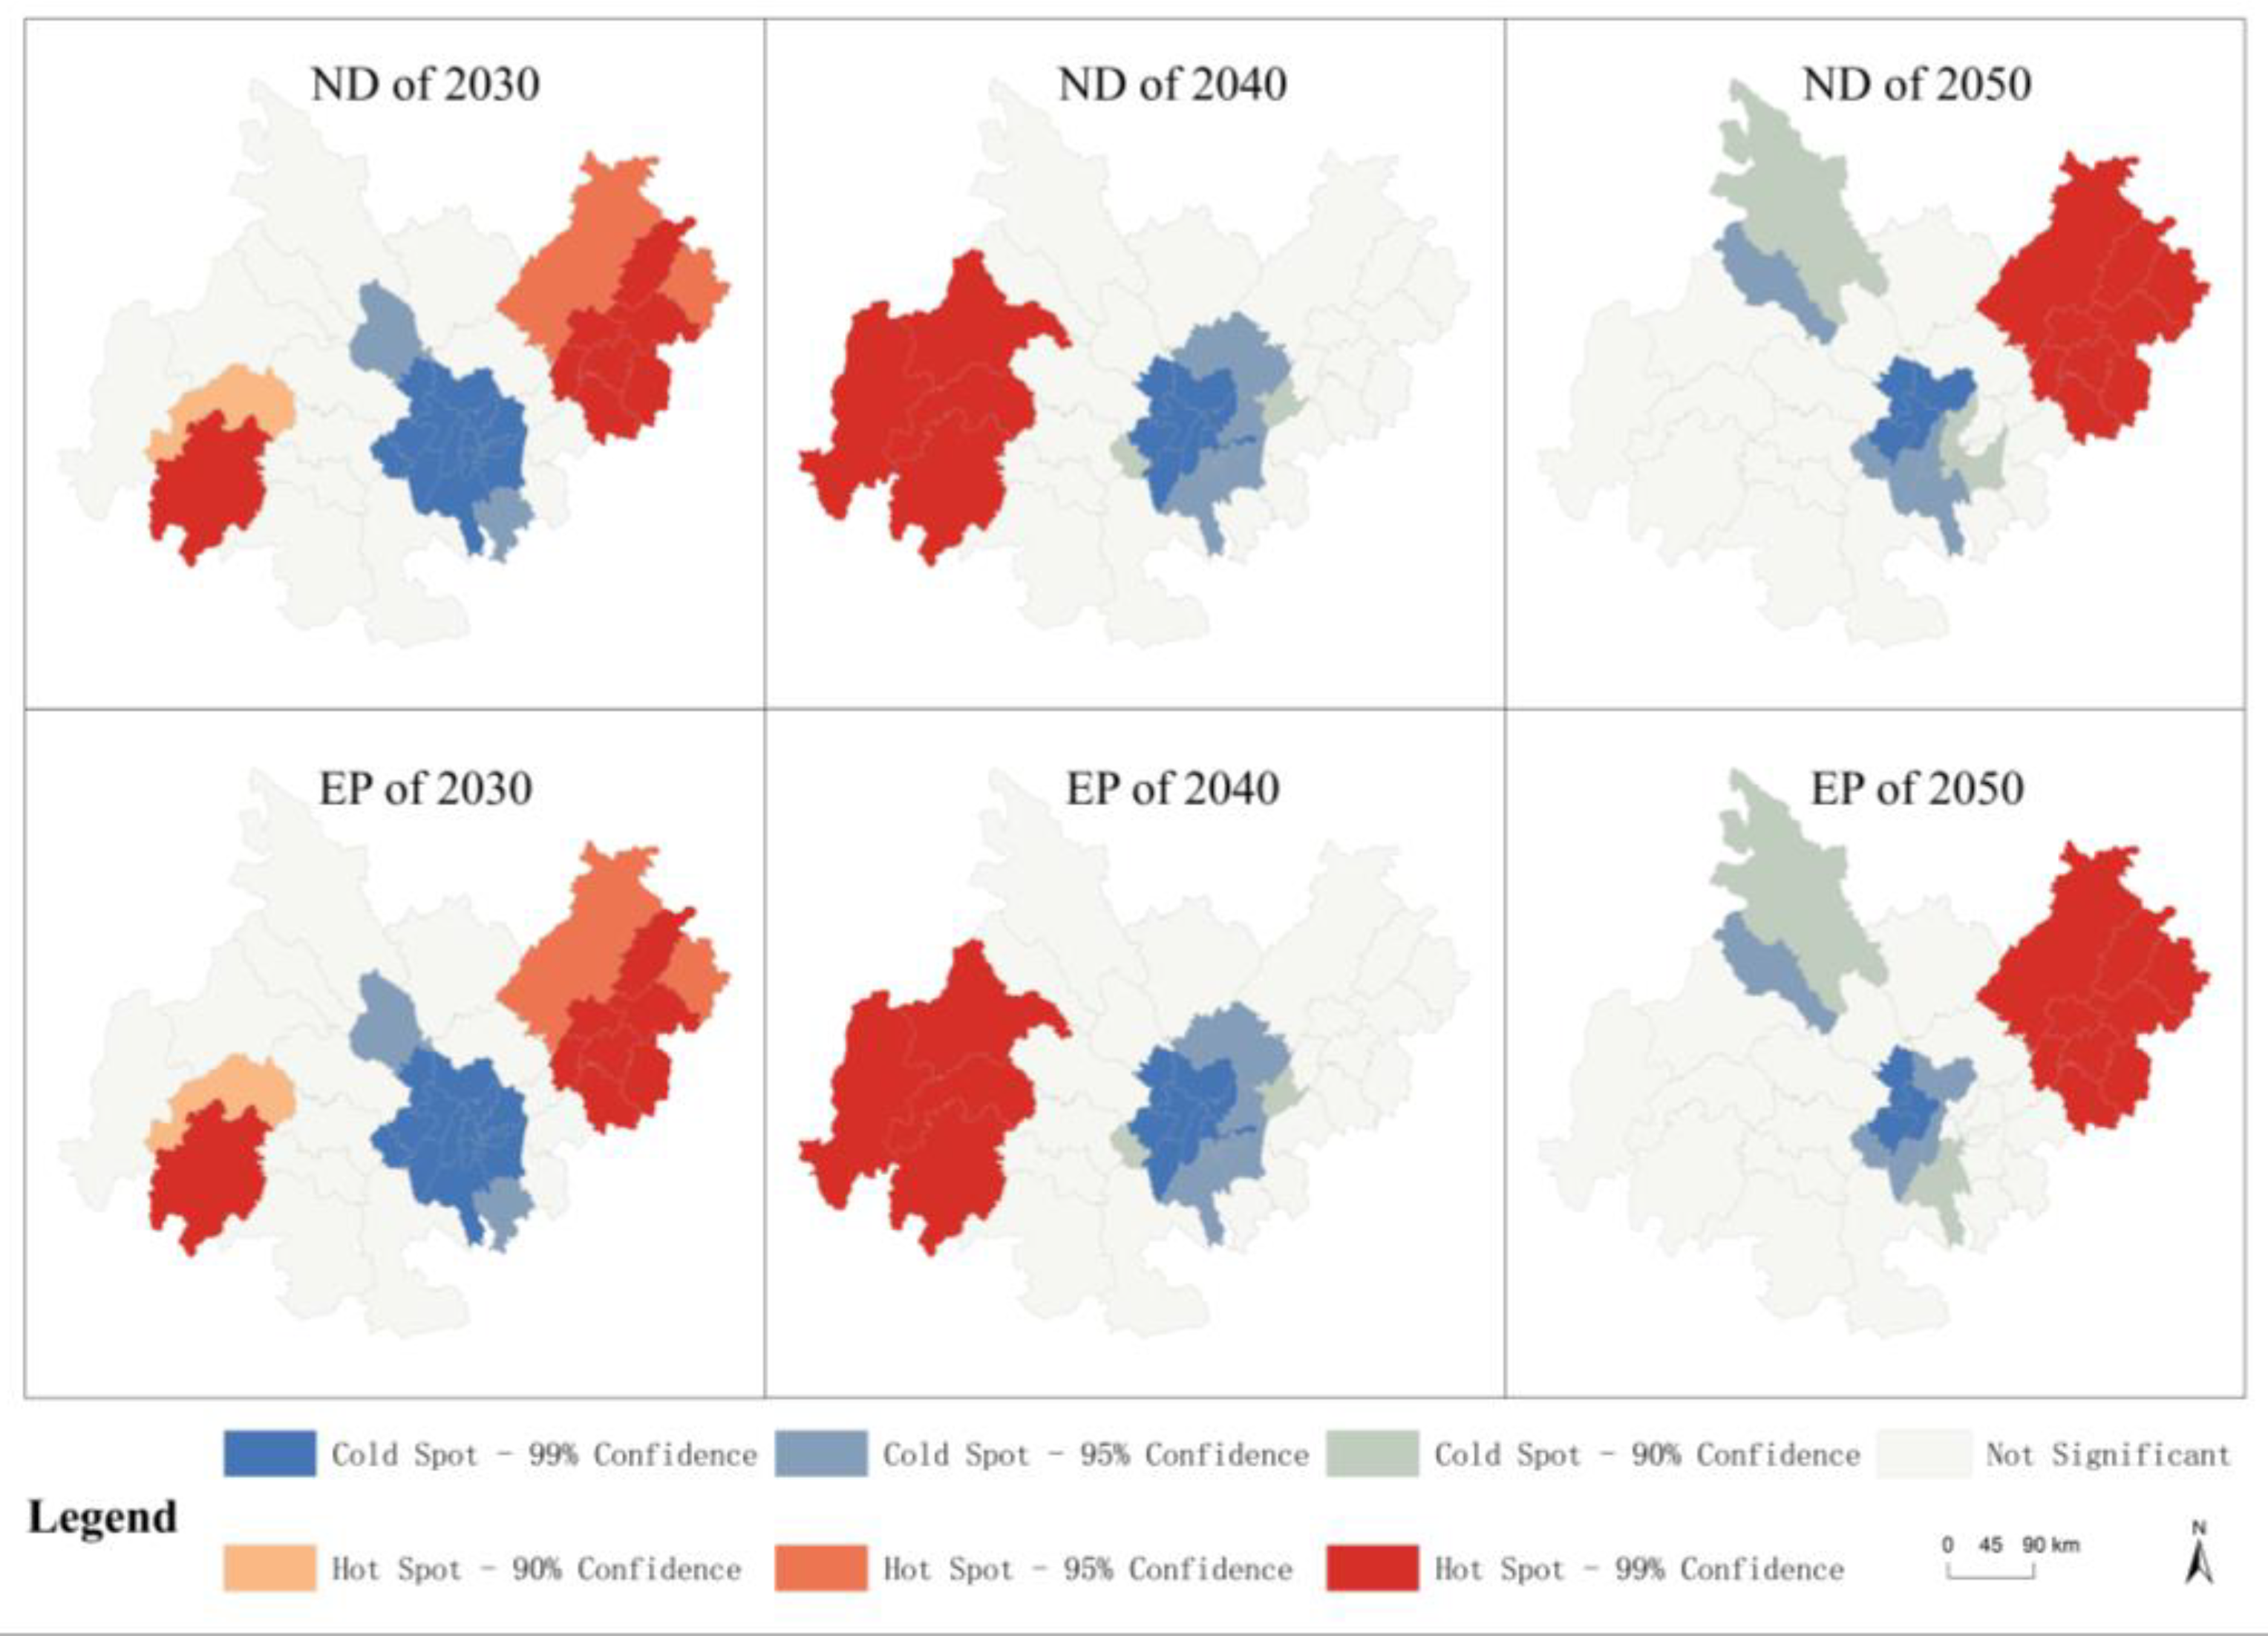
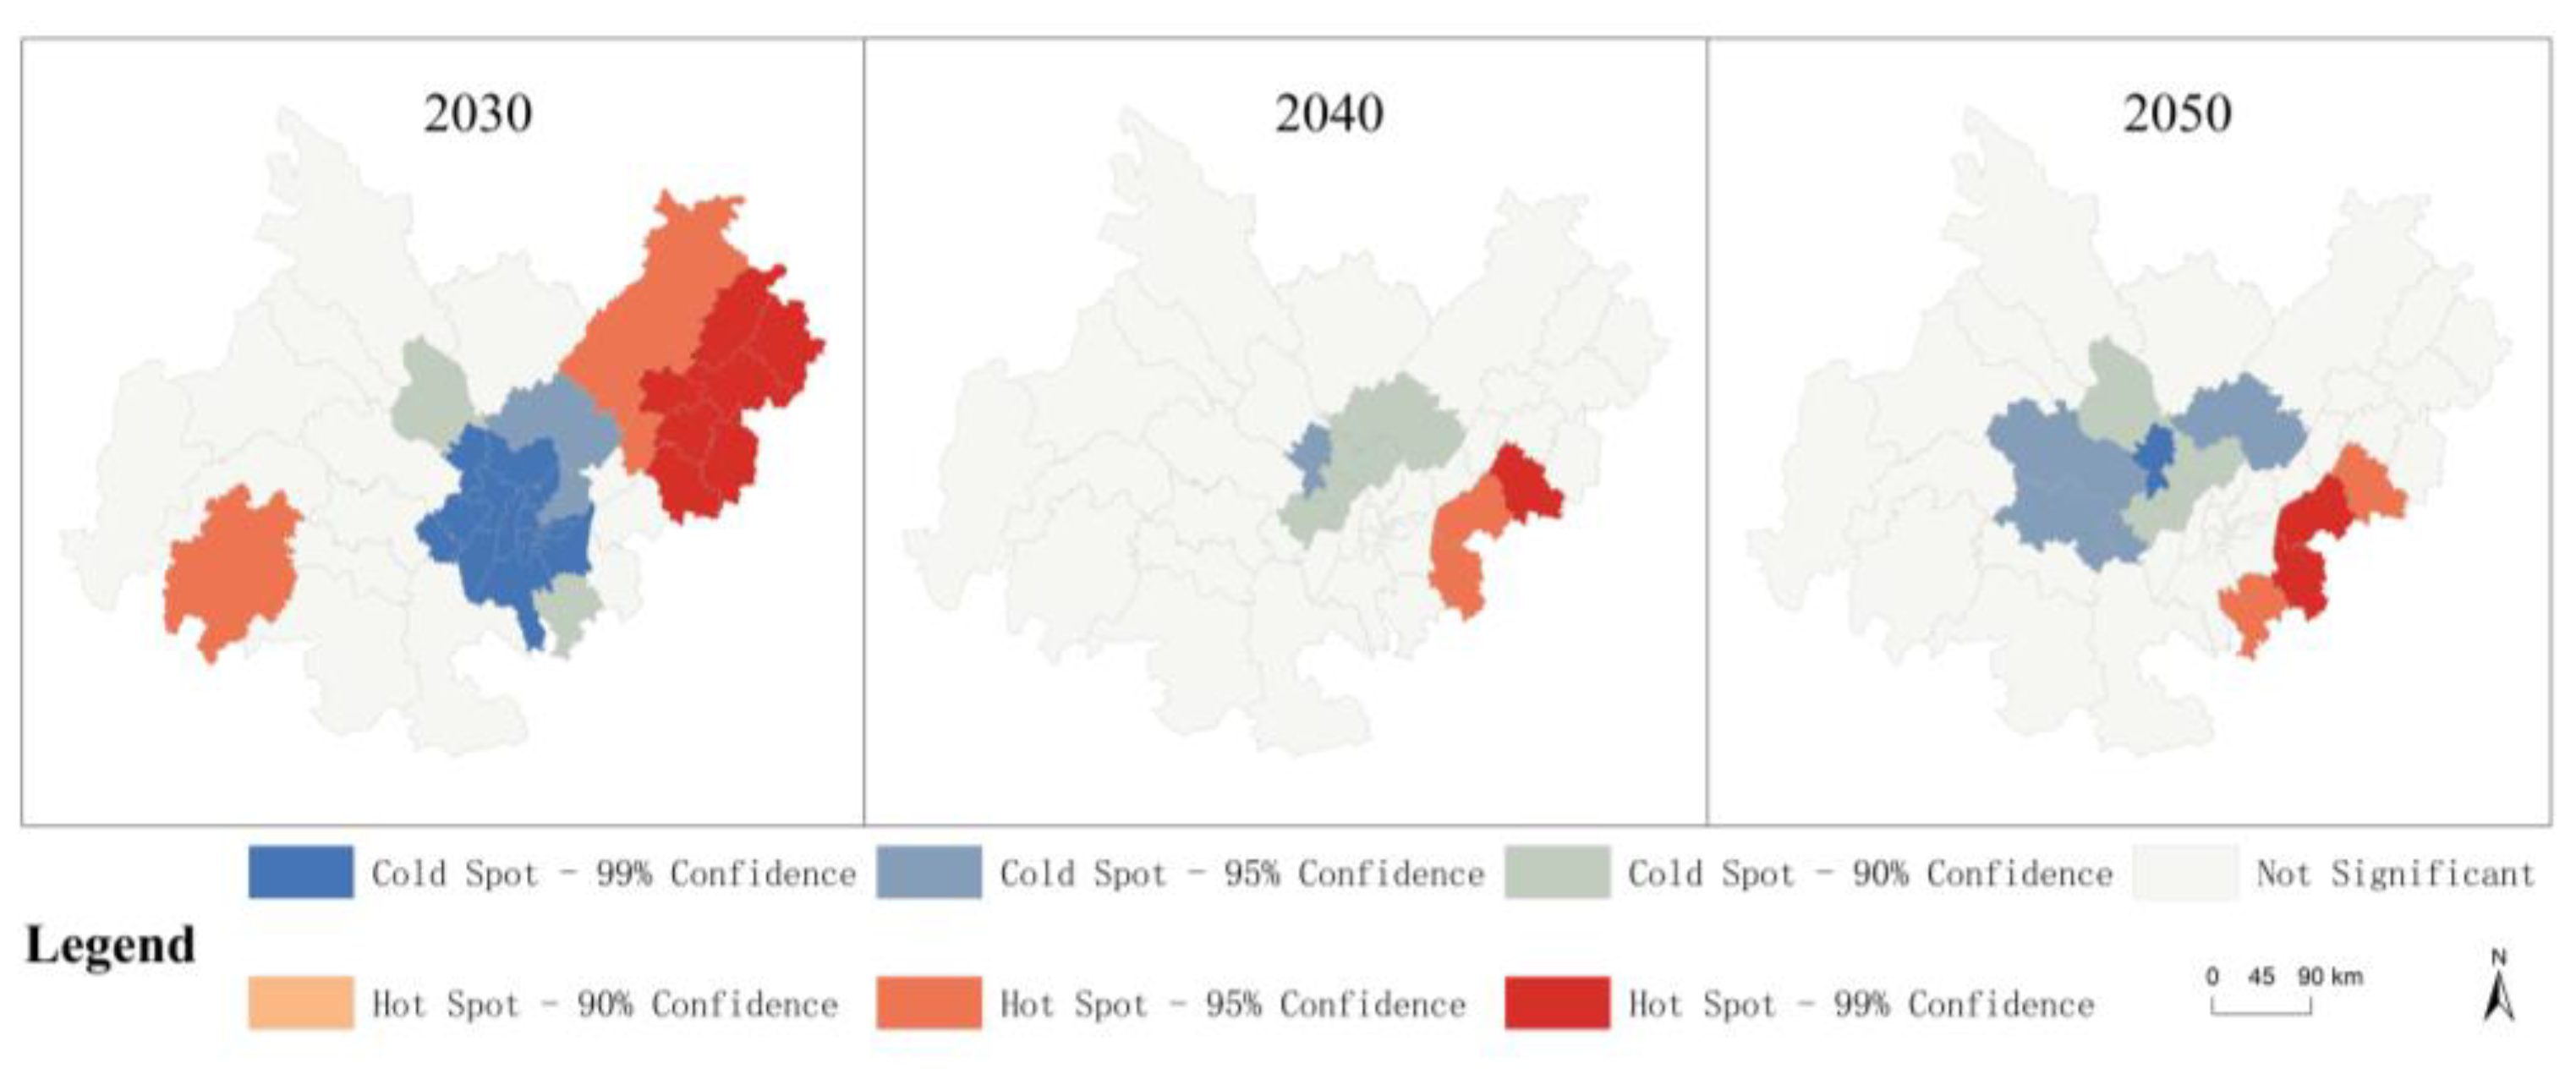
3.3.3. Spatial Aggregation Characteristics of Water Conservation Function Under Future Scenarios in the Chengdu–Chongqing Economic Zone
4. Discussion
5. Conclusions
- (1)
- The PLUS model demonstrated high accuracy (Kappa coefficient: 0.81–0.82) in simulating 30 m resolution land use data for the Chengdu–Chongqing Economic Zone, providing reliable support for large-scale water conservation function predictions.
- (2)
- From 2000 to 2020, the water conservation function exhibited a gradient differentiation characterized by “contraction of low-value zones and expansion of high-value zones.” Under both ND and EP scenarios, water conservation function during 2030–2050 remained lower than 2020 levels.
- (3)
- Under the ND scenario, the proportions of highly important and extremely important grades in 2020, 2030, 2040, and 2050 were 5.02%, 0.51%, 0.11%, and 3.97%, respectively. Spatiotemporal differentiation manifested as “high-value clustering in Chengdu’s urban core and northeastern regions, with low-value diffusion in peripheral mountainous and central areas.”
- (4)
- The ND scenario showed a cold and hot spot pattern of “low-value diffusion and high-value fragmentation,” while the EP scenario exhibited “low-value integration and high-value synergy.”
- (5)
- Divergences in water conservation function between SSP1-1.9 and SSP2-4.5 scenarios underscored the interactive effects of climate policy intensity and human activities. These findings reveal the evolutionary characteristics of water conservation function under varying development pressures, offering critical insights for regional ecological security and sustainable development.
Author Contributions
Funding
Data Availability Statement
Conflicts of Interest
References
- Li, M.Y.; Liang, D.; Xia, J.; Song, J.X.; Cheng, D.D.; Wu, J.T.; Cao, Y.L.; Sun, H.T.; Li, Q. Evaluation of water conservation function of Danjiang River Basin in Qinling Mountains, China based on InVEST model. J. Environ. Manag. 2021, 286, 112212. [Google Scholar] [CrossRef] [PubMed]
- Li, M.; Di, Z.H.; Yao, Y.J.; Ma, Q. Variations in water conservation function and attributions in the Three-River Source Region of the Qinghai-Tibet Plateau based on the SWAT model. Agric. For. Meteorol. 2024, 349, 109956. [Google Scholar] [CrossRef]
- Qin, Z.; Yang, J.M.; Qiu, M.Y.; Liu, Z.Y. Spatial-Temporal Distribution and the Influencing Factors of Water Conservation Function in Yunnan, China. Appl. Sci. 2023, 13, 11720. [Google Scholar] [CrossRef]
- Gao, T.; Li, Y.C.; Zhao, C.Z.; Chen, J.P.; Jin, R.; Zhu, W.H. Factors driving changes in water conservation function from a geospatial perspective: Case study of Jilin Province. Front. Ecol. Evol. 2023, 11, 1303957. [Google Scholar] [CrossRef]
- Lei, J.R.; Zhang, L.; Wu, T.T.; Chen, X.H.; Li, Y.L.; Chen, Z.Z. Spatial-temporal evolution and driving factors of water yield in three major drainage basins of Hainan Island based on land use change. Front. For. Glob. Change 2023, 6, 1131264. [Google Scholar] [CrossRef]
- Zhou, P.P.; Luo, Y.; Song, X.Y.; Wu, H.; Wang, G.; Shan, W.H.; Zhang, K.; Liu, Z.J.; Zhang, S.M.; Li, W.J.; et al. Estimation and prediction of water conservation capacity in shaanxi province based on the InVEST-PLUS model. J. Soil Water Conserv. 2024, 38, 187–194. [Google Scholar] [CrossRef]
- Wang, B.; Chen, H.; Dong, Z.; Zhu, W.; Qiu, Q.; Tang, L. Impact of land use change on the water conservation service of ecosystems in the urban agglomeration of the Golden Triangle of Southern Fujian, China, in 2030. Acta Ecol. Sin. 2020, 40, 484–498. [Google Scholar]
- Ke, X.; Wang, L.; Ma, Y.; Pu, K.; Zhou, T.; Xiao, B.; Wang, J. Impacts of Strict Cropland Protection on Water Yield: A Case Study of Wuhan, China. Sustainability 2019, 11, 184. [Google Scholar] [CrossRef]
- Waiyasusri, K.; Yumuang, S.; Chotpantarat, S. Monitoring and predicting land use changes in the Huai Thap Salao Watershed area, Uthaithani Province, Thailand, using the CLUE-s model. Environ. Earth Sci. 2016, 75, 533. [Google Scholar] [CrossRef]
- Hu, Y.C.; Zheng, Y.M.; Zheng, X.Q. Simulation of land-use scenarios for Beijing using CLUE-S and Markov composite models. Chin. Geogr. Sci. 2013, 23, 92–100. [Google Scholar] [CrossRef]
- Xu, L.F.; Liu, X.; Tong, D.; Liu, Z.X.; Yin, L.R.; Zheng, W.F. Forecasting Urban Land Use Change Based on Cellular Automata and the PLUS Model. Land 2022, 11, 652. [Google Scholar] [CrossRef]
- Mutale, B.; Qiang, F. Modeling future land use and land cover under different scenarios using patch-generating land use simulation model. A case study of Ndola district. Front. Environ. Sci. 2024, 12, 1362666. [Google Scholar] [CrossRef]
- Zhang, X.Q.; Liu, J.W.; Zhu, J.; Cheng, W.H.; Zhang, Y.H. Analysis of the Spatiotemporal Patterns of Water Conservation in the Yangtze River Ecological Barrier Zone Based on the InVEST Model and SWAT-BiLSTM Model Using Fractal Theory: A Case Study of the Minjiang River Basin. Fractal Fract. 2025, 9, 116. [Google Scholar] [CrossRef]
- Chen, J.Z.; Kasimu, A.; Reheman, R.; Wei, B.H.; Han, F.Q.; Zhang, Y. Temporal and spatial variation and prediction of water yield and water conservation in the Bosten Lake Basin based on the PLUS-InVEST model. J. Arid Land 2024, 16, 852–874. [Google Scholar] [CrossRef]
- Zhou, P.P.; Wu, H.; Song, X.Y.; Sun, W.Y.; Li, Y.; Zhai, J.; Liu, Z.J. The comprehensive effects of future multi-scenario land use change and climate change on water conservation in Northwest China. Land Degrad. Dev. 2024, 35, 3844–3854. [Google Scholar] [CrossRef]
- Ersoy Tonyaloğlu, E. Future land use/land cover and its impacts on ecosystem services: Case of Aydın, Turkey. Int. J. Environ. Sci. Technol. 2025, 22, 4601–4617. [Google Scholar] [CrossRef]
- Wang, L.; Yuan, M.K.; Li, H.L.; Chen, X.D. Exploring the coupling coordination of urban ecological resilience and new-type urbanization: The case of China’s Chengdu-Chongqing Economic Circle. Environ. Technol. Innov. 2023, 32, 103372. [Google Scholar] [CrossRef]
- Zhang, Y.Y.; Yang, R.J.; Sun, M.Y.; Lu, Y.R.; Zhang, L.; Yin, Y.T.; Li, X.H. Identification of spatial protection and restoration priorities for ecological security pattern in a rapidly urbanized region: A case study in the Chengdu-Chongqing economic Circle, China. J. Environ. Manag. 2024, 366, 121789. [Google Scholar] [CrossRef]
- Islam, S.; Li, Y.C.; Ma, M.G.; Chen, A.X.; Ge, Z.X. Simulation and Prediction of the Spatial Dynamics of Land Use Changes Modelling Through CLUE-S in the Southeastern Region of Bangladesh. J. Indian Soc. Remote Sens. 2021, 49, 2755–2777. [Google Scholar] [CrossRef]
- Zhu, K.W.; Lei, B.; Li, Y.C.; He, J.; Yang, C.H. Land Use/Cover Scenario Simulation and Ecological Value Assessment based on the Ecological Protection Red Line: Liangjiang New Area Case Study. Res. Environ. Sci. 2017, 30, 1801–1812. [Google Scholar] [CrossRef]
- Nouri, J.; Gharagozlou, A.; Arjmandi, R.; Faryadi, S.; Adl, M. Predicting urban land use changes using a CA-Markov model. Arab. J. Sci. Eng. 2014, 39, 5565–5573. [Google Scholar] [CrossRef]
- Liang, X.; Liu, X.P.; Chen, G.L.; Leng, J.Y.; Wen, Y.Y.; Chen, G.Z. Coupling fuzzy clustering and cellular automata based on local maxima of development potential to model urban emergence and expansion in economic development zones. Int. J. Geogr. Inf. Sci. 2020, 34, 1930–1952. [Google Scholar] [CrossRef]
- Liang, X.; Guan, Q.F.; Clarke, K.C.; Liu, S.S.; Wang, B.Y.; Yao, Y. Understanding the drivers of sustainable land expansion using a patch-generating land use simulation (PLUS) model: A case study in Wuhan, China. Comput. Environ. Urban Syst. 2021, 85, 101569. [Google Scholar] [CrossRef]
- Wu, D.; Zhu, K.W.; Zhang, S.; Huang, C.Q.; Li, J. Evolution Analysis of Carbon Storage in Chengdu-Chongqing Economic Zone Based on PLUS Model and InVEST Model. Ecol. Environ. Monit. Three Gorges 2021, 7, 1–18. [Google Scholar]
- Liu, C.Y.; Zhu, K.W.; Liu, J.P. Evolution and prediction of land cover and biodiversity function in Chongqing section of Three Gorges Reservoir Area. Trans. Chin. Soc. Agric. Eng. 2017, 33, 258–267. [Google Scholar] [CrossRef]
- Lamichhane, S.; Shakya, N.M. Land Use Land Cover (LULC) Change Projection in Kathmandu Valley using the CLUE-S Model. J. Adv. Coll. Eng. Manag. 2021, 6, 221–233. [Google Scholar] [CrossRef]
- Kim, S.-W.; Jung, Y.-Y. Application of the InVEST Model to Quantify the Water Yield of North Korean Forests. Forests 2020, 11, 804. [Google Scholar] [CrossRef]
- Anjinho, P.D.; Barbosa, M.A.; Mauad, F.F. Evaluation of InVEST’s Water Ecosystem Service Models in a Brazilian Subtropical Basin. Water 2022, 14, 1559. [Google Scholar] [CrossRef]
- Sposito, G. Understanding the Budyko Equation. Water 2017, 9, 236. [Google Scholar] [CrossRef]
- Yan, F.; Shangguan, W.; Zhang, J.; Hu, B. Depth-to-bedrock map of China at a spatial resolution of 100 meters. Sci. Data 2020, 7, 2. [Google Scholar] [CrossRef]
- Wang, Y.Z.; Xu, Y.L.; Yu, H.R. Temporal and spatial evolution characteristics of carbon storage in Hefei ecosystem based on PLUS and InVEST models. J. Soil Water Conserv. 2023, 43, 277–289. [Google Scholar] [CrossRef]
- Zhi, F.; Zhou, Z.H.; Zhao, M.; Wang, S.Q. Prediction of spatial and temporal changes of carbon stocks in Anhui Province based on PLUS-InVEST model. J. Soil Water Conserv. 2024, 38, 205–215. [Google Scholar] [CrossRef]
- Ma, X.; Liu, S.; Guo, L.; Zhang, J.; Feng, C.; Feng, M.; Li, Y. Evolution and Analysis of Water Yield under the Change of Land Use and Climate Change Based on the PLUS-InVEST Model: A Case Study of the Yellow River Basin in Henan Province. Water 2024, 16, 2551. [Google Scholar] [CrossRef]
- Luo, S.Q.; Hu, X.M.; Sun, Y.; Yan, C.; Zhang, X. Multi-scenario land use change and its impact on carbon storage based on coupled Plus-Invest model. Chin. J. Eco-Agric. 2023, 31, 300–314. [Google Scholar]
- Wen, S.Q.; Hu, B.Q.; Xie, W.W.; Gao, C.L. Land Use Scenario Simulation and Habitat Quality Change in Pinglu River Economic Belt based on PLUS-InVEST model. Environ. Sci. 2024, 1–18. [Google Scholar] [CrossRef]
- Zhang, W.; Zhu, R.; Yang, H.Q.; Shan, J.A.; Feng, Y.L.; Yin, Z.L. Spatio-Temporal Evolution and Prediction of Carbon Storage in the Water Conservation Area of the Yellow River Basin based on the PLUS-InVEST Model. Plateau Meteorol. 2025, 44, 362–377. [Google Scholar]


| Dataset Type | Name | Source | Resolution (m) | Model Role | Preprocessing Steps |
|---|---|---|---|---|---|
| Basic Geographic Data | DEM | Geospatial Data Cloud | 30 | Slope extraction; one of the driving factors for PLUS model | Extracted study area using clipping function in ArcGIS |
| Study Area Boundary Data | National Geographic Information Public Service Platform | / | Define boundary scope | Selected and exported study area boundary using ArcGIS | |
| Land Use | LULC Imagery (2000, 2010, 2020) | Resource and Environmental Science Data Center, Chinese Academy of Sciences | 30 | Training and validation of PLUS model; raster input for InVEST water model | Reclassified into five categories (cropland, forest, grassland, water body, built-up land, unused land) and clipped to study area using ArcGIS |
| Environmental-driven Data | Road Data | OpenStreetMap | / | Random forest driving factor for PLUS model | Imported and clipped in ArcGIS |
| NDVI (Normalized Difference Vegetation Index) | Geospatial Data Cloud | 500 | Driving factor for PLUS model | Atmospheric correction, projection, and other processing using ENVI | |
| Climate Data | Annual Precipitation (2000, 2010, 2020) | National Qinghai-Tibet Plateau Scientific Data Center | 1000 | Input for InVEST model to calculate water yield | Raster projection and raster calculation using ArcGIS |
| Potential Evapotranspiration (2000, 2010, 2020) | |||||
| Scenario-driven Data | Annual Precipitation (SSP1-1.9, SSP2-4.5) | National Qinghai-Tibet Plateau Scientific Data Center | 1000 | Input for InVEST model to calculate water yield | Raster projection and raster calculation using ArcGIS |
| Potential Evapotranspiration (SSP1-1.9) | |||||
| Soil Data | Soil Type | World Soil Database | 1000 | Input for InVEST model and water conservation calculation | Raster projection and raster calculation using ArcGIS |
| Root Restriction Layer Depth | Literature-shared data [30] | 1000 | Input for InVEST model | Extracted by mask and raster calculation in ArcGIS |
| Scenario Models | Year | Moran’s I | Z-Score | p Value | Variance |
|---|---|---|---|---|---|
| Current Status | 2000 | 0.424 | 7.543 | 0 | 0.004 |
| 2010 | 0.463 | 8.263 | 0 | 0.003 | |
| 2020 | 0.282 | 5.192 | 0 | 0.003 | |
| ND Scenario under SSP1-1.9 | 2030 | 0.448 | 8.061 | 0 | 0.003 |
| 2040 | 0.509 | 9.127 | 0 | 0.003 | |
| 2050 | 0.441 | 7.856 | 0 | 0.003 | |
| EP Scenario under SSP1-1.9 | 2030 | 0.446 | 8.027 | 0 | 0.003 |
| 2040 | 0.508 | 9.114 | 0 | 0.003 | |
| 2050 | 0.436 | 7.780 | 0 | 0.003 |
| Year | Region | Natural Development (ND) Scenario | Ecological Protection (EP) Scenario |
|---|---|---|---|
| 2030 | Hot spot | 28.32% | 28.32% |
| Cold Spot | 12.83% | 12.83% | |
| 2040 | Hot spot | 22.57% | 22.57% |
| Cold Spot | 12.82% | 12.82% | |
| 2050 | Hot spot | 18.79% | 18.79% |
| Cold Spot | 20.72% | 19.29% |
Disclaimer/Publisher’s Note: The statements, opinions and data contained in all publications are solely those of the individual author(s) and contributor(s) and not of MDPI and/or the editor(s). MDPI and/or the editor(s) disclaim responsibility for any injury to people or property resulting from any ideas, methods, instructions or products referred to in the content. |
© 2025 by the authors. Licensee MDPI, Basel, Switzerland. This article is an open access article distributed under the terms and conditions of the Creative Commons Attribution (CC BY) license (https://creativecommons.org/licenses/by/4.0/).
Share and Cite
Zhu, K.; Li, S.; Huang, W.; Hou, P.; Liu, Y.; Liu, J.; Li, Z. Integrating the PLUS-InVEST Model to Project Water Conservation Dynamics and Decipher Climatic Drivers in the Chengdu–Chongqing Economic Zone Under Multiple Future Scenarios. Hydrology 2025, 12, 184. https://doi.org/10.3390/hydrology12070184
Zhu K, Li S, Huang W, Hou P, Liu Y, Liu J, Li Z. Integrating the PLUS-InVEST Model to Project Water Conservation Dynamics and Decipher Climatic Drivers in the Chengdu–Chongqing Economic Zone Under Multiple Future Scenarios. Hydrology. 2025; 12(7):184. https://doi.org/10.3390/hydrology12070184
Chicago/Turabian StyleZhu, Kangwen, Suqiong Li, Wei Huang, Peng Hou, Yaqun Liu, Jian Liu, and Zihui Li. 2025. "Integrating the PLUS-InVEST Model to Project Water Conservation Dynamics and Decipher Climatic Drivers in the Chengdu–Chongqing Economic Zone Under Multiple Future Scenarios" Hydrology 12, no. 7: 184. https://doi.org/10.3390/hydrology12070184
APA StyleZhu, K., Li, S., Huang, W., Hou, P., Liu, Y., Liu, J., & Li, Z. (2025). Integrating the PLUS-InVEST Model to Project Water Conservation Dynamics and Decipher Climatic Drivers in the Chengdu–Chongqing Economic Zone Under Multiple Future Scenarios. Hydrology, 12(7), 184. https://doi.org/10.3390/hydrology12070184