Article

Effects of Climate Change and Human Activities on the Flow of the Muling River

1
School of Hydraulic and Electric Power, Heilongjiang University, Harbin 150080, China
2
Institute of Groundwater Cold Region, Heilongjiang University, Harbin 150080, China
3
International Joint Laboratory of Hydrology and Hydraulic Engineering in Cold Regions of Heilongjiang Province, Harbin 150080, China
*
Authors to whom correspondence should be addressed.
Hydrology 2025, 12(7), 180; https://doi.org/10.3390/hydrology12070180
Submission received: 3 June 2025 / Revised: 27 June 2025 / Accepted: 2 July 2025 / Published: 3 July 2025

Abstract

In the context of global warming and the intensification of human activities, the change in runoff is also increasing. It is very important to determine the change in runoff for the rational utilization of water resources. In order to determine the influencing factors of runoff change in Muling River, the SWAT model was used in this study to separate different coupling factors and calculate the contribution rate of a single factor to runoff change at the annual scale and quarterly scale, respectively. In the process of calibration, different single rate times were used to analyze the influence of different rate times on the calibration results. The results show that the runoff in the Muling River basin shows a downward trend, the quarterly temperature factor has the greatest influence on the runoff change, which is 50–60%, the annual precipitation has the greatest influence on the runoff change, which is 68%, and the maximum change in the runoff from the reservoir is 42.5% under the change in human activities. In the SWAT-CUP software, the optimal number of calibration for this basin is 500. This research provides a scientific basis for the flow analysis of the Muling River basin.

1. Introduction

According to the sixth Report of the IPCC [1], the global surface temperature in 2011–2020 was 0.95 to 1.2 °C higher than that in 1850–1900. The land surface temperature was 1.34 to 1.83 °C higher than before, and the sea surface temperature was 0.68 to 1.01 °C higher than before. Climate change has caused irreversible and serious damage to land, fresh water, and other systems. By affecting the basic links of the water cycle, climate change changes the total amount of water resources or causes the redistribution of water resources, thus affecting river runoff [2,3]. Changes in the underlying surface also alter the physical and chemical properties of the land surface, affecting the processes [4] by which precipitation percolates, evaporates, and generates surface runoff. In the process of urbanization, the increase in the proportion of hardened surface will significantly increase the intensity of surface runoff, intensify the effect of storm runoff, and reduce the recharge capacity [5] of groundwater. In addition, the impact of human activities on the land will change the hydrological characteristics of the watershed and further affect the spatial and temporal distribution of river runoff.
Climate change [6,7,8] is one of the major factors affecting river runoff. At present, domestic scholars focus on the response of runoff to climate change in northwest China and the Yangtze River basin [9,10,11,12,13], while there are few studies on Northeast China. Zheng [14] et al. pointed out that climate change would cause extreme runoff in the Tianshan Mountains. Jiang [15] et al. estimated the runoff in the Bintuo River basin and pointed out that in the next two periods, the variation amplitude of runoff would decrease while the variation amplitude of evapotranspiration would increase, which would make extreme hydrological events more likely. Guo [16] et al. pointed out that climate change was the main reason affecting the runoff of the Hulu River during 1986–2014. Wang [17] et al. pointed out that the runoff of the Nomin River basin varies greatly under different climate scenario models, indicating that climate has a great influence on the runoff. Zhou [18] et al. pointed out that both rainfall and runoff will increase in the Qingshuihe River basin in the future climate model decline. Wang [19] et al. pointed out that there was a negative correlation between temperature and runoff in the Huma River basin. At the same time, land use change caused by human activities will also affect river runoff. Deng [20] et al. pointed out that human activities lead to a change in land use type, which in turn changes the underlying surface and other physical properties of the land, thus affecting the runoff. Wang [21] et al. pointed out that water conservancy projects and agricultural irrigation water use would greatly affect river runoff. Liu [22] et al. used the distributed hydrological model boundary river ecosystem service index evaluation method to analyze the impact of different land types on the ecosystem. Using the SWAT model, Liu [23] et al. quantitatively analyzed the impact of different types of land use on runoff. These studies show that runoff varies greatly under different hydrological conditions. In order to clarify the influence of different factors on runoff, researchers began to turn to the contribution rate of single factors in runoff change. For example, Li [24] et al. used the improved hydrological simulation method to quantitatively analyze the influence of different single factors on the runoff change in the Luohe River. Zhong [25] et al. used the MIKE SHE model and the spatio-temporal weighted regression model to quantify the impact of climate change and land use change on the depth of runoff. Huang [26] et al. used five different methods to explore the effects of human activities and climate change on runoff change in the Jinghe River basin. S [27] et al. used the SHETRAN model to analyze the effects of land use and climate change on hydrological processes.
In this study, Muling River in Heilongjiang Province was selected as the research object. Although the previous text mentioned that there is more research on the northwest region, the northeast region and the northwest region have similar latitudes. However, the climate feature of the northeast region is a more variable temperate monsoon climate, while that of the northwest region is a temperate continental climate. At the same time, the population density of the northeast region is greater than that of the northwest region. The environmental changes brought about by the dense population will also have a certain impact on the runoff. Therefore, we chose the Muling River basin located in the northeast region. The following is our research process. Firstly, the temperature, precipitation and land use factors in the basin were analyzed. Then, we established the SWAT model of the Muling River basin and calibrated it. To explore the influence of different variables on the flow of the Muling River, we adopted the hydrological control variable method to select a single variable (such as temperature, precipitation, land use, etc.), and the influence of different calibration times in SWAT-CUP on the simulation results was discussed. Compared with other similar research areas [28,29,30,31,32], our study relied on the SWAT model and revealed the proportion of the influence of different variables on the runoff volume of the Muling River based on the hydrological control variable method, and discussed the influence of hydrological processes on the SWAT model and the SWAT-CUP rate timing. The research results can be used to guide method selection for the attribution analysis of runoff change under changing environments.

Study Area

Muling River is one of the ten major rivers in Heilongjiang Province. It is located in the Wusuli River basin and is the largest tributary on the left bank of the Wusuli River with a drainage area of 18,427 km2. The terrain in the basin is high in the south and low in the north, and slopes from southwest to northeast. In the south, it is bounded by Taiping Mountain, Suifenhe River, and Xingkai Lake. In the basin, the area is 51% mountainous, 26.3% hilly, 22% plain, and 0.7% lake. The Muling River originates from Wodjiling, Muling City, Heilongjiang Province, on the east slope of Laoying Mountain Range, Muling City, Heilongjiang Province. It flows through Muling City, Jixi City, Jidong County, Mishan City, and Hulin City. In Hulin City, it is divided into two branches, one into the Wusuli River and the other into Xiaoxingkai Lake. The river supplies water to urban areas and nearby farms in Jixi City, Mishan City, Hulin City, and Mudanjiang City. On the left bank of the larger tributaries of the Muling River from top to bottom are the Dashi River, the Didao River, the Hada River, and the Peide River, and on the right bank are the Maqiao River, the Liangzi River, and the Huangni River.
The river basin is located in the middle and temperate continental monsoon climate zone, with a hot and rainy summer and cold and long winter. The annual average temperature is 3.2 degrees Celsius, the highest temperature is 37.6 °C, and the lowest temperature is −44.1 °C. The annual average precipitation is 552.9 mm, and the precipitation distribution is uneven within the year. The precipitation from June to September accounts for about 70% of the annual precipitation, and the annual average runoff is 1.84 billion m3. The frost-free period lasts 140 days, and the freezing period lasts 150–160 days. There are four kinds of soil on both sides of the Muling River, namely gleyic soil, black soil, rudiment soil, and alluvial soil. Except for the cities in the upper reaches, most of the other areas are forest farms or farms. The vegetation belongs to the mixed coniferous broad-leaved forest community, the land utilization rate is high, there is basically no unused land, the cultivated land is mainly corn, soybean, wheat, rice, and potato, and a small area has sugar beet and other cash crops. There is a large water conservancy project, the Struggle Reservoir, in the upper reaches of Muling River. The drainage area above the dam site is 1740 km2, the total storage capacity is 191 million m3, and the annual average power generation is 1297 × 104 kW·h; an overview of the study area is shown in Figure 1.

2. Materials and Methods

2.1. Data Sources

In this study, spatial data and attribute data of Muling River basin were used for simulation. The data include digital elevation data (DEM), land use data, soil data, CMADS meteorological data (the China Meteorological Assimilation Drive datasets for the SWAT model), and runoff data of the Hubei Zha Hydrology Station and Mishanqiao Hydrology Station. The SWAT model was adopted for modeling. The types and formats of required data and other information are shown in Table 1.

2.2. SWAT Model

The Soil And Water Assessment Tool (SWAT) model is a distributed hydrological model, developed by the United States Department of Agriculture in 1994, which is suitable for long time series and can simulate a series of hydrological processes in the basin. The monthly scale runoff is a widely used distributed hydrological model [23]. The formula for water balance equation in the SWAT model is as follows:
S W t = S W 0 + n = 1 t ( R n Q n E n W n T n )
where S W t is the water content of day n (mm); S W 0 is the initial water content of soil on day n (mm); n is the time (d); R n is the total precipitation on day n (mm); Q n is the total surface runoff on day n (mm); E n is the evapotranspiration on day n (mm); W n is the water seepage under the soil on day n (mm); and T n is the groundwater return on day n (mm).

2.3. Mann–Kendall Test

Mann–Kendall test is a non-parametric statistical test method, which does not require samples to follow a certain distribution and is less affected by outliers, and can characterize well the trend change characteristics of time series, so it is generally applicable to the significance test for time series trends. The identification of an abrupt runoff year is of great significance for separating the impacts of climate change and human activities on runoff. The abrupt runoff period is determined by the M-K trend test method, considering the abrupt characteristics of multiple influencing factors that affect the change in runoff.

2.4. Calculation of Contribution Rate

In the hydrological simulation process, the SWAT model takes into account the influence of physical factors, and can simulate the hydrological process more objectively and truly according to the input spatial geographic information. Therefore, the contribution rate of each element to the runoff change can be quantified according to the input of different meteorological elements and underlying surface conditions. In addition, the reservoir in the upper reaches of the basin can be regarded as an important manifestation of human activities, and its contribution rate to runoff change can also be quantified.
η x = Δ R x Δ R × 100 %
Δ R x = R s i m x R s i m
where η x is the contribution rate of x variable to runoff change; Δ R is the total change in runoff from the baseline period to the impact period, m3; Δ R x is the runoff change caused by x variable; R s i m is the average runoff in the influence period simulated by the SWAT model constructed in the base period, m3; and R s i m x is the average runoff simulated in the impact period after the input of the impact period x variable to the SWAT model constructed in the base period, m3.

3. Results and Analysis

3.1. Data Analysis

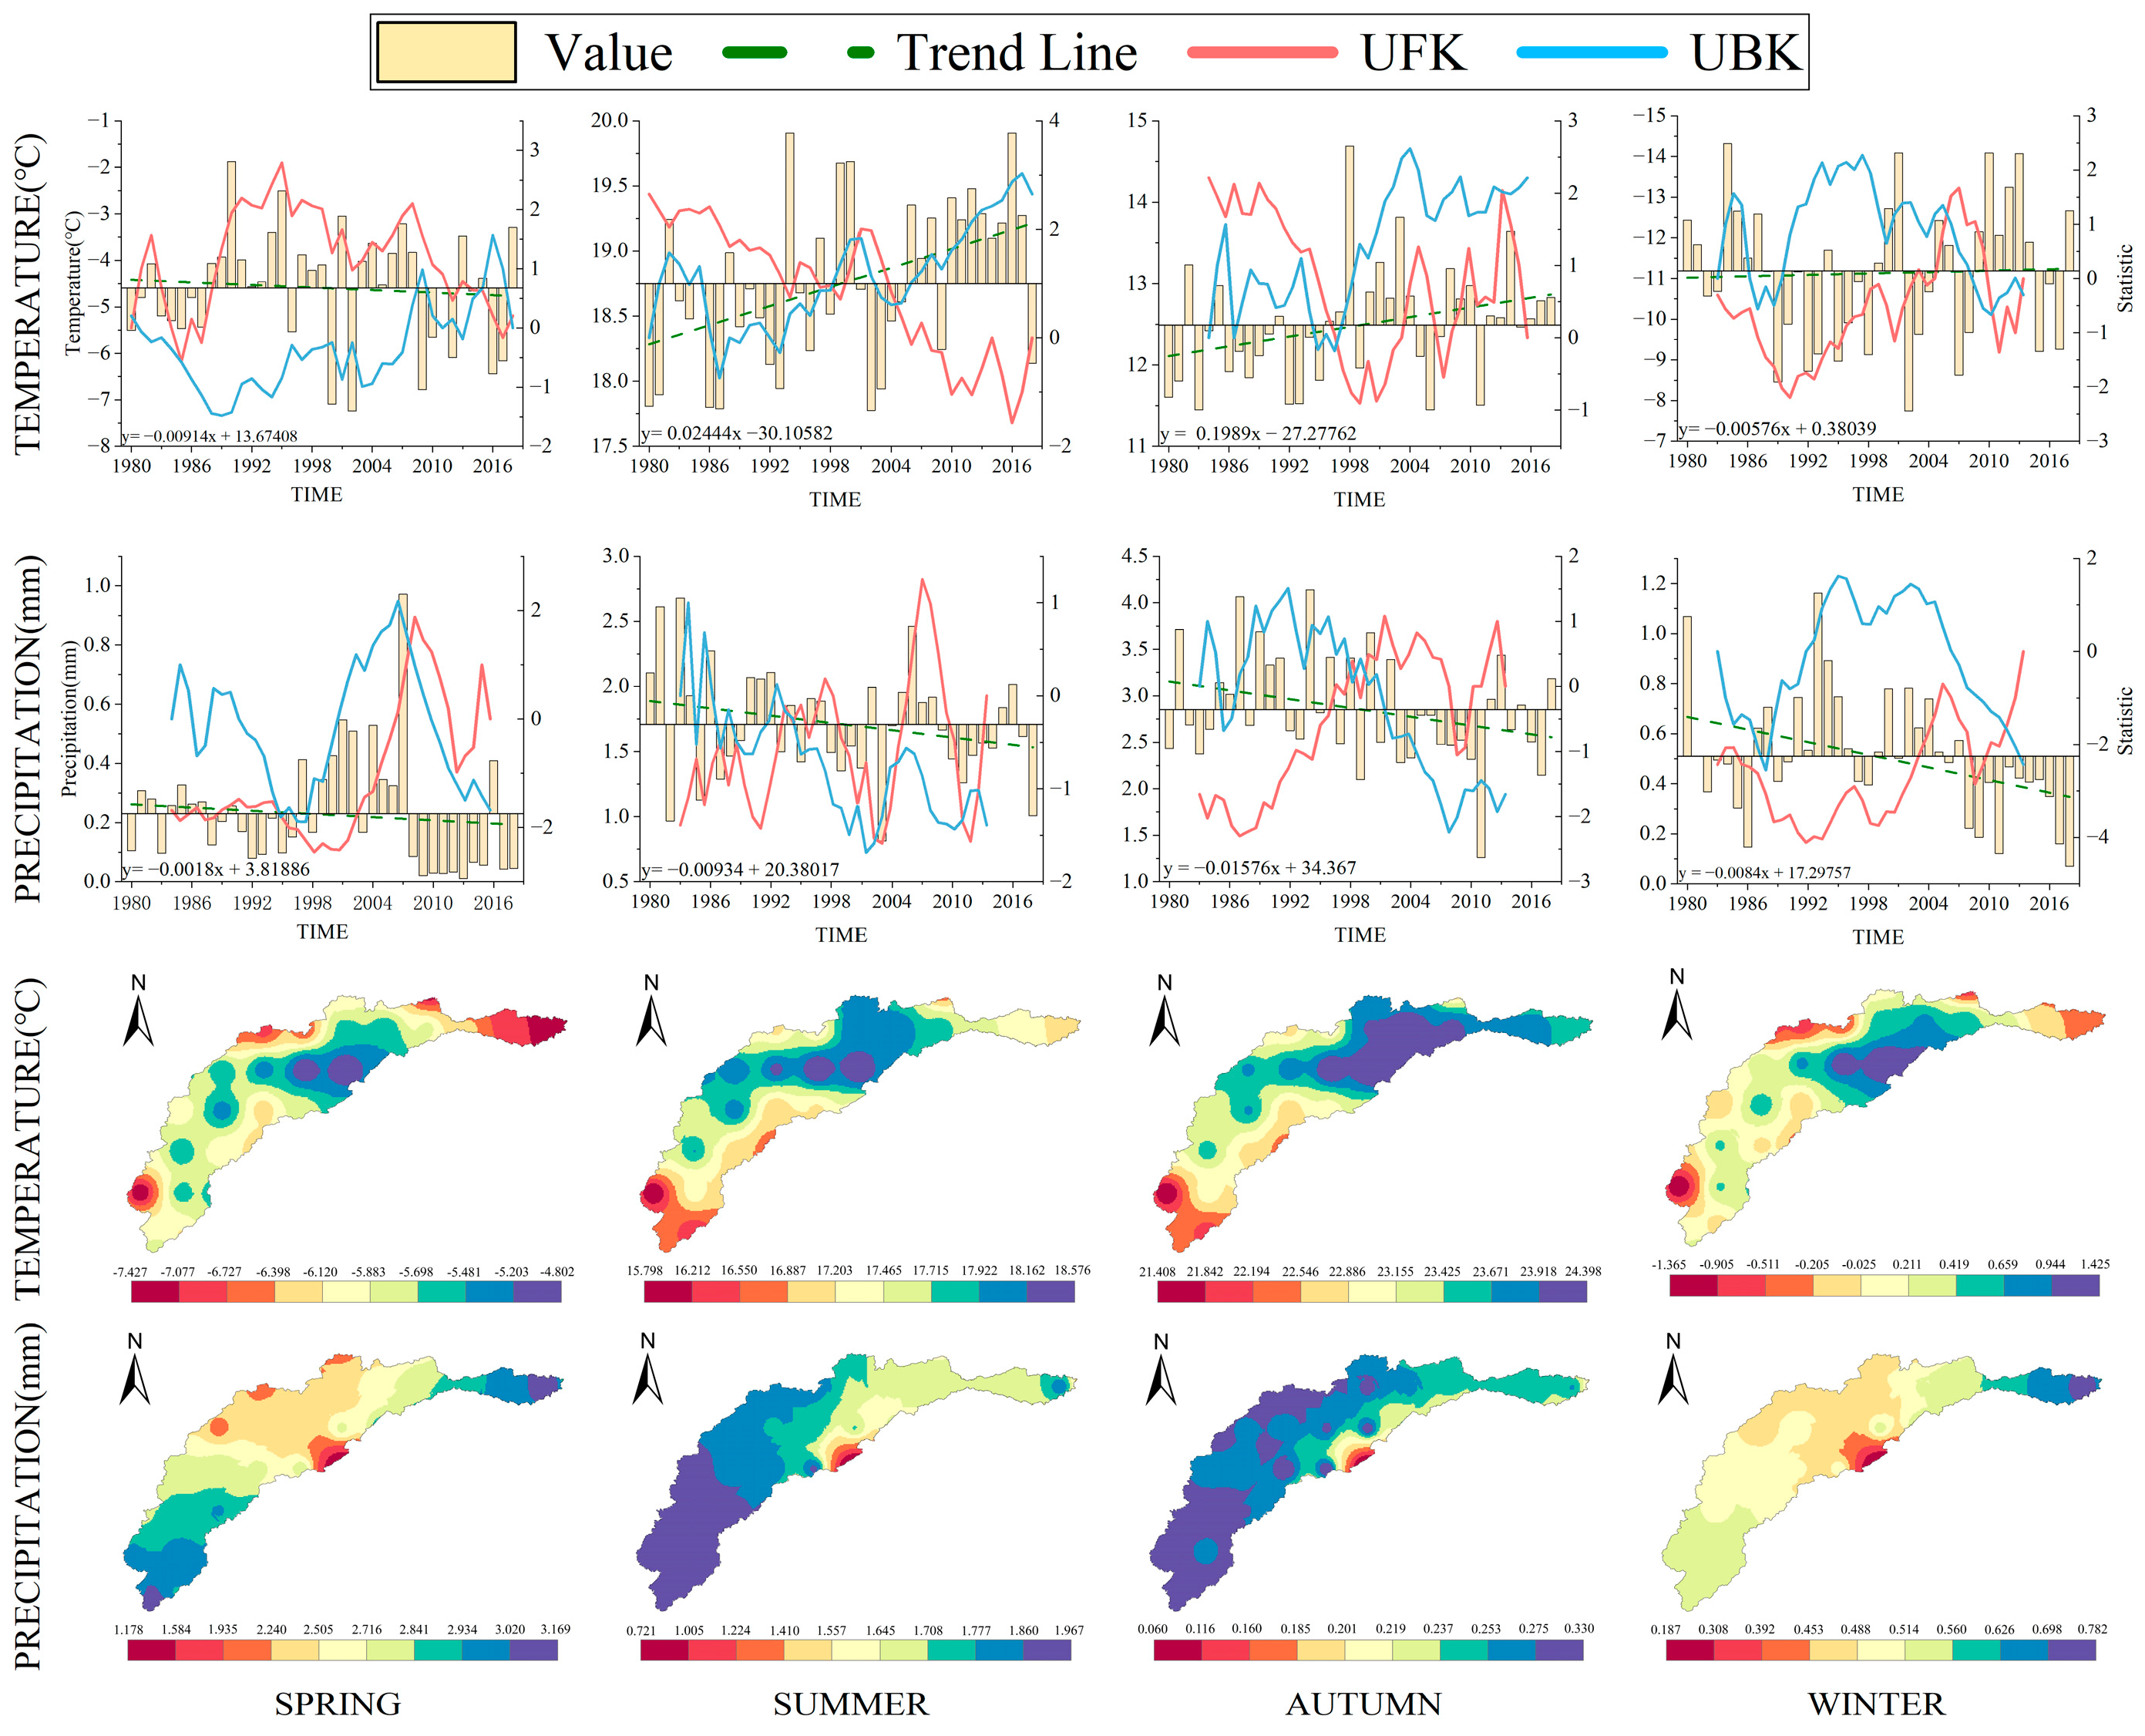
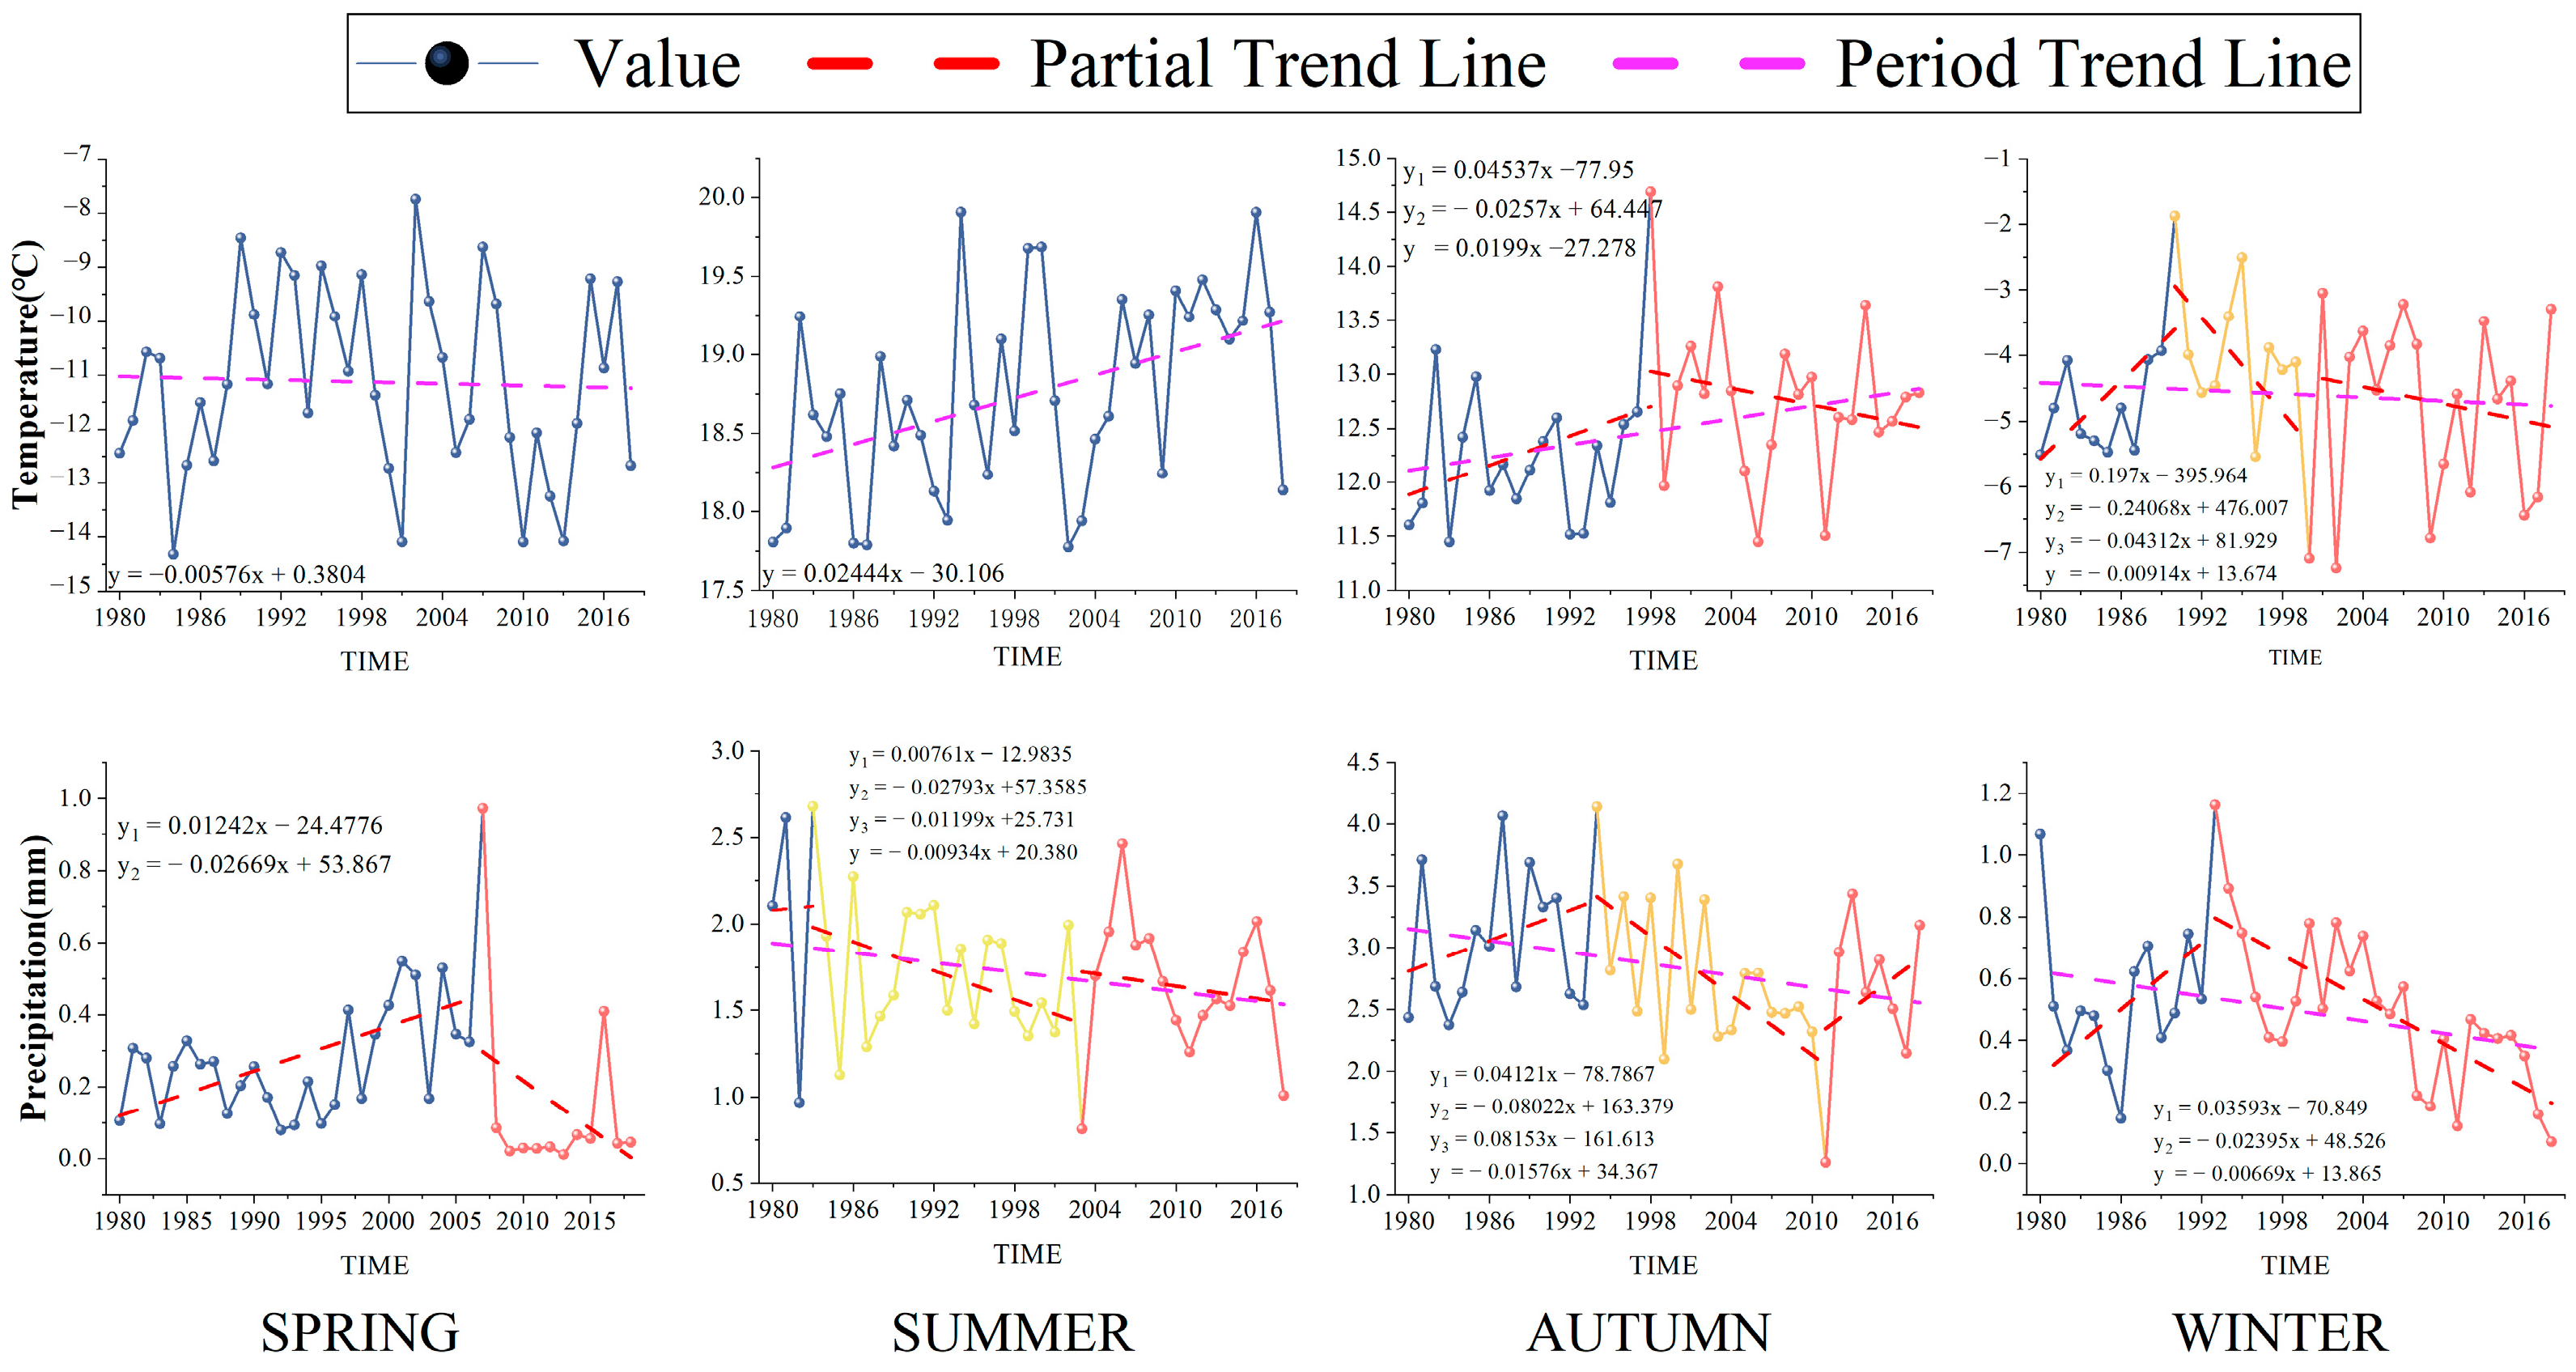
3.1.1. Meteorological Data

According to the seasonal average of the temperature in the basin from 1980 to 2018, the temperature change chart shows that the annual temperature in the Muling River basin has little change, the annual temperature in the middle of the basin is higher, the annual temperature in the southern basin is lower, and the annual temperature in the northern and eastern parts of the western basin changes according to the normal seasonal change law. At the same time, by calculating the annual meteorological average, it can be found that from 1980 to 1988, the annual average temperature fluctuated between −0.5 °C and −1.5 °C. From 1989 to 1999, the annual average temperature increased between 0.5 °C and −0.5 °C, and suddenly dropped in 2000, and then began to rise and fluctuate. In 2009, the average temperature suddenly dropped to the lowest value within the study range, and then began to rise slowly, but still maintained a downward trend compared with the previous years.

3.1.2. Precipitation Data

By calculating the annual mean value of precipitation, as shown in Figure 2, it can be seen that the precipitation in Muling River basin is relatively stable, fluctuating between 1–1.8 mm/a, with a slow downward trend. At the same time, by calculating the quarterly precipitation average, it is found that there is less precipitation in spring and winter, and more precipitation in summer and autumn. In spring and winter, the snowfall in the middle of the basin was much less than that at the northern and southern ends of the basin. In summer and autumn, the precipitation in the basin decreases from south to north. According to the annual precipitation average, except 2011, the precipitation in the Muling River basin fluctuates between 0.97 mm and 1.8 mm, and the change is relatively gentle.

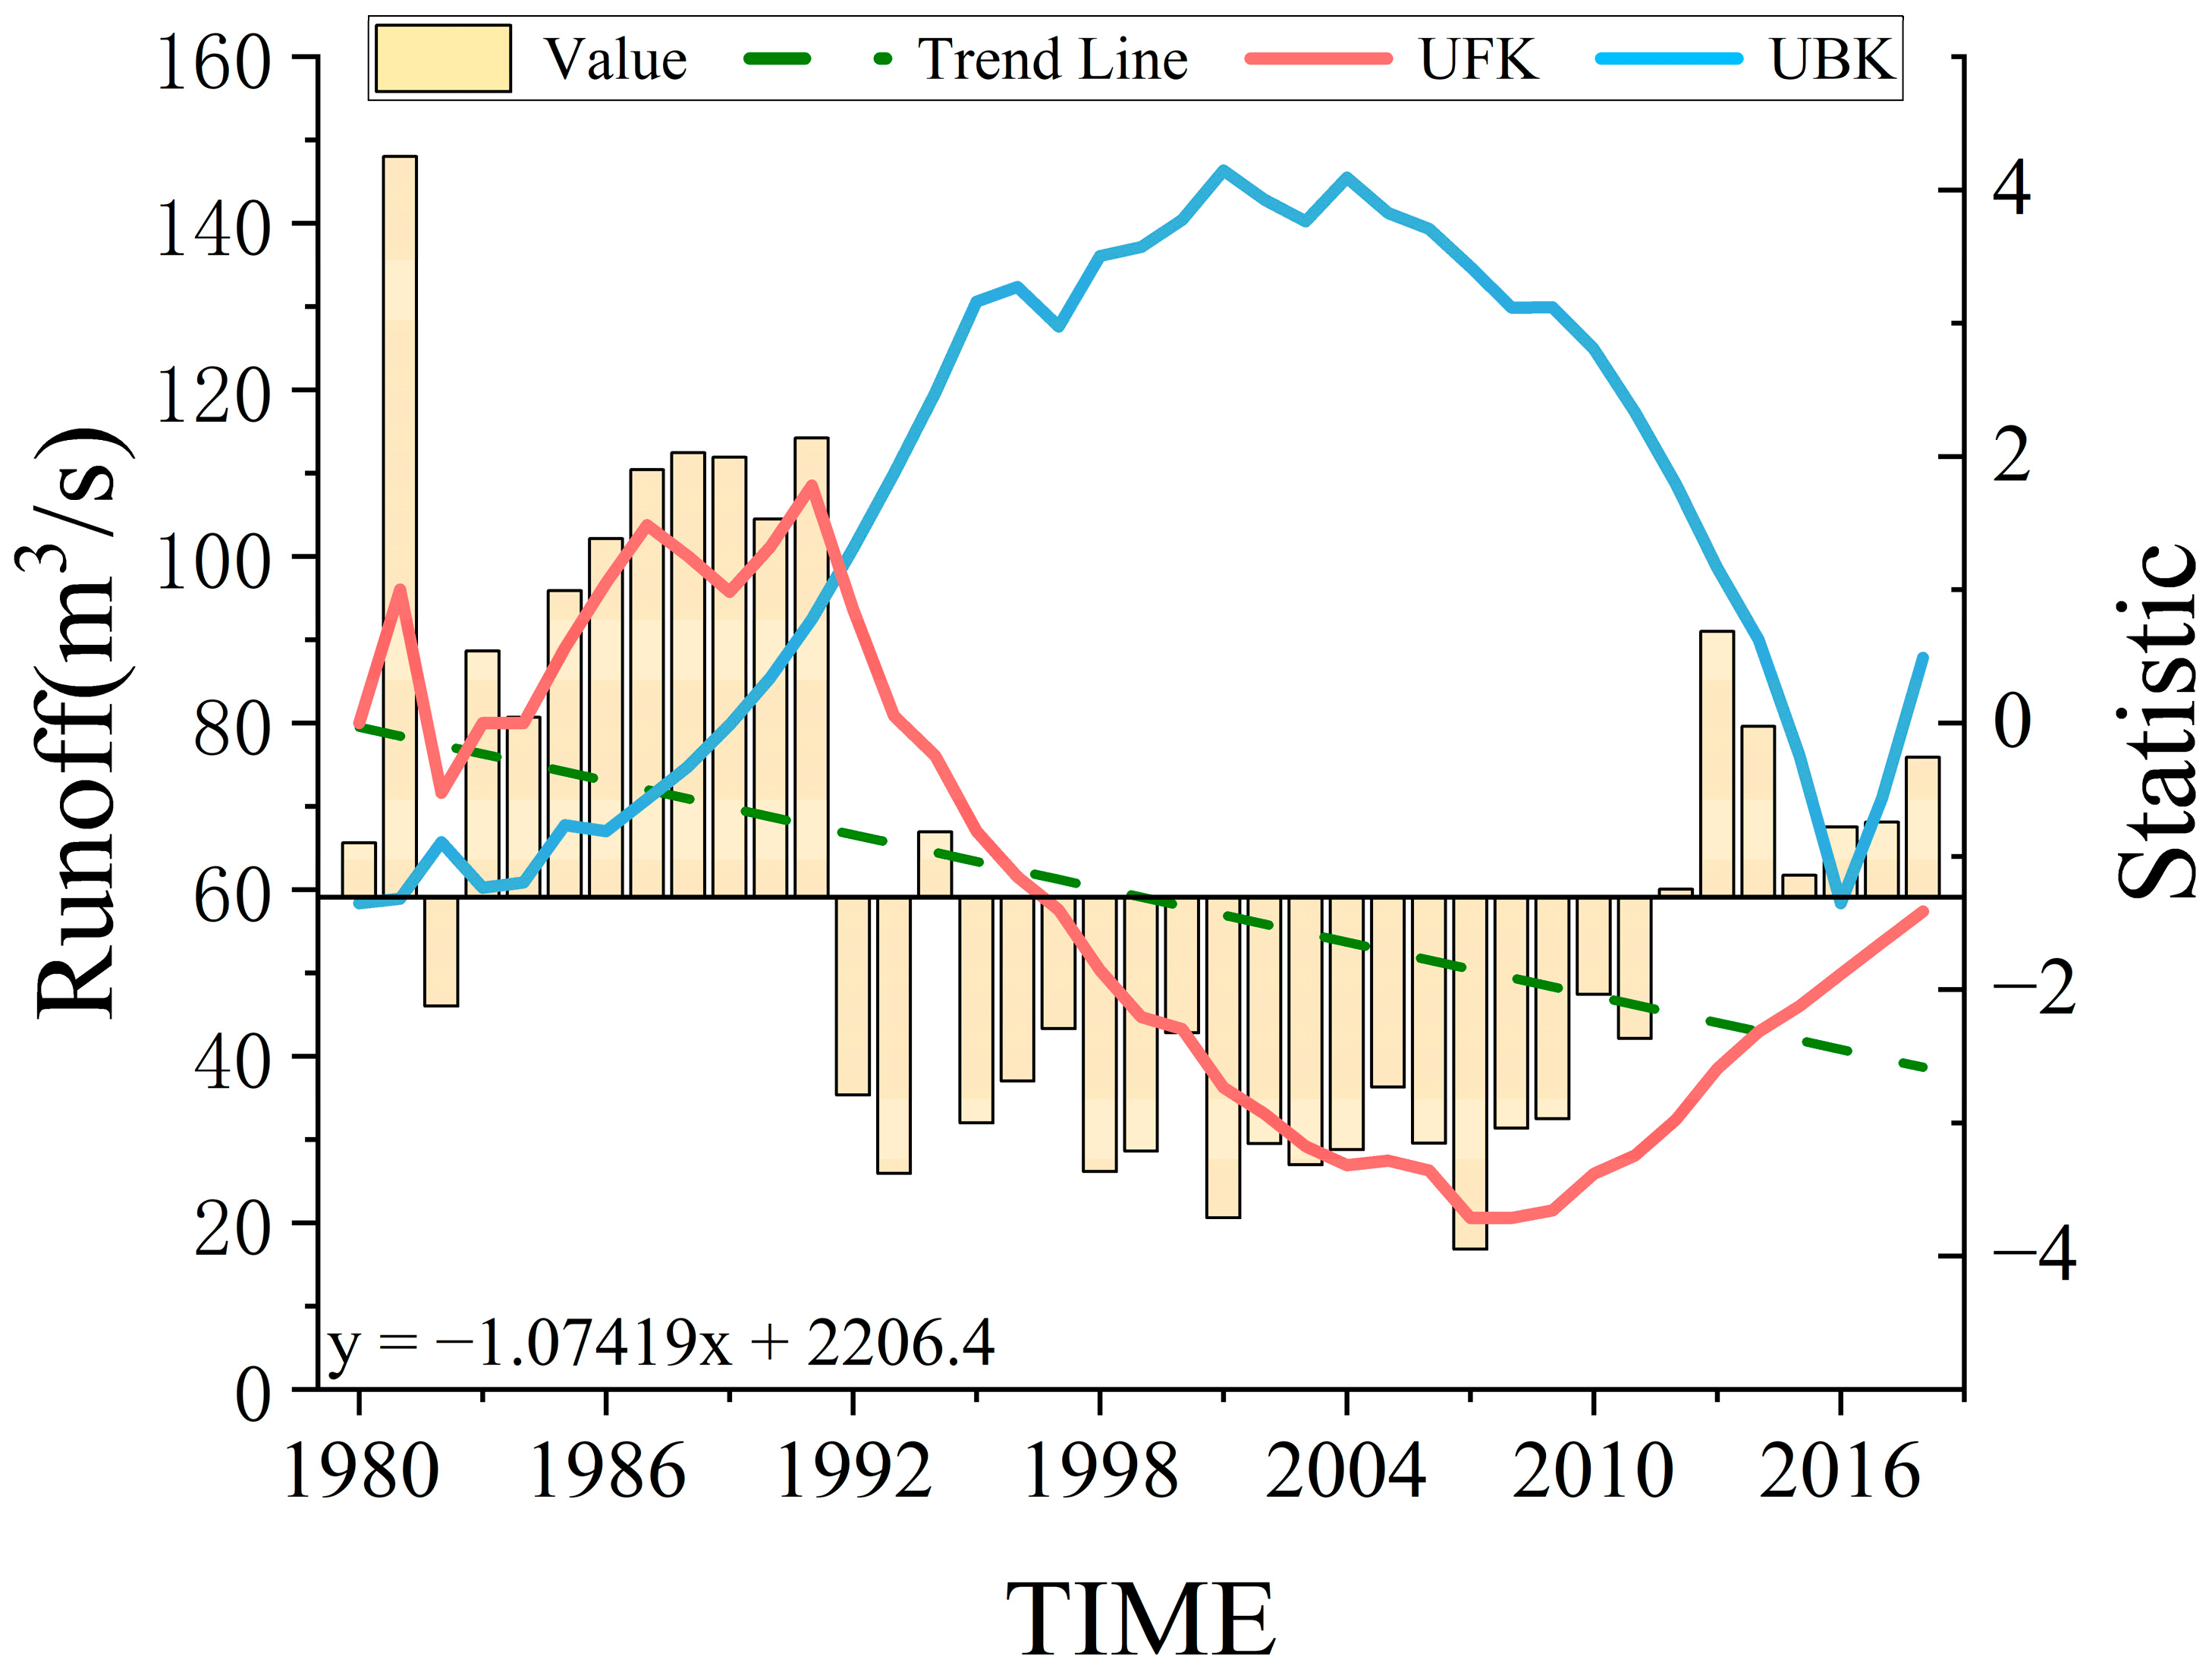
3.1.3. Analysis of Runoff Change

Based on the analysis of the long-term runoff data from 1980 to 2018 in the Muling River basin, the runoff process was analyzed and the mutation test was carried out by the M-K trend test method, as shown in Figure 3. The results showed that the abrupt change year was 1993, the annual average runoff of the Muling River basin was 1.84 billion m3, the baseline period was 1980–1992, and the abrupt change period was 1993–2018.
In order to analyze the influence of different climate change and human activity change on runoff, different scenarios were set by separating different factors for analysis, as shown in Table 2.
The influencing factors corresponding to different scenarios vary. For instance, in Scenario Group A, the variables are controlled as precipitation and temperature factors among meteorological elements. In Scenario Group B, the variables are controlled as land use elements. In Scenario Group C, the variables are controlled as reservoir elements (adding a reservoir module in the SWAT model will exert a considerable influence).

3.2. Effects of Climate Change and Precipitation Change on Runoff

During 1992–2018, compared with 1980–1991, the average annual temperature in the Muling River basin showed an upward trend, increasing by 0.35 °C/a, while the average annual precipitation and the average annual runoff at hydrological stations showed a downward trend, decreasing by 0.02 mm/a and 32.86 m3/s, respectively. Compared with A3 in scenario A1, the average annual runoff decreased by 12.25 m3/s, and the contribution rate of precipitation change to runoff change was 68%; compared with A3 in scenario A2, the average annual runoff decreased by 4.02 m3/s, and the contribution rate of temperature change to runoff change was 22%, as shown in Figure 4.
According to the seasonal temperature, the temperature fluctuates greatly in winter, and is relatively stable in spring, summer, and autumn. According to the 95% significance test, the temperature in spring shows a downward trend, and there is no sudden change point. In summer, the temperature showed a rising trend with no abrupt point. The autumn temperature showed a rising trend with no abrupt point. In winter, the temperature showed a downward trend, and there were two abrupt points: 1990 Q4 and 2000 Q4. According to the seasonal precipitation, spring was relatively stable, and summer, autumn, and winter fluctuated greatly. According to the 95% significance test, the spring precipitation had no significant change, and there was one mutation point of 2007 Q1. Summer precipitation showed a downward trend, and there were two mutation points: 1983 Q2 and 2003 Q2. Autumn precipitation showed a downward trend, with two mutation points: 1994 Q3 and 2011 Q3. In winter, the precipitation showed a downward trend, and there were two mutation points: 1980 Q4 and 1993 Q4.
Therefore, in the scenario, the abrupt point is taken as the focus, the coupling factors of precipitation and temperature are separated, and the influence of a single factor on runoff change is analyzed. According to the analysis of abrupt temperature points, in summer and autumn, the contribution rate of evaporation increase caused by rising temperature is about 48.7%; in winter and spring, due to the presence of snow cover, rising temperature will lead to the melting of snow cover and supply runoff, contributing about 5.66% to the increase in runoff, and the contribution rate of temperature decrease to the decrease in runoff fluctuates between 50% and 60%. Based on the analysis of abrupt precipitation points, the contribution rate of precipitation to the increase in runoff fluctuated between 35% and 47%.

3.3. Influence of Human Activities on Runoff

Although traditional simulation methods can calculate the influence of human activities on runoff, they cannot refine the individual influence of each factor on runoff, so human activities are divided into underlying surface changes (i.e., land use changes) and reservoir effects.
From 1980 to 2018, in addition to the increase in cultivated land area, the other types of land area decreased, as shown in Figure 5 for the specific proportion of change, and Table 3 for the land use transfer matrix.
During 1980–2018, the grassland area in the Muling River basin showed a decreasing trend, from 988 km2 to 766 km2, with a change rate of 22.43%; the cultivated land area showed an increasing trend, from 5812 km2 to 7120 km2, with a change rate of 23.86%; the construction land area showed a decreasing trend, from 484 km2 to 457 km2, with a change rate of 5.54%; the forest area showed a declining trend from 8815 km2 to 8315 km2, with a change rate of 5.67%; the water area showed a decreasing trend from 167 km2 to 127 km2, with a change rate of 24.17%; and the unused land area showed a decreasing trend. From 1062 km2 to 464 km2, the rate of change was 56.29%. Among them, the growth rate of cultivated land area is the highest, the reduction rate of unused land area is the largest, and the increase rate of cultivated land area is also the largest. The interaction between local economic policies, urban policies, land policies, and ecological policies can be confirmed from the perspective of land use change. Compared with B1, the average runoff in scenario B2 increased by 2.8 m3/s, with a contribution rate of 16%. In order to explore the impact of different types of land use on runoff, an extreme scenario was set, which meant that all land use types in the basin were artificially set into one type of land use. The classification and contribution rate of extreme scenarios are shown in Table 4.
Among them, only the increase in forest land and grassland leads to the decrease in runoff, and the increase in other land use types will lead to an increase in runoff. The contribution rate of construction land to runoff was the largest, followed by cultivated land, and the contribution rate of forest land and grassland to runoff reduction was similar.
The average runoff of scenario C2 and C1 decreased by 7.45 m3/s, and the contribution rate was 42.5%. In summary, the precipitation factor is the main factor of the runoff reduction in the Muling River basin.

3.4. Influence of SWAT-CUP Parameters on Simulation

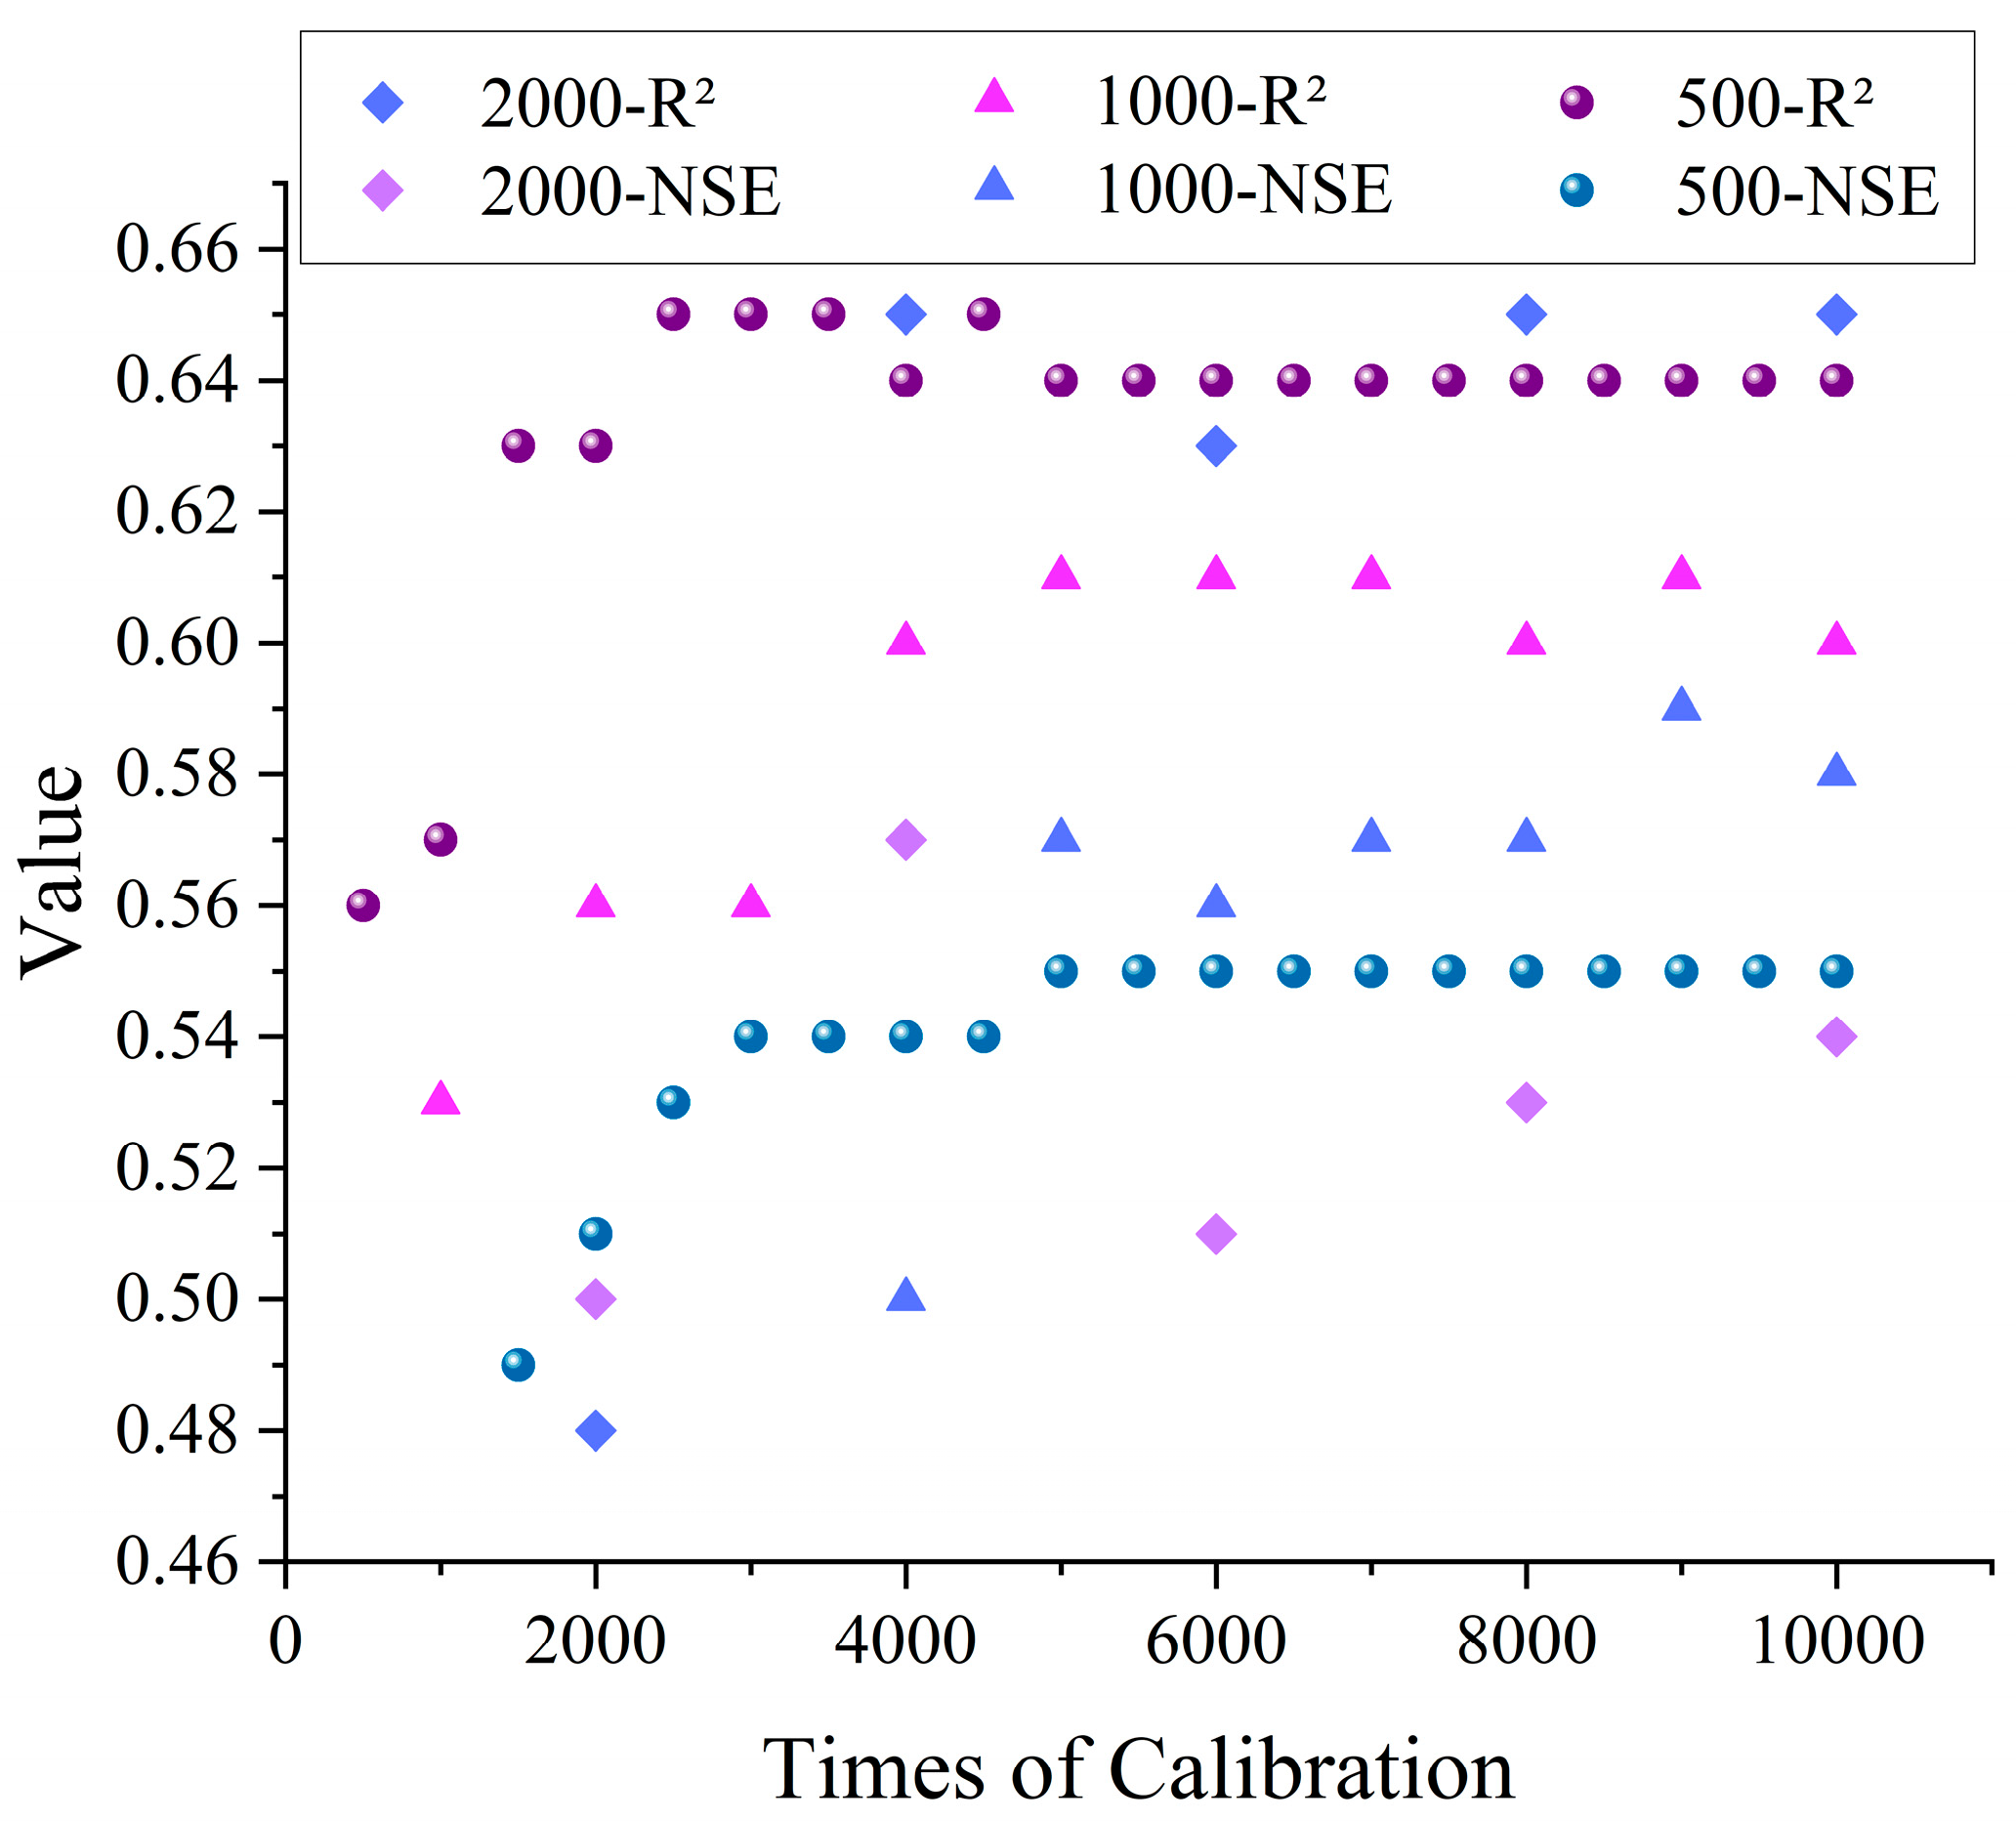
3.4.1. Influence of Different Single Calibration Times on Simulation

In SWAT-CUP, the SUFI-2 algorithm is adopted for parameter calibration, which adopts Latin hypercube sampling, which is a sampling method that can divide different parameter spaces into equal intervals to achieve a more efficient and uniform exploration of multidimensional parameter space. In hydrological models, different parameters have great influence on each other. Therefore, finding the right number of single calibration times can better exert the efficacy of the SUFI-2 algorithm. In order to explore the influence of different calibration times on the simulation results, the total calibration times were set to 10,000 times, and the single calibration times were set to 500, 1000, and 2000 (the maximum value of single calibration), respectively. The calibration results are shown in Figure 6.
Compared with the figure, it is found that the peak value of a single rate setting of 2000 times is the most obvious. The effect of a single rate setting of 1000 times is worse in the early stage and better in the middle stage, but it does not rise significantly in the later stage. The effect of a single rate setting of 500 times reaches the peak value at the 10th time and then no longer changes. An NSE with a single rate of 2000 times has the worst simulation effect but its R2 is the best; an NSE with a single rate of 1000 times has the best simulation effect, and 500 times has the best overall effect.

3.4.2. Influence of Parameter Sensitivity on Simulation

At the same time, the sensitivity of the parameters was analyzed. Thirty-one calibration parameters [33,34,35,36] were selected according to the climate conditions of the study area and the simulated project, and parameters with a p-value < 0.3 were identified as sensitive parameters. A single calibration setting of 500 times, with good calibration results, was selected as the research object. The sensitive parameters are shown in Table 5.
Since the value of each parameter no longer changes after 10 rounds of calibration, the results of the first 10 rounds of calibration are selected as the analysis object. In the early stage of calibration, the sensitivity of all parameters fluctuated greatly, and a small number of soil parameters and river parameters maintained high sensitivity. In the middle stage of calibration, new parameters gradually showed high sensitivity, while the sensitivity of original parameters changed little. In the late stage of calibration, the sensitivity of all parameters tended to be stable, and the highly sensitive parameters mainly included soil-related parameters, river channel-related parameters, and snowmelt-related parameters.

4. Discussion

Generally speaking, the SWAT model can simulate well the change trend [37] of river runoff with less human intervention. However, in the Muleng River basin, there are large reservoirs in the upper reaches for water supply regulation, cities in the middle reaches for water intake, and farms in the lower reaches for water intake and irrigation, and the river is greatly influenced by human beings, resulting in the simulation result of the SWAT model only reaching good calibration. In addition, under the condition of rivers in cold areas, since the snowmelt module of the SWAT model cannot fully and accurately describe the snowmelt process and results in the basin, it is necessary to improve the snowmelt module according to the measured data. This point was also emphasized by Ci [38] et al. For example, compared with the Shiyang Lake basin [39], the Muleng River basin has obvious precipitation in winter and increased runoff in spring, resulting in two obvious peaks of annual runoff, which lead to the poor simulation effect of the SWAT model. CMADS data also play an indispensable role in the process of runoff simulation, providing more accurate precipitation data and meteorological data. At the same time, refined stations also provide rich weather data for the simulation of runoff. It can be seen that CMADS data are also highly applicable in the simulation of river runoff in cold areas [40,41].

4.1. Influence of Climate Change on Runoff

The temperature and precipitation in the study area are not distributed according to common laws. The middle of the basin is close to Xingkai Lake, which leads to a high temperature throughout the year, while the southwest part of the basin, located in the Laoyeling Mountain Range, is low throughout the year because the elevation and mountains block the heat flow from the south. The rest of the basin is distributed according to normal distribution laws, but the average temperature of the whole basin is the same as in the IPCC report. In contrast to the rule of temperature, in spring, the northern part of the basin has higher latitude and more precipitation than other parts, and the higher altitude in the southwest part of the basin also leads to more precipitation. In summer, autumn and winter, the normal precipitation law is followed. The presence of Xingkai Lake in the central part of the basin leads to less precipitation throughout the year.
In this study, climate change is divided into annual and quarterly analyses. The annual cycle analysis can obtain the change law of runoff on a larger scale, which can predict the future trend of river change. The same law is also shown in the Gomti basin [42]. The runoff change rule of short-term change can be obtained by analyzing the abrupt change point. In the context of global warming, the instability of the climate system continues to rise, and the probability of extreme weather is also increasing [43], which may lead to sharp changes in runoff. The analysis of abrupt change points can predict the short-term situation in the future according to extreme weather. In addition, the impact of temperature and precipitation on runoff is greater than that of coupled climate change, which indicates that the impact of climate action on runoff is not the impact of a single factor, but the joint impact of two or more factors on runoff, which may lead to the increase in runoff or the decrease in runoff.

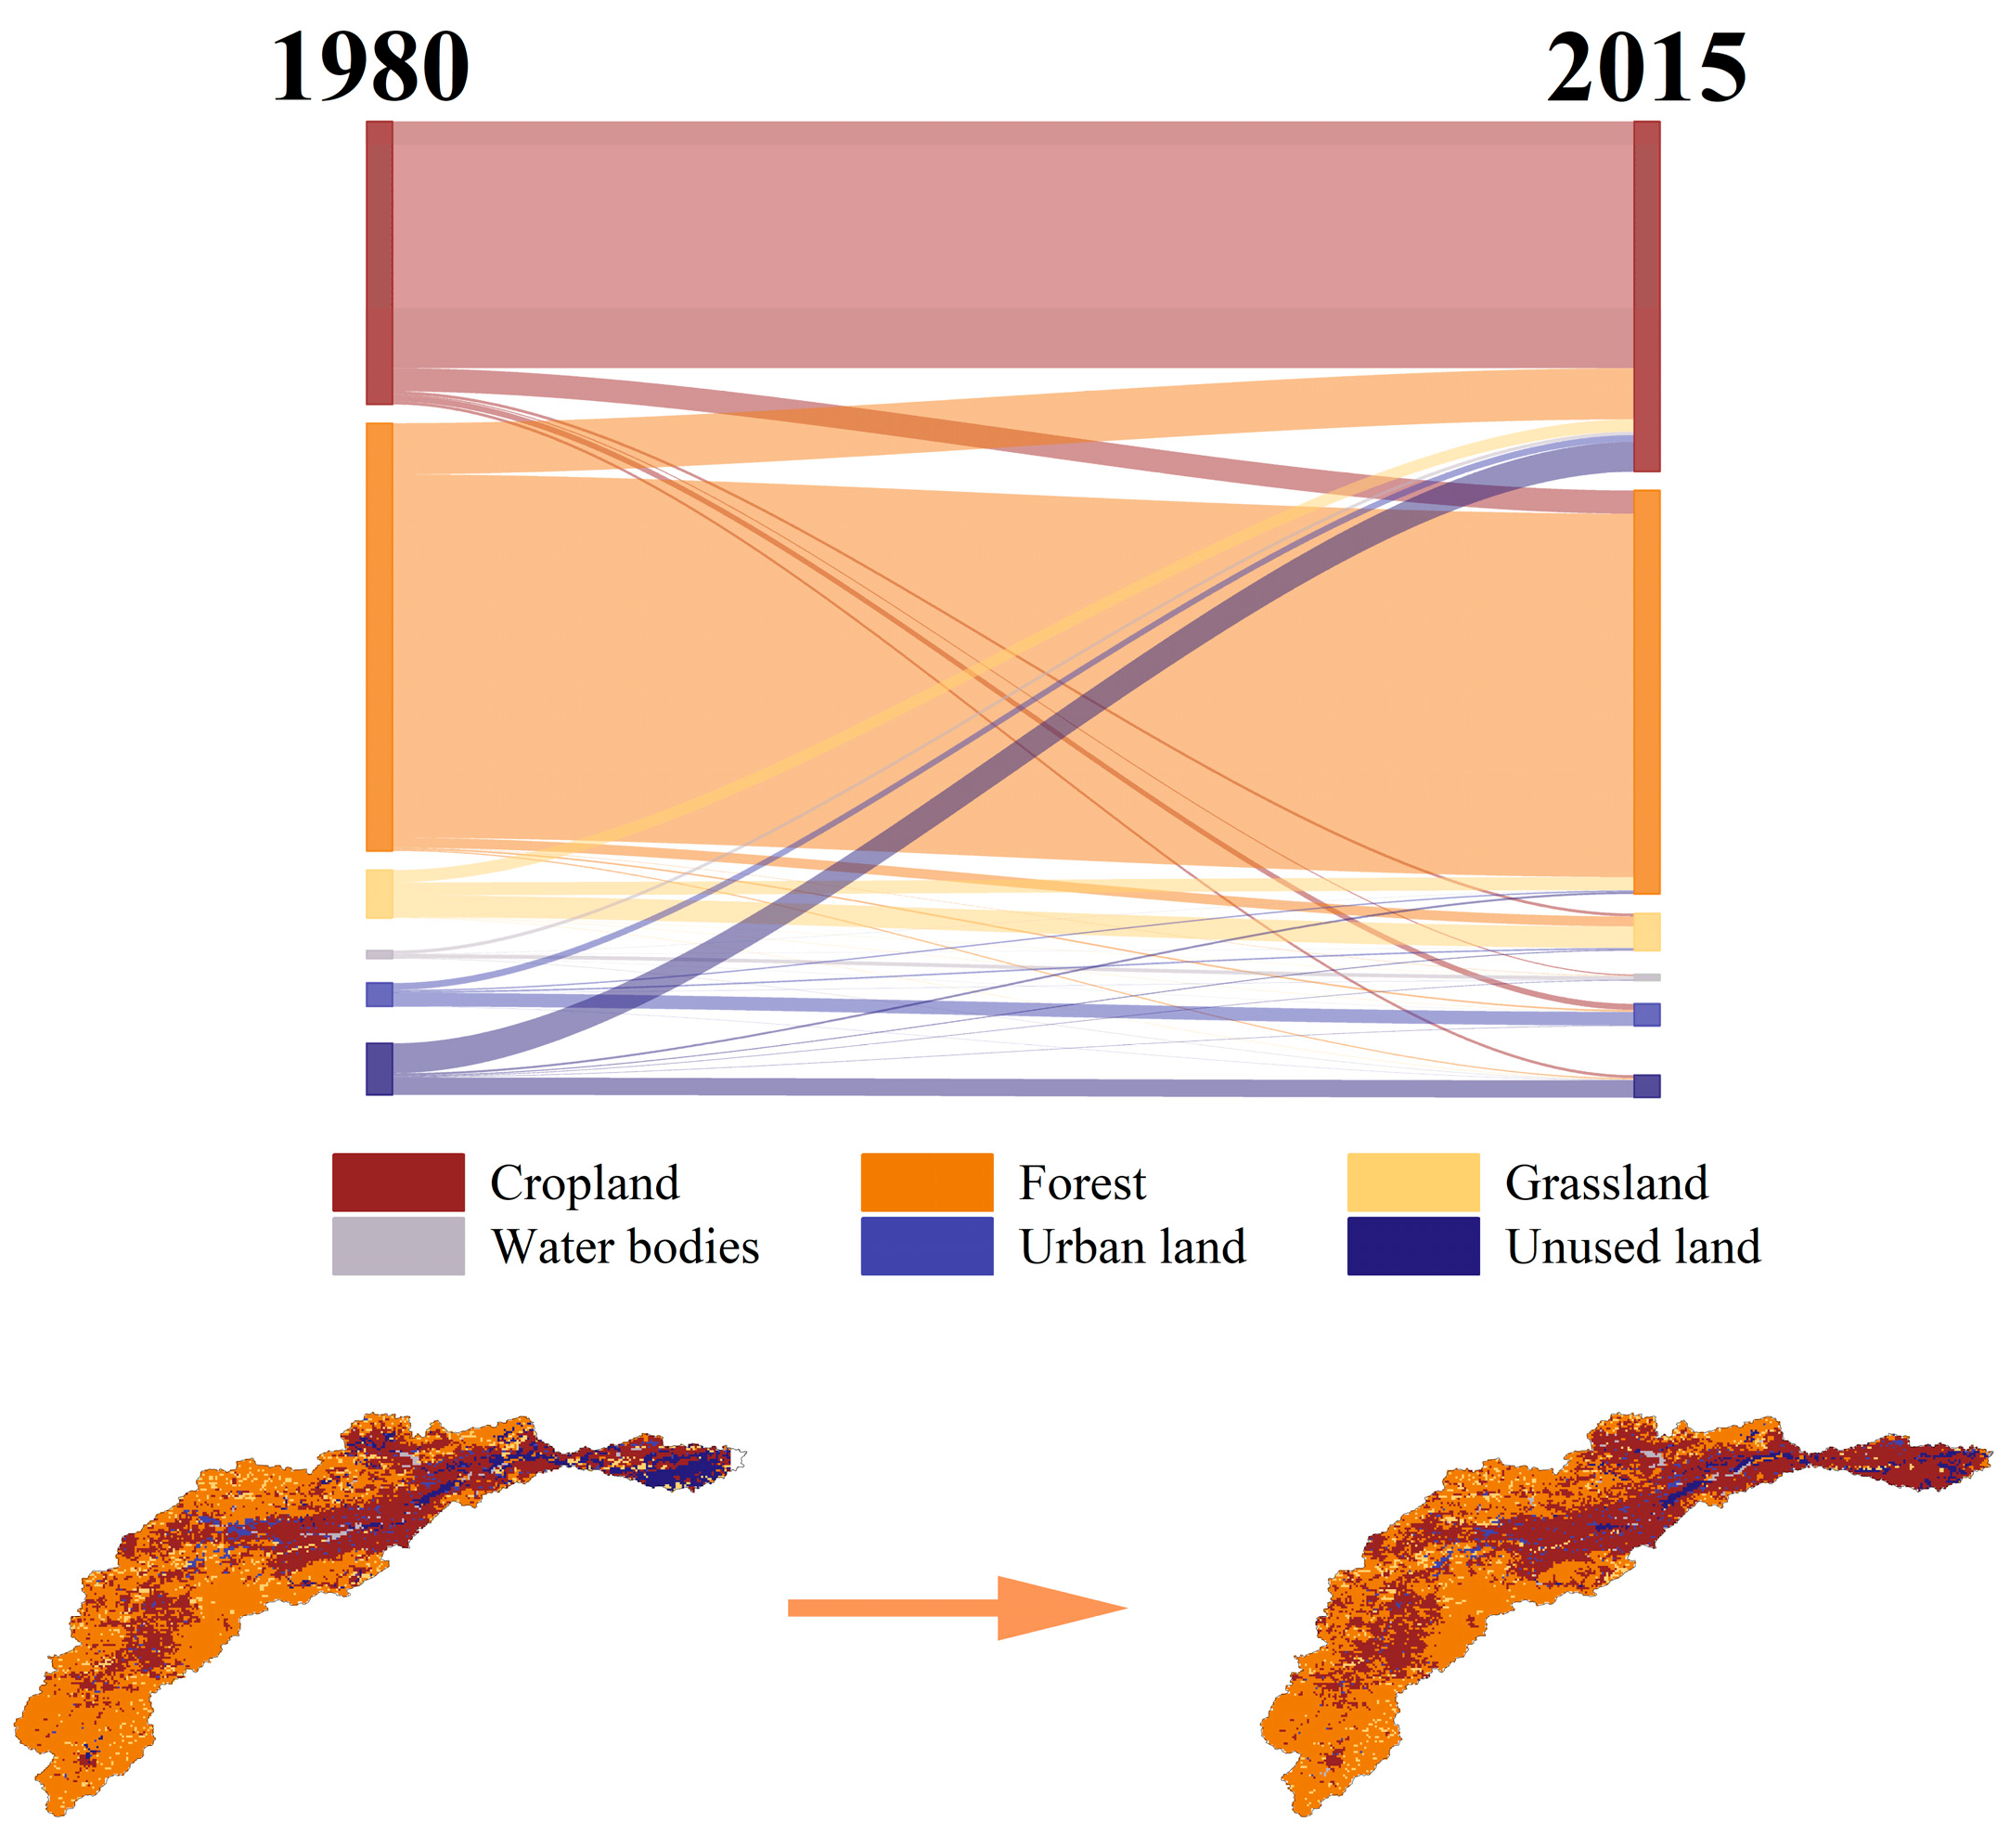
4.2. Influence of Land Use Types on Runoff

The effects of different types of land use on runoff are different. Farming activities and mechanized operations will lead to soil structure compaction and greatly reduce soil porosity and permeability. At the same time, plant roots will also enhance soil water and water conservation ability, resulting in increased surface runoff, which also reflects the same characteristics [44] in the Hetao oasis near the Yellow River. Due to canopy interception, some precipitation of grassland and forest land evaporates in the canopy, which increases evaporation and decreases the amount of precipitation directly reaching the ground, thus reducing runoff. In the construction land, urbanization will lead to the formation of a large area of impervious water surface, resulting in an almost complete loss of precipitation in the form of runoff. Meanwhile, the perfect drainage system in the city will also supplement runoff [45] to a large extent. The same effect [34] is observed in the Andean river basin, suggesting that land use affects runoff in the same way in the tropics and temperate zones, although it is reasonable to suspect that land use affects runoff differently in the cold zone due to the presence of permafrost [46].

4.3. Influence of SWAT-CUP on Runoff

Through comparative study, it is found that a greater number of single calibration runs in SWAT-CUP is not better. Due to the ability of the SUFI-2 algorithm to classify different parameter intervals, it is reasonable to guess that the best number of single calibration times will change with the change in calibration parameters, while the total number of calibration times has no obvious change trend. For example, a SWAT-CUP project with a single rate of 500 times no longer changes after a rate of 5000 times, a SWAT-CUP project with a single rate of 1000 times starts to fluctuate slightly after a rate of 7000 times, and a SWAT-CUP project with a single rate of 2000 times reaches a peak value at 4000 times and then starts to decline and then slowly rises. The sensitivity of parameters is also another major factor affecting the calibration results. In the runoff simulation of rivers in cold areas, soil parameters are more sensitive in the early stage of the calibration. This is because in the SWAT model, when the precipitation initially reaches the soil, its infiltration rate is usually very high, and with the increase in soil moisture, the infiltration rate gradually decreases, and when the rainfall intensity is greater than the infiltration rate, depression filling begins. When the surface depression is filled, surface runoff will be generated. In the middle period of rate calibration, the sensitivity of parameters related to evapotranspiration and snowmelt is greatly increased, because evapotranspiration is the main method of water loss in a basin. Studies have shown that evapotranspiration is greater than runoff [47] in most basins in other states except Antarctica. Meanwhile, the study area is located in a cold region with a large number of farms downstream, and canopy interception [48] is also one of the sources of evapotranspiration that cannot be ignored. Spring snowmelt recharge in the cold region will also have a considerable impact [49] on runoff. Soil parameters are still very sensitive at the later stage of the evaluation, and groundwater parameters are also becoming more sensitive, because the water entering the soil moves along different paths, can be absorbed by plants, can be lost by evaporation, and can leach into the aquifer. The groundwater content will affect the infiltration of surface runoff as well as the recharge of surface runoff [50]. For other medium-sized rivers in cold areas, the regularity of this study can also be referred to.

4.4. Future Work

Although this study analyzed the effects of different land use types and climate change on runoff, and took into account the effects of SWAT-CUP on the simulation results of runoff, there are still some uncertainties. First of all, in the process of SWAT model simulation, there is a large amount of water withdrawn from farms downstream of the basin, including surface water, groundwater, and possibly precipitation. In hydrological simulation, precipitation, surface water, and groundwater are interrelated and interact with each other, so the influence of farm water consumption is not considered in this study. Secondly, in the SWAT-CUP calibration process, the 500 and 1000 single calibration times finally present two different sets of parameters, which is because only surface runoff is determined at the calibration time, and there are uncertainties in the hydrological process. The calibration algorithm often adopts a large number of simplified mathematical models to carry out approximate simulation. Ignoring the joint action of different influencing factors, the two sets of parameters eventually occur.
This study only conducted an attribution analysis of the runoff volume changes of the Muling River during historical periods and did not consider the impact of changes under future climate scenarios. Meanwhile, in order to show the year-round trend in the watershed more clearly, runoff changes can be analyzed quarterly in future studies, which will avoid smoothing out part of the hydrological trend due to the long time scale. Subsequent studies can combine CMIP6 data to simulate the runoff volume of the basin under future climate scenarios. Meanwhile, the land use type within the basin is mainly agricultural land, and crops may have an impact on soil water, thereby affecting the runoff volume.

5. Conclusions

This paper simulated and analyzed the runoff characteristics of the Muling River basin from 1980 to 2018 by the SWAT model, and analyzed the effects of different meteorological conditions, different land use changes, and other human activities on the runoff changes. The main conclusions are as follows:
  • The SWAT model has good applicability in the Muling River basin. The runoff of the Muling River basin showed a significant decreasing trend from 1980 to 2018, and the abrupt change year was 1992.
  • Under the hydrological conditions of the Muling River basin, the response of river runoff to human activities is more pronounced than that to climate change. Among the subdivisions of climate change, precipitation changes have a greater impact on runoff than temperature changes. In the classification of human activities, reservoirs exhibit the most significant impact on runoff changes, while different types of land use changes also lead to varying effects on runoff: an increase in grassland and forest land will reduce runoff, whereas an increase in construction land and cultivated land will increase runoff. At different time scales, the influence of precipitation on runoff is more pronounced at the seasonal scale than at the annual scale. Therefore, when managing the water resources in the Muling River basin, in order to prevent the river from affecting the production and life within the basin, special attention should be paid to the impact of short-term precipitation on the basin, and the influence of different land use types within the basin on the runoff volume should also be taken into consideration.
  • Within a specific range of parameter quantities, different numbers of calibration trials yield distinct effects. For example, in this experiment, a single calibration count of 500 times produced the optimal overall performance, and different types of parameters also exhibited discernible patterns during the overall calibration process. Additionally, when targeting a specific watershed, selecting different parameters can lead to varied impacts on the calibration results.

Author Contributions

All authors contributed to the study conception and design. Material preparation, data collection, and analysis were performed by X.M., C.-L.D., Y.-D.Z., G.-W.L., X.Y. and X.F. The first draft of the manuscript was written by X.M. and C.-L.D. and all authors commented on previous versions of the manuscript. All authors have read and agreed to the published version of the manuscript.

Funding

This work was supported by the Northeast Institute of Geography and Agroecology, Chinese Academy of Sciences (Grant number: XDA28100105). Author Chang-Lei Dai has received research support from the Northeast Institute of Geography and Agroecology, Chinese Academy of Sciences.

Data Availability Statement

Data are available on request to the corresponding author Chang-Lei Dai.

Conflicts of Interest

The authors have no relevant financial or non-financial interest to disclose.

References

  1. IPCC. Climate Change 2022: Mitigation of Climate Change; IPCC: Geneve, Switzerland, 2022. [Google Scholar]
  2. Liu, C.; Chao, Q.; Wang, S.; Liu, Z. Advances in hydrologic cycle research in hydrometeorology. Adv. Clim. Change Res. 2023, 19, 1–10. [Google Scholar]
  3. Lian, Y.; Sun, M.; Wang, J.; Luan, Q.; Jiao, M.; Zhao, X.; Gao, X. Quantitative impacts of climate change and human activities on the runoff evolution process in the Yanhe River Basin. Phys. Chem. Earth 2021, 122, 102998. [Google Scholar] [CrossRef]
  4. Villoria, N. Consequences of agricultural total factor productivity growth for the sustainability of global farming: Accounting for direct and indirect land use effects. Environ. Res. Lett. 2019, 14, 125002. [Google Scholar] [CrossRef]
  5. Pei, Y.; Liu, J.; Wang, J.; Mei, C.; Dong, L.; Wang, H. Effects of urbanization on extreme precipitation based on Weather Research and Forecasting model: A case study of heavy rainfall in Beijing. J. Hydrol. Reg. Stud. 2024, 56, 102078. [Google Scholar] [CrossRef]
  6. Yang, L.; Feng, Q.; Yin, Z.; Wen, X.; Si, J.; Li, C.; Deo, R.C. Identifying separate impacts of climate and land use/cover change on hydrological processes in upper stream of Heihe River, Northwest China. Hydrol. Process. 2017, 31, 1100–1112. [Google Scholar] [CrossRef]
  7. Guo, J.; Su, X.; Singh, V.P.; Jin, J. Impacts of Climate and Land Use/Cover Change on Streamflow Using SWAT and a Separation Method for the Xiying River Basin in Northwestern China. Water 2016, 8, 192. [Google Scholar] [CrossRef]
  8. Ma, Y.; Jiang, Y.; Wang, F.; Lu, S.; Liu, Y. Characterization and attribution of runoff changes in the upper Niyang River basin. South-North Water Divers. Water Resour. Sci. Technol. 2025, 1–10. [Google Scholar]
  9. Yi, L.; Chen, F.; Han, J.; Liu, X.; Yang, J.; Zhou, Z.; Lu, X.; Ma, Z.; Wei, H.; Han, F. Distributed hydrological simulation and runoff prediction of the upper Golmud River based on SWAT model. Salt Lake Res. 2024, 32, 1–10. [Google Scholar] [CrossRef]
  10. Wang, Z.; Gu, H.; Wang, X.; Dai, B.; Zhang, H.; Fu, X.; Yu, Z. Modeling of water-sediment processes and their response to vegetation cover and climate change in the Lhasa River Basin. Hydrology 2023, 43, 91–96. [Google Scholar] [CrossRef]
  11. Qi, X.; Yang, Y.; Han, C.; Li, J.; Li, J.; Liu, Z.; Li, M.; Zhang, X.; Bao, W.; Lu, S.; et al. Impacts of climate change on surface runoff in the Yangtze River source area. J. Nanjing Norm. Univ. 2022, 45, 81–90. [Google Scholar]
  12. He, X.; Miao, Z.; Tian, J.; Yang, L.; Zhang, Z.; Zhu, B. Multi-modeling based on CMIP 6. Multi-model prediction of temperature, precipitation and runoff in the Yangtze River Basin based on CMIP 6. J. Nanjing For. Univ. 2024, 48, 1–8. [Google Scholar]
  13. Yang, Y.; Ma, L.; Li, S.; Gao, Y.; Li, M.; Liu, Z.; Si, J.; Lu, S.; Chen, Y.; Li, Z.; et al. Construction of SWAT hydrological model database for the Yangtze River source area and model calibration and validation. J. Anhui Univ. 2022, 46, 76–84. [Google Scholar]
  14. Zheng, P.; Chen, Y.; Wang, H.; Yang, Y. Impacts of climate change on extreme runoff in the Tien Shan region—A case study of the Kaidu River. J. Irrig. Drain. 2024, 43, 105–112. [Google Scholar] [CrossRef]
  15. Jiang, N.; Ni, F.Q.; Deng, Y.; Xiang, J.; Wu, M.Y.; Kang, W.D.; Yue, Z.Y. CMIP6-based runoff prediction in the MinTuo River Basin. J. Water Ecol. 2024, 1–13. [Google Scholar] [CrossRef]
  16. Guo, X.; Jia, Y.; Fan, L.; Wang, G. Impacts of climate change and human activities on watershed runoff and its intra-annual distribution. J. Water Resour. Transp. Eng. 2024, 1–12. [Google Scholar]
  17. Wang, F.; Hong, L.; Ma, T.; Tunyaz, J.; Xiong, J. Changes of runoff in Nomin River Basin under climate change conditions based on SWAT model. Soil Water Conserv. Res. 2023, 30, 67–77. [Google Scholar] [CrossRef]
  18. Zhou, F.; Li, H.; Liu, R. Simulation of runoff in the Qingshui River Basin under future climate change and land use scenarios. Hydropower Energy Sci. 2023, 41, 11–14+102. [Google Scholar] [CrossRef]
  19. Wang, R.; Dai, C.; Yu, C.; Chen, L. Hydrological response of runoff to climate change in the Huma River Basin based on the SWAT model. Hydropower Energy Sci. 2023, 41, 27–30. [Google Scholar] [CrossRef]
  20. Deng, R.; Zhnag, Z.; Chen, Y. Response of surface runoff to land use change in the lower Jialing River Basin. Soil Water Conserv. Res. 2019, 26, 141–147. [Google Scholar] [CrossRef]
  21. Wang, H.X.; Liu, J.H.; Zhao, Y.I.; Guo, L. Water-sand changes and attribution analysis in the lower Yellow River. People’s Yellow River. 2021, 43, 24–29+71. [Google Scholar]
  22. Liu, W.; Li, P.; Qiao, Z.; Xie, Z.; Tang, L. Impacts of land use change on water supply and flood regulation services in a river basin. J. Hydropower Gener. 2025, 44, 77–97. [Google Scholar]
  23. Liu, W.; Wu, J.; Xu, F.; Mu, D.; Zhang, P. Modeling the effects of land use/land cover changes on river runoff using SWAT models: A case study of the Danjiang River source area, China. Environ. Res. 2024, 242, 117810. [Google Scholar] [CrossRef]
  24. Li, Y.; He, H.; Jin, S.; Wu, Z.; Li, Y. Attribution analysis of runoff change in Luo River based on improved hydrological simulation. China Rural. Water Conserv. Hydropower 2024, 6, 56–63. [Google Scholar]
  25. Lu, Z.; Zhang, J.; Li, C.; Dong, Z.; Lei, G.; Yu, Z. Effects of land use change on runoff depth in the Songnen Plain, China. Sci. Rep. 2024, 14, 24464. [Google Scholar] [CrossRef]
  26. Huang, T.; Liu, Y.; Jia, Z.; Zou, J.; Xiao, P. Applicability of attribution methods for identifying runoff changes in changing environments. Sci. Rep. 2024, 14, 26100. [Google Scholar] [CrossRef]
  27. Sreedevi, S.; Eldho, T.I.; Jayasankar, T. Physically-based distributed modelling of the hydrology and soil erosion under changes in landuse and climate of a humid tropical river basin. CATENA 2022, 217, 106427. [Google Scholar] [CrossRef]
  28. Yan, Y.; Ding, H.; Zhang, J.; Gao, Y. Evolution and attribution of runoff in the west-flowing Songhua River Basin. Pearl River 2025, 46, 10–20. [Google Scholar]
  29. Zheng, D.; Wang, Z. Attribution analysis of runoff in the upper reaches of the Hun River based on Budyko theory. Jilin Water Resour. 2025, 5, 33–38. [Google Scholar] [CrossRef]
  30. Lv, S.; Tang, Y.; Tang, Q.; Li, H.; Xiao, H.; Xie, D. Impacts of climate change on annual and seasonal runoff in the Lena River Basin. J. Geogr. Sci. 2024, 79, 2811–2829. [Google Scholar]
  31. Zhao, Y.; Sun, Y.; Huang, X. A study of runoff changes in the upper Tangwang River basin based on the CMIP-6 climate model. Pearl River. 2025, 46, 109–117. [Google Scholar]
  32. Cao, Z.Y. Characteristics of intra-annual distribution of runoff in the upper Muleng River Basin. Hydropower Energy Sci. 2019, 37, 21–25. [Google Scholar] [CrossRef]
  33. Zare, M.; Azam, S.; Sauchyn, D. A Modified SWAT Model to Simulate Soil Water Content and Soil Temperature in Cold Regions: A Case Study of the South Saskatchewan River Basin in Canada. Sustainability 2022, 14, 10804. [Google Scholar] [CrossRef]
  34. Valencia, S.; Villegas, J.C.; Hoyos, N.; Duque-Villegas, M.; Salazar, J.F. Streamflow response to land use/land cover change in the tropical Andes using multiple SWAT model variants. J. Hydrol.-Reg. Stud. 2024, 54, 101888. [Google Scholar] [CrossRef]
  35. Tilahun, Z.A.; Bizuneh, Y.K.; Mekonnen, A.G. The combined effects of LULC changes and climate change on hydrological processes of Gilgel Gibe catchment, southwest Ethiopia. Cogent Soc. Sci. 2025, 11, 2473644. [Google Scholar] [CrossRef]
  36. Yang, W.; Liang, Z.; Pei, Z.; Lei, J.; Yang, X. Simulation and analysis of water environment capacity in alpine watershed based on SWAT-WASP: A case study of Luqu in Taohe River. China Environ. Sci. 2025, 1–15. [Google Scholar] [CrossRef]
  37. Zhao, J.; Zhang, N.; Liu, Z.; Zhang, Q.; Shang, C. SWAT model applications: From hydrological processes to ecosystem services. Sci. Total Environ. 2024, 931, 172605. [Google Scholar] [CrossRef]
  38. Jitan, Y.; Li, H.; Li, X. Rates of spatial heterogeneity of snowmelt runoff in the SWAT model in the cold region of Northeast China: A case study in the Baishan Basin. J. Jilin Univ. 2023, 53, 230–240. [Google Scholar] [CrossRef]
  39. Cao, J.J.; Ma, H.H. Impacts of climate and land use change on natural runoff in the Shiyang River Basin. China Agric. Meteorol. 2024, 45, 1290–1301. [Google Scholar]
  40. Tan, M.L.; Gassman, P.W.; Liang, J.; Haywood, J.M. A review of alternative climate products for SWAT modelling: Sources, assessment and future directions. Sci. Total Environ. 2021, 795, 148915. [Google Scholar] [CrossRef]
  41. Wang, X.; Zhou, J.; Ma, J.; Luo, P.; Fu, X.; Feng, X.; Zhang, X.; Jia, Z.; Wang, X.; Huang, X. Evaluation and Comparison of Reanalysis Data for Runoff Simulation in the Data-Scarce Watersheds of Alpine Regions. Remote Sens. 2024, 16, 751. [Google Scholar] [CrossRef]
  42. Abeysingha, N.S.; Islam, A.; Singh, M. Assessment of climate change impact on flow regimes over the Gomti River basin under IPCC AR5 climate change scenarios. J. Water Clim. Change 2020, 11, 303–326. [Google Scholar] [CrossRef]
  43. Li, M.; Deng, G.; Shao, X.; Yin, Z.-Y. Precipitation variation since 1748 CE in the central Lesser Khingan Mountains, Northeast China. Ecol. Indic. 2021, 129, 107969. [Google Scholar] [CrossRef]
  44. Wu, Y.; Li, C.; Zhang, C.; Shi, X.; Bourque, C.P.-A.; Zhao, S. Evaluation of the applicability of the SWAT model in an arid piedmont plain oasis. Water Sci. Technol. 2015, 73, 1341–1348. [Google Scholar] [CrossRef]
  45. Worku, T.; Khare, D.; Tripathi, S.K. Modeling runoff–sediment response to land use/land cover changes using integrated GIS and SWAT model in the Beressa watershed. Environ. Earth Sci. 2017, 76, 550. [Google Scholar] [CrossRef]
  46. Nikiforov, D.; Stepanov, S.; Lazarev, N. Meshfree multiscale method for the infiltration problem in permafrost. J. Comput. Appl. Math. 2024, 449, 115988. [Google Scholar] [CrossRef]
  47. Guerra, L.; Piovano, E.L.; Córdoba, F.E.; Sylvestre, F.; Damatto, S. The hydrological and environmental evolution of shallow Lake Melincué, central Argentinean Pampas, during the last millennium. J. Hydrol. 2015, 529, 570–583. [Google Scholar] [CrossRef]
  48. Gao, X.-G.; Wang, J.-P.; Ge, S.; Su, S.-K.; Bai, M.-H.; Francois, B. Investigation of canopy interception characteristics in slope protection grasses: A laboratory experiment. Sci. Total Environ. 2024, 948, 174731. [Google Scholar] [CrossRef]
  49. Zhao, H.L.; Li, H.Y.; Xuan, Y.Q.; Bao, S.S.; Cidan, Y.; Liu, Y.Y.; Li, C.H.; Yao, M.C. Investigating the critical influencing factors of snowmelt runoff and development of a mid-long term snowmelt runoff forecasting. J. Geogr. Sci. 2023, 33, 1313–1333. [Google Scholar] [CrossRef]
  50. Wei, H.; He, Y.; Peng, L.; Zhang, Z.; Lou, W.; Zhu, K.f.; Zhang, K.n. Remediation of Cr(VI) contaminated soil-groundwater using in-situ injection of calcium polysulfide: Results from a 3D sandbox model experiment. J. Water Process Eng. 2024, 68, 106465. [Google Scholar] [CrossRef]
Figure 1. Overview of the research area. CMe: eutric cambisols; Fle: eutric fluvisols; GLm: mollic gleysols; His: gelic histosols; LVh: haplic luvisols; PDg: gleyic podzoluvisols; PHg: gleyic phaeozems; AGRL: agricultural land—generic; FRST: forest—mixed; RNGE: range—grasses; WETL: wetlands—mixed; UCOM: urban construction land; WATR: water bodies.
Hydrology 12 00180 g001
Figure 2. Annual mean temperature and precipitation, and quarterly mean temperature and precipitation. UFK: forward sequence statistic. UBK: backward sequence statistic.
Hydrology 12 00180 g002
Figure 3. MK test of runoff at Hubeizha Station of Muling River from 1980 to 2018.
Hydrology 12 00180 g003
Figure 4. Temperature and precipitation variations in different seasons in the Muling River basin. Different colored Value values in the graph represent different periods of mutation.
Hydrology 12 00180 g004
Figure 5. The land use types in the Muling River basin changed from 1980 to 2015.
Hydrology 12 00180 g005
Figure 6. The calibration results of different calibration conditions.
Hydrology 12 00180 g006
Table 1. Data sources.
Data TypeResolutionData SourceData Description
DEM Chart30 m × 30 mGeospatial Data CloudElevation
Land Use Map30 m × 30 mInstitute of Aerospace Information Innovation, Chinese Academy of Sciences1980 and 2000 spatial distribution of land use
Soil Type Map1 km × 1 kmWorld Soil Database (HWSD)Spatial distribution of soil types, 1980–2015
Meteorological Data0.25° × 0.25°Chinese Atmospheric Assimilation Drive Set (CMADS)1979–2018 precipitation, temperature, evapotranspiration, relative humidity, wind speed, sunshine hours
Hydrological DataDay ScaleHydrological Yearbook of Heilongjiang Basin1980–2015 runoff
Table 2. Setting of different scenarios.
Scenario Serial NumberPrecipitation FactorsTemperature Factors
A11980–19921993–2018
A21992–20181980–1992
A31993–20181993–2018
Meteorological factorsLand use factors
B11992–20182015S
B21992–20181980S
Period of input dataReservoir module addition situation
C1Mutation periodYes
C2Mutation phaseNo
Table 3. Land use transfer matrix for 1980 and 2015 in the Muling River basin.
Summing Term: Area2015lucc
1980lucc Grassland Cropland Urban Land Forest Water Bodies Unused Land Total
Grassland446.01253.916.83268.473.798.54987.53
Cropland59.975064.10125.18478.8925.3259.305812.76
Urban Land32.72139.79279.1628.911.172.03483.79
Forest205.001054.6133.657489.627.1625.628815.66
Water Bodies 0.9769.722.056.5576.9811.10167.38
Unused Land21.35617.3210.1243.1512.50357.571062.00
Total766.027199.44456.998315.58126.92464.1617,329.12
Table 4. Contribution rate of extreme land use scenarios to runoff.
ScenariosLand Use TypeContribution Rate
D1Arable land20%
D2Grass−16%
D3Woodland−17%
D4Land for construction30%
Table 5. Sensitivity statistics of parameters for a single rate setting of 500 times.
500–1500–2500–3500–4500–5500–6500–7500–8500–9500–10
1CN2CN2CANMXCN2CANMXCANMXCANMXCANMXSOL_BDSOL_BD
2CANMXCANMXSMTMPALPHA_BFSOL_AWCSMTMPSMTMPSOL_BDCN2CN2
3SOL_BDALPHA_BFALPHA_BFSMTMPALPHA_BFSOL_AWCSOL_AWCCN2CANMXCANMX
4CH_K2ESCOCN2SOL_AWCSOL_KALPHA_BFCN2GWQMNSOL_AWCSOL_AWC
5ESCOSOL_BDSOL_KSOL_KSMFMXSOL_KSOL_KSOL_AWCSOL_KSOL_K
6CH_N2SOL_ZSOL_AWCCH_K2ESCOESCOCH_K2SOL_ZSMTMPGW_REVAP
7ALPHA_BFGWQMNCH_K2SMFMXSOL_BDCH_K2ALPHA_BFSOL_KTLAPSSOL_Z
8SOL_KCH_K2GWQMNSOL_ZGWQMNSMFMXSMFMXSFTMPGWQMNSFTMP
9GWQMNSMTMPGW_REVAPEPCOCH_K2GW_REVAPGW_REVAP SOL_ZTIMP
10TLAPSCH_N2TIMPGWQMNGW_REVAPSURLAGSOL_BD ALPHA_BFSMTMP
11SOL_ZSOL_BDSOL_BDESCOSURLAGSOL_BDSOL_Z CH_K2REVAPMN
12SMTMPTIMPEPCOGW_REVAPEPCOSOL_AWCSURLAG SFTMPCH_K2
13GW_DELAYGW_REVAPSOL_ZSOL_BDSMTMPEPCOEPCO SMFMX
14SOL_AWCTLAPS SOL_ZSOL_ZREVAPMNESCO
15 SOL_K SFTMP SFTMP
16 SOL_AWC REVAPMN
Reduced sensitivity from top to bottom.
Disclaimer/Publisher’s Note: The statements, opinions and data contained in all publications are solely those of the individual author(s) and contributor(s) and not of MDPI and/or the editor(s). MDPI and/or the editor(s) disclaim responsibility for any injury to people or property resulting from any ideas, methods, instructions or products referred to in the content.

