Article

Modeling the Impact of Water Hyacinth on Evapotranspiration in the Chongón Reservoir Using Remote Sensing Techniques: Implications for Aquatic Ecology and Invasive Species Management

by
Carolina Cárdenas-Cuadrado
1,†,
Luis Morocho
1,
Juan Guevara
1,
Manuel Cepeda
1,
Tomás Hernández-Paredes
1,
Diego Arcos-Jácome
1,
Carlos Ortega
1 and
Diego Portalanza
1,2,3,*,†
1
Facultad de Ciencias Agrarias, Universidad Agraria del Ecuador (UAE), Av. 25 de Julio, 090104, Av. 25 de Julio, Guayaquil 090104, Guayas, Ecuador
2
Center of Natural and Exact Sciences, Department of Physics, Climate Research Group, Federal University of Santa Maria, Av. Roraima, Santa Maria 1000, RS, Brazil
3
Instituto de Investigación, Escuela de Posgrado “Ing. Jacobo Bucaram Ortiz, Ph.D”, Universidad Agraria del Ecuador (UAE), Avenida 25 de Julio, Guayaquil 090104, Guayas, Ecuador
*
Author to whom correspondence should be addressed.
These authors contributed equally to this work.
Hydrology 2025, 12(4), 80; https://doi.org/10.3390/hydrology12040080
Submission received: 31 January 2025 / Revised: 9 March 2025 / Accepted: 28 March 2025 / Published: 2 April 2025
(This article belongs to the Special Issue GIS Modelling of Evapotranspiration with Remote Sensing)

Abstract

The proliferation of water hyacinth (Eichhornia crassipes) in the Chongón Reservoir, located within the Parque Lago National Recreation Area in Guayaquil, Ecuador, poses significant challenges to the local aquatic ecosystem and water resource management. This study assesses the impact of water hyacinth coverage on evapotranspiration rates over a 20-year period from 2002 to 2022 using remote sensing data and geospatial analysis. The Normalized Difference Vegetation Index (NDVI), derived from Landsat satellite imagery, along with meteorological records, was utilized to model the spatial and temporal dynamics of water hyacinth coverage and its effects on evapotranspiration. Our results indicate that water hyacinth coverage fluctuates significantly between rainy and dry seasons, increasing from covering 10.42% of the reservoir area in 2002 to a peak of 42.33% in 2017 during the rainy seasons. A strong positive correlation ( r = 0.92 , p < 0.001 ) was found between water hyacinth coverage and net daily water loss due to evapotranspiration. The evapotranspiration rates associated with water hyacinth were significantly higher during the rainy season (mean of 2309.90 mm/year) compared to the dry season (mean of 1917.87 mm/year). These elevated evapotranspiration rates contribute to increased water loss from the reservoir, potentially impacting water availability for municipal and agricultural use. Controlling the spread of water hyacinth is therefore crucial for preserving the reservoir’s ecological integrity and ensuring sustainable water resource management. The findings of this study provide valuable insights for informing management strategies aimed at mitigating the effects of invasive species on freshwater resources and maintaining aquatic ecosystem health.

1. Introduction

The importance of water bodies such as reservoirs cannot be overstated. Reservoirs play a critical role in maintaining ecological balance, providing water resources for irrigation, supporting biodiversity, and serving as vital habitats for aquatic life [1,2]. In the face of climate change and increasing human pressure, these artificial water bodies are instrumental in water management, supplying water for both agricultural and domestic purposes [3]. The Chongón Reservoir, located in the Parque Lago National Recreation Area in Guayaquil, Ecuador, is an important artificial ecosystem that has become central to the local environment and the livelihoods of surrounding communities.
Artificial reservoirs like Chongón are particularly vulnerable to ecological disturbances due to their limited water flow and human interventions. One of the most pervasive challenges affecting reservoirs globally is the spread of invasive aquatic species, with water hyacinth (WH) (Eichhornia crassipes) being among the most problematic [4,5]. The rapid proliferation of this invasive plant poses significant challenges, including reducing water quality, disrupting native biodiversity, and increasing water loss through evapotranspiration [6]. In Chongón Reservoir, the unchecked growth of WH has resulted in a notable impact on the ecological integrity of the system, affecting its capacity to provide essential ecosystem services.
Chongón Reservoir is crucial for irrigation, biodiversity, and recreation but faces ecological challenges from invasive water hyacinth proliferation.
The Chongón Reservoir provides essential ecosystem services, such as water storage, habitat support, and recreation, but these services are threatened by the spread of water hyacinth, increasing evapotranspiration and water losses [7,8]. Increased water loss poses a direct threat to water availability for local communities and agricultural activities, which rely on the reservoir as a crucial water source. Therefore, there is a pressing need to understand the dynamics of WH coverage and its effects on evapotranspiration to develop informed management strategies [9,10].
WH, originally native to the Amazon Basin, is a highly adaptable plant that has spread across numerous regions worldwide, primarily due to human activities [11]. This plant is known for its rapid growth and ability to form dense mats that can cover entire water surfaces, effectively blocking sunlight and reducing oxygen levels in the water. This process results in the decline of native aquatic vegetation and a decrease in the diversity of aquatic fauna, ultimately threatening the entire ecosystem [12]. Understanding and mitigating the impact of WH on reservoirs like Chongón is crucial for preserving the ecological health of these systems.
Remote sensing technology has proven to be an effective tool for monitoring changes in aquatic vegetation over time [13,14]. By utilizing the Normalized Difference Vegetation Index (NDVI) derived from satellite imagery, researchers can accurately quantify changes in vegetation coverage, including the proliferation of invasive species such as HW [15,16]. This study employs remote sensing data combined with meteorological records to model the spatial and temporal dynamics of WH coverage in the Chongón Reservoir over a 20-year period from 2002 to 2022.
The study focuses on examining how the proliferation of WH influences evapotranspiration rates in the Chongón Reservoir and the resulting implications for water availability and ecosystem health. By applying linear regression models, the relationships between WH coverage, evapotranspiration, and climatic variables are explored. Statistical modeling provides deeper insights into the drivers of evapotranspiration and helps identify key factors contributing to water loss in the reservoir [17].
The objectives of this research are: (a) to model the relationship between WH coverage and evapotranspiration rates in the Chongón Reservoir, (b) determine the spatial and temporal variability of WH coverage using NDVI, and (c) provide recommendations for the management of invasive species to preserve the ecological integrity of the reservoir. By achieving these objectives, this study aims to contribute valuable knowledge for the effective management of aquatic ecosystems and inform policy decisions that support sustainable water resource management.

2. Materials and Methods

2.1. Study Area

The Chongón Reservoir is located within the Parque Lago National Recreation Area in Guayaquil, Ecuador. This artificial reservoir was initially created to support irrigation and domestic water supply for the Santa Elena Peninsula but has since evolved into an important conservation site that also offers recreational opportunities. The area is characterized by its diverse ecosystem, with a variety of aquatic species and scenic landscapes shaped by the dam structure and water storage activities. The reservoir covers an approximate area of 1611 hectares, with a capacity of 280 million cubic meters [18]. It has played a critical role in supporting local fisheries, providing habitat for commercially valuable species that contribute significantly to the income and food security of nearby communities. However, the presence of WH has increasingly impacted these benefits, presenting a growing ecological challenge [12] (Figure 1).
The climate of the Chongón Reservoir region is characterized by a tropical savanna climate, with distinct wet and dry seasons. The rainy season typically occurs from December to May, while the dry season extends from June to November [19]. This seasonal variation influences both the hydrology of the reservoir and the growth patterns of invasive aquatic vegetation such as WH. Ecologically, the reservoir provides numerous ecosystem services, including water storage, biodiversity support, and recreational benefits. It hosts a variety of native flora and fauna, although their populations are increasingly threatened by invasive species. The spread of WH has led to significant changes in the aquatic ecosystem, particularly through the reduction of native aquatic plants and changes in oxygen levels, which ultimately affect fish populations and overall biodiversity [20].
The hydrological dynamics of the region is influenced by both natural climatic conditions and anthropogenic factors. Variations in precipitation, evapotranspiration, and human activities such as irrigation and recreational use all contribute to changes in water levels and water quality [21]. In recent years, the expansion of WH has intensified these challenges, further altering the water balance of the reservoir and affecting its ecological stability. The geographic position of the Chongón Reservoir within the coastal province of Guayas makes it highly susceptible to climatic variability, including events such as El Niño, which bring above-average rainfall and exacerbate the spread of invasive species. These climatic events further underscore the need for effective management strategies aimed at preserving the ecological health and functionality of the reservoir. The combination of climatic factors, invasive species, and human intervention makes the Chongón Reservoir a complex yet important site for studying the interactions between aquatic ecosystems and invasive plant species [22].

2.2. Data Collection

Meteorological data were sourced from the NASA Prediction of Worldwide Energy Resources (NASA-POWER) database, which provides high-resolution climatological datasets derived from satellite observations and modeling [23,24,25]. Variables collected included temperature (maximum and minimum, °C), precipitation (mm), relative humidity (%), solar radiation ( W / m 2 ), and 2 m wind speed ( m / s 1 ).
Satellite imagery was acquired from the Landsat satellite program, utilizing data from Landsat 7 Enhanced Thematic Mapper Plus (ETM+) [26], Landsat 8 Operational Land Imager (OLI), and Landsat 9 OLI sensors [27]. Imagery covering the years 2002, 2007, 2012, 2015–2016, 2017, 2018–2019, and 2022 was selected to capture temporal changes over a 20-year period. Both rainy seasons (December to May) and dry seasons (June to November) were included to assess seasonal variations in WH coverage. The list of dates and satellite used are described in Table 1.

2.3. Remote Sensing and Data Sources

The remote sensing component focused on analyzing Landsat imagery to monitor the spatial and temporal distribution of WH in the reservoir. Landsat data were accessed through the Google Earth Engine (GEE) platform [28], which offers cloud-based processing capabilities and a comprehensive archive of historical and current satellite datasets.
Key spectral bands utilized from the Landsat sensors included the red (RED), green (GREEN), and near-infrared (NIR) bands, essential for vegetation analysis. The spatial resolution of 30 m provided by Landsat imagery was adequate for mapping the extent of WH within the reservoir. Images were selected based on minimal cloud cover (preferably less than 10%) and temporal alignment with the meteorological data to ensure consistency and comparability.

2.4. Data Pre-Processing and Validation

Pre-processing steps were undertaken to enhance data quality and ensure comparability across different images and sensors. Atmospheric correction algorithms available in GEE were applied to adjust for scattering and absorption effects caused by atmospheric constituents, improving the accuracy of surface reflectance values. Cloud masking techniques were employed to exclude pixels affected by clouds or cloud shadows [29], preventing inaccuracies in vegetation analysis.
To validate and correct the satellite-derived meteorological data, a quantile mapping approach was utilized, aligning satellite-derived values more closely with ground-based observations. Specifically, satellite-derived reference evapotranspiration ( E T 0 ) was adjusted using quantile mapping by matching the cumulative distribution function (CDF) of the satellite-derived data to the CDF of local observed data from the Espol-GEA weather station, covering the years 2020–2022. This procedure corrects systematic biases present in satellite estimates, enhancing accuracy and ensuring that subsequent analyses and findings are reproducible and reliable [30,31,32].
The Normalized Difference Vegetation Index (NDVI) was calculated for each processed image using the formula:
NDVI = NIR RED NIR + RED
NDVI values range from −1 to 1, with higher values indicating denser and healthier vegetation. Threshold values were established to distinguish WH from other vegetation and open water. Specifically: (a) NDVI values between 0.7 and 1 were classified as high-density vegetation (indicative of water hyacinth), (b) values between 0.2 and 0.5 indicated sparse vegetation (e.g., algae) and, (c) values between −1 and 0 were classified as open water bodies. These classifications explicitly define each vegetation category, ensuring consistent terminology and improving the clarity and readability of the manuscript.
Image classification and segmentation were performed using QGIS, an open-source geographic information system software. The reclassified NDVI images were used to create thematic maps illustrating the spatial distribution of WH in the reservoir for each selected year and season. The area covered by WH was quantified by calculating the pixel area corresponding to the high-density vegetation class.

2.5. Statistical Analysis and Model Regression

Statistical analyses were conducted to examine the relationships between WH coverage, evapotranspiration rates, and climatic variables. Pearson correlation coefficients were computed to assess the strength and significance of linear associations among variables, such as WH area, evapotranspiration, temperature, precipitation, solar radiation, and wind speed.
Linear regression models were developed to quantify the impact of WH coverage on evapotranspiration in the reservoir. The primary dependent variable was the net daily water loss (NDWL), calculated using the formula:
NDWL = ( ET hyacinth ET open water ) × Area hyacinth
where ET hyacinth is the WH evapotranspiration rate (mm/year), ET open water is the evaporation rate from the open water surface (mm/year), Area hyacinth is the area covered by WH (km2). To maintain consistency, evapotranspiration values are initially calculated in mm/year and subsequently converted to daily values (mm/day) by dividing by the number of days in the respective period.
The WH evapotranspiration ( ET hyacinth ) was estimated using the reference evapotranspiration ( ET 0 ) and a crop coefficient ( K c ) specific to WH:
ET hyacinth = ET 0 × K c
Crop coefficient values ( K c ) for WH were obtained from literature and adjusted for seasonal variations, with values of 4.85 for the rainy season and 3.49 for the dry season. These crop coefficient values ( K c ) were obtained from previous research conducted in tropical freshwater ecosystems with dense water hyacinth infestations [33].
Multiple linear regression models were explored to assess the combined effects of climatic variables on WH coverage and evapotranspiration rates. The general form of the multiple linear regression model used was:
Y = β 0 + β 1 X 1 + β 2 X 2 + + β n X n + ϵ
where Y is the dependent variable (e.g., evapotranspiration rate), X 1 , X 2 , , X n are the independent variables (e.g., temperature, solar radiation, etc.), β 0 is the intercept, β 1 , β 2 , , β n are the coefficients for each independent variable and, ϵ is the error term.
To assess model accuracy, the coefficient of determination ( R 2 ) and the root mean square error (RMSE) were calculated as:
R 2 = 1 ( y i y ^ i ) 2 ( y i y ¯ ) 2
RMSE = 1 n i = 1 n ( y i y ^ i ) 2
where y i is the observed value, y ^ i is the predicted value and, y ¯ is the mean of observed values [34].
All statistical analyses were performed using RStudio (2024.12.1+563), a statistical computing environment. Model diagnostics included assessments of linearity, homoscedasticity (constant variance of residuals), normality of residuals, and multicollinearity among predictors. The theoretical framework used in this study can be seen in Figure 2.

3. Results

3.1. Water Hyacinth Coverage in Chongón Reservoir

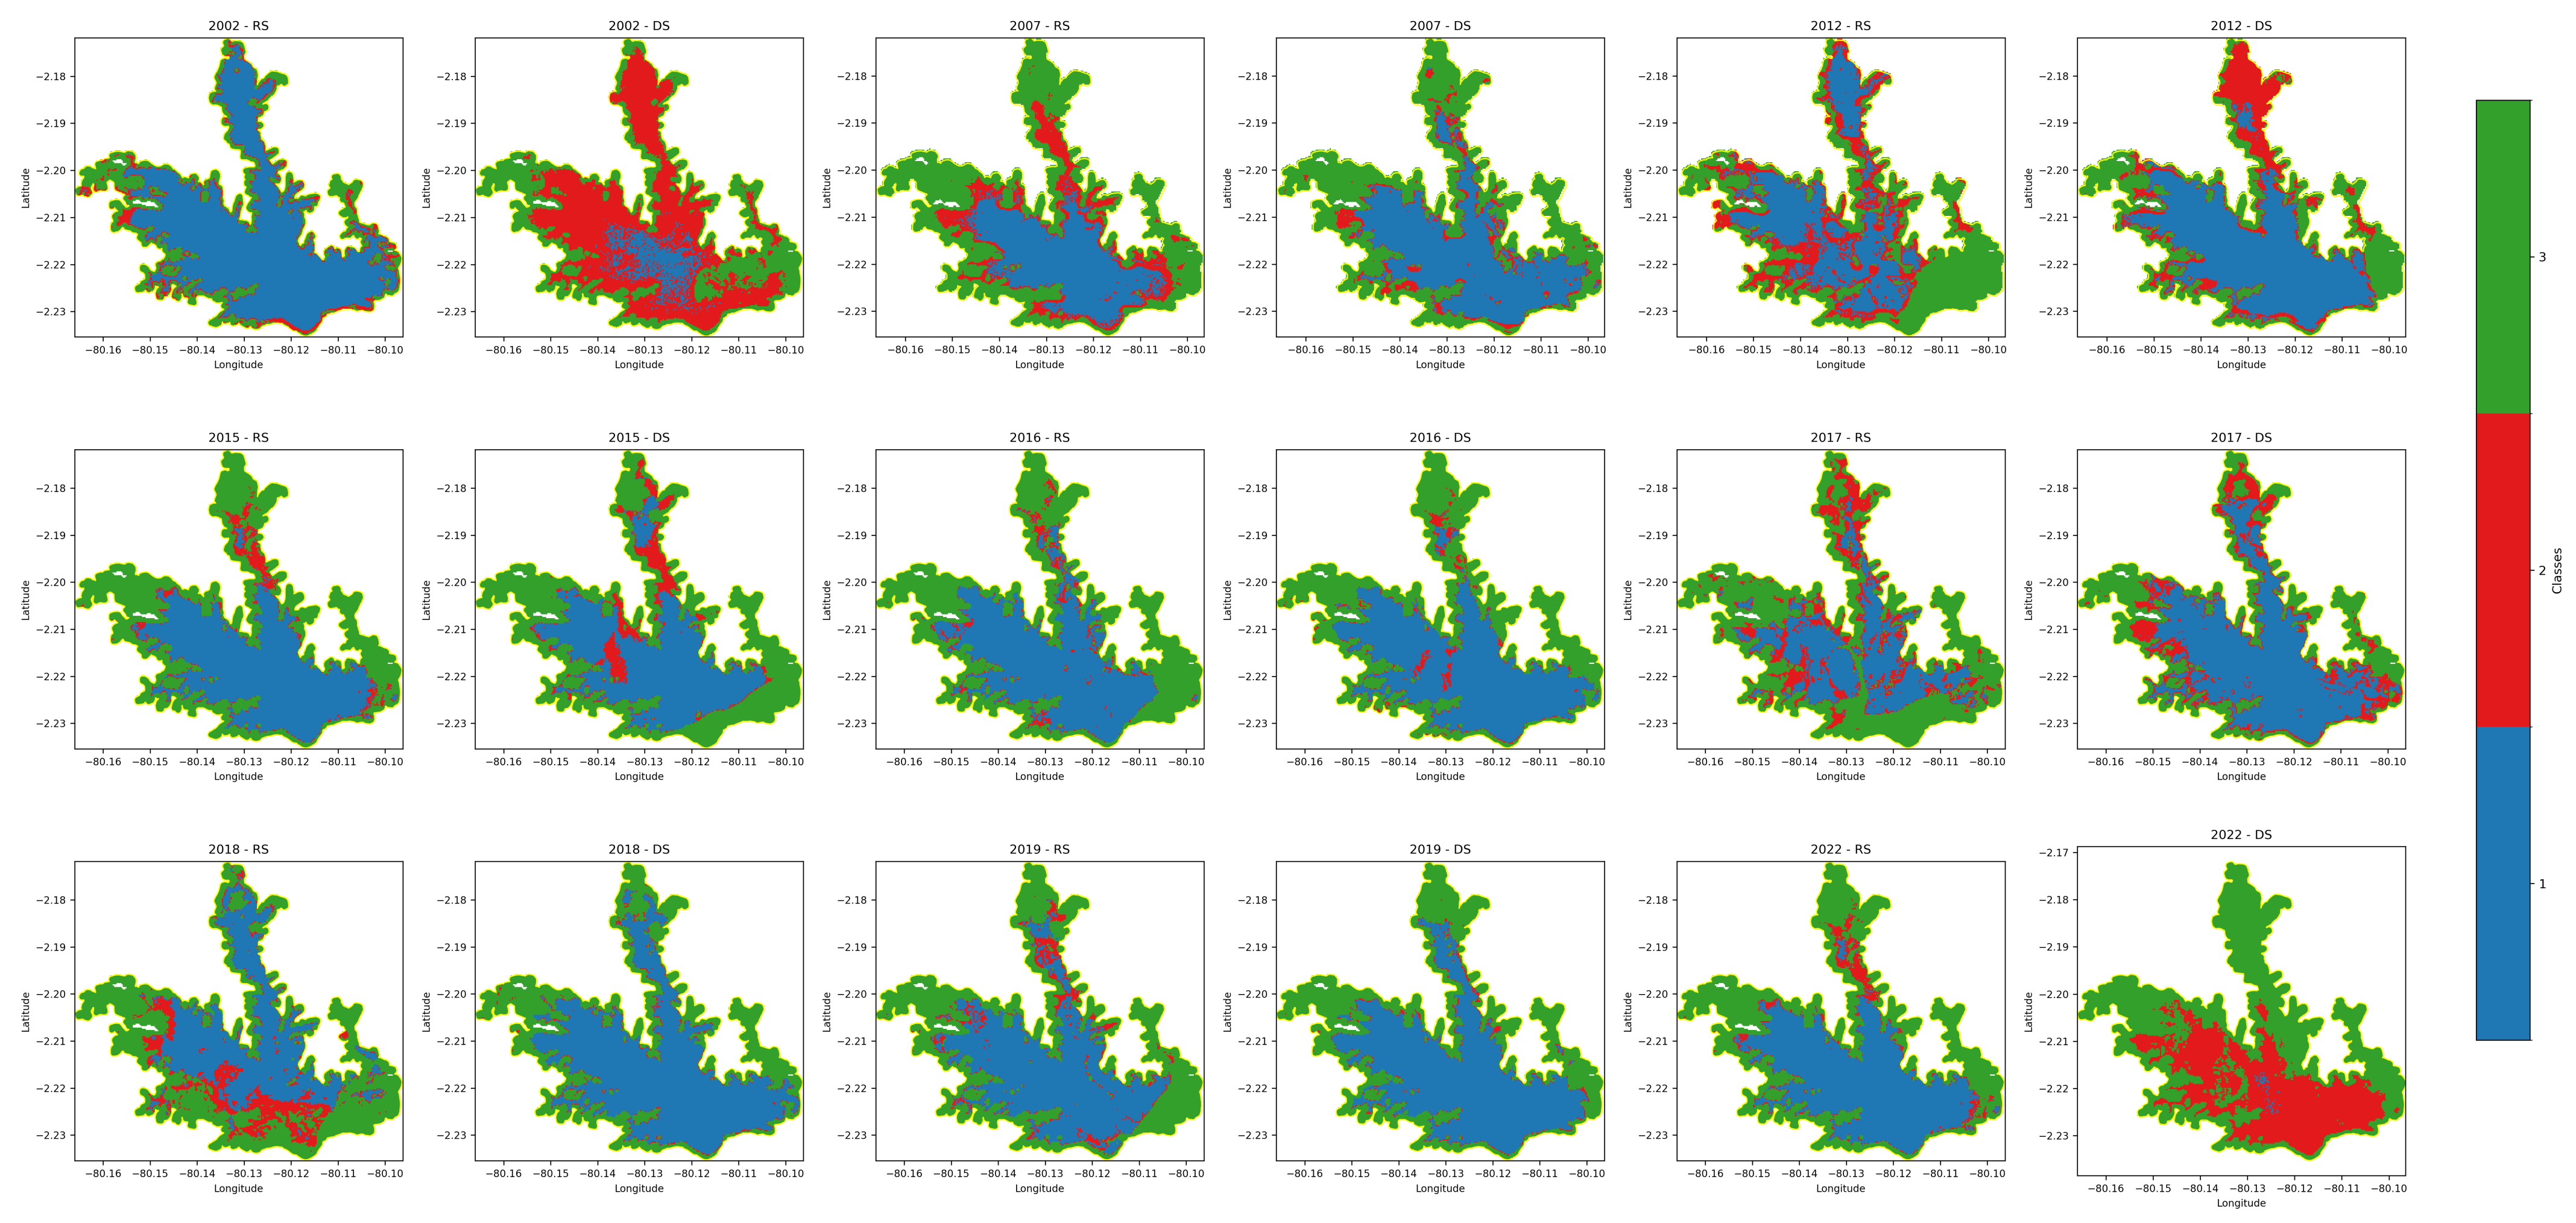
The assessment of water hyacinth coverage (WHC) in the Chongón Reservoir revealed significant spatial and temporal variations over the nine-year study period. Utilizing satellite imagery from Landsat 7, 8, and 9, along with the Normalized Difference Vegetation Index (NDVI), we quantified the extent of WH proliferation during both the rainy season (December to May) and the dry season (June to November).
Our analysis indicated a general trend of increasing WHC over time, with notable fluctuations between seasons. In 2002, during the rainy season, WH covered approximately 1.68 km2, representing 10.42% of the reservoir’s surface area. In contrast, the dry season of the same year showed an increase in coverage to 3.85 km2 (23.87%).
By 2017, the rainy season coverage had expanded significantly to 6.82 km2, accounting for 42.33% of the reservoir’s area. Similarly, during the dry season of 2019, the coverage reached 4.68 km2 (29.05%). These findings demonstrate a substantial proliferation over the years. Figure 3 illustrates the changes in WHC from 2002 to 2022 for both seasons.
Generally, higher coverage was observed during the rainy seasons compared to the dry seasons. The mean coverage during the rainy seasons was 4.99 km2, whereas the dry seasons exhibited a mean coverage of 4.22 km2. However, exceptions were noted in certain years. For instance, in 2002 and 2022, the dry season coverage surpassed that of the rainy season, indicating that factors other than precipitation, such as temperature and water management practices, may influence the proliferation.
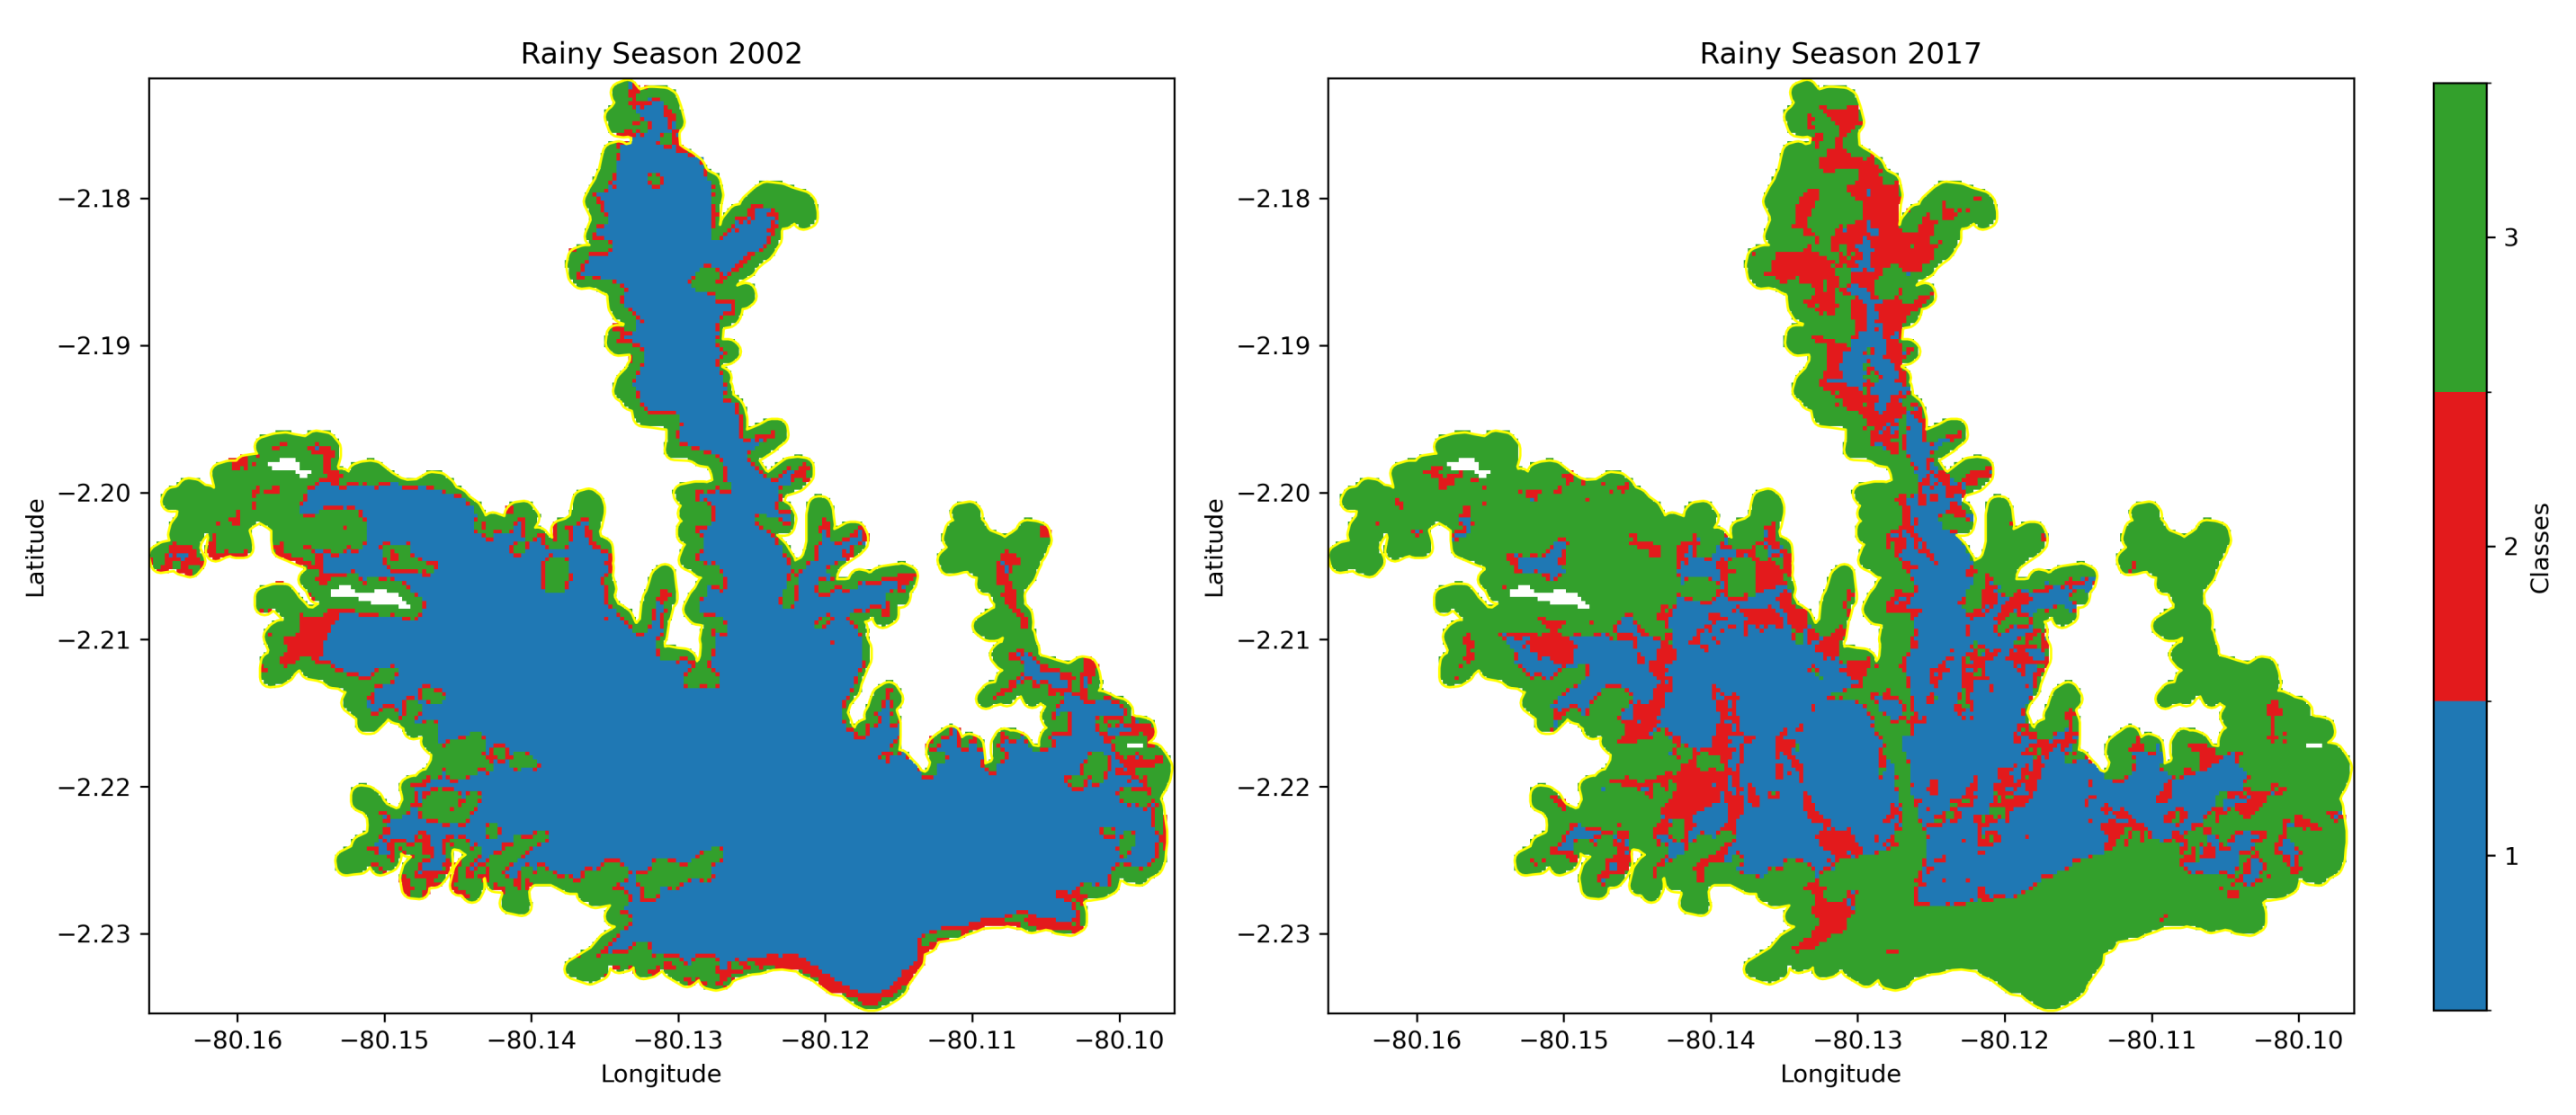
Spatial analysis revealed that WH initially occupied areas along the reservoir’s periphery but gradually extended towards central regions over time. The densest infestations were predominantly located in the northern and northeastern sections of the reservoir. Figure 4 depict the spatial distribution of WH during the rainy seasons of 2002 and 2017, respectively.
Table 2 summarizes the WHC and corresponding percentages of the reservoir’s surface area for selected years.
The data exhibit variability in WHC between different years and seasons. Notably, the highest coverage during the rainy season was recorded in 2017 (6.82 km2, 42.33%), while the highest dry season coverage occurred in 2015 (5.97 km2, 37.07%). The lowest coverage was observed in 2002 and 2022, indicating possible fluctuations due to environmental factors or management interventions.

3.2. Evapotranspiration Rates Associated with Water Hyacinth

The evapotranspiration rates associated with WH in the Chongón reservoir were calculated to quantify the water loss due to this invasive species during different seasons. This section presents the results of the evapotranspiration analysis, highlighting seasonal, monthly, and yearly variations.
Reference evapotranspiration ( E T 0 ) was calculated using the Penman–Monteith method, based on corrected meteorological data obtained from NASA’s POWER database and validated against observations from the ESPOL-GEA meteorological station. Data correction involved bias adjustment using quantile mapping to ensure accuracy [35].
Figure 5 presents the Taylor diagrams that illustrate the variation in E T 0 on different temporal scales: monthly, seasonal, and yearly. The diagrams help visualize the correlation, standard deviation and centered RMSD between observed and corrected E T 0 , providing information on the precision of the bias correction method.
Taylor diagrams provide a visual summary of how well modeled data match observed data by simultaneously illustrating correlation coefficients, standard deviations, and root mean square differences (RMSD). These diagrams allow quick assessment of the accuracy and performance of statistical corrections applied to satellite-derived evapotranspiration data.
Figure 6 shows the box plots of E T 0 for both the rainy and dry seasons, before and after bias correction. The results indicate that E T 0 is higher during the dry season, reflecting higher temperatures, increased solar radiation, and lower humidity typical of this period. The comparison between the plots before and after correction highlights the impact of the bias adjustment in aligning the model estimates with the observed data.
The specific evapotranspiration was calculated using the crop coefficient method, where:
E T WH = E T 0 × K c
Here:
  • E T WH is the evapotranspiration of WH (mm/year).
  • E T 0 is the reference evapotranspiration (mm/year).
  • K c is the crop coefficient for WH.
The values of the crop coefficient were determined from the literature [36,37] and adjusted for local conditions:
  • K c = 4.85 for the rainy season.
  • K c = 3.49 for the dry season.
The calculated evapotranspiration rates showed distinct seasonal variations. Table 3 summarizes the statistical measures of E T WH for both seasons.
The mean evapotranspiration rate during the rainy season was approximately 2309.90 mm/year, higher than the dry season mean of 1917.87 mm/year. This difference reflects the increased physiological activity of the plants during the rainy season, driven by higher humidity and favorable growth conditions.
The results indicate that the WH evapotranspiration rates are consistently higher during the rainy season across all years studied. The variability is also greater in the rainy season, suggesting that environmental conditions during this period have a significant influence on plant transpiration rates.
The higher evapotranspiration rates during the rainy season can be attributed to:
  • Increased Biomass: WH tends to grow more rapidly during the rainy season, increasing leaf area and transpiration surface.
  • Higher Humidity: Elevated humidity levels reduce stomatal closure, allowing for higher transpiration rates.
  • Optimal Temperatures: Favorable temperatures enhance metabolic processes and water uptake.
In contrast, during the dry season, despite higher E T 0 , the actual evapotranspiration is lower due to reduced plant growth and possible water stress conditions.
The significant evapotranspiration rates imply substantial water loss from the reservoir, particularly during the rainy season when the plant’s coverage and activity are at their peak. This has implications for water resource management, as the invasive species exacerbates water scarcity issues.

3.3. Net Daily Water Loss Due to Evapotranspiration

The net daily water loss (NDWL) due to evapotranspiration associated with WH was calculated to quantify the additional water loss from the reservoir caused by the presence of WH. The evaporation rate from open water surfaces was calculated using the Penman equation, adjusted for open water conditions. The mean evaporation rate from open water was found to be 1600 mm/year, which translates to approximately 4.38 mm/day.
Table 4 presents the calculated NDWL values for the years studied during both the rainy and dry seasons.
The NDWL values indicate the additional water loss from the reservoir due to the presence of WH, after accounting for the evaporation that would occur from open water surfaces. The highest NDWL was observed during the rainy season of 2017, corresponding to the highest WH coverage recorded.
The analysis shows that NDWL increases with the expansion of WH coverage. The seasonal variation of NDWL reflects both the changes in WH area and the differences in evapotranspiration rates between the rainy and dry seasons. A Pearson correlation analysis between NDWL and WHC confirmed a strong positive correlation ( r = 0.92 , p < 0.001 ), indicating that NDWL is directly related to the extent of WH coverage.
Additionally, the net daily water loss was standardized by water hyacinth coverage (Table 5), clearly confirming higher standardized evapotranspiration rates during the rainy seasons compared to dry seasons.

3.4. Relationship Between Coverage and Water Loss Due to Evapotranspiration

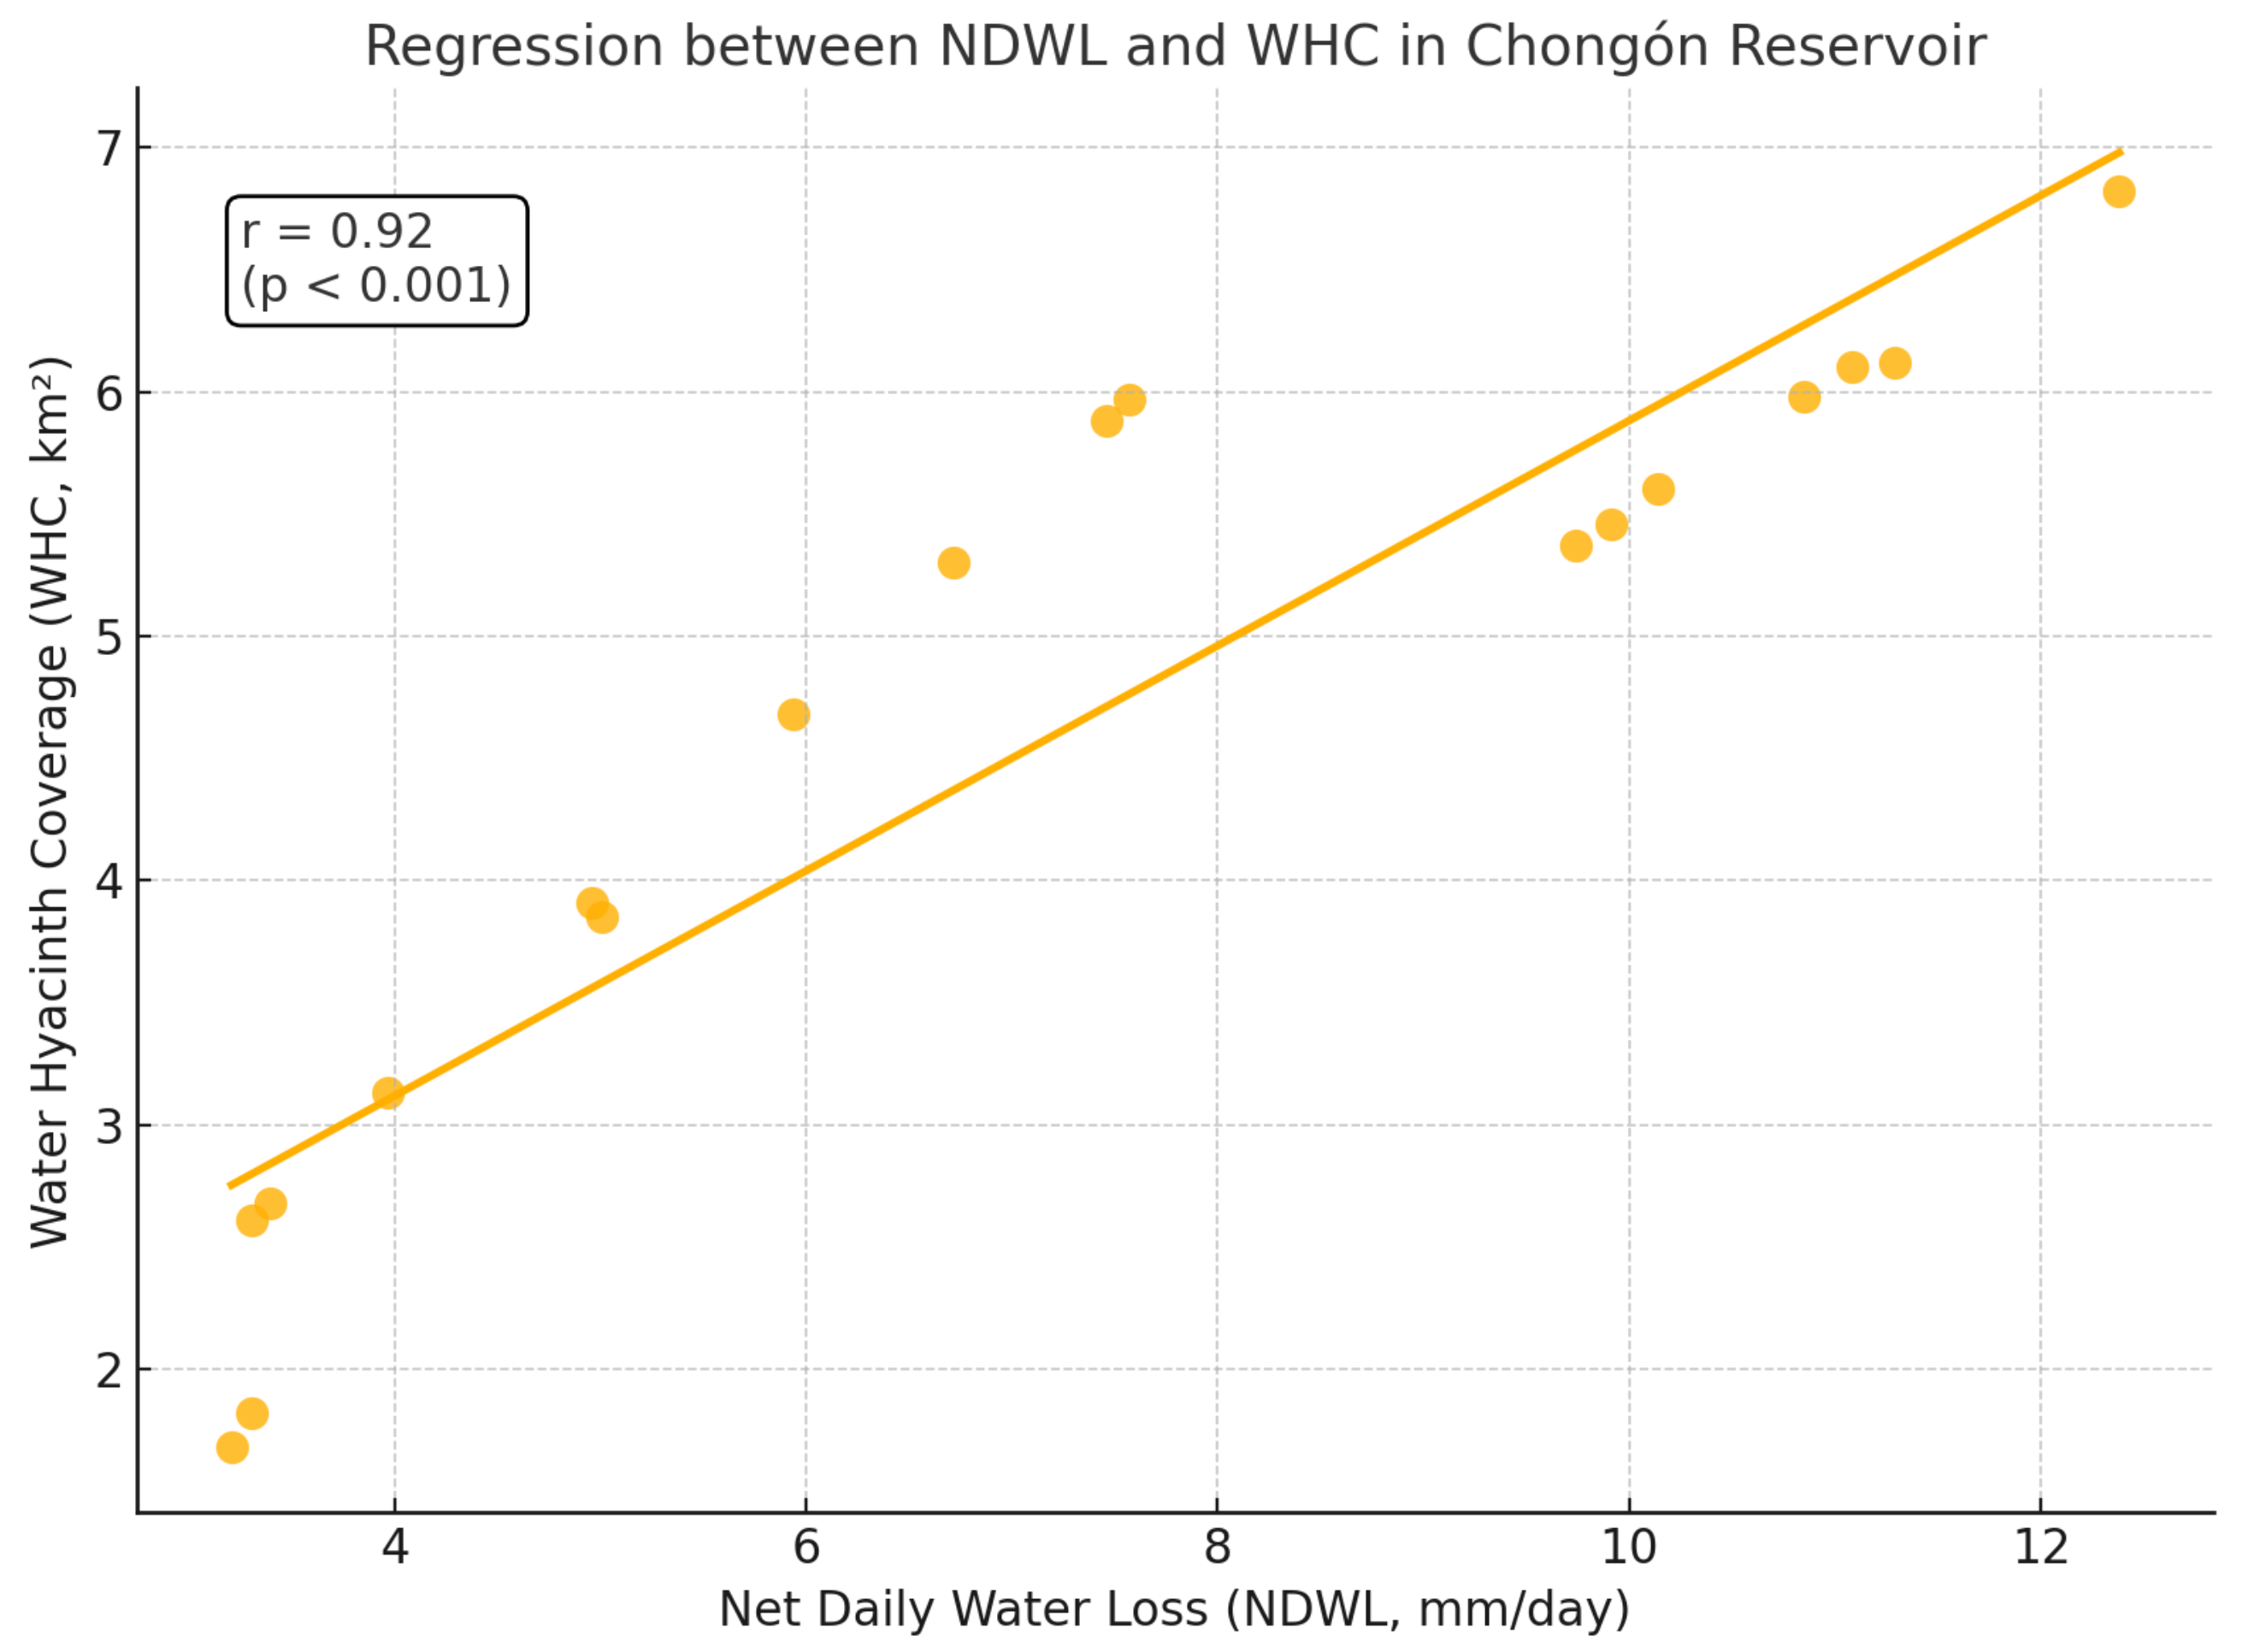
The relationship between the WHC in the Chongón Reservoir and the water loss due to evapotranspiration was analyzed to understand the impact of this invasive species on the reservoir’s water balance. Statistical analyses were performed to assess the correlation between the extent of WHC and the net daily water loss (NDWL) attributed to evapotranspiration.
The correlation between WHC and NDWL was evaluated using Pearson’s correlation coefficient (r). The analysis revealed a strong positive correlation between WHC and NDWL, with a coefficient of r = 0.92 . This indicates that as the coverage increases, the water loss due to evapotranspiration also increases significantly.
Figure 7 clearly illustrates this strong linear relationship, visually confirming the direct influence of WH coverage on evapotranspiration-driven water loss.
Table 6 presents the correlation coefficients between WHC and other climatic variables, such as reference evapotranspiration ( E T 0 ), temperature, precipitation, and solar radiation. The strong correlation with NDWL highlights the substantial impact of WHC on water loss from the reservoir.
The negative correlation between WHC and reference evapotranspiration ( r = 0.08 ) suggests a weak and negligible relationship, indicating that the WH extent is not directly influenced by the reference evapotranspiration. Similarly, the correlations with temperature and precipitation variables are not statistically significant, implying that other factors may be influencing the plant proliferation.
A linear regression model was developed to quantify the relationship between WHC and NDWL. The model is expressed by the equation:
WHC ( km 2 ) = β 0 ( km 2 ) + β 1 ( km 2 / mm / day ) × NDWL ( mm / day )
where:
  • WHC is the coverage area of WH (km2).
  • β 0 is the intercept of the model.
  • β 1 is the slope coefficient representing the change in coverage per unit change in NDWL.
  • NDWL is the net daily water loss (mm/year).
The regression analysis yielded the following model parameters:
WHC = 1.136 + 0.000463 × NDWL
The model explains approximately 87.59% of the variability in WHC, as indicated by the coefficient of determination ( R 2 = 0.8759 ). The slope coefficient β 1 = 0.000463 is statistically significant (p-value < 0.001), confirming the strong positive relationship between NDWL and WHC.
The analysis indicates that the expansion of WH in the reservoir significantly contributes to increased water loss through evapotranspiration. As the coverage area grows, the cumulative transpiration from the plants leads to higher NDWL values, exacerbating water scarcity issues in the region.

3.5. Model Development

Based on the correlation analysis, NDWL showed a strong positive correlation with WHC ( r = 0.92 , p < 0.001 ). Other climatic variables, such as solar radiation, minimum temperature, and minimum wind speed, were also considered for inclusion in the model due to their potential influence on evapotranspiration processes.
A multiple linear regression analysis was performed using WHC as the dependent variable and NDWL, solar radiation (Rads), minimum temperature (Tempmin), and minimum wind speed (WSmin) as independent variables. The regression equation is expressed as:
WHC ( km 2 ) = β 0 ( km 2 ) + β 1 ( km 2 / mm / day ) × NDWL ( mm / day ) + β 2 ( km 2 / W / m 2 ) × Rad s ( W / m 2 ) + β 3 ( km 2 / ° C ) × Temp min ( ° C ) + β 4 ( km 2 / m / s ) × WS min ( m / s )
The estimated coefficients and statistical significance are presented in Table 7.
The model’s overall fit was evaluated using the coefficient of determination and F-test statistics. The multiple regression model exhibited an R 2 value of 0.7085 and an adjusted R 2 of 0.6188, indicating that approximately 70.85% of the variability in WHC is explained by the model. The F-statistic was 7.9 with a p-value of 0.001856, suggesting that the model is statistically significant.
Despite the overall significance, individual predictor variables showed varying levels of statistical significance. Solar radiation (Rads) had a p-value of 0.0835, indicating marginal significance, while NDWL, minimum temperature, and minimum wind speed were not statistically significant predictors at the 0.05 level.
Given the strong correlation between WHC and NDWL observed earlier, a simpler linear regression model using only NDWL as the predictor was also developed:
WHC ( km 2 ) = α 0 ( km 2 ) + α 1 ( km 2 / mm / day ) × NDWL ( mm / day )
The estimated coefficients for the simple model are provided in Table 8.
This simple model demonstrated a higher explanatory power, with an R 2 of 0.8759 and an adjusted R 2 of 0.8681. This indicates that approximately 87.59% of the variability in WHC is explained by NDWL alone. Both the intercept and the NDWL coefficient were statistically significant (p-values < 0.01).
Residual analysis was conducted for both models to assess the adequacy of the fit. The residuals of the simple model were randomly distributed around zero without apparent patterns, suggesting that the assumptions of linear regression were satisfied. In contrast, the residuals of the multiple regression model showed greater dispersion and potential heteroscedasticity, indicating that the model may not fully capture the variability in the data.
Comparing both models, the simple linear regression model with NDWL as the sole predictor was preferred due to its higher predictive power and statistical significance of the coefficients. The inclusion of additional climatic variables did not substantially improve the model’s performance and introduced predictors that were not statistically significant.
Therefore, the final model selected for predicting WHC based on NDWL is:
WHC = 1.136 + 4.630 × 10 4 × NDWL
This model implies that for each additional unit increase in NDWL (mm/day), the WHC increases by approximately 4.630 × 10 4 km2, holding all else constant.
The development of this model provides a quantitative tool for predicting the impact of WH on evapotranspiration and subsequent water loss in the Chongón Reservoir. By focusing on NDWL, which is directly influenced by the WHC, reservoir management can better anticipate water loss due to evapotranspiration associated with this invasive species.

4. Discussion

The present study aimed to assess the impact of water hyacinth coverage (WHC) on evapotranspiration rates in the Chongón Reservoir over a 20-year period using remote sensing techniques. Our findings revealed significant spatial and temporal variations in WHC, with a strong positive correlation between the extent of coverage and the net daily water loss due to evapotranspiration.
Several environmental conditions significantly influence water hyacinth proliferation in freshwater ecosystems. Factors such as elevated nutrient concentrations, particularly nitrogen and phosphorus, substantially enhance the growth and expansion of water hyacinth [38,39]. In the Chongón Reservoir, runoff from adjacent agricultural areas may contribute high nutrient loads, favoring rapid biomass accumulation.
Additionally, seasonal fluctuations in water level and temperature variations directly affect growth dynamics. For instance, elevated water levels during the rainy season typically provide optimal conditions for water hyacinth expansion due to increased habitat availability and reduced physiological stress [40,41]. Understanding these contextual environmental factors provides critical insight into the observed temporal variations of water hyacinth coverage, emphasizing the need for integrated nutrient and water-level management strategies in reservoir ecosystems.
Firstly, the WHC in the reservoir showed a substantial increase from 10.42% in 2002 to a peak of 42.33% in 2017 during the rainy seasons. This proliferation corresponds with elevated evapotranspiration rates associated with the plant, which were significantly higher during the rainy season (mean of 2309.90 mm/year) compared to the dry season (mean of 1917.87 mm/year). The strong positive correlation ( r = 0.92 , p < 0.001 ) between WHC and net daily water loss underscores the substantial impact of this invasive species on the reservoir’s water balance [42,43,44].
It is important to note that the strong correlation observed between evapotranspiration-related variables and water hyacinth coverage might partly result from both datasets originating from satellite-derived sources. While the quantile mapping bias correction approach mitigates some systematic biases, future studies incorporating independent, ground-based evapotranspiration measurements are recommended to validate these results more robustly.
Previous studies have investigated water hyacinth impacts on evapotranspiration in various freshwater ecosystems [43,45,46]. However, the current research distinguishes itself by employing a long-term, high-resolution remote sensing analysis spanning two decades specifically focused on the Chongón Reservoir, an ecologically critical region subject to significant climatic variability due to El Niño events. Additionally, the integration of bias-corrected satellite-derived meteorological data and detailed seasonal comparisons provides a novel and comprehensive perspective on the seasonal dynamics of water hyacinth evapotranspiration impacts. Such an approach allows for improved understanding and predictive capability, enhancing regional water resource management strategies specific to tropical reservoir ecosystems under invasive species pressure.
These results are consistent with previous studies that have documented the aggressive growth of WH and its effects on evapotranspiration and water resources. For instance, Harun et al. [45] found similar increases in evapotranspiration rates due to WH proliferation in the Nile River, leading to significant water loss [42,47]. Additionally, Getahun and Kefale [48] reported that WH infestation in Lake Tana resulted in increased evapotranspiration, exacerbating water scarcity issues.
The elevated evapotranspiration rates associated with WH can be attributed to the plant’s high transpiration capacity, driven by its large leaf area and rapid growth rate [47]. During the rainy season, favorable environmental conditions such as higher humidity and optimal temperatures enhance the physiological activity of the plant, leading to increased water uptake and transpiration [49,50,51]. This not only reduces the water volume in the reservoir but also affects the water quality by depleting dissolved oxygen levels, which can harm aquatic life [52].
The implications of these findings are significant for the management of the Chongón Reservoir. The substantial water loss due to evapotranspiration by WH poses a threat to water availability for municipal and agricultural use, especially during dry periods [53]. The dense mats of WH also hinder navigation, fishing activities, and can lead to the decline of native biodiversity [12]. Therefore, controlling the spread of WH is crucial to preserving the reservoir’s ecological integrity and ensuring sustainable water resource management.
Despite the robustness of our findings, this study has certain limitations. The reliance on satellite imagery and remote sensing techniques, while effective for large-scale monitoring, may be subject to errors due to cloud cover, atmospheric interference, and resolution constraints [54,55]. Additionally, the crop coefficient values used to estimate evapotranspiration were derived from literature and may not perfectly reflect local conditions. Ground-based measurements of evapotranspiration and WH biomass could improve the accuracy of the estimates.
Future research should focus on integrating more precise field data to validate and refine the remote sensing models [56]. Investigating the effectiveness of different WH control methods, such as biological control agents or mechanical removal, could provide practical solutions for reservoir management [57]. Moreover, exploring the potential use of WH biomass for bioenergy production could offer sustainable avenues for mitigating the impact of this invasive species while generating economic benefits [58].

5. Conclusions

This study assessed the impact of water hyacinth (WH; Eichhornia crassipes) on evapotranspiration rates in the Chongón Reservoir over a 20-year period using remote sensing techniques. The analysis revealed a significant increase in water hyacinth coverage (WHC), from 10.42% in 2002 to a peak of 42.33% in 2017 during the rainy seasons. A strong positive correlation ( r = 0.92 , p < 0.001 ) was found between WHC and net daily water loss due to evapotranspiration, indicating that the proliferation of this invasive species substantially contributes to water loss in the reservoir.
The evapotranspiration rates associated with WH were significantly higher during the rainy season (mean of 2309.90 mm/year) compared to the dry season (mean of 1917.87 mm/year). This elevated evapotranspiration during the rainy season can be attributed to favorable environmental conditions that enhance the physiological activity of the plant, leading to increased water uptake and transpiration. The substantial water loss due to evapotranspiration by WH poses a threat to water availability for municipal and agricultural use, especially during dry periods.
The findings underscore the critical need for effective management strategies to control the spread of WH in the Chongón Reservoir. Implementing control measures such as mechanical removal, biological control agents, or the utilization of WH biomass for bioenergy production could mitigate the impact of this invasive species while providing potential economic benefits. Continuous monitoring using remote sensing techniques is essential for tracking the effectiveness of management interventions and ensuring the sustainability of the reservoir’s water resources.
Practical measures for controlling water hyacinth in Chongón Reservoir could include mechanical removal to immediately reduce coverage, biological control using natural predators (e.g., specialized insects), or integrated management combining both mechanical and biological approaches. Chemical control (herbicides) could also be considered, though its ecological implications must be carefully evaluated. Future management plans should evaluate these options carefully, balancing effectiveness, sustainability, and potential environmental impacts.
In conclusion, the study demonstrates that WH proliferation has a significant impact on evapotranspiration rates and water loss in the Chongón Reservoir. Addressing this issue is crucial for preserving the ecological integrity of the reservoir and securing water resources for the surrounding communities. Future research should focus on refining evapotranspiration estimates through ground-based measurements and exploring innovative control methods to manage WH infestations effectively.

Author Contributions

Conceptualization, C.C.-C. and D.P.; methodology, L.M., J.G. and M.C.; software, L.M. and J.G.; validation, D.A.-J., T.H.-P. and C.O.; formal analysis, L.M. and J.G.; investigation, L.M., J.G. and M.C.; resources, D.P.; data curation, L.M. and J.G.; writing—original draft preparation, C.C.-C., L.M. and J.G.; writing—review and editing, D.P.; visualization, L.M. and J.G.; supervision, D.P.; project administration, D.P. All authors have read and agreed to the published version of the manuscript.

Funding

This research received no external funding.

Data Availability Statement

Data supporting reported results can be found by contacting the corresponding author.

Acknowledgments

The authors would like to acknowledge the support of the Universidad Agraria del Ecuador and the Climate Research Group at the Federal University of Santa Maria.

Conflicts of Interest

The authors declare no conflicts of interest.

Abbreviations

The following abbreviations are used in this manuscript:
WHWater hyacinth
WHCWater hyacinth coverage
NDVINormalized Difference Vegetation Index
NDWLNet daily water loss
ET0Reference evapotranspiration
GEEGoogle Earth Engine
NASA-POWERNASA Prediction of Worldwide Energy Resources

References

  1. Tranmer, A.; Weigel, D.; Marti, C.; Vidergar, D.; Benjankar, R.; Tonina, D.; Goodwin, P.; Imberger, J. Coupled reservoir-river systems: Lessons from an integrated aquatic ecosystem assessment. J. Environ. Manag. 2020, 260, 110107. [Google Scholar] [CrossRef]
  2. Tundisi, J. Reservoirs: New challenges for ecosystem studies and environmental management. Water Secur. 2018, 4, 1–7. [Google Scholar] [CrossRef]
  3. Bănăduc, D.; Simić, V.; Cianfaglione, K.; Barinova, S.; Afanasyev, S.; Öktener, A.; McCall, G.; Simić, S.; Curtean-Bănăduc, A. Freshwater as a Sustainable Resource and Generator of Secondary Resources in the 21st Century: Stressors, Threats, Risks, Management and Protection Strategies, and Conservation Approaches. Int. J. Environ. Res. Public Health 2022, 19, 16570. [Google Scholar] [CrossRef] [PubMed]
  4. Jones, P.E.; Tummers, J.; Galib, S.M.; Woodford, D.J.; Hume, J.; Silva, L.G.M.; Braga, R.R.; de Leaniz, C.G.; Vitule, J.; Herder, J.E.; et al. The Use of Barriers to Limit the Spread of Aquatic Invasive Animal Species: A Global Review. Front. Ecol. Evol. 2021, 9, 611631. [Google Scholar] [CrossRef]
  5. Kovalenko, K.; Pelicice, F.; Kats, L.; Kotta, J.; Thomaz, S. Aquatic invasive species: Introduction to the Special Issue and dynamics of public interest. Hydrobiologia 2021, 848, 1939–1953. [Google Scholar] [CrossRef]
  6. Lázaro-Lobo, A.; Ervin, G.N. Wetland Invasion: A Multi-Faceted Challenge during a Time of Rapid Global Change. Wetlands 2021, 41, 64. [Google Scholar] [CrossRef]
  7. Janssens, N.; Schreyers, L.; Biermann, L.; Van Der Ploeg, M.; Bui, T.K.L.; Van Emmerik, T. Rivers running green: Water hyacinth invasion monitored from space. Environ. Res. Lett. 2022, 17, 044069. [Google Scholar]
  8. Guo, Z.F.; Boeing, W.J.; Borgomeo, E.; Xu, Y.; Weng, Y. Linking reservoir ecosystems research to the sustainable development goals. Sci. Total Environ. 2021, 781, 146769. [Google Scholar] [CrossRef]
  9. Fisher, J.; Melton, F.; Middleton, E.; Hain, C.; Anderson, M.C.; Allen, R.; Mccabe, M.; Hook, S.; Baldocchi, D.; Townsend, P.; et al. The future of evapotranspiration: Global requirements for ecosystem functioning, carbon and climate feedbacks, agricultural management, and water resources. Water Resour. Res. 2017, 53, 2618–2626. [Google Scholar] [CrossRef]
  10. Fitton, N.; Alexander, P.; Arnell, N.W.; Bajzelj, B.; Calvin, K.V.; Doelman, J.; Gerber, J.; Havlik, P.; Hasegawa, T.; Herrero, M.; et al. The vulnerabilities of agricultural land and food production to future water scarcity. Glob. Environ. Change 2019, 58, 101944. [Google Scholar] [CrossRef]
  11. Sierra-Carmona, C.G.; Hernández-Orduña, M.G.; Murrieta-Galindo, R. Alternative Uses of Water Hyacinth (Pontederia crassipes) from a Sustainable Perspective: A Systematic Literature Review. Sustainability 2022, 14, 3931. [Google Scholar] [CrossRef]
  12. Abba, A.; Sankarannair, S. Global impact of water hyacinth (Eichhornia crassipes) on rural communities and mitigation strategies: A systematic review. Environ. Sci. Pollut. Res. 2024, 31, 43616–43632. [Google Scholar] [CrossRef]
  13. Beamish, A.; Raynolds, M.K.; Epstein, H.; Frost, G.V.; Macander, M.J.; Bergstedt, H.; Bartsch, A.; Kruse, S.; Miles, V.; Tanis, C.M.; et al. Recent trends and remaining challenges for optical remote sensing of Arctic tundra vegetation: A review and outlook. Remote Sens. Environ. 2020, 246, 111872. [Google Scholar]
  14. Rowan, G.S.L.; Kalacska, M. A Review of Remote Sensing of Submerged Aquatic Vegetation for Non-Specialists. Remote Sens. 2021, 13, 623. [Google Scholar] [CrossRef]
  15. Singh, G.; Reynolds, C.; Byrne, M.; Rosman, B. A remote sensing method to monitor water, aquatic vegetation, and invasive water hyacinth at national extents. Remote Sens. 2020, 12, 4021. [Google Scholar] [CrossRef]
  16. Dierssen, H.; Ackleson, S.; Joyce, K.; Hestir, E.; Castagna, A.; Lavender, S.; McManus, M. Living up to the Hype of Hyperspectral Aquatic Remote Sensing: Science, Resources and Outlook. Front. Environ. Sci. 2021, 9, 649528. [Google Scholar] [CrossRef]
  17. Giardina, F.; Gentine, P.; Konings, A.G.; Seneviratne, S.I.; Stocker, B.D. Diagnosing evapotranspiration responses to water deficit across biomes using deep learning. New Phytol. 2023, 240, 968–983. [Google Scholar]
  18. Ordóñez Tapia, M.F. La forma de Guayaquil: Entre lo protegido y lo privado: Caso de Vía a la Costa. In Proceedings of the IV Congreso ISUF-H: Metrópolis en Recomposición: Prospectivas Proyectuales en el Siglo XXI: Forma Urbis y Territorios Metropolitanos, Barcelona, Spain, 28–30 September 2020; DUOT, UPC: Barcelona, Spain, 2020; pp. 1–12. [Google Scholar]
  19. Portalanza, D.; Torres, M.; Rosso, F.; Zuluaga, C.F.; Durigon, A.; Horgan, F.G.; Alava, E.; Ferraz, S. Climate variability and change in Ecuador: Dynamic downscaling of regional projections with RegCM4 and HadGEM2-ES for informed adaptation strategies. Front. Clim. 2024, 6, 1344868. [Google Scholar]
  20. Datta, A.; Maharaj, S.; Prabhu, G.N.; Bhowmik, D.; Marino, A.; Akbari, V.; Rupavatharam, S.; Sujeetha, J.A.R.; Anantrao, G.G.; Poduvattil, V.K.; et al. Monitoring the spread of water hyacinth (Pontederia crassipes): Challenges and future developments. Front. Ecol. Evol. 2021, 9, 631338. [Google Scholar]
  21. Sanabria, J.; Carrillo, C.M.; Labat, D. Unprecedented Rainfall and Moisture Patterns during El Niño 2016 in the Eastern Pacific and Tropical Andes: Northern Perú and Ecuador. Atmosphere 2019, 10, 768. [Google Scholar] [CrossRef]
  22. Thielen, D.R.; Ramoni-Perazzi, P.; Zamora-Ledezma, E.; Puche, M.L.; Marquez, M.; Quintero, J.I.; Rojas, W.; Quintero, A.; Bianchi, G.; Soto-Werschitz, I.A.; et al. Effect of extreme El Niño events on the precipitation of Ecuador. Nat. Hazards Earth Syst. Sci. 2023, 23, 1507–1527. [Google Scholar] [CrossRef]
  23. Kheyruri, Y.; Sharafati, A.; Ahmadi Lavin, J. Performance assessment of NASA POWER temperature product with different time scales in Iran. Acta Geophys. 2023, 72, 1175–1189. [Google Scholar] [CrossRef]
  24. Duarte, Y.C.N.; Sentelhas, P.C. NASA/POWER and DailyGridded weather datasets—How good they are for estimating maize yields in Brazil? Int. J. Biometeorol. 2020, 64, 319–329. [Google Scholar] [CrossRef]
  25. Rosa, S.L.K.; de Souza, J.L.M.; dos Santos, A.A. Data from NASA Power and surface weather stations under different climates on reference evapotranspiration estimation. Pesqui. Agropecuária Bras. 2023, 58, e03261. [Google Scholar] [CrossRef]
  26. U.S. Geological Survey. Landsat 7 Collection 2 Level-1 Data, Dataset; U.S. Geological Survey: Sioux Falls, SD, USA, 2021. [Google Scholar]
  27. U.S. Geological Survey. Landsat 8 Collection 2 Level-1 Data, Dataset; U.S. Geological Survey: Sioux Falls, SD, USA, 2021. [Google Scholar] [CrossRef]
  28. Amani, M.; Ghorbanian, A.; Ahmadi, S.A.; Kakooei, M.; Moghimi, A.; Mirmazloumi, S.M.; Moghaddam, S.H.A.; Mahdavi, S.; Ghahremanloo, M.; Parsian, S.; et al. Google earth engine cloud computing platform for remote sensing big data applications: A comprehensive review. IEEE J. Sel. Top. Appl. Earth Obs. Remote Sens. 2020, 13, 5326–5350. [Google Scholar]
  29. Skakun, S.; Wevers, J.; Brockmann, C.; Doxani, G.; Aleksandrov, M.; Batič, M.; Frantz, D.; Gascon, F.; Gómez-Chova, L.; Hagolle, O.; et al. Cloud Mask Intercomparison eXercise (CMIX): An evaluation of cloud masking algorithms for Landsat 8 and Sentinel-2. Remote Sens. Environ. 2022, 274, 112990. [Google Scholar] [CrossRef]
  30. Trinh-Tuan, L.; Matsumoto, J.; Tangang, F.T.; Juneng, L.; Cruz, F.; Narisma, G.; Santisirisomboon, J.; Phan-Van, T.; Gunawan, D.; Aldrian, E.; et al. Application of Quantile Mapping bias correction for mid-future precipitation projections over Vietnam. Sci. Online Lett. Atmos. 2019, 15, 1–6. [Google Scholar] [CrossRef]
  31. Enayati, M.; Bozorg-Haddad, O.; Bazrafshan, J.; Hejabi, S.; Chu, X. Bias correction capabilities of quantile mapping methods for rainfall and temperature variables. J. Water Clim. Change 2021, 12, 401–419. [Google Scholar] [CrossRef]
  32. Heo, J.H.; Ahn, H.; Shin, J.Y.; Kjeldsen, T.R.; Jeong, C. Probability Distributions for a Quantile Mapping Technique for a Bias Correction of Precipitation Data: A Case Study to Precipitation Data Under Climate Change. Water 2019, 11, 1475. [Google Scholar] [CrossRef]
  33. Teshome, H.; Amente, G. Estimation of Water Losses by Transpiration from Root and Leaf Clipped Eichhornia Crassipes (Water Hyacinth). J. Equity Sci. Sustain. Dev. (JESSD) 2022, 5, 62–81. [Google Scholar]
  34. Chai, T.; Draxler, R.R. Root mean square error (RMSE) or mean absolute error (MAE)?—Arguments against avoiding RMSE in the literature. Geosci. Model Dev. 2014, 7, 1247–1250. [Google Scholar] [CrossRef]
  35. Casanueva, A.; Herrera, S.; Iturbide, M.; Lange, S.; Jury, M.; Dosio, A.; Maraun, D.; Gutiérrez, J.M. Testing bias adjustment methods for regional climate change applications under observational uncertainty and resolution mismatch. Atmos. Sci. Lett. 2020, 21, e978. [Google Scholar] [CrossRef]
  36. Ali, Y.M.; El-Din Khedr, I.S. Estimation of water losses through evapotranspiration of aquatic weeds in the Nile River (Case study: Rosetta Branch). Water Sci. 2018, 32, 259–275. [Google Scholar]
  37. Damtie, Y.A.; Mengistu, D.A.; Meshesha, D.T. Spatial coverage of water hyacinth (Eichhornia crassipes (Mart.) Solms) on Lake Tana and associated water loss. Heliyon 2021, 7, e08196. [Google Scholar]
  38. Auchterlonie, J.; Eden, C.; Sheridan, C. The phytoremediation potential of water hyacinth: A case study from Hartbeespoort Dam, South Africa. S. Afr. J. Chem. Eng. 2021, 37, 31–36. [Google Scholar] [CrossRef]
  39. Bick, E.; de Lange, E.S.; Kron, C.P.; da Silva Soler, L.; Liu, J.; Nguyen, H.D. Effects of salinity and nutrients on water hyacinth and its biological control agent, Neochetina bruchi. Hydrobiologia 2020, 847, 3213–3224. [Google Scholar] [CrossRef]
  40. Dersseh, M.G.; Tilahun, S.; Worqlul, A.; Moges, M.; Abebe, W.; Mhiret, D.A.; Melesse, A. Spatial and Temporal Dynamics of Water Hyacinth and Its Linkage with Lake-Level Fluctuation: Lake Tana, a Sub-Humid Region of the Ethiopian Highlands. Water 2020, 12, 1435. [Google Scholar] [CrossRef]
  41. Mucheye, T.; Haro, S.; Papaspyrou, S.; Caballero, I. Water Quality and Water Hyacinth Monitoring with the Sentinel-2A/B Satellites in Lake Tana (Ethiopia). Remote Sens. 2022, 14, 4921. [Google Scholar] [CrossRef]
  42. Sasaqi, D.; Pranoto, P.; Setyono, P. Estimation of Water Losses Through Evapotranspiration of Water Hyacinth (Eichhornia crassipes). Caraka Tani J. Sustain. Agric. 2019, 34, 86–100. [Google Scholar] [CrossRef]
  43. Salsabila, A.; Sofiyah; Kurniawan, T. Utilization of Water Hyacinth to Reduce Sedimentation and Evapotranspiration in the Saguling Reservoir by PT PLN Indonesia Power Saguling POMU. Int. J. Sci. Soc. 2023, 5, 27–37. [Google Scholar] [CrossRef]
  44. Germishuys, R.; Diamond, R. Nitrogen isotopes of Eichhornia crassipes (water hyacinth) confirm sewage as leading source of pollution in Hartbeespoort Reservoir, South Africa. S. Afr. J. Sci. 2022, 118. [Google Scholar] [CrossRef] [PubMed]
  45. Harun, I.; Pushiri, H.; Amirul-Aiman, A.J.; Zulkeflee, Z. Invasive Water Hyacinth: Ecology, Impacts and Prospects for the Rural Economy. Plants 2021, 10, 1613. [Google Scholar] [CrossRef] [PubMed]
  46. Thamaga, K.H.; Dube, T. Remote sensing of invasive water hyacinth (Eichhornia crassipes): A review on applications and challenges. Remote Sens. Appl. Soc. Environ. 2018, 10, 36–46. [Google Scholar] [CrossRef]
  47. Maylani, E.D.; Yuniati, R.; Wardhana, W. The effect of leaf surface character on the ability of water hyacinth, *Eichhornia crassipes* (Mart.) Solms. to transpire water. IOP Conf. Ser. Mater. Sci. Eng. 2020, 902, 012070. [Google Scholar] [CrossRef]
  48. Getahun, S.; Kefale, H. Problem of Water Hyacinth (Eichhornia crassipes (Mart.)) in Lake Tana (Ethiopia): Ecological, Economic, and Social Implications and Management Options. Int. J. Ecol. 2023, 2023, 4618069. [Google Scholar] [CrossRef]
  49. Shou, C.; Tian, Y.; Zhou, B.; Fu, X.; ji Zhu, Y.; Yue, F. The Effect of Rainfall on Aquatic Nitrogen and Phosphorus in a Semi-Humid Area Catchment, Northern China. Int. J. Environ. Res. Public Health 2022, 19, 10962. [Google Scholar] [CrossRef]
  50. de Almeida, J.C.A.; de Souza, C.M.; Alves, L.D.; Bastos, G.P.; da Silva, G.N.; Bila, D.M.; Júnior, A.A.O. The effects of seasonality on the quality of rainfall water in the city of rio de Janeiro. Int. J. Hydrol. 2022, 6, 118–128. [Google Scholar] [CrossRef]
  51. Qin, G.; Liu, J.; Xu, S.; Sun, Y. Pollution Source Apportionment and Water Quality Risk Evaluation of a Drinking Water Reservoir during Flood Seasons. Int. J. Environ. Res. Public Health 2021, 18, 1873. [Google Scholar] [CrossRef]
  52. Hanjaniamin, A.E.; Tabrizi, M.S.; Babazadeh, H. Dissolved oxygen concentration and eutrophication evaluation in Yamchi dam reservoir, Ardabil, Iran. Appl. Water Sci. 2023, 13, 9. [Google Scholar]
  53. Scott, R.; Knowles, J.; Nelson, J.A.; Gentine, P.; Li, X.; Barron-Gafford, G.; Bryant, R.; Biederman, J. Water Availability Impacts on Evapotranspiration Partitioning. Agric. For. Meteorol. 2020, 297, 108251. [Google Scholar] [CrossRef]
  54. Nazarova, T.; Martin, P.; Giuliani, G. Monitoring vegetation change in the presence of high cloud cover with Sentinel-2 in a lowland tropical forest region in Brazil. Remote Sens. 2020, 12, 1829. [Google Scholar] [CrossRef]
  55. Li, Z.; Shen, H.; Weng, Q.; Zhang, Y.; Dou, P.; Zhang, L. Cloud and cloud shadow detection for optical satellite imagery: Features, algorithms, validation, and prospects. Isprs J. Photogramm. Remote Sens. 2022, 188, 89–108. [Google Scholar]
  56. Chaurasia, A.N.; Parmar, R.M.; Dave, M.G.; Krishnayya, N.S.R. Integrating field- and remote sensing data to perceive species heterogeneity across a climate gradient. Sci. Rep. 2024, 14, 42. [Google Scholar] [CrossRef] [PubMed]
  57. May, L.; Dobel, A.J.; Ongore, C. Controlling water hyacinth (Eichhornia crassipes (Mart.) Solms): A proposed framework for preventative management. Inland Waters 2022, 12, 163–172. [Google Scholar] [CrossRef]
  58. Gaurav, G.K.; Mehmood, T.; Cheng, L.; Klemeš, J.J.; Shrivastava, D.K. Water hyacinth as a biomass: A review. J. Clean. Prod. 2020, 277, 122214. [Google Scholar]
Figure 1. Study area. The reservoir is highlighted in red.
Hydrology 12 00080 g001
Figure 2. Theoretical framework.
Hydrology 12 00080 g002
Figure 3. Temporal variation in water hyacinth coverage (WHC) within Chongón Reservoir during the rainy (December–May) and dry (June–November) seasons from 2002 to 2022. Coverage is categorized into three classes: Class 1 represents open water bodies, Class 2 represents sparse vegetation (algae or partially submerged vegetation), and Class 3 indicates abundant vegetation dominated by water hyacinth.
Hydrology 12 00080 g003
Figure 4. Spatial distribution and proliferation of water hyacinth (WH) in Chongón Reservoir, comparing conditions during the rainy seasons of 2002 and 2017. The classes are: Class 1—open water, Class 2—sparse vegetation, and Class 3—dense vegetation dominated by WH. This comparison highlights the substantial expansion and spatial shift of dense WH infestations over 15 years.
Hydrology 12 00080 g004
Figure 5. Taylor diagrams illustrating the agreement between observed and satellite-derived reference evapotranspiration ( E T 0 ) before and after bias correction, presented on (a) monthly, (b) seasonal, and (c) yearly temporal scales. These diagrams visualize improvements in correlation, standard deviation, and centered root mean square difference (RMSD) following the bias correction process.
Hydrology 12 00080 g005
Figure 6. Comparison of reference evapotranspiration ( E T 0 ) estimates before (a) and after (b) the quantile mapping bias correction, for both rainy and dry seasons in Chongón Reservoir. Box plots illustrate medians, quartiles, and outliers, clearly demonstrating the adjustment and improved alignment of satellite-derived estimates with observed meteorological data.
Hydrology 12 00080 g006
Figure 7. Linear regression model illustrating the relationship between net daily water loss (NDWL, mm/day) and water hyacinth coverage (WHC, km2) in Chongón Reservoir.
Hydrology 12 00080 g007
Table 1. Record of satellite image download dates.
No.Date of EntrySatellite Used
113 January 2002; 17 April 2002Landsat 07
221 May 2002; 16 September 2002Landsat 07
311 January 2007; 12 May 2007Landsat 07
411 June 2007; 2 November 2007Landsat 07
52 March 2012; 12 April 2012Landsat 07
62 August 2012; 12 September 2012Landsat 07
71 January 2015; 15 April 2015Landsat 08
830 May 2015; 31 July 2015Landsat 08
930 January 2016; 30 May 2016Landsat 08
101 September 2016; 30 November 2016Landsat 08
111 January 2017; 31 May 2017Landsat 08
1216 June 2017; 30 November 2017Landsat 08
1318 April 2018; 15 May 2018Landsat 08
1418 June 2018; 15 October 2018Landsat 08
1515 January 2019; 17 April 2019Landsat 08
1627 June 2019; 3 October 2019Landsat 08
177 January 2022; 1 February 2022Landsat 09
1815 June 2022; 30 November 2022Landsat 09
Table 2. Annual water hyacinth coverage (WHC) in Chongón Reservoir between 2002 and 2022, differentiated by rainy (December–May) and dry (June–November) seasons. Coverage values are provided both in square kilometers and as percentages of the total reservoir surface area, highlighting seasonal and interannual variability in WH proliferation.
YearRainy SeasonDry Season
Coverage (km2) Percentage (%) Coverage (km2) Percentage (%)
20021.6810.423.8523.87
20076.1237.995.8836.49
20125.6034.773.1319.40
20155.3733.325.9737.07
20165.9837.135.3032.90
20176.8242.332.6816.63
20186.1037.853.9124.28
20195.4633.884.6829.05
20221.8211.292.6116.20
Table 3. Statistical summary of water hyacinth evapotranspiration ( E T WH ) by season (mm/year).
SeasonMeanMaxMinQ1MedianQ3
Rainy Season2309.902658.202176.072198.792282.142352.53
Dry Season1917.872086.181811.171849.651915.221969.58
Table 4. Net daily water loss (NDWL, mm/day) due to evapotranspiration associated with water hyacinth (WH) in Chongón Reservoir for selected years.
YearSeasonWH Area (km2)NDWL (mm/Day)
2002Rainy1.683.21
2002Dry3.855.01
2007Rainy6.1211.29
2007Dry5.887.46
2012Rainy5.6010.14
2012Dry3.133.97
2015Rainy5.379.74
2015Dry5.977.57
2016Rainy5.9810.85
2016Dry5.306.72
2017Rainy6.8212.38
2017Dry2.683.40
2018Rainy6.1011.08
2018Dry3.914.96
2019Rainy5.469.91
2019Dry4.685.94
2022Rainy1.823.31
2022Dry2.613.31
Table 5. Monthly net daily water loss (NDWL) standardized by water hyacinth coverage (WHC) for rainy and dry seasons, Chongón Reservoir (2002–2022).
YearRainy Season NDWL (mm/Month/km2)Dry Season NDWL (mm/Month/km2)
200257.3239.04
200755.3438.06
201254.3238.05
201554.4138.04
201654.4338.04
201754.4638.06
201854.4938.06
201954.4538.08
202254.5638.05
Table 6. Pearson’s correlation coefficients between water hyacinth coverage (WHC) and climatic variables.
Variablerp-Value
Net Daily Water Loss (NDWL)0.96<0.001
Reference Evapotranspiration ( E T 0 ) 0.08 0.81
Maximum Temperature ( T max ) 0.15 0.65
Minimum Temperature ( T min )0.430.23
Solar Radiation0.500.16
Precipitation0.320.40
Table 7. Regression coefficients for the model predicting water hyacinth coverage (WHC).
VariableCoefficientStandard Errort-Valuep-Value
Intercept ( β 0 ) 918.336 1577.502 0.582 0.5704
NDWL ( β 1 ) 0.00933 0.01442 0.647 0.5880
Rads ( β 2 ) 70.1429 37.4126 1.875 0.0835
Tempmin ( β 3 ) 75.5587 64.1133 1.179 0.2597
WSmin ( β 4 ) 55.9963 156.4264 0.358 0.7261
Table 8. Regression coefficients for the simple model with NDWL as the sole predictor.
VariableCoefficientStandard Errort-Valuep-Value
Intercept ( α 0 ) 1.136 0.3551 3.199 0.0056
NDWL ( α 1 ) 4.630 × 10 4 4.357 × 10 5 10.626 1.17 × 10 8
Disclaimer/Publisher’s Note: The statements, opinions and data contained in all publications are solely those of the individual author(s) and contributor(s) and not of MDPI and/or the editor(s). MDPI and/or the editor(s) disclaim responsibility for any injury to people or property resulting from any ideas, methods, instructions or products referred to in the content.

