Article

Role of Hungry Water on Sediment Dynamics: Assessment of Valley Degradation, Bed Material Changes and Flood Inundation in Pamba River During Kerala Flood, 2018

National Centre for Earth Science Studies, Thiruvananthapuram 695011, India
*
Author to whom correspondence should be addressed.
Hydrology 2025, 12(4), 79; https://doi.org/10.3390/hydrology12040079
Submission received: 19 February 2025 / Revised: 29 March 2025 / Accepted: 30 March 2025 / Published: 1 April 2025

Abstract

Flood frequencies, along with the associated loss of life and property, have risen significantly due to climate change and increasing human activities. While prior research has primarily focused on high-intensity rainfall events and reservoir management in flood management, the influence of sediment-starved water—termed “hungry water”—released from dams in controlling flood dynamics has not gained much attention. The present study is aimed at exploring the potential role of sediment-starved water, or the “hungry water effect” on the valley degradation, bed material changes and flood inundation in the Pamba River during the Kerala Flood, 2018, through a detailed characterization of bed materials and their deposition in the channel bed. The release of sediment-starved water from the Kakki reservoir during the episodic precipitation event (15 to 17 August 2018) resulted in significant bed degradation and scouring of the valley slopes, leading to the deposition of large boulders and rock masses and the inundating of approximately 196 km2 of floodplains. This study highlights the need for integrated sediment management strategies in reservoir operations by providing essential insights into sediment transport dynamics during extreme weather events. Understanding these processes is crucial for formulating effective flood mitigation strategies and improving the resilience of riverine ecosystems, particularly as the interaction between intense rainfall and sediment-depleted releases significantly exacerbated the flood’s severity.

1. Introduction

Floods, often resulting from intense rainfall, sudden runoff, and the inundation of low-lying areas, are among the most frequent and deadliest disasters, causing disruptions to daily life and the economic wellbeing of affected regions [1,2]. According to predictions, flood exposure is expected to triple by 2050 [3], driven by rising global temperatures, an increase in the frequency of extreme rainfall events and changing global precipitation patterns [4,5,6,7,8,9]. Over the past decades, there has been an increasing trend in global flood hazards, mainly due to the burgeoning human population and expanding economic activities in floodplains and flood-prone areas [10,11,12]. With the projected increase in extreme rainfall events worldwide, the frequency and impact of floods, including losses of life and property, are anticipated to increase significantly. Future flood impacts are expected to vary by region, with countries in Southeast Asia, Peninsular India and Eastern Africa facing substantial increases in flood frequencies [5,13,14]. India is one of the most flood-affected countries globally, experiencing severe flood events in recent years (e.g., the Mumbai Flood of 2005; Bihar Floods in 2008; Uttarakhand Flood in 2013; and Chennai Flood in 2015), with 0.8% of its USD 1.87 trillion GDP exposed to flood risk [15]. The Kerala Floods of 2018 and 2019 are among the most recent major flood events the country.
The state of Kerala, located on the southwestern flank of the Western Ghats—an elevated continental margin of India—experienced extensive flooding in August 2018. This flood has been described as the worst in recent history; the last recorded megaflood in the region occurred in 1924. The devastating flood and the associated landslides affected millions and had a significant impact on the socio-economic and environmental fabric of the state [16,17]. The post-disaster assessment commissioned by the Government of Kerala estimated the economic loss at approximately USD 3.8 million. The causes of this catastrophic flooding have been attributed to climatic, geographic and human-made factors [16,17,18,19]. The state experienced abnormally heavy rainfall during the southwest monsoon season (June to September) of 2018, with the southern part of the state receiving more than 200% of the normal rainfall between 1 May and 21 August [16]. Between 1 and 19 August 2018, Kerala received approximately 164% more rainfall than usual, with two major heavy rainfall episodes occurring on 8–10 August and 14–19 August [19]. Compared to long-term records from 1901 to 2017, the 1-day and 2-day extreme precipitation values recorded on 15 and 16 August had return periods of 75 and 200 years, respectively [16]. While severe rainfall in August was widely acknowledged as a major contributor to the flooding, the role of reservoirs in these events was explored by [17] using a hydrological modeling approach in the Periyar River basin. Their results suggested that reservoir operations could have attenuated peak flooding by only 16 to 21% even if emptied in advance, due to significant runoff contributions from intermediate catchments. Additionally, [19] showed that the six major reservoirs serving the state would have needed 34% more capacity to handle the heavy rainfall events of August 2018.
While the impact of high-intensity rainfall events on large-scale flooding has been extensively studied, the role of high-energy, sediment-starved water—also known as “hungry water”—released from dams in exacerbating flooding has not yet been adequately addressed. “Hungry water” refers to sediment-starved water that results from disruptions to natural sediment transport processes in rivers, typically due to dams or gravel mining. According to Kondolf [20], “hungry water” is clear water released from dams that has little to no sediment load but retains the energy to transport sediment. This energy is often expended on the erosion of the channel bed and banks, leading to channel incision (downcutting), the coarsening of bed materials, and a loss of habitat for aquatic species.The disturbance in the flow’s ability to carry sediment can alter river flow regimes during flood events. Flooding occurs when the river channel cannot convey the quantity of runoff from heavy rainfall events or dam releases. However, sediment loading and transport also play a crucial role in regulating the intensity and turbulence of flooding. When sediment-starved water stored in upstream reservoirs at higher elevations is released, it can alter flow regimes and disrupt the longitudinal continuum of riverine sediment transport [20,21,22,23]. The release of sediment-starved water from reservoirs can significantly impact the downstream river’s geomorphology and functioning.
While high-intensity rainfall events are widely recognized as drivers of large-scale flooding, the impact of “hungry water” has not been adequately addressed. When reservoirs trap sediment, the water released downstream is often deficient in sediment load, leading to increased erosive capacity, channel instability, and altered flood dynamics [24]. Studies have demonstrated that such hydromorphic disruptions can significantly affect riverine sediment transport, thereby modifying flood intensity and turbulence. The dams in tropical rivers reduce flow variability and sediment supply, leading to geomorphic adjustments such as channel incision and aggradation, which further exacerbate flooding risks [25]. Streamflow changes and sediment depletion are evident, with a notable annual reduction of 140,000 tons of sediment at downstream locations of the Upper Srepok River basin due to the impacts of cascade reservoir operations [26]. The Three Gorges dam exemplifies how large-scale reservoir regulation shifts seasonal water and sediment dynamics, influencing hydrograph patterns and sediment deposition downstream [27]. These studies emphasize the necessity of integrating sediment transport considerations into flood risk assessments to better understand and mitigate the compounded effects of dam operations and extreme hydrological events on river systems.
The Kerala has 44 dams [28,29] constructed across its 43 small and medium rivers that drain its highly undulating terrain. The rivers in Kerala flow through mountainous terrain and steep slopes, and the narrow width of the land surface causes most of the rainwater to drain into the Arabian Sea within 48 to 72 h. The flow of the rivers through high-gradient terrains, combined with dam releases, create favorable conditions for sediment-starved water to intensify the wear and tear of clastic particles and scour valleys downstream. In the lowlands, the highly meandering rivers of the state further aid sediment deposition in river channels due to energy loss at bends, obstructing the natural flow and thereby intensifying flooding. The aim of this study is to explore the potential role of sediment-starved water, or the “hungry water effect”, on the valley degradation, bed material changes and flood inundation in the Pamba River during the Kerala Flood, 2018. The Pamba River basin was selected as a case study, and the characteristics of bed material and sediments deposited from highlands to midlands were examined in detail to identify evidence of the “hungry water effect” and other geo-environmental factors that contributed to the flooding event.

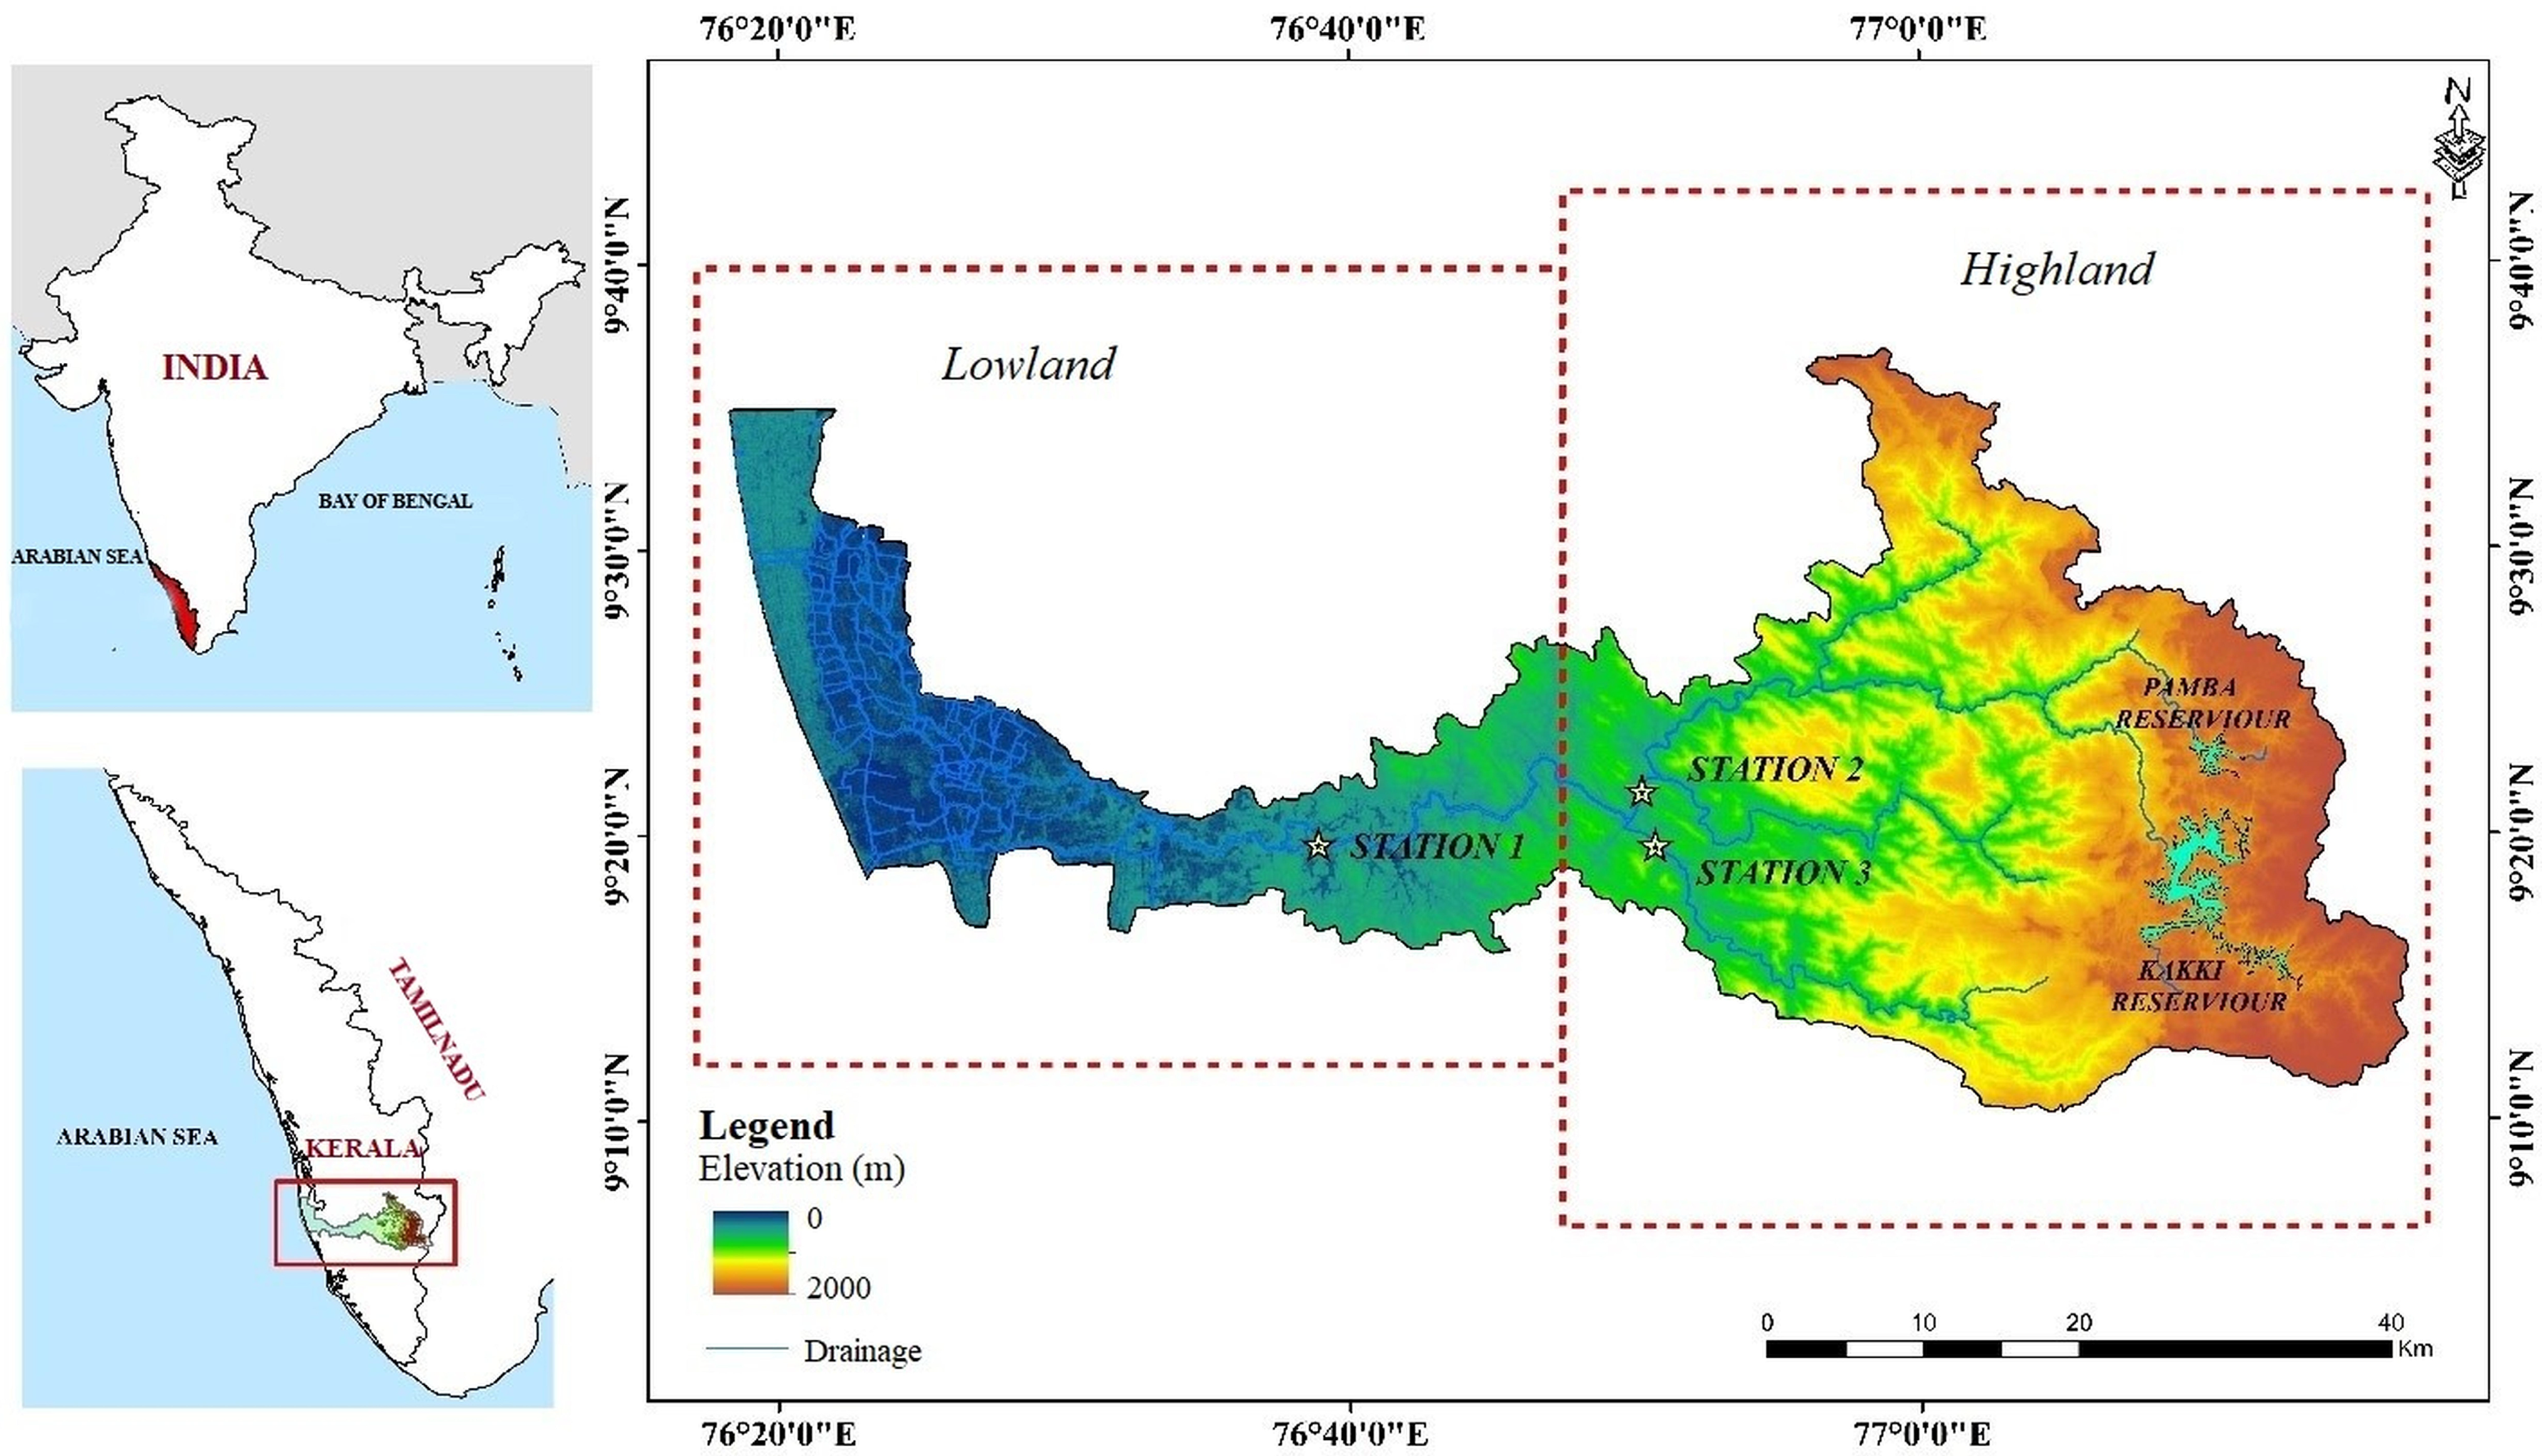
2. Pamba River Basin—Geo-Environmental Settings

The Pamba River basin, situated in the Kerala state of India (Figure 1), covers a total catchment area of 2235 km2 and spans the districts of Pathanamthitta, Idukki and Alappuzha. The river is approximately 176 km long and originates in the Western Ghats at an elevation of around 1650 m above Mean Sea Level (MSL), flowing down to its confluence with the Vembanad estuary. The river has many tributaries, with Kakki Ar and Kakkad Ar being the most important, as they contribute a significant portion of water and sediments to the master channel of the Pamba River. The lowermost tributary, namely the Kallar, joins the Pamba River at Vadasserikkara, after draining through dense forests in the uplands. In general, the river exhibits a dendritic to sub-dendritic drainage pattern. There are two major reservoirs, Pamba and Kakki (the Pamba dam and Kakki dam, respectively), constructed in the uplands of the river basin. The basin showcases a striking physical diversity, with its eastern region dominated by the dissected high hills of the Western Ghats, gradually transitioning to broad coastal plains and low-lying areas towards the west. As the Pamba River approaches the Vembanad Lake, it branches into numerous distributaries, forming an intricate inland delta system before merging into the estuarine waters of the lake.
The basin’s land use is primarily dominated by forests and plantations such as rubber, coconut, teak and tea. The upper reaches are characterized by dense forests, comprising natural vegetation and forest plantations, while the midland region is dominated by settlements interspersed with mixed tree crops such as coconut, tapioca and banana and vegetables. Geologically, the highlands of the Pamba River basin are composed of Pre-Cambrian crystalline rocks, represented by charnockites, charnockite gneisses and hypersthene–diopside gneisses. Acidic rocks like granites, syenites and pegmatites and quartz veins, as well as basic rocks like dolerite, are often found to intrude into the Pre-Cambrian crystallines. About 60% of the drainage area falls within the highlands. The lowlands of the river basin are covered by unconsolidated sediments of Late Quaternary age, which in turn are underlined by semi-consolidated Neogene sediments. The coarser particles constituting the bed sediments accumulated in the riverbed, as well as overbank areas, display particles/fragments of these rock categories. Three distinct classes of alluvial reaches are identified in the main channel of the Pamba River—viz., a plain bed reach, riffle reach and dune–ripple reach. The total length of the alluvial reach in the main channel is about 65 km. Apart from these broad categories, sporadic patches of alluvial accumulations are seen all along the river channel.
The basin’s climate is shaped by two primary rainy seasons: the southwest monsoon (SWM) from mid-May/June to August and the northeast monsoon (NEM) from October to December, followed by a dry pre-monsoon (PM) period from January to mid-May. The SWM contributes 60% of the annual rainfall, while the NEM accounts for 30%, with the remaining 10% falling during the dry season. Rainfall in the basin varies significantly, ranging from 2200 mm near the coast to 4200 mm in the highlands, with the Western Ghats on the eastern boundary receiving between 3600 mm and 4300 mm. Analyzing long-term monsoon data reveals a positive rainfall trend during the southwest monsoon in the highlands, while other seasons remain relatively stable. In contrast, the midland and lowland regions exhibit a consistent negative rainfall trend during both the southwest and northeast monsoons, with stable conditions during the pre-monsoon period [30]. The basin experiences moderate temperatures, ranging from 22.6 °C to 32.7 °C, and relative humidity levels between 53% and 95%. The two primary tributaries of the main channel (MC) of the Pamba River, referred to here as Pamba Ar (T) and Kakki Ar (T), have their confluence at Triveni Sangamam. The section of these tributaries near the confluence, along with a portion of the master channel of the Pamba River, is the focus of a detailed investigation in this study. The average annual runoff of the Pamba River is approximately 4.64 billion cubic meters, with the average total suspended sediment load of the Pamba River basin being 18 ton/day. The basin contains a total of eight dams and one barrage, with a combined total storage capacity of 487 MCM, which accounts for only 10.5% of the river’s average annual runoff. Among these, the Kakki reservoir alone holds about 92% of the total live storage capacity.

3. Data and Methods

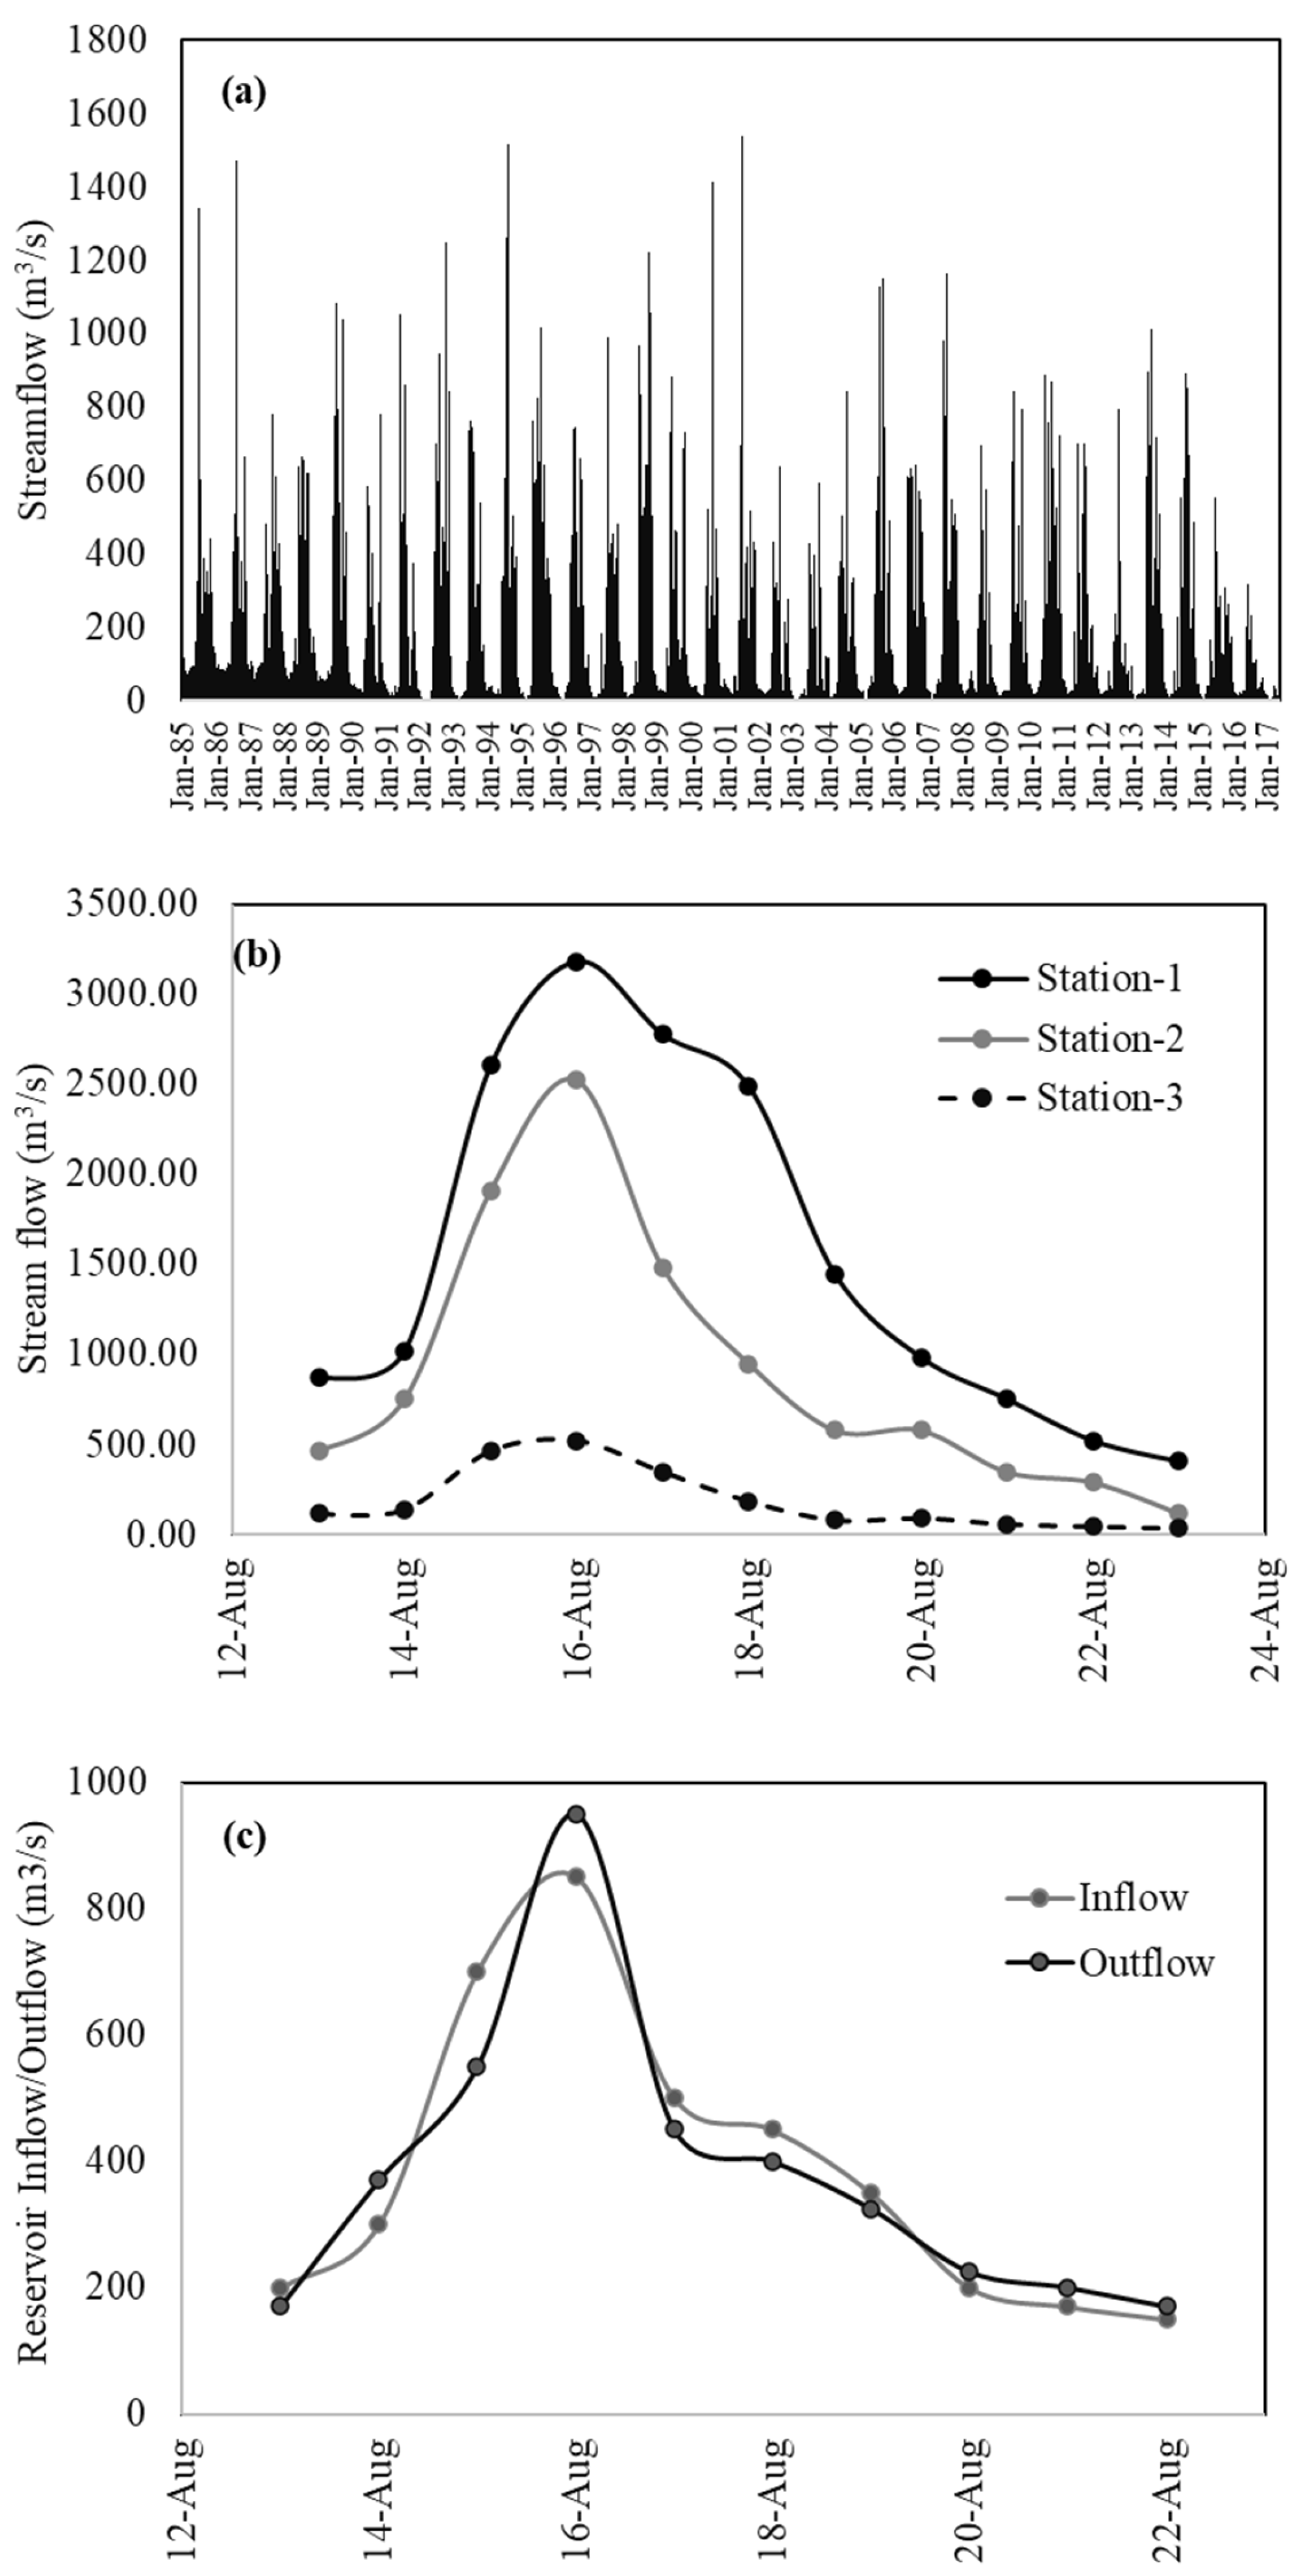
3.1. Hydrological Data

Daily streamflow and water level data for Station-1 (Figure 1) were obtained from the Central Water Commission, India, via the WRIS portal (https://indiawris.gov.in/wris assessed on 15 January 2021). For Station-2 and Station-3 (Figure 1), streamflow and water level were modeled using the MIKE rainfall runoff and hydrodynamic models. The MIKE hydrological model was calibrated and validated using observed discharge data to ensure its reliability. The calibration period spanned from 1991 to 2000, while the validation was performed on data from 2001 to 2017. The model performance was evaluated using statistical metrics, including the coefficient of determination (R2) and root mean square error (RMSE). The calibration results showed an R2 value of 0.76 and an RMSE of 2.36, indicating a good agreement between the observed and simulated discharge. During the validation period, the model maintained a reasonable performance, with an R2 value of 0.68 and an RMSE of 5.13. Rainfall data for the flood events were obtained from the National Data Centre of the India Meteorological Department, Pune. The flood marks were calculated by systematic field surveys and global positioning system. The collected flood marks show the depth of flood inundation with respect to the current water level in the river.

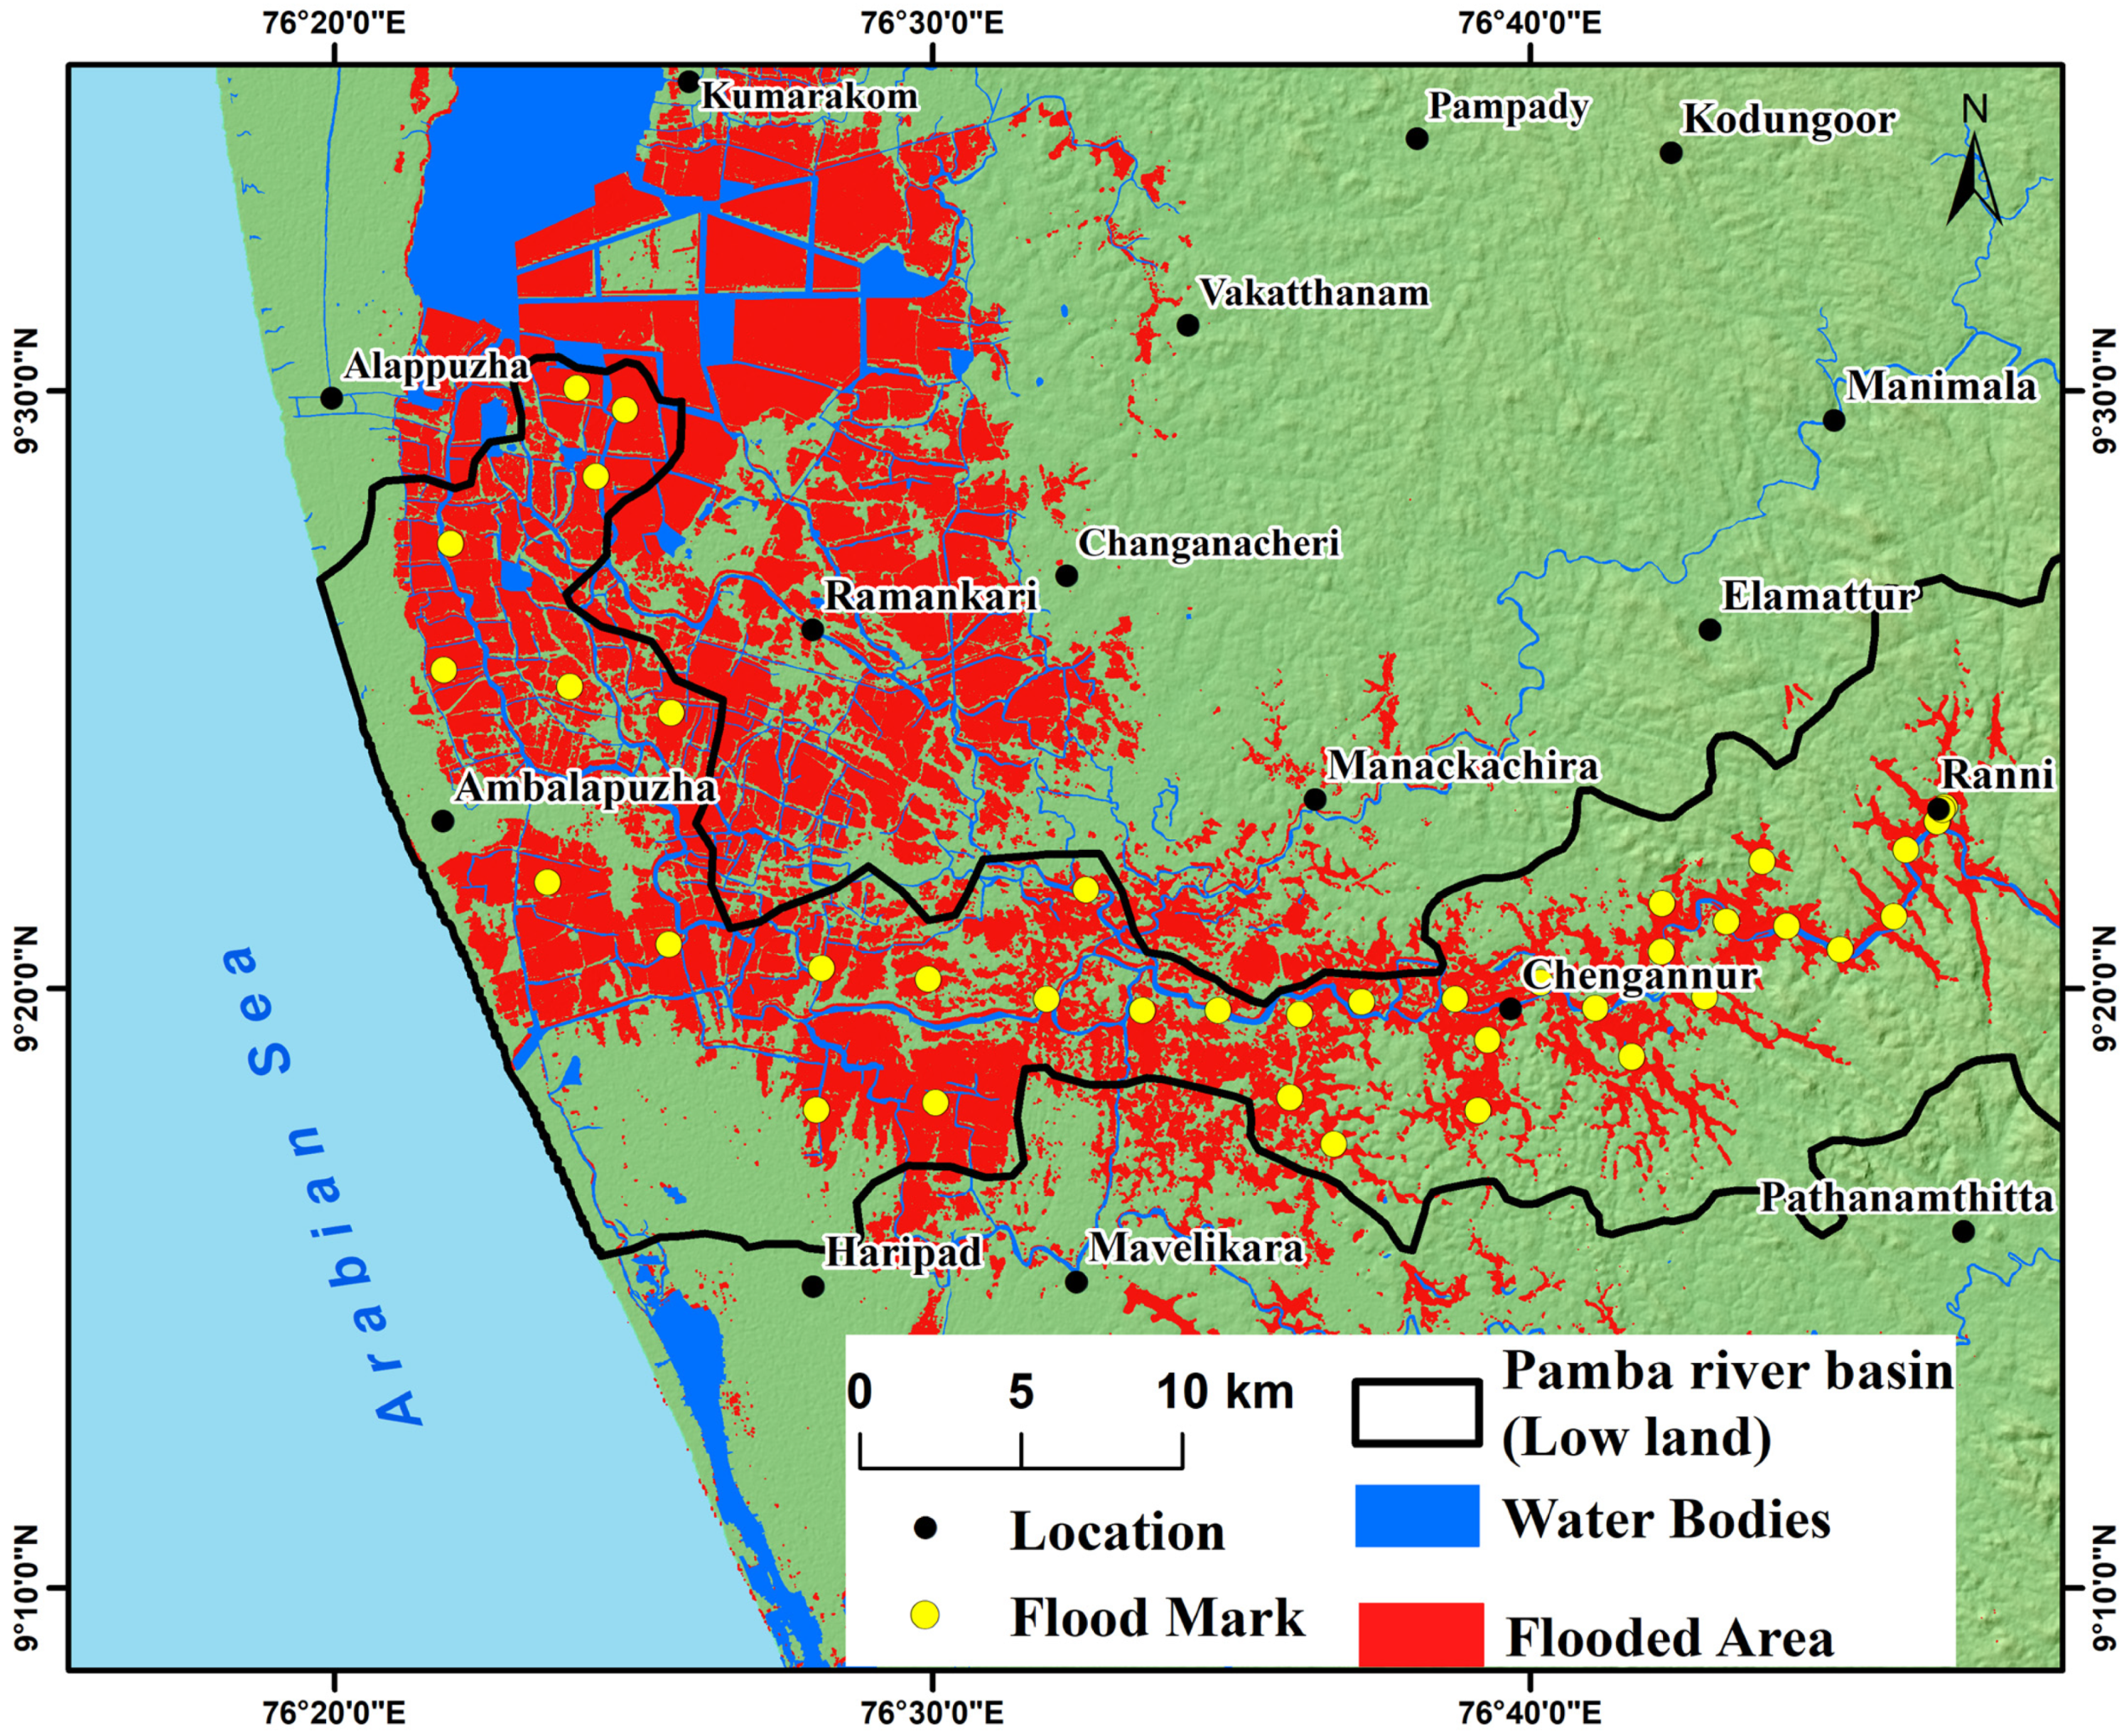
3.2. Flood Area Mapping

Sentinel 1A GRD images with VH and HH polarization acquired on 21 August 2018 were used for tracing the flood footprint in the study area. The data product is freely available from the site of the European Space Agency (ESA). In this study, Sentinel 1 Level 1 Ground Range Detection (GRD) data were used, which were already pre-processed for basic corrections. Again, the data were subjected for calibration and speckle filtering using SNAP software. After the pre-processing experiment, the VV band was used to track the flooded area. The flooded areas were determined using threshold-binning binarization and unsupervised classification. According to the threshold value, water pixels and non-water pixels were separated using unsupervised classification. Post-processing methods such as geometric correction were applied for map projection. The final output was converted into shapefiles, which were then taken into ArcGIS software 10.3 for further experiments.

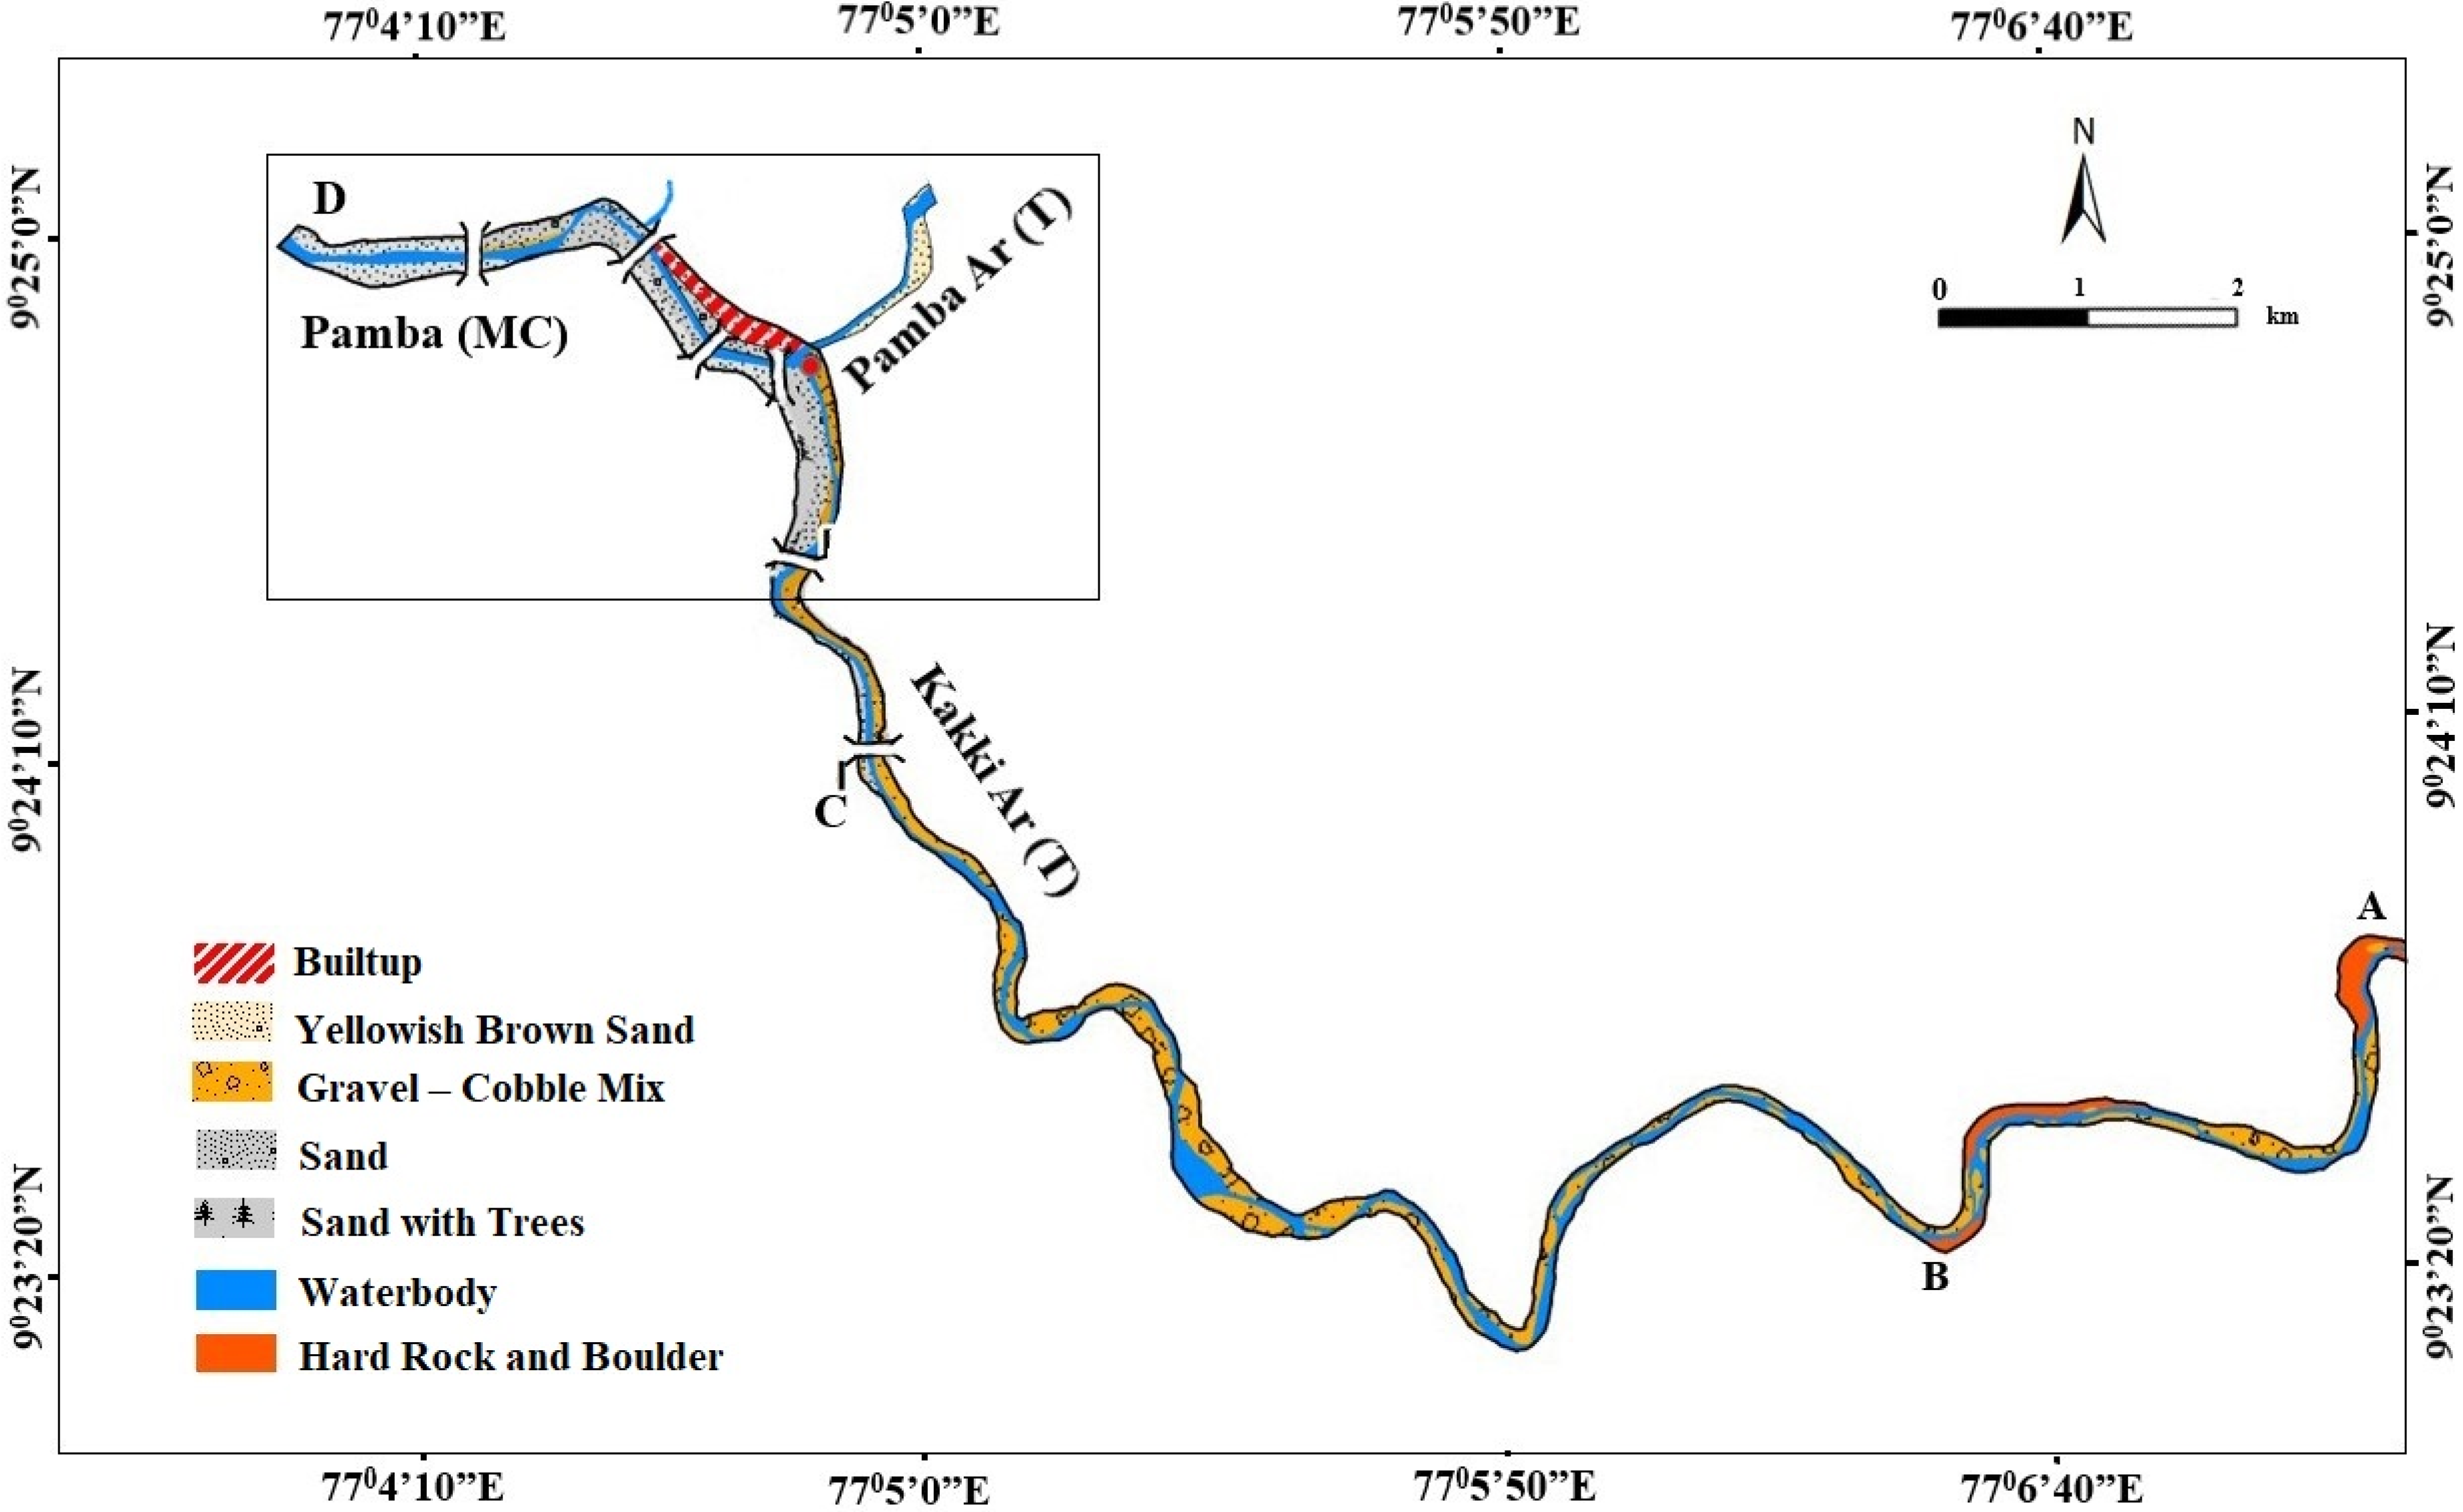
3.3. Flood Deposit Sediment—Rapid Reserve Estimation (RRE)

The thickness of sand deposits was determined using a specially fabricated coring device and a graduated PVC pipe. The material recovered from the coring device was carefully transferred and analyzed for sediment types. Profiles were established and analyzed for channel characteristics and sediment thickness. In each profile, measurements of water depth and sand thickness were taken systematically at regular intervals across the river channel, and the readings were plotted on graph paper to compute the cross-sectional area of the sand body. The apparent volume of the sand body was then computed from the cross-sectional area using geometrical methods. Observations on bottom configuration (i.e., morphological variations of sand deposits) were also considered while computing the volume of sand. The sand deposit thickness obtained from coring is representative of the overall sediment profile across the river channel. The cross-sectional area derived from systematic measurements represents the geometry of the sand body. A variability in sediment thickness due to natural heterogeneity is a key source of potential error. However, systematic coring at regular intervals helps to minimize bias in thickness estimations. The geometric method used for volume estimation assumes a relatively uniform sand distribution within each cross-section, with variations accounted for by incorporating observed morphological changes. Ground truthing was conducted through additional coring at selected locations to confirm the consistency of sand thickness measurements.

3.4. Flood Deposit Characterization

Detailed surveys have been carried out in the Pampa-Thriveni and adjoining areas of the river segment to understand the sediment dispersal pattern in the in-channel and off-channel areas of the river that are directly exposed to the flooded materials. Soil/sediment samples were collected from the study area for a detailed grain size analysis and other petrographic/surface textural and geochemical studies to unravel the contributions of flooded materials and sediments. The grain size analysis of the collected sediment samples was conducted using the standard sieve analysis method. For larger particles, the average diameter was determined using physical measurement techniques. A total of 25 sediment samples were collected from different segments of the study area. The grain size distribution of the samples was determined through combined sieving and pipette analysis, particularly when the mud content (silt + clay) was high. Details of the grain size analysis are provided as Supplementary Table S1. The aerial spread of sand, gravel and cobble accumulations (collectively known as bed materials) in the river channel and adjoining areas were estimated through field measurements. The thickness of the bed materials was measured out using spiking and coring. To study the vertical sediment profile, two soil cores were collected: Core-1, from a vertical profile of flood deposits from the 2018 flood event, and Core-2, from the Pamba River floodplain. The sediment samples were analyzed using SEM-EDS for textural and chemical composition.

4. Results

4.1. Streamflow and Flooding

The study analyzed streamflow and water level data during the extreme rainfall events of 15–17 August 2018, at three selected stations, assessing the flood impact by calculating water volumes and the extent of affected areas in the Pamba River basin. Figure 2a shows the historical streamflow in the Pamba River (1985–2017), while Figure 2b depicts the streamflow at different stations, with observed data for Station-1 and modeled data for Stations-2 and -3. Figure 2c shows the reservoir inflow/outflow during the flood event. The streamflow during August, 2018 is significantly higher than the highest flow recorded between 1985 and 2017 in the Pamba river. The previous highest flow recorded in the Pamba river was 1541 m3/s during 10th July, 2001, followed by 1516 m3/s during 3rd August 1994. During the 2018 flood event, 16th August 2018 recorded a flow of 3171 m3/s, which is more than twice the highest flow recorded, indicating the severity of the 2018 flood event.
The effect of the extreme rainfall events from 15 to 17 August, 2018 is evident from the sharp increase in streamflow in the Pamba River (Figure 2b). The river breached the full bank level on 15 August, and the floodwaters inundated the floodplains, remaining until 18 August. The flow at Station-1 (Malakkara Station) during 15, 16, and 17 August was 2697, 3171 and 2801 m3/s, respectively (source: CWC, 2018). This resulted in a total of 738 million cubic meters (MCM) over the three days, which is 150% more than the average flow for the month of August. During the same period (August 15th to 17th, 2018), the release of water from the Kakki reservoir was about 166 MCM, contributing about 25% of the flow in the Pamba MC.
The water contribution from the extreme rainfall events, together with the water released from the Kakki reservoir, resulted in the flooding of many townships and villages in the floodplains and/or overbank areas of the river basin. The water level reached heights of 16 m from bed level in Station-1 and 14 m and 16 m at Stations-2 and -3, respectively. A total of a 196 km2 area was adversely affected in the Pamba River basin; the physiography-wise contributions of the flooding are lowland—166.6 km2 (86%) and highland—27.44 km2 (14%). It is observed that the maximum flood marks of 13 m and 9 m and height from the river bed are recorded, respectively, from the highlands and lowlands. It is to be noted that the riverside towns in both the highlands and lowlands were equally flooded to dangerous levels, irrespective of the gradient of the terrain (Figure 3). Flooding in the lowlands is obvious because of the continuously accumulating water in the receiving water bodies and high tide conditions of the Arabian Sea during the flooding events. However, the flooding in the highland parts of the valleys, though, can be mainly attributed to the high-intensity rainfall events, and the role of sediment-starved water released from the reservoirs during extreme rain events also cannot be totally ignored.
The findings suggest that the combination of high-water contributions from extreme rainfall events (15 to 17 August 2018) and water released from the reservoir resulted in significant flooding. Water released from reservoirs, being deprived of sediment, may have exacerbated the flooding by intensifying its impact in both the highlands and lowlands, indicating a hungry water effect that amplified the consequences of the extreme rainfall events.

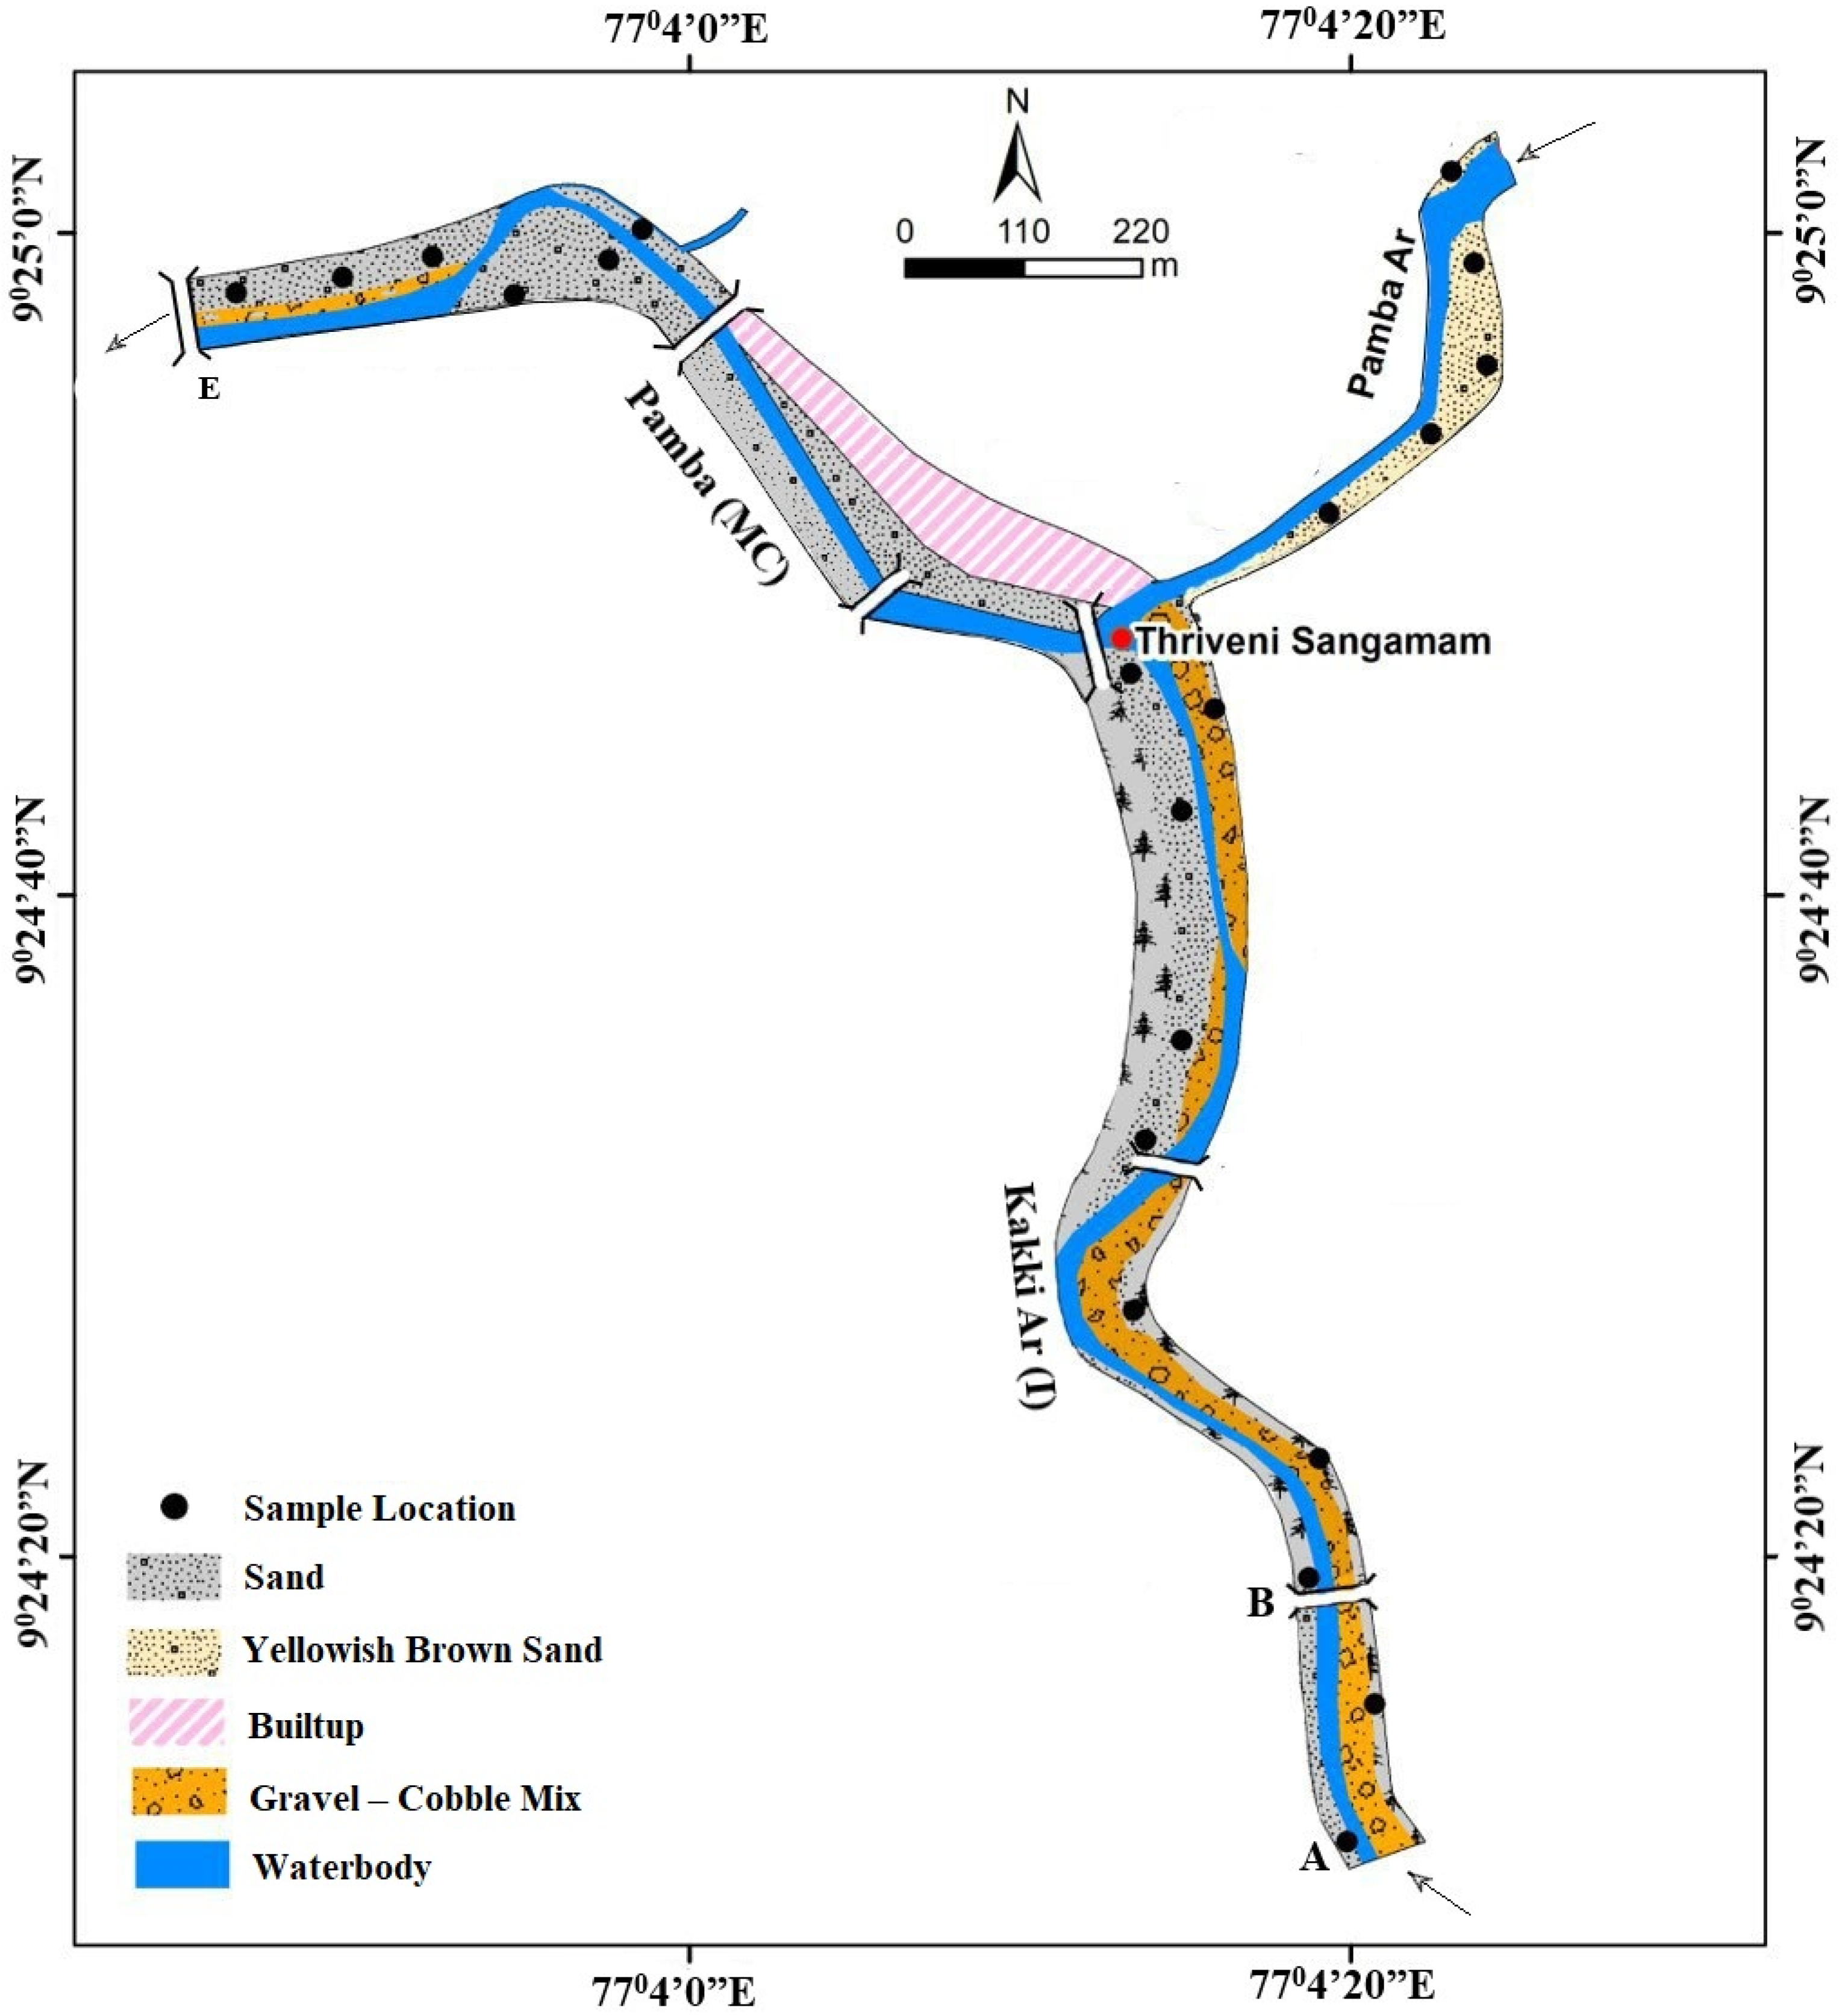
4.2. Nature and Characteristics of the Flood Deposits

This study involved a detailed characterization of flood deposits along the river system by analyzing sediment types and particle sizes across different segments. Key observations include the assessment of boulder smoothness, weathering patterns and sediment distribution in relation to energy regimes. In the Pamba-Thriveni region and neighbouring river channels, the sediment accumulation and characteristics are detailed (Table 1), highlighting sediment types, volumes, and observations from various segments of Kakki Ar and Pamba Ar (T: tributary; MC: master channel). Furthermore, the nature of flood-segregated materials in a selected section of Kakki Ar is illustrated (Figure 4), with the section marked by a dashed line designated for detailed study (refer to Figure 5).
In this context, the riverbed of Kakki Ar (T) is completely blanketed with large to very large boulders, particularly in its upstream reaches (Figure 4). The presence of very large boulders is notably prevalent in the two-kilometer stretch of the river channel downstream of the Kakki reservoir (Segment A-B in Figure 4). Most of the boulders in Kakki Ar (T) exhibit fresh surfaces that have been smoothened by abrasion and transport under the mega-turbulent hydrodynamic conditions that prevailed during the peak flood period. In contrast, the boulders in the first- and second-order tributary channels of the Kakki Ar (T) display a noticeable weathering patina, indicating that these boulders have undergone long-term weathering, erosion, abrasion and attrition processes. In general, the average diameter of the particles constituting the river sediments shows a gradual decrease downstream.
Additionally, the occurrence of slack water deposits, consisting of fine to very fine sands, has been observed in areas on either side of the river channel (Segment C-D) in the confluence point (Triveni Sangamam) of Kakki Ar (T) and Pamba Ar (T). This phenomenon results from a decrease in the energy regime due to the temporary damming of the river channel at the confluence point, caused by the obstruction of flow from man-made structures.
A detailed study of the nature of the flood deposits in Segment C–D was carried out to characterize the sediments in the region of the lower-energy regime. Figure 4 shows the nature and characteristics of the flood-segregated materials in the river segment close to the confluence point of Pamba Ar (T) Kakki Ar (T). Segment A-B (Figure 5) is generally blanketed with particles such as pebbles, cobbles and boulders that have fresh surfaces, indicating the high degree of wear and tear to which the particles are subjected during their transportation phase. On the downstream side of Segment A-B, sand and gravel deposits are predominantly noticed (Segment B-C) (Figure 5), indicating the existence of a low-energy regime around the confluence point (C). In the case of Pamba Ar (T), Segment C-D (Figure 5), sand and gravel are segregated downstream, especially close to the confluence point (C). Further upstream, the particle size changes to pebbles, cobbles and boulders, which are coated with lichen and organic materials, indicating a long residence in the riverbed, in addition to the comparatively lower turbulence of the water flow (as compared to that of Kakki Ar (T)) during the flood days. The second spell of hungry water phenomena was evident in Segment C-E (Pamba MC) (Figure 5), where the deposits were predominantly sand on the upstream side (close to confluence point C) and a gravel–cobble mix on the downstream side. This clearly indicates the existence of another spell of high-energy regimes that entrained the finer sediments, leaving coarser pebbles as lag deposits.

4.3. Quantification of Flood Deposits

The quantity of sand and gravel accumulated in the river segment near the confluence point (C) is estimated using the Rapid Reserve Estimation (RRE) method [31] and is summarized in Table 1. The total quantity of sand and gravel–cobble deposited is estimated to be approximately 288,510 m3 (Table 1). The Kakki Ar (T) has a significantly high quantity of gravel–cobble mix compared to the Pamba Ar (T) and Pamba Ar (MC). The deposits of sand/gravel in the Pamba Ar (T) are considerably lower than those in the other river segments. The gravel–cobble mix sediment type is less visible in the Pamba Ar (T), whereas the Pamba Ar (MC) has a gravel–cobble deposit of about 2798 m3. Of the total sand deposited (88,598 m3), in the studied river segment, approximately 65% of the sand is segregated in the Kakki Ar (T) and 32% in the Pamba Ar (MC). The remaining portion is segregated in the Pamba Ar (T). Though found in small amounts, the sands in the Pamba Ar (T) are quite different from those in the Kakki Ar (T), as the grains here are coated with iron oxides, indicating that the sediments in the Pamba Ar (T) were not subjected to significant wear and tear during the flood event. In contrast, the majority of the sand and gravel in the Kakki Ar (T) are generally first-generation and show a fresh appearance, indicating that the grains were subjected to intense abrasion and attrition during the flood event. T-tests were conducted to study the differences between the sediment characteristics of the two tributaries. The t-tests showed that there is a significant difference (statistically significant at α = 0.05) in the characteristics of the sediments from the two tributaries.

4.4. Surface Textural Characteristics of Sand Grains (SEM-EDS Analysis)

To understand the nature and characteristics of the sand grains, a few samples from the Kakki Ar and Pamba Ar were subjected to SEM-EDS analysis [Figure 6a,b]. This has been carried out essentially to understand their surface textural characteristics and also to gain insights into their chemical characteristics. The study revealed that the sands in the Kakki tributary are generally immature, as they are mixed with substantial proportions of rock fragments and minerals of less stable categories, such as plagioclase feldspars and inosilicates in the sediment population [32]. The sediments are formed from the intense abrasion and attrition of large particles under mega-turbulent floodwaters. The chemical composition of the grains studied from the Kakki tributary resembles that of the basic rocks in the area. In contrast, the sands in the Pamba tributary are composed of quartz-dominant grains. The high content of SiO2 in the EDS spectra supports this observation. All this points to the existence of mega-turbulent hydrodynamic conditions in the Kakki tributary, influenced by dam-released sediment-starved water, compared to the Pamba tributary, which is exposed only to the heavy rainfall.

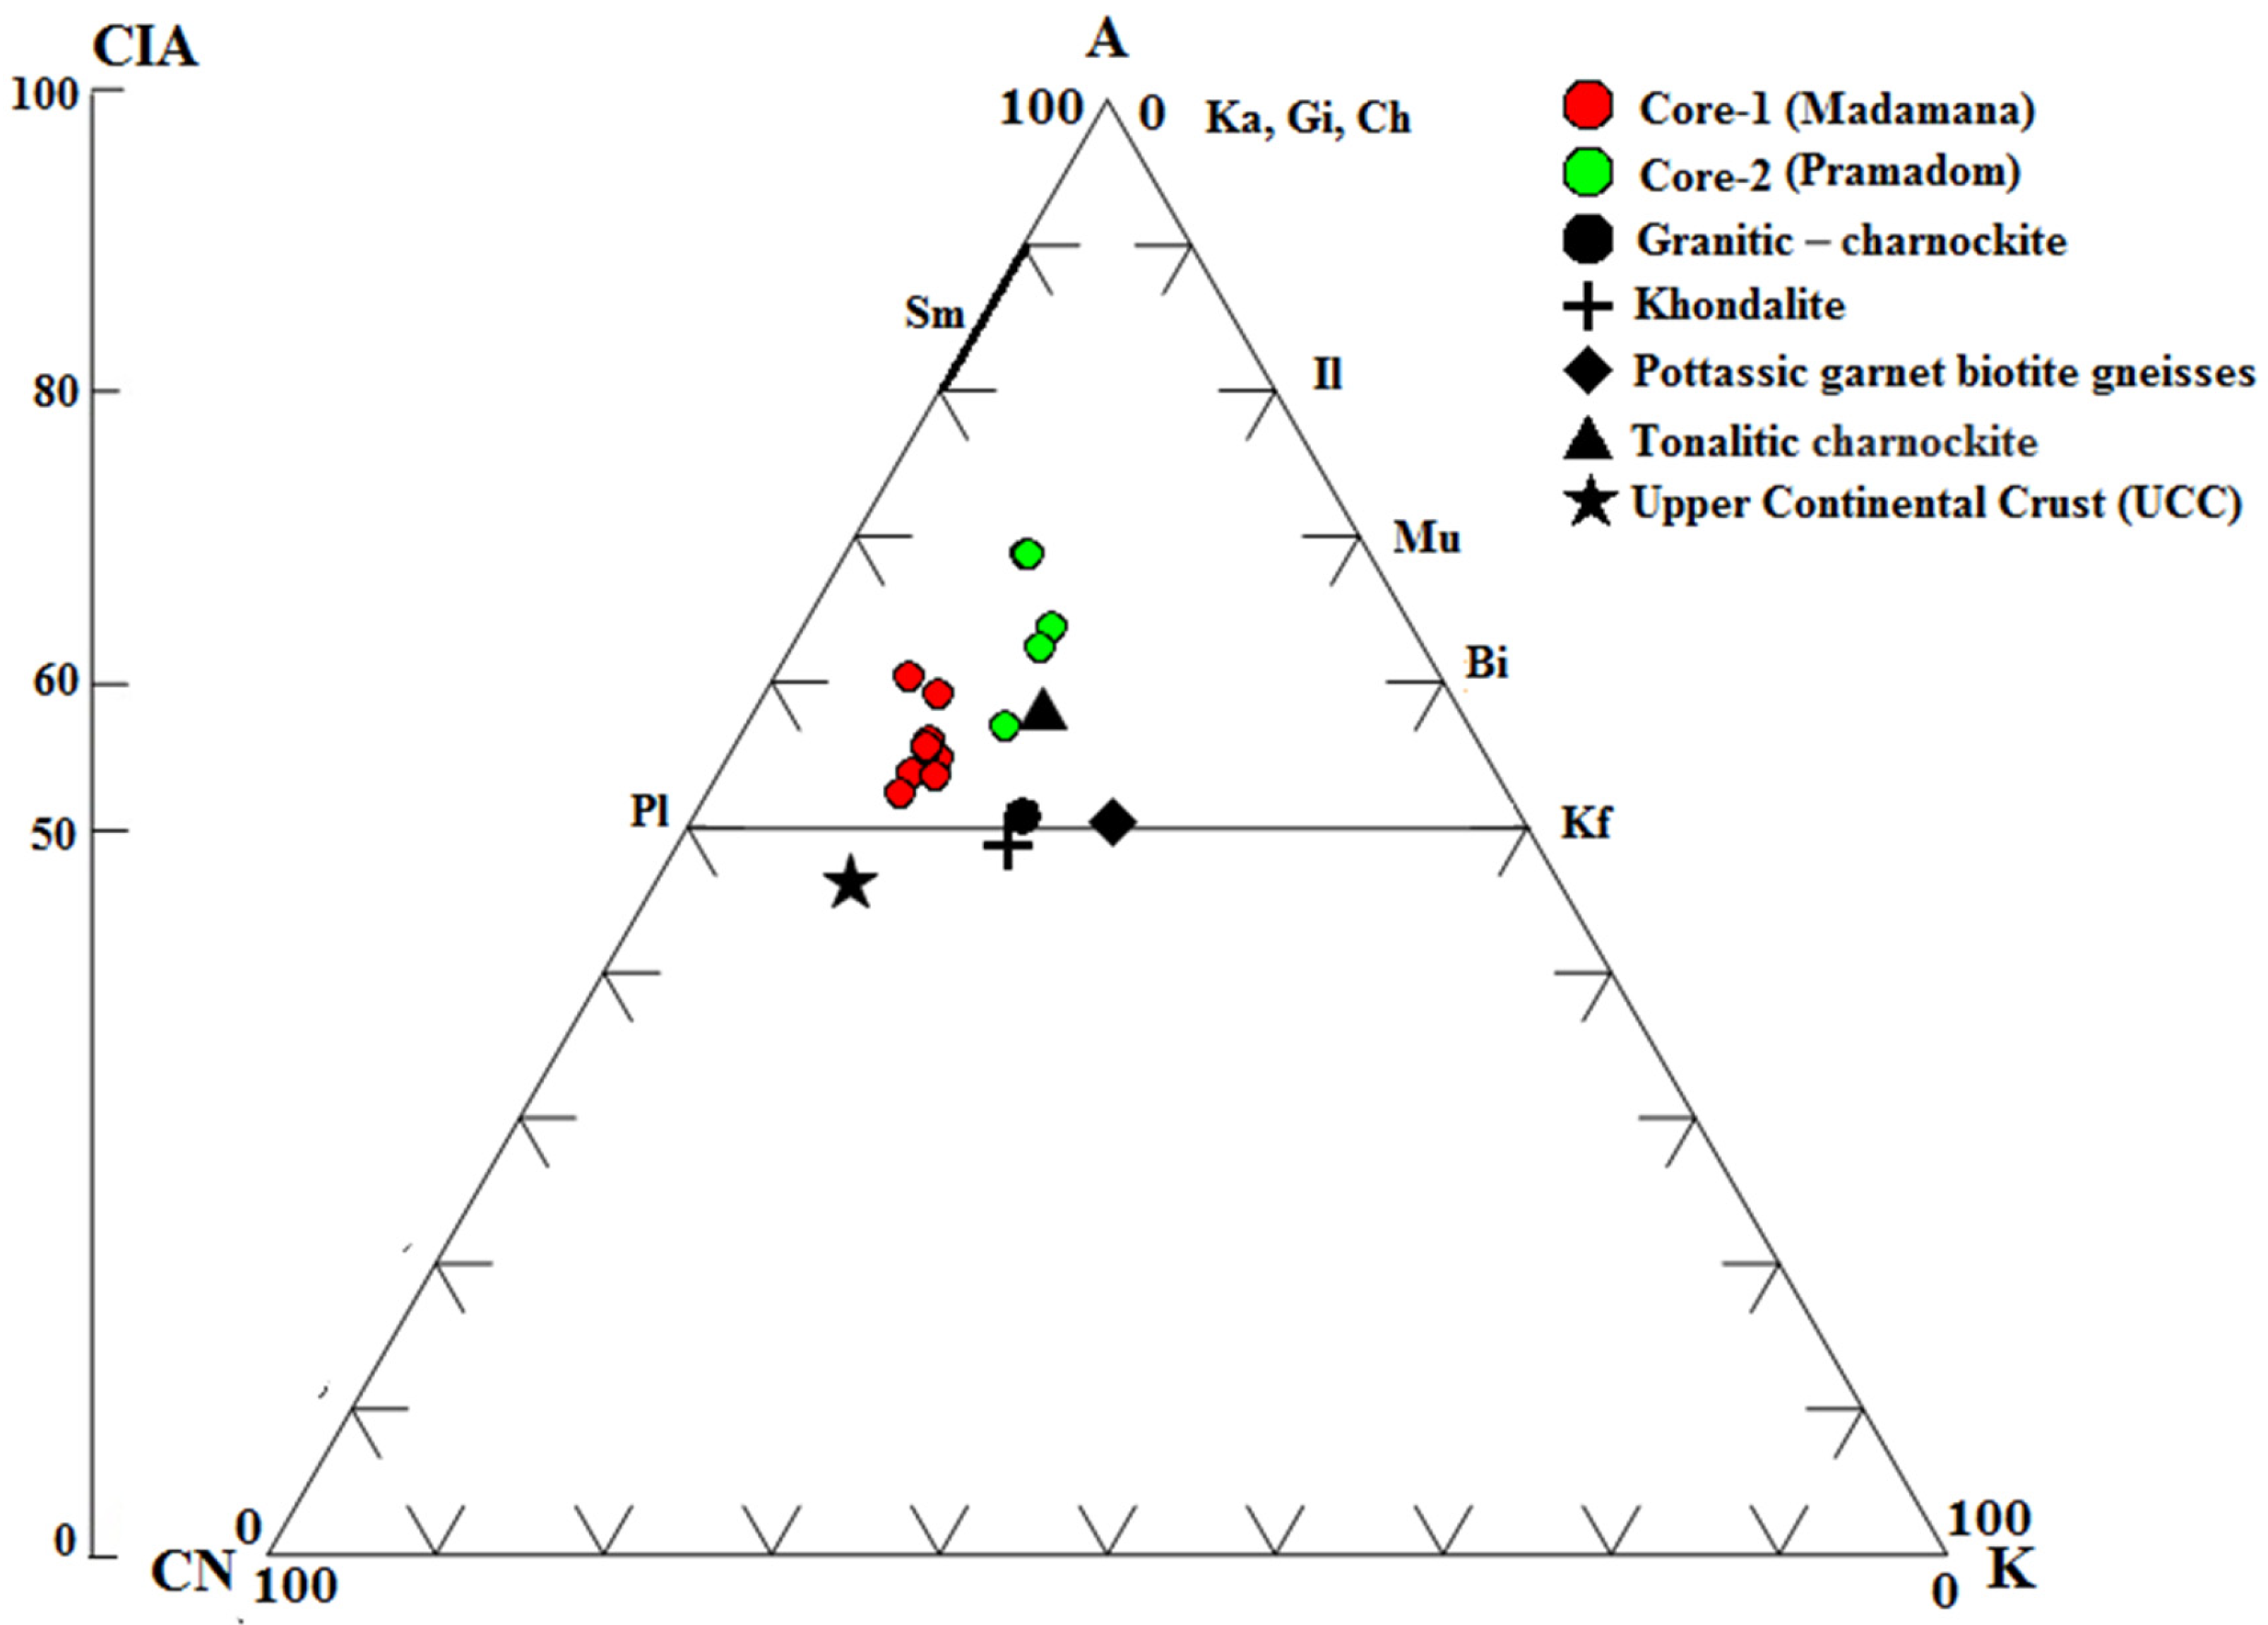
4.5. Chemical Index of Alteration

The Chemical Index of Alteration (CIA) is determined for two cores: one from a vertical profile of a deposit formed during the 2018 flood (Core-1) and the other from the floodplain of the Pamba River (Core-2). The cores show marked variations, as depicted in Figure 7. The CIA values of Core-1 range from 52.37 to 60.43 (avg. 55.65), whereas those for Core-2 range from 57.00 to 68.80 (avg. 64.15). The higher CIA values of Core-2, as compared with Core-1, indicate a higher rate of chemical weathering in the catchments and sediment sorting during transport and/or the depositional phase. On the contrary, the sedimentary particles in Core-1 are freshly formed during the 2018 flood event and devoid of any indications of intense chemical weathering or long residence in the catchments or riverbeds, as revealed by the absence of ferruginous coatings and the angularity of the clastic particles. Furthermore, these particles appear to have evolved from abrasion and attrition under the mega-turbulent conditions of the flood event. The particles have been subjected to more physical forcing/breakdown rather than chemical alteration over a long residence in the channel environment. However, the role of sediment sorting during their transportation history cannot be entirely ruled out. The Fe/Mn coating on sediment particles in Core-2, along with higher rates of chemical weathering in the catchments and sediment sorting, may have contributed to the observed higher CIA values in Core-2. T-tests were conducted to study the differences between the sediment characteristics of the two cores. The t-tests showed that there is a significant difference (statistically significant at α = 0.05) in the characteristics of the sediments from the two cores, indicating the distinct features of the two core samples.

5. Discussion

5.1. Effects of Hungry Water and Post-Flood Sediment Characteristics

The hungry water effect is well observed in the sediment population in the highland reaches of the Pamba River during the Kerala Flood of 2018. Alongside naturally produced high-energy water, the sudden release of sediment-starved water from the Kakki reservoir intensified the flood hazard in the Pamba basin as massive volumes of rainwater flowed through the high-gradient, rocky terrains of the upper catchments. The Kakki reservoir, situated at about 980 m above mean sea level (MSL), released water into a rivulet (Kakki Ar (T)) with a channel width too narrow to contain and transport the large volume of sediment-free water. Furthermore, the nature and quantity of sediments in the river channel were insufficient to mitigate the hungry water effect exerted by the sediment-starved water from the reservoir. Consequently, a significant portion of the valley immediately downstream of the dam was eroded by the sediment-starved water released during this episodic event, with materials transported further downstream (Figure 8).
The scoured portion is estimated to span approximately 1.37 km2, exposing barren bedrock across various valley locations. The catastrophic effects of “hungry water” led to the production of vast sediment volumes, including substantial rock boulders and vegetative debris, which were deposited into the Kakki River. The abrasion and attrition these sediments underwent—driven by the macro-turbulent hydrodynamic conditions resulting from floodwaters combined with sediment-starved water released from the reservoir—contributed to the fragmentation of sediment particles into highly varied size classes, which subsequently settled within the river channel.
Following the flood, the Kakki Ar (T) is filled with thick sediment deposits that contain a wide range of particles, including newly formed boulders, cobbles, gravel and sand. These materials are often mixed with uprooted riparian vegetation scoured from downstream reaches of the reservoir. Eroded deposits from below the Kakki reservoir now line the river stretch, with the downstream area occupied by boulders primarily composed of charnockite and dolerite rocks, eroded from the upper reaches of the Kakki tributary. The size distribution of sediments in the Kakki tributary clearly reflects the impact of “hungry water” released from the reservoir, with larger particles such as boulders, gravel and cobbles in the upper reaches and finer sediments like sand, clay and silt downstream.
The new flood-borne sediments in the Kakki Ar (T) differ significantly from typical riverine deposits; they include boulders, cobbles, pebbles, gravel, sand and silt that are milky white, resembling the commercial rock products of modern crusher units. In contrast, riverbed sediments usually exhibit a yellowish-brown coating, indicating prolonged residence in an oxidizing environment. The roundness of coarse particles, like gravel, pebbles and cobbles, highlights the extent of attrition (collisions and size reduction) and abrasion (wear against bedrock) they experienced during transport from highlands to lowlands. In natural conditions, such transport would typically take hundreds or even thousands of years, as materials would be detained at various points along the route.

5.2. Streamflow and Flooding Dynamics

The extreme rainfall events from 15 to 17 August 2018, were pivotal in elevating streamflow and water levels in the Pamba River basin, culminating in extensive flooding. The inundation of 196 km2 of floodplains, including both lowlands and highlands, was largely driven by the river breaching its banks. Notably, water releases from the Kakki reservoir contributed approximately 25% of the river’s flow during this period. This sediment-starved water intensified the “hungry water” effect, exacerbating erosion and amplifying the severity of flooding in the upstream reaches. The interplay between intense rainfall and the sediment-depleted releases from the reservoir significantly enhanced the flood’s reach and impact, highlighting the critical role of reservoir management in mitigating flood risks.

5.3. Socio-Economic Implications

The socio-economic implications of hungry water are profound, affecting infrastructure, agriculture and local communities. The intense scouring of riverbeds and banks can undermine bridges, dams and levees, leading to costly repairs and potential failures that disrupt transportation and water management systems. In agricultural regions, the erosion of fertile topsoil and the destabilization of irrigation channels reduce land productivity and water availability, threatening food security and livelihoods. Flooding caused by sediment deposition in river channels can damage homes, displace communities and necessitate expensive flood control measures. Additionally, the degradation of riparian ecosystems impacts fisheries and biodiversity, affecting industries that rely on aquatic resources.

6. Conclusions

The present study is aimed at exploring the potential role of sediment-starved water, or the “hungry water effect”, on the valley degradation, bed material changes and flood inundation in the Pamba River during the Kerala Flood, 2018, through a detailed characterization of bed materials and their deposition in the channel bed. The dynamics of sediment in Kakki Ar and Pamba Ar following the flood demonstrate how extreme hydrodynamic forces significantly impact sediment transport and riverbed composition. The 2018 Kerala flood event in the Pamba River basin provided a striking example of the “hungry water effect”, particularly in the upper reaches, influenced by sediment-starved discharges from the Kakki reservoir. The sudden release of sediment-deficient water exacerbated erosion in the downstream valley, leading to significant sediment mobilization and redistribution. The estimated 1.37 km2 of eroded land, exposing barren bedrock, underscores the destructive capacity of such events in high-gradient terrains with insufficient sediment buffers. The post-flood sediment characteristics within the Kakki tributary reflect the extreme hydrodynamic forces that shaped the riverbed.
High-energy conditions in upstream Kakki Ar facilitated the erosion and movement of coarse boulders, while downstream areas, particularly near confluence zones, showed finer deposits due to slack water conditions. Sediment-depleted outflows from the Kakki reservoir intensified the riverbed erosion, creating a “hungry water” effect that entrained fine particles, leaving coarser sediments behind. Quantitative assessments reveal a substantial sediment accumulation, with approximately 288,510 m3 of sand and gravel deposited, primarily in Kakki Ar, indicative of greater sediment transport under high-energy conditions. Scanning Electron Microscopy (SEM) and Chemical Index of Alteration (CIA) analyses highlight variations in mineral maturity and weathering: immature, abrasion-affected sands in Kakki Ar contrast with more weathered, stable quartz-dominant sands in Pamba Ar. The spatial distribution of sediments indicates that the gravel bed is generally confined to the upstream reaches of the study area, suggesting that a high-energy flow regime existed there. These findings emphasize the importance of integrated floodplain management, sustainable reservoir operations and sediment balancing strategies to mitigate the negative consequences of sediment-starved discharges. The destructive power of hungry water can be mitigated through strategic sediment management in reservoirs. Controlled sediment release via bypassing or flushing helps maintain downstream continuity and reduce erosion. Check dams and sediment traps regulate transport and minimize scouring, while riparian vegetation and bank stabilization reinforce riverbanks and limit sediment entrainment. Sediment augmentation, where sediments are artificially introduced into downstream flows, helps counteract the negative impacts of hungry water. Additionally, adaptive reservoir operations can maintain the sediment balance and reduce downstream degradation, while periodic dredging and sediment redistribution support a more natural sediment transport regime.

Supplementary Materials

The following supporting information can be downloaded at: https://www.mdpi.com/article/10.3390/hydrology12040079/s1, Table S1: Grain size analysis of sediment samples collected from Pamba—Thriveni and adjoining areas (Refer to Figure 5 for details of the channel segment).

Author Contributions

Conceptualization, S.K.K., P.D. and M.K.; methodology, S.K.K. and P.D.; software, J.M. and M.M.; validation, S.K.K., A.R. and R.K.S.; formal analysis, S.K.K., J.M., M.M. and A.R.; investigation, S.K.K. and P.D.; resources, J.M., M.M., A.R. and R.K.S.; writing—original draft preparation, S.K.K.; writing—review and editing, P.D. and M.K.; visualization, A.R.; supervision, P.D. and M.K. All authors have read and agreed to the published version of the manuscript.

Funding

This research received no external funding.

Data Availability Statement

The data that support the findings of this study are available from the corresponding author upon reasonable request.

Acknowledgments

We are thankful to the Director, National Centre for Earth Science Studies (NCESS), Thiruvananthapuram, for providing the necessary facilities and support. We are also thankful to the late Arulbalaji P, who has contributed immensely to this work. The authors also acknowledge the contributions of Merin Mariam Mathew, Vivek V R and Syan Sunny. The sources of hydro-meteorological data—the National Data Centre, Indian Meteorological Department (IMD), Pune, and Central Water Commission (CWC)—are also duly acknowledged.

Conflicts of Interest

The authors declare no conflicts of interest.

References

  1. Blöschl, G.; Hall, J.; Viglione, A.; Perdigão, R.A.P.; Parajka, J.; Merz, B.; Lun, D.; Arheimer, B.; Aronica, G.T.; Bilibashi, A.; et al. Changing Climate Both Increases and Decreases European River Floods. Nature 2019, 573, 108–111. [Google Scholar] [CrossRef] [PubMed]
  2. Boudet, H.; Giordono, L.; Zanocco, C.; Satein, H.; Whitley, H. Event Attribution and Partisanship Shape Local Discussion of Climate Change after Extreme Weather. Nat. Clim. Chang. 2020, 10, 69–76. [Google Scholar] [CrossRef]
  3. Jongman, B.; Ward, P.J.; Aerts, J.C.J.H. Global Exposure to River and Coastal Flooding: Long Term Trends and Changes. Glob. Environ. Chang. 2013, 22, 823–835. [Google Scholar] [CrossRef]
  4. Hallegatte, S.; Green, C.; Nicholls, R.J.; Corfee-Morlot, J. Future Flood Losses in Major Coastal Cities. Nat. Clim. Chang. 2013, 3, 802–806. [Google Scholar] [CrossRef]
  5. Hirabayashi, Y.; Mahendran, R.; Koirala, S.; Konoshima, L.; Yamazaki, D.; Watanabe, S.; Kim, H.; Kanae, S. Global Flood Risk Under Climate Change. Nat. Clim. Chang. 2013, 3, 816–821. [Google Scholar] [CrossRef]
  6. Arnell, N.W.; Lloyd-Hughes, B. The Global-scale Impacts of Climate Change on Water Resources and Flooding Under New Climate and Socio-economic Scenarios. Clim. Chang. 2014, 122, 127–140. [Google Scholar] [CrossRef]
  7. Westra, S.; Fowler, H.J.; Evans, J.P.; Alexander, L.V.; Berg, P.; Johnson, F.; Kendon, E.J.; Lenderink, G.; Roberts, N.M. Future Changes to the Intensity and Frequency of Short-duration Extreme Rainfalls. Rev. Geophys. 2014, 52, 522–555. [Google Scholar] [CrossRef]
  8. Mallakpour, I.; Villarini, G. The Changing Nature of Flooding Across the Central United States. Nat. Clim. Chang. 2015, 5, 250–254. [Google Scholar] [CrossRef]
  9. Winsemius, H.C.; Aerts, J.C.J.H.; Van Beek, L.P.H.; Bierkens, M.F.P.; Bouwman, A.; Jongman, B.; Kwadijk, J.C.J.; Ligtvoet, W.; Lucas, P.L.; Van Vuuren, D.P.; et al. Global Drivers of Future River Flood Risk. Nat. Clim. Chang. 2016, 6, 381–385. [Google Scholar] [CrossRef]
  10. Milly, P.C.D.; Wetherald, R.T.; Dunne, K.A.; Delworth, T.L. Increasing Risk of Great Floods in a Changing Climate. Nature 2002, 415, 514–517. [Google Scholar] [CrossRef]
  11. Bouwer, L.M.; Crompton, R.P.; Faust, E.; Hoppe, P.; Pielke, R.A. Confronting Disaster Losses. Science 2007, 318, 753. [Google Scholar] [CrossRef]
  12. Visser, H.; Petersen, A.C.; Ligtvoet, W. On the Relation Between Weather-related Disaster Impacts, Vulnerability and Climate Change. Clim. Chang. 2014, 125, 461–477. [Google Scholar] [CrossRef]
  13. Van Vuuren, D.P.; Edmonds, J.; Kainuma, M.; Riahi, K.; Thomson, A.; Hibbard, K.; Hurtt, G.C.; Kram, T.; Krey, V.; Lamarque, J.-F.; et al. The Representative Concentration Pathways: An Overview. Clim. Chang. 2011, 109, 5. [Google Scholar] [CrossRef]
  14. Dottori, F.; Szewczyk, W.; Ciscar, J.-C.; Zhao, F.; Alfieri, L.; Hirabayashi, Y.; Bianchi, A.; Mongelli, I.; Frieler, K.; Betts, R.A.; et al. Increased Human and Economic Losses From River Flooding with Anthropogenic Warming. Nat. Clim. Chang. 2018, 8, 781–786. [Google Scholar] [CrossRef]
  15. WRI. Aqueduct Global Flood Analyzer; World Resources Institute: Washington, DC, USA, 2015; Available online: https://www.wri.org/data/aqueduct-global-flood-analyzer (accessed on 15 January 2019).
  16. Mishra, V.; Shah, H.L. Hydroclimatological Perspective of the Kerala Flood of 2018. J. Geol. Soc. India 2018, 92, 645–650. [Google Scholar] [CrossRef]
  17. Sudheer, K.P.; Bhallamudi, B.S.; Narasimhan, B.; Thomas, J.; Bindhu, V.M.; Vema, V.; Kurian, C. Role of Dams on the Floods of August 2018 in Periyar River Basin, Kerala. Curr. Sci. 2019, 166, 780–794. [Google Scholar] [CrossRef]
  18. Sankar, G. Monsoon Fury in Kerala—A Geo-environmental Appraisal. J. Geol. Soc. India 2018, 92, 383–388. [Google Scholar] [CrossRef]
  19. Hunt, K.M.R.; Menon, A. The 2018 Kerala floods: A Climate Change Perspective. Clim. Dyn. 2020, 54, 2433–2446. [Google Scholar] [CrossRef]
  20. Kondolf, G.M. Hungry Water: Effects of Dams and Gravel Mining on River Channels. Environ. Manag. 1997, 21, 533–551. [Google Scholar] [CrossRef]
  21. Kondolf, G.M.; Smeltzer, M.; Kimball, L. Freshwater Gravel Mining and Dredging Issues; Report Prepared for Washington Department of Fish and Wildlife; Washington Department of Ecology, Washington Department of Transportation, University of California: Berkeley, CA, USA, 2001; 122p. [Google Scholar]
  22. Kondolf, G.M.; Gao, Y.; Annandale, G.W.; Morris, G.L.; Jiang, E.; Zhang, J.; Cao, Y.; Carling, P.; Fu, K.; Guo, Q.; et al. Earth’s Future Sustainable Sediment Management in Reservoirs and Regulated Rivers: Experiences from Five Continents. Earth’s Future 2014, 2, 256–280. [Google Scholar] [CrossRef]
  23. Padmalal, D.; Maya, K. Sand Mining: Environmental Impacts and Selected Case Studies; Springer: Dordrecht, The Netherlands, 2014; 162p. [Google Scholar]
  24. Vázquez-Tarrío, D.; Ruiz-Villanueva, V.; Garrote, J.; Benito, G.; Calle, M.; Lucía, A.; Díez-Herrero, A. Effects of sediment transport on flood hazards: Lessons learned and remaining challenges. Geomorphology 2024, 446, 108976. [Google Scholar] [CrossRef]
  25. Brandt, S.A.; Gardin, B.; Belleudy, P. Impacts of dams on river flows, sediment dynamics and geomorphic processes: A systematic review in tropical rivers. Sci. Total Environ. 2021, 795, 148686. [Google Scholar] [CrossRef]
  26. Bui, T.T.P.; Kantoush, S.; Kawamura, A.; Du, T.L.T.; Bui, N.T.; Capell, R.; Nguyen, N.T.; Bui, D.D.; Saber, M.; Sumi, T.; et al. Reservoir operation impacts on streamflow and sediment dynamics in the transboundary river basin, Vietnam. Hydrol. Process. 2023, 37, e14994. [Google Scholar] [CrossRef]
  27. Wang, Y.; Yang, X.; Han, S. Dam impacts on seasonality of water and sediment transport in intensively managed river basins: A case study of the Yangtze River. J. Geophys. Res. Earth Surf. 2021, 126, e2021JF006573. [Google Scholar] [CrossRef]
  28. Study Report: Kerala Floods of August; Hydrological Studies Organization, Hydrology Directorate, Central Water Commission, Government of India: New Delhi, India, 2018; 46p.
  29. Water Atlas of Kerala; Centre for Water Resources Development and Management: Kozhikode, India, 1995; 65p.
  30. Mathew, M.M.; Sreelash, K.; Mathew, M.; Arulbalaji, P.; Padmalal, D. Spatiotemporal Variability of Rainfall and its Effect on Hydrological Regime in a Tropical Monsoon-Dominated Domain of Western Ghats, India. J. Hydrol. Reg. Stud. 2021, 36, 100861. [Google Scholar] [CrossRef]
  31. Padmalal, D.; Maya, K.; Babu, N.K.; Baijulal, B. Environmental Appraisal and Sand Auditing of Manimala River, Kerala, India; CESS-PR-05-2010; Centre for Earth Science Studies: Trivandrum, India, 2010; 195p. [Google Scholar]
  32. Goldich, S.S. A Study in Rock Weathering. J. Geol. 1938, 46, 17–58. [Google Scholar] [CrossRef]
  33. Nesbitt, H.W.; Young, G.M. Early Proterozoic Climates and Plate Motions Inferred from Major Element Chemistry of Lutites. Nature 1982, 299, 715–717. [Google Scholar] [CrossRef]
  34. Nesbitt, H.W.; Young, G.M. Prediction of some Weathering Trends of Plutonic and Volcanic Rocks based on Thermodynamic and Kinetic Considerations. Geochim. Cosmochim. Acta 1984, 48, 1523–1534. [Google Scholar] [CrossRef]
  35. Nesbitt, H.W.; Young, G.M. Formation and Diagenesis of Weathering Profiles. J. Geol. 1989, 97, 129–147. [Google Scholar] [CrossRef]
  36. Nesbitt, H.W.; Young, G.M. Petrogenesis of Sediments in the Absence of Chemical Weathering: Effects of Abrasion and Sorting on Bulk Composition and Mineralogy. Sedimentology 1996, 43, 341–358. [Google Scholar] [CrossRef]
  37. Nesbitt, H.W.; Young, G.M.; McLennan, S.M.; Keays, R.R. Effects of Chemical Weathering and Sorting on the Petrogenesis of Siliciclastic Sediments, with Implications for Provenance Studies. J. Geol. 1996, 104, 525–542. [Google Scholar] [CrossRef]
  38. Chacko, T.; Ravindra Kumar, G.R.; Meen, J.K.; Rogers, J.J.W. Geochemistry of High-grade Supracrustal Rocks from the Kerala Khondalite Belt and Adjacent Massif Charnockites. Precambrian Res. 1992, 55, 469–489. [Google Scholar] [CrossRef]
  39. Ravindra Kumar, G.R.; Sreejith, C. Petrology and Geochemistry of charnockites (felsic ortho-granulites) from the Kerala Khondalite Belt, Southern India: Evidence for Intra-crustal Melting, Magmatic Differentiation and Episodic Crustal Growth. Lithos 1996, 262, 334–354. [Google Scholar] [CrossRef]
Figure 1. Location map of the Pamba River basin. Note: The region is categorized into highland and lowland zones to effectively present the impacts of the 2018 flood event.
Hydrology 12 00079 g001
Figure 2. (a) Historical (1985–2017) daily streamflow recorded in the Pamba River. (b) Streamflow measurements at different stations along the Pamba River during August 2018. Streamflow for Station-1 in the lowlands (Figure 1) was sourced from the Central Water Commission, India, whereas the streamflow of Stations-2 and -3 in the highlands was modeled using the MIKE rainfall–runoff and hydrodynamic model. (c) The inflow and outflow of the Kakki reservoir during the flood event.
Hydrology 12 00079 g002
Figure 3. Flood inundation map and flood marks (with respect to river bed level) recorded during the flood event in 2018.
Hydrology 12 00079 g003
Figure 4. The nature and characteristics of the flood-segregated materials in a selected section of Kakki Ar. The section of the river marked with a dashed line is selected for detailed study (refer to Figure 5).
Hydrology 12 00079 g004
Figure 5. The nature and characteristics of the flood-segregated materials in the river segment near the confluence point of Pamba Ar (T) and Kakki Ar (T).
Hydrology 12 00079 g005
Figure 6. SEM and EDS analysis of sand grains collected from (a) Kakki Ar and (b) Pamba tributary, indicating the immature (newly formed) nature of the grains in the Kakki Ar.
Hydrology 12 00079 g006aHydrology 12 00079 g006b
Figure 7. A-CN-K diagram of the vertical soil profiles of the samples from soil cores. Ka—kaolinite, Gi—gibbsite, Ch—chlorite, Il—illite, Mu—muscovite, Kf K—fledspar, Pl—plagioclase, Sm—smectite, [33,34,35,36,37]. Khondalite, pottassic garbnet biotite gneisses [38], granitic–charnockite, tonalitic charnockite [39]. The higher CIA value of Core-2 compared with Core-1 indicates the higher rate of chemical weathering and sediment sorting to which the flood plain sediments are subjected during the pre-depositional phase. On the contrary, the sedimentary particles in Core-1 are freshly formed and devoid of any coating.
Hydrology 12 00079 g007
Figure 8. Google Earth image of Kakki reservoir in the Pamba River basin: (a) Before flood—February 2018 and (b) after flood—September 2018. The marked portion shows that a major section of the downstream hillock was scoured by the dam release in August 2018.
Hydrology 12 00079 g008
Table 1. Details of sediment accumulation in Pamba-Thriveni and adjoining areas (T—tributary; MC—master channel).
River/TributarySegmentSediment TypeVolume
(m3)
Observations/Remarks
Kakki Ar (T)B–CSand71,700 Sands are generally first-generation, formed as a result of abrasion and attrition in extremely high-energy hydrodynamic conditions.
In-Channel Sand and Gravel5765
Gravel–Cobble Mix42,775
A–BSand28,426Sands are generally first-generation, formed under extremely high hydrodynamic/energy conditions. The segment represents the transitional zone between cobble–boulder-dominated reach and sand and gravel-dominated reach.
In-Channel Sand600
Gravel–Cobble Mix37,260
Pamba Ar (T)C–DSand8188Sand and gravel are generally yellowish-brown in color, (i.e., coated grains). This indicates the long residence of the grains in the river channel under oxidizing exposed conditions, and these are not subjected to an extremely high rate of wear and tear under the flood event of August 2018.
Gravelly Sand 225
In-Channel Sand 2429
Pamba River (MC)C–ESand65,224Two varieties of sands are noticed. Coarse sands are the dominant variety, which are generally yellowish-brown in nature. Fine sands are deposited on the overbank areas of the river channel. They are white, silty and of a first-generation type.
Disclaimer/Publisher’s Note: The statements, opinions and data contained in all publications are solely those of the individual author(s) and contributor(s) and not of MDPI and/or the editor(s). MDPI and/or the editor(s) disclaim responsibility for any injury to people or property resulting from any ideas, methods, instructions or products referred to in the content.

