Article

Simulating Phosphorus Load Reductions in a Nested Catchment Using a Flow Pathway-Based Modeling Approach

1
Agri-Environment Branch, Agri-Food and Biosciences Institute, Belfast BT9 5PX, UK
2
James Hutton Institute, Craigiebuckler, Aberdeen AB15 8QH, UK
*
Author to whom correspondence should be addressed.
Hydrology 2023, 10(9), 184; https://doi.org/10.3390/hydrology10090184
Submission received: 7 August 2023 / Revised: 4 September 2023 / Accepted: 11 September 2023 / Published: 14 September 2023
(This article belongs to the Special Issue Recent Advances in Hydrological Modeling)

Abstract

:
Catchment models are essential tools to identify and predict water quality problems linked to excessive nutrient applications (in this case phosphorus (P)). The Catchment Runoff Attenuation Flux Tool (CRAFT) has been successfully used to model nutrient fluxes and concentrations in north-western European catchments. The model is extremely parsimonious due to the relatively small number of parameters. However, an improvement to the representation of soluble P and particulate P fluxes in the fast-subsurface and surface runoff flow pathways was required. A case study in the north of Ireland applied the original and the new, enhanced (Dynamic) version of the CRAFT to the trans-border Blackwater catchment (UK and Republic of Ireland) covering nearly 1500 km2, with the land use predominantly livestock grazing. The larger size of the Blackwater also required a nested modeling approach to be implemented using a multiple sub-catchment variant (MultiCRAFT). P load reductions in the different sub-catchments were first identified using a simple approach based on the gap between the Water Framework Directive (WFD) limits for “Good” ecological status for soluble reactive P (SRP) concentrations and the recently observed concentrations. Modeling of different mitigation scenarios was then conducted using the MultiCRAFT framework with the best-performing variant of the CRAFT model embedded. The catchment was found to have flashy, episodic delivery of high concentrations of SRP and PP during runoff events which will require different sources (i.e., diffuse and point) of P to be targeted to achieve the WFD targets by the end of the decade. The modeling results thus showed that the required SRP load reductions could be best achieved using a combined scenario of mitigation measures that targeted diffuse sources contributing to both the surface runoff and fast-subsurface flow pathways, with point sources also identified as needing reduction in some sub-catchments.

1. Introduction

In north-western Europe including Great Britain and the island of Ireland, eutrophication remains a major challenge across many river and lake water bodies which are still failing to meet the objectives of the Water Framework Directive (WFD) [1,2,3] and following the UK’s “Brexit” in 2016 these objectives have remained to date largely unchanged [4,5]. Eutrophication is primarily caused by excessive nutrient concentrations resulting from agricultural chemicals entering the freshwater systems [6]. Increases in phosphorus (P) originated from the intensification of agricultural production from livestock farming over the past few decades, which led to large numbers of cattle and sheep over a small area of land, and provided surplus nutrients in the form of feed concentrate to the animals’ diet [7].
As a consequence of excessive concentrations of P in surface watercourses, largely to diffuse sources originating from rural catchments [1,2] in both Northern Ireland (NI) and the Republic of Ireland (ROI) significant phosphorus load reductions are required to meet the “Good” status requirements of the WFD in many Irish catchments. This has been reported by the river basin management plans (RBMPs) issued by the regulatory authorities in both countries [8,9] as part of their 3rd cycle of planning measures to achieve this status. The regional situation on the island of Ireland is complicated by having trans-border catchments which are mostly situated within the Neagh−Bann International River Basin (NBIRB) and North-West International River Basin, a geographical feature that will probably ensure that convergent standards on freshwater and marine water quality are maintained in both territories for the foreseeable future, especially for shared groundwater aquifers [5]. The NBIRB covers an area of 8127 km2, 6125 km2 of which is within the NI territorial area (43%) and the remainder located in ROI [10]. Six major rivers draining into Lough Neagh (LN) have a total catchment area of 4450 km2 [11,12], which will be referred to subsequently as the “N-B” catchment in this study. The remaining drainage area of the NBIRB is either located downstream of the regulated outflow into the Lower Bann from Lough Neagh or consists of trans-border catchments that drain in a south-easterly direction in the ROI, and these will not be considered further.
The soluble reactive phosphorus (SRP) concentrations in the watercourses need to be reduced to meet “Good” status in approximately 67% of the assessed rivers in the N-B catchment in both countries, assessment has mostly been carried out by collecting water samples from a network of monthly monitoring stations on the main rivers and comparing SRP concentrations against a “Target”, which is the upper band concentration for achieving the “Good” status [13]. The network was established several decades ago to assess both long-term statistical trends and compliance with the WFD. The main aim of this study therefore was to investigate how the necessary SRP load reductions to achieve “Good” status could be achieved in a pasture-dominated catchment through water quality modeling, with a focus on applying mitigation methods to tackle diffuse sources of P.

1.1. Mitigation Studies

Studies of mitigation methods to remove diffuse sources of P including catchment modeling are still comparatively rare although there has been extensive work in Northern Europe (Netherlands: [14]; Sweden: [15]) to synthesize over 20 years of research into diffuse pollution mitigation measures (henceforth referred to as “measures”). In the UK, Zhang et al. [16] summarized a detailed set of recommendations from a long-running research program that evaluated a wide range of different field-scale measures ranging from stock exclusion by fencing to large sedimentation ponds. The requirement for field-scale monitoring of the inputs and outputs (preferably both flow and concentrations to allow loads, and hence removal rates to be estimated) to and from such measures (e.g., riparian buffer strips) is an onerous one, with flow being difficult to measure accurately, for example where there may be diffuse sources of inflows to a measure (e.g., inflow from groundwater seepage) or multiple outputs from a measure (e.g., both pipe and overflow discharges).
The results from three catchment-scale diffuse pollution mitigation experiments in northern England have been used in this study to provide an estimate of the removal efficiencies of the measures [17]. Different measures were constructed at each site: (i) in Netherton Burn, a series of three off-line sediment traps protect a constructed treatment pond from rapidly silting up by lowering the concentration of suspended sediment (SS) flowing into the pond and forming a “treatment train”; (ii) a multi-stage ditch constructed in Belford Burn catchment, where multiple stages allow for nutrient removal both at low flows and during storm events. Both studies measured inflow (i.e., upstream of the measures) and outflow concentrations of SRP and particulate P (PP). Thirdly, the EdenDTC (Eden Demonstration Test Catchments) project evaluated a limited set of trial measures that were constructed during the project in a 160-ha sub-catchment called Newby Beck in the much larger (“unmitigated”) Morland catchment [17,18,19]. Unfortunately, there was a lack of usable monitoring data (specifically discharge) from the mitigation sub-catchment’s outlet to establish that these features had a measurable effect on nutrient loads measured at the catchment outlet [18].

1.2. Catchment Modeling

A dynamic catchment hydrological model is required that can simulate load reduction (LR) scenarios both in the internal sub-catchments and at all the monitoring points on the main Blackwater river. The model needs to be able to simulate P loads and concentrations. The sub-catchments must also pass the WFD status requirements of SRP concentrations falling within the “Good” target band or lower. Henceforth, modeling will be used to investigate different scenarios that result in the required LRs. For this, the CRAFT was chosen for several reasons. The CRAFT can simulate both the reductions in P loads [18,20,21], which can be attributed to point and diffuse sources to some extent, and the reductions in particulate P loads which can be attributed to specific surface runoff processes (e.g., the entrainment of P-rich sediment sources).
In an earlier application of the CRAFT to Newby Beck (described above) [18] the mitigation sub-catchment was simulated separately before and after measures were constructed and the changes to P and SS concentrations and loads (per unit area) were evaluated. The results in terms of removal of P and SS were compared to the performance of the trial measures that were constructed during the project in the (slightly larger) 160 ha sub-catchment [18] using measurements of the mass of P and SS deposited in the features. The modeling study [18] showed however that a far larger volume of attenuation (storage) would need to be added to the mitigation sub-catchment to produce a significant reduction in P loads and concentrations than was achieved through the mitigation measures that were eventually built [19].

2. Materials and Methods

The next section will summarize the history of the study site and highlight particular issues related to the elevated loads and concentrations of P in the catchment. The strategy and methodology to address the required load reductions will then be introduced, this is based on observed data from the national monitoring networks for water quality. Lastly, the modeling strategy described above will be expanded into a description of an enhanced variant of the CRAFT model.

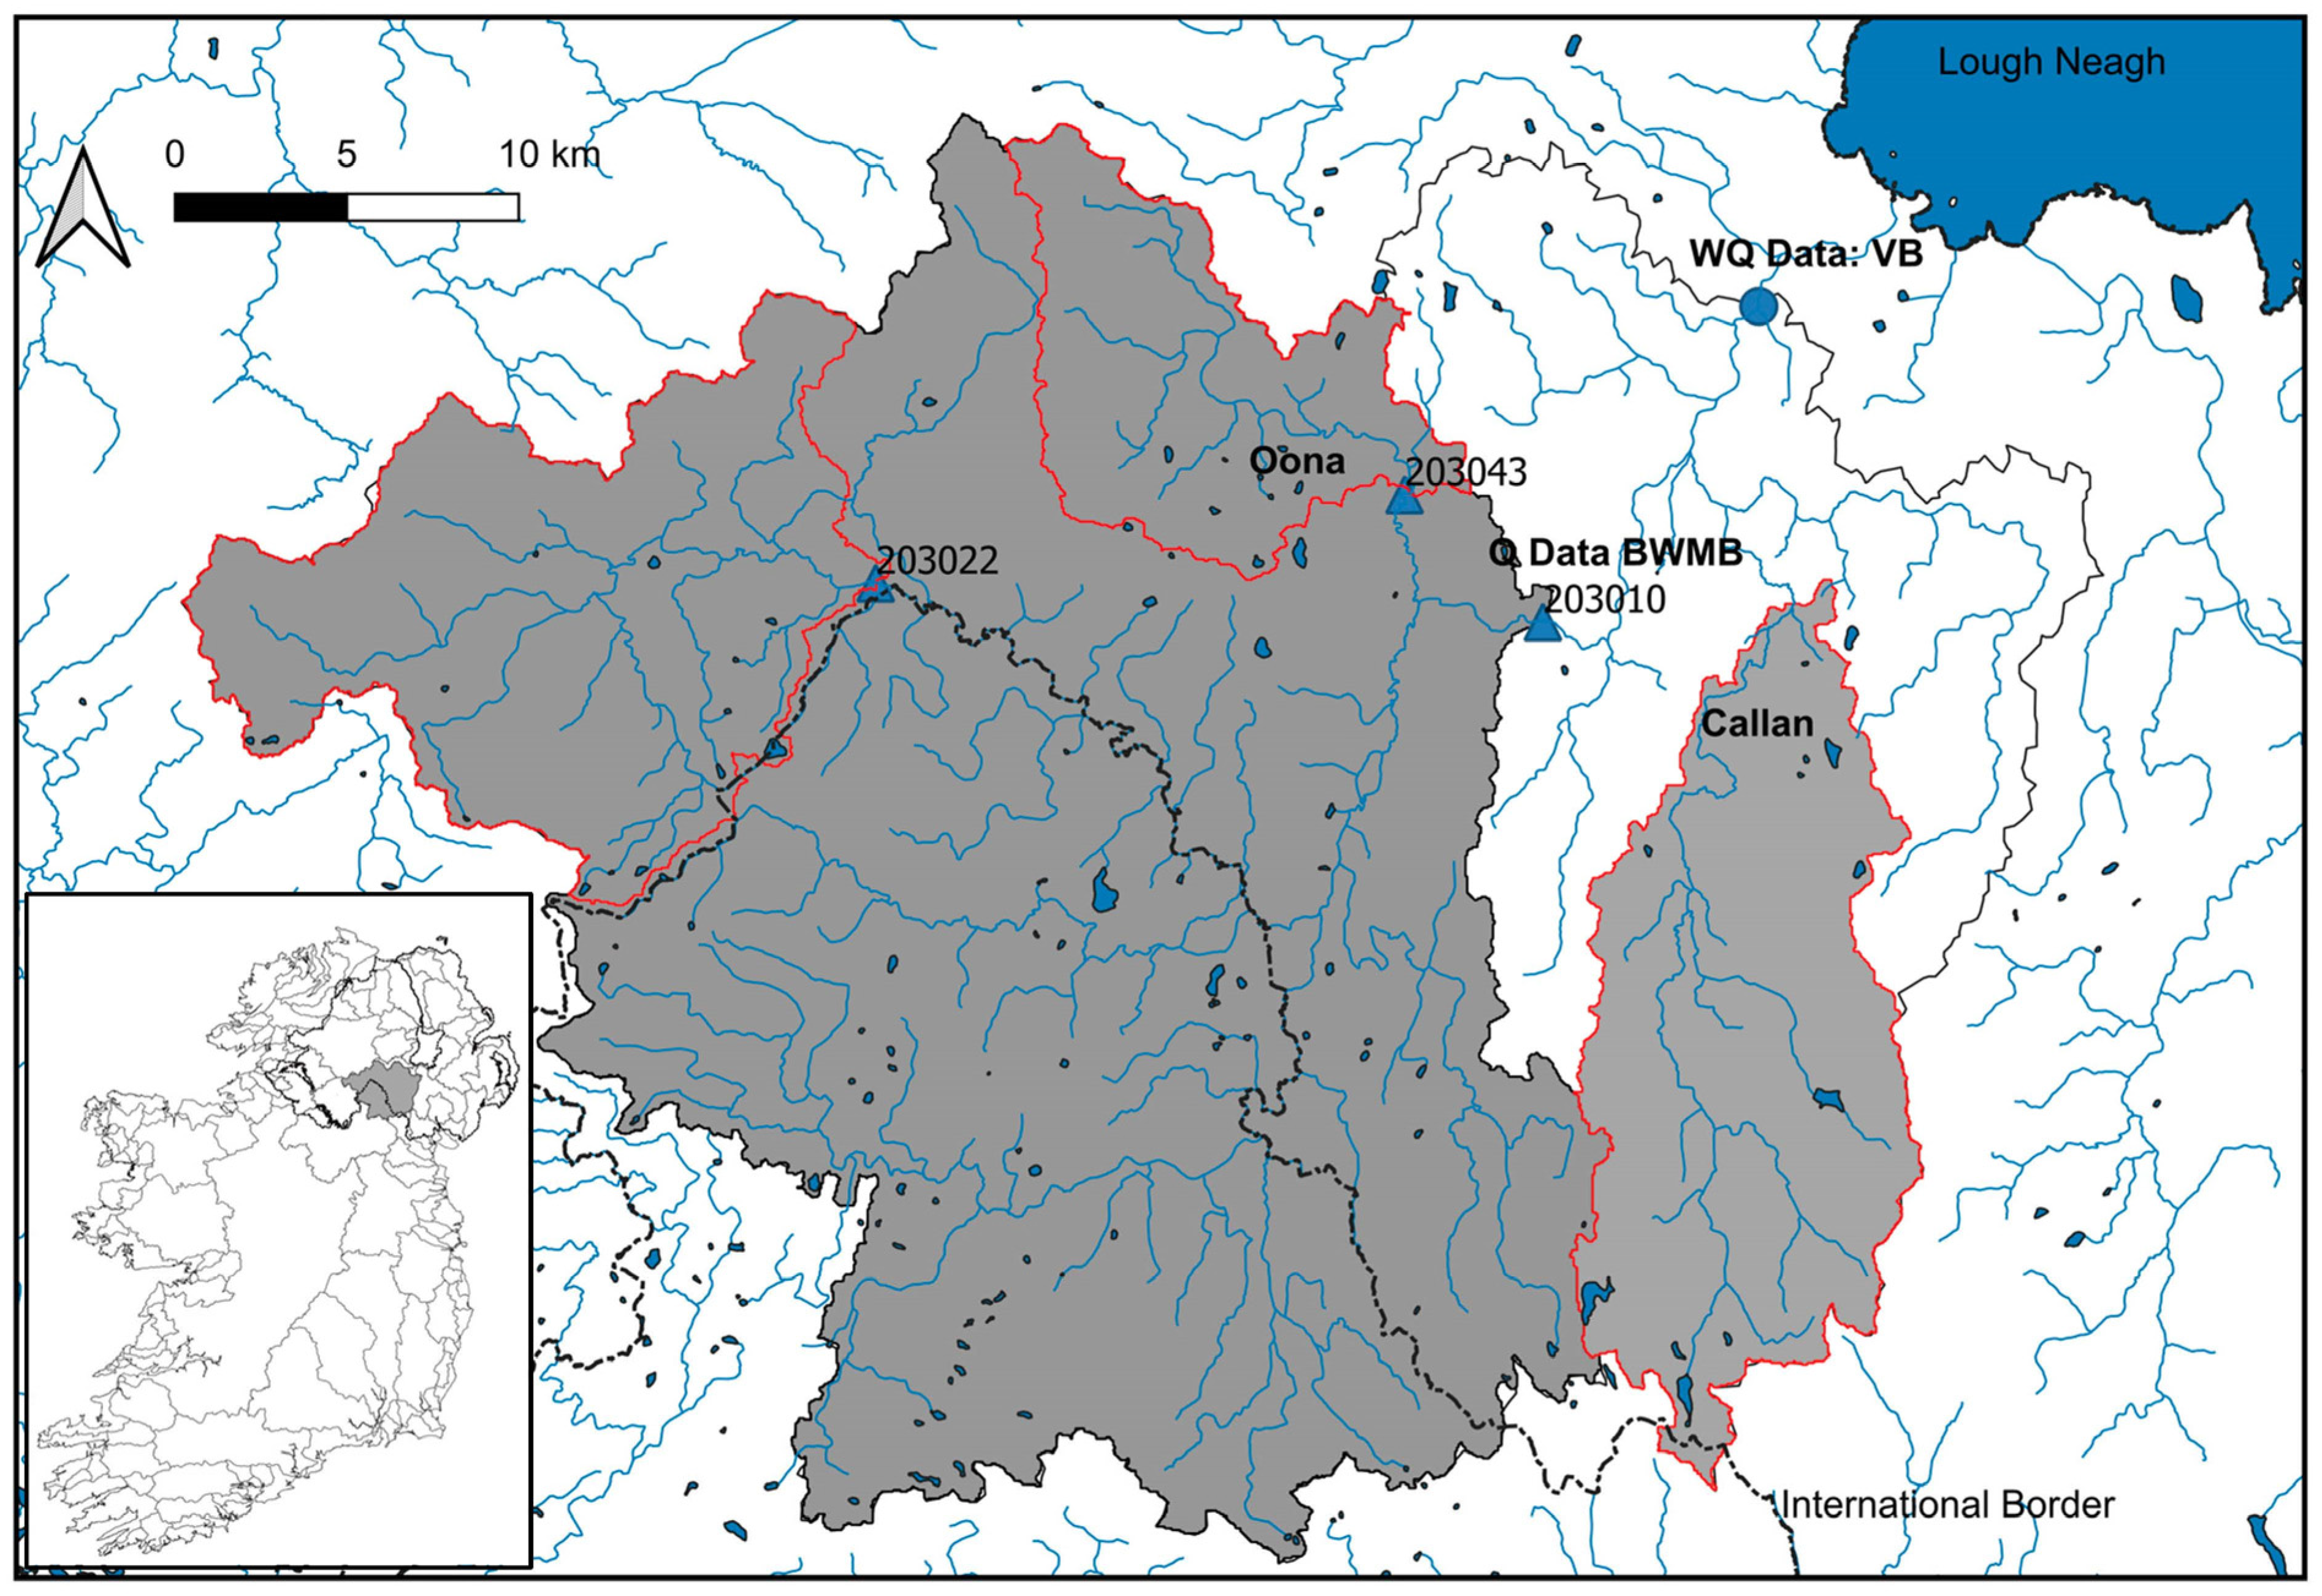
2.1. Description of Study Site

A long-term monitoring program has been measuring phosphorus concentrations both in and into LN since the 1970s [11,22] through weekly sampling at eight major rivers draining into the lake. It has been established that catchment P load reductions are necessary to reduce pollution and allow recovery of P concentrations in LN, which increased in the second half of the 20th century due to agricultural and point source pressures [12]. The point sources were improved from the 1980s onwards partly through the closure of small inefficient wastewater treatment plants (WWTPs) and diversion of effluent into larger WWTPs with P removal technology (serving a population > 10,000) along with a reduction of the P content in detergent in the 1990s. Point sources are arguably now less important than diffuse sources compared to the situation in 2001 [23]. That study accurately predicted back in 2001 that diffuse sources were still rising and would eventually become the dominant source of nutrients. In NI as a whole fertilizer use (inorganic forms of P) decreased by 79% between 1990 and 2008 [24] although this was offset to some extent by an increase in imported feeds adding supplemental sources of P to the diet of livestock. The overall P surplus in NI soils had declined by 49% to +8.7 kg P ha−1 by 2008 but despite these improvements, since 2008 P surpluses have rebounded to a figure of +12.3 kg P ha−1 in 2017 [25]. Following on, P (in the SRP form) concentrations in NI rivers have also remained relatively stable since 2014 at around 65 µg P L−1 after falling to below 50 µg P L−1 for the first time in 2009 [26]. However, a slight increase has been observed in the most recent round of monitoring data.
Diffuse sources of P in the N-B catchment are largely from pastoral agriculture which covers about 70% (NI portion) with small areas of both lowland and upland bog and forestry. It is well understood that P is mobilized by storm events and then transferred by overland flow (surface runoff) in large quantities [27]. Additional sources of P that are classified as “diffuse” include tile drainage [28], groundwater flow pathways [29], and farmyards (although essentially point sources most studies have classified nutrient export from these sources as “diffuse”) [30,31] and lastly farm tracks, access roads and “laneways” all subject to livestock movement [32].
In the N-B catchment, the towns are quite small although there are numerous small villages and settlements which tend to have either small, secondary-level treatment works or rely on septic tanks for effluent disposal. Here we focus on the largest of the six influent catchments to LN (about 1490 km2), the Blackwater. Approximately 400 km2 of the catchment is in the ROI with similar land use, geology, and soils to the NI portion. Two medium-sized tributaries to the east of the mainstem Blackwater flow approximately due north, the Tall and the Callan Rivers (the source of the latter is about 2 km across the border in the ROI).
The outlet of the Blackwater for measurement and modeling purposes is Verners Bridge (VB), a level-only site (lat. 54.491° N, long. −6.639° E) (National River Flow Archive (NRFA) ID 203309). A long-term Agri-Food and Biosciences (AFBI) Environmental Change Network site has measured water quality by weekly grab sampling [11] since the 1970s, with an estimated upstream area of 1380.9 km2. The Tall River flows into the main Blackwater immediately upstream of this gauge and is considered part of the basin for discharge and load assessments. The Torrent River, although classified as part of the Blackwater catchment, was excluded from the modeling study as its discharge point is downstream of the VB monitoring site, so any nutrient loading from this sub-catchment will not contribute to the total load at VB.
NI’s Environment Agency (NIEA) collects monthly grab samples to obtain concentration data from Benburb (NIEA site GBNIF10330) which is co-located with the Maydown Bridge (NRFA ID 203010) gauging station, which is the lowest flow gauge (and hence load calculation point) on the mainstem Blackwater (upstream area = 970.2 km2: (https://nrfa.ceh.ac.uk/ accessed on 11 September 2023). The Blackwater below this point is effectively ungauged until it flows into LN (apart from level data recorded 11.4 km downstream at VB). A combination of both discharge and water quality datasets was therefore used in the modeling work that follows, with discharge from BWMB and P concentration (and hence loads) data from VB. It was assumed that the runoff regime and specific discharge (discharge/upstream area) were hydrologically similar in the larger VB catchment, based on the interpretation of the catchment baseline datasets (soil, climate, and land use). The abbreviation “BWMB” below will refer to discharge data and nutrient data, respectively, from this combined dataset in the following sections (for clarity). Table 1 shows the catchment characteristics from the NRFA data, the mean annual average SRP concentrations (from the monitoring data collected by NIEA).
The Oona (Water) sub-catchment is also important, it covers approximately 100 km2 located entirely in NI, of which 94 km2 is gauged at Shanmoy Bridge (NRFA ID 203043) by a V–notch weir (OOSM). The Oona is even more dominated by pasture (92.6% source: NRFA) with no settlements of any significant size. It has been extensively studied from the 1990s to the 2010s under various research initiatives aimed at quantifying diffuse and point P loads through nested, catchment-based monitoring which also trialed the first generation of high-temporal resolution bankside samplers [27,33,34]. Unfortunately, the monitoring did not continue after the completion of the research projects so the Oona, like most of the Blackwater catchment only has monthly (at best) sampling from three sites in the NIEA surface water quality monitoring network.
Figure 1. Map of the Blackwater Catchment showing: the river flow gauging stations (blue triangles with NRFA station IDs). The location of Verner’s Bridge (VB) long-term monitoring site is also shown by the filled blue circle. The darker gray shaded area represents the area upstream of the Maydown Bridge gauging station (BWMB catchment), the two nested, gauged sub-catchments have red borders, and the lighter gray shaded area with a red border is the Callan sub-catchment. River and waterbody data are from EU-Hydro River Net © 2020 European Environment Agency (EEA). Inset figure shows the location of the Blackwater Catchment (gray shading) in the island of Ireland; catchment boundaries downloaded from https://www.catchments.ie/maps/ (accessed on 11 September 2023).
Hydrology 10 00184 g001

2.2. Load Reduction Methods

The baseline observed SRP concentrations were used to classify each Water Framework Directive (WFD) (See Figure 1) sub-catchment in terms of the WQ status (P concentrations (C)) in the catchment and any “Good” or better sub-catchments should not require load reductions. The P load reductions (LR) were then first established from the SRP data using the “Simple Method” (SM) which is an analysis of the gap between observed and target concentrations. A modeling study in the Suir catchment in ROI using a Source Load Apportionment Model (SLAM) approach referred to it as the “distance to the threshold” [1]. These LRs are thus based on observed concentrations (C) and discharge (Q). Observed mean annual loads (L) can be calculated by L = C × Q, if observed C data are available using average annual (time or flow-weighted mean, if available) C and long-term average Q. If it was not possible to obtain observed data then we used the SRP WFD banding and assumed that observed annual C lay in the midpoint of the band, i.e., if a catchment was assessed to achieve “Moderate” status then the SRP concentration will be halfway between the “Moderate” to “Poor” values. Long-term annual average Q was either obtained from an NRFA gauging station (e.g., BWMB) or estimated using the gridded annual rainfall data (Prec) and NI mean actual evapotranspiration (AET) for the ungauged sub-catchments (see below). The equations for the LRs themselves are then written as:
LR (SM) = (Cobs − Ctarget) (Prec − AET)
where Cobs = mean SRP (over the period January 2014–March 2019), Ctarget = EPA/NIEA “Good” WFD status threshold C multiplied by 0.9 (a safety factor).
Or:
LR (SM) = Q (Cobs − Ctarget)
where Q was available from a nearby flow gauge. Equation (2) was also used with the weekly data from VB monitoring data to estimate the SRP LR for the entire Blackwater catchment.
TP LRs were estimated using a scaling factor (assuming that SRP = 0.7 TP) since measurements of TP were not widely available in NI and ROI rivers. Both TP and SRP data were available from the weekly AFBI dataset collected at VB which allowed this ratio to be verified.
For the LR calculations, the observed rainfall data (Prec) were downloaded from the Centre for Ecology and Hydrology Gridded Estimates of Areal Rainfall (CEH-GEAR) database [35] as gridded annual means (for 2005–2017) for the ungauged catchments. AET is relatively constant across Irish catchments such as the Blackwater and a single value was used (430 mm) [36]. It can then be assumed in the Blackwater that all the HER (i.e., hydrologically effective rainfall: viz. Prec − AET) becomes runoff based on the soil types and underlying geology, which mainly comprises superficial deposits of boulder clay (till) above sedimentary strata (which ranges from porous rocks e.g., Carboniferous Limestone to impermeable rocks, e.g., mudstones). The thicker areas of till will limit recharge across most of the catchment unless it is absent or thin enough to allow significant vertical leakage. Where recharge occurs, it is further assumed that the sub-catchments are operating as closed basins, i.e., all the recharge eventually becomes runoff at the outlet through supplying baseflow to maintain perennial watercourses. The Hydrology of Soil Types (HOST) soil classification is in use in the NI part of the catchment and the most numerous (>40% of the catchment area) of the HOST classes is 24, which comprises surface water gley soils which have an impeding layer at depth which limits recharge and promotes seasonal waterlogging and the generation of saturation excess overland flow [37].
Clearly, the LRs required based on measurements taken from the main river with many upstream sub-catchments will be further complicated by having to account for any upstream LRs from these sub-catchments first. Thus, moving further down the network, the LRs from the downstream sub-catchments needed may be less than estimated at first using the equations above but still result in the correct overall LR being achieved across the full catchment.
Recent research has focused on lowering soil P (Olsen or Morgans P) concentrations in topsoil in the Blackwater catchment and establishing any causal relationship between better nutrient management and in-stream P concentrations by adopting on-farm strategies to reduce nutrient additions [38]. A direct set of relationships between soil P test results (e.g., either Olsen P or Morgan’s P) and dissolved P, first measured in soil water, and then in the watercourses draining the fields that vary in complexity from 1st order to several orders is complex and has not yet been achieved, apart from (in NI) the work of (P and C) banks et al. [27,39], Heaney et al. [23] and more recently, using pairs of upstream and downstream sampling points combined with soil P measurements [38].

2.3. Catchment Modeling

Given a suitable set of mitigation scenarios, which could then be applied to all or part of the catchment, model simulations can be carried out to determine how the catchment can better achieve the WFD targets. Therefore, in this study, the CRAFT model will provide the end user with information that can also be used to identify the dominant P loss pathways.
Rather than simply using the existing CRAFT model, a more complex near-surface P component was evaluated based on observations that inter-event SRP concentrations were seasonally variable, with the new model called “DynamicCRAFT”. The entire Blackwater catchment can be simulated using CRAFT as one unit; however, a method of modeling P fluxes and concentrations in the smaller sub-catchments where LRs are required needs to be identified. A second key aim of this research was therefore to evaluate the new variant of the CRAFT on a large-scale study, which required the testing of both the new nutrient component and the nested sub-catchment model which will be introduced below.
A further key point relates to the choice of model timestep. The relative size of the catchment and its stream network geometry influence the time of concentration of peak discharge as observed at the outlet. In previous CRAFT studies, an hourly timestep was selected based on (i) the catchment being quite small and responding to rainfall events in less than 24 h, and (ii) available hourly rainfall data. However, in Ireland, hourly rainfall data are of limited spatial coverage and quality so the model timestep had to be daily. However, it was expected that the relatively large Blackwater catchment and its hydromorphic characteristics (gentle slopes, highly meandering channel network (Figure 1), T-rise (lag time for peak discharge to be observed from start of the rainfall) quoted at 29 h—nearly twice the average for NI stations (https://nrfa.ceh.ac.uk/data/station/info/203010 accessed on 11 September 2023) would ensure that the daily timestep would not impose any limitations to the modeling.

2.4. CRAFT Model Overview

In the catchment modeling carried out on the Newby Beck (Morland) catchment in NW England in the EdenDTC project [19] the CRAFT was spatially lumped [18,20,21]; however, the entire Blackwater is over 100 times larger than Newby Beck. The CRAFT model has two new developments that will be utilized here, namely DynamicCRAFT and the MultiCRAFT nested modeling approach, MultiCRAFT links together smaller-scale models of individual sub-catchments to simulate a larger river basin. The latter framework can work with either the original CRAFT or DynamicCRAFT as the “Plugged In” model and will be tested here against observations of Q and C at the mainstem monitoring points at BWMB to ensure that predicted concentrations, flows and finally loads are reasonable in relation to observations. To simulate the ungauged sub-catchments a series of parameter sets is required which can then be applied to model these, i.e., we need to apply a “Donor” method, which has been extensively used for water flow but not water quality simulations [40] using locally derived parameters from nearby gauged sub-catchments with similar characteristics.
Referring back to LRs and how to model these using the CRAFT, it is reasonable to assume that on an annual basis a reduction in x% in P loadings to a given land use (pasture in this case) should cause an associated reduction of x% in measured P concentrations downstream, and hence this can be simulated by adjusting the CRAFT model parameters that represent the simulated P concentrations (or loads) in different flow pathways, i.e., by also reducing these by x%.

2.4.1. Description of the CRAFT Model

The basic structure of the CRAFT is described in Adams et al. [21] and forms what will be referred to as the “Original” CRAFT model (OCM). One of the limitations of the OCM is that the model’s predicted concentrations of SRP in the fast-subsurface and slow groundwater stores are not time-varying throughout the year but rather fixed to user-defined constant values based either on catchment monitoring data or agronomic evidence.

2.4.2. DynamicCRAFT Overview

DynamicCRAFT has several main differences compared to the original version of the CRAFT model [1]. This component contains a single soil store of P with two compartments shown in Figure 2 representing (i) the upper near-surface layer compartment of the soil (which mobilizes P for transport by surface runoff during storm events when surface runoff > 0) and (ii) a lower compartment, which represents a typical agricultural subsoil, where P is transported by fast-subsurface flow (likely to include preferential flow pathways either naturally occurring or artificial soil drainage). This was based on TOPCAT-NP, a similar MIR model from which CRAFT was developed [41]. In terms of different P transport pathways, it simulates (i) a time-varying fast-subsurface SRP concentration based on the P desorption relationship; (ii) a time-varying PP concentrations in surface runoff using an enrichment equation, where suspended sediment is mobilized during events by surface runoff which becomes enriched with PP [41,42]. The linking of these two P mobilization pathways together using a common P store (hence generating SRP in fast-subsurface runoff and PP in surface runoff) is desirable in the model, as pollution swapping can then be investigated by adjusting the P distribution parameter (PDIST) to increase or decrease the available P in one compartment over the other. The component has been tested with both hourly and daily timesteps and found to work with either. A full description of the model with process equations can be found in S1.1 in the Supplementary Materials.

2.4.3. MultiCRAFT Modeling Approach

There are two main differences between the new MultiCRAFT formulation of CRAFT and a single sub-catchment version of the model. The first is that the modeler can specify a different parameter set for each individual sub-catchment in the “tree and could in turn partition a sub-catchment further into a “Mitigated” and “Non-Mitigated” area, as was the case in the Eden DTC mitigation scenarios described above [18]. A second key difference is that a routing term was introduced to delay the discharge and nutrient fluxes generated from individual sub-catchments reaching the outlet of the model domain (i.e., downstream-most monitoring station) in MultiCRAFT. The lag term (j) is expressed as a function (Equation (3)) of sub-catchment order, where the delay (in timesteps) is a function of the number of sub-catchments (n) between the sub-catchment outlet and overall model output, multiplied by a factor KDel. The value of j is rounded to the nearest integer. Applying this delay function to modeled sub-catchment discharge (Q) and nutrient load (L) time series is thus described by a series of equations, where t is the current day (in this example the model timestep is daily). This is best illustrated by an example with two upstream sub-catchments (i = 1, 2) with ni intermediate sub-catchments between their outlets and the catchment outlet (denoted by subscript N). The individual discharges and nutrient loads from each sub-catchment are Q1, Q2, and L1 and L2, respectively. Equation (3) gives the timestep delay (ji) in terms of an integer number of timesteps. Equations (4) and (5) give, respectively, the total discharge and nutrient loads from the outlet which are, respectively, QN and LN:
ji = ni KDel  i = 1, 2
QN (t) = Q1 (t − j1) + Q2 (t − j2)
LN (t) = L1 (t − j1) + L2 (t − j2)
In the MultiCRAFT modeling framework, QN and LN will then be added to the local discharge and nutrient load from the downstream sub-catchment (also modeled individually by the CRAFT) to calculate the total discharge and nutrient load from the entire catchment.

2.4.4. CRAFT Modeling Steps

The modeling methodology is condensed into a series of systematic steps carried out and described below in the following sequence:
Step 1. 
A parameter set for the entire Blackwater was obtained by running the OCM on the 3 smaller sub-catchments with both observed WQ data and Q measured at an NRFA gauging station, with the WQ monitoring points and gauging stations located either at or close to each other, i.e., CALL, OOSM, BWDM (refer to Table 1 for the sub-catchment acronyms) and calibrating the model in turn for discharge and then SRP against the monthly monitoring data. The homogeneous nature of the land use in the Blackwater sub-catchments means that parameter sets did not need to be allocated for each land use individually (e.g., the Hydrological Response Unit (HRU) approach used by many catchment models [43]) but were just “lumped” for each of the modeled catchments, assuming the land use and other model parameters are homogeneous within it. In this step and subsequent assessments, the evaluation metrics and suggested acceptable values of these suggested by Moriasi et al. [44,45] are used, whereby Q is assessed by two metrics: (1) the well-known Nash and Sutcliffe Efficiency (NSE) and (2) PBIAS (a measure of the percentage bias of the simulation results where a positive value indicates the model underpredicts the observed variable and a negative value the reverse case). Water quality variables (only TP and SRP are reported here), either concentrations or loads are assessed by: (1) PBIAS (as above); (2) the normalized root-mean-square error (NRMSE) (where the normalization involves dividing the estimate by the standard deviation of the observation, as reviewed by Moriasi et al. [44]). “Satisfactory” values [45] for daily discharge are NSE > 0.5 (50) and PBIAS ± 15% for monthly streamflow. For water quality (N and P) a PBIAS of ± 70% was suggested for “Satisfactory” performance for monthly data [44], so for daily concentration data, a PBIAS of ±70% would indicate more than satisfactory performance. A split-sample approach has been taken where the full period modeling has been divided into separate calibration followed by validation (no further adjustment of model parameters allowed) periods.
    
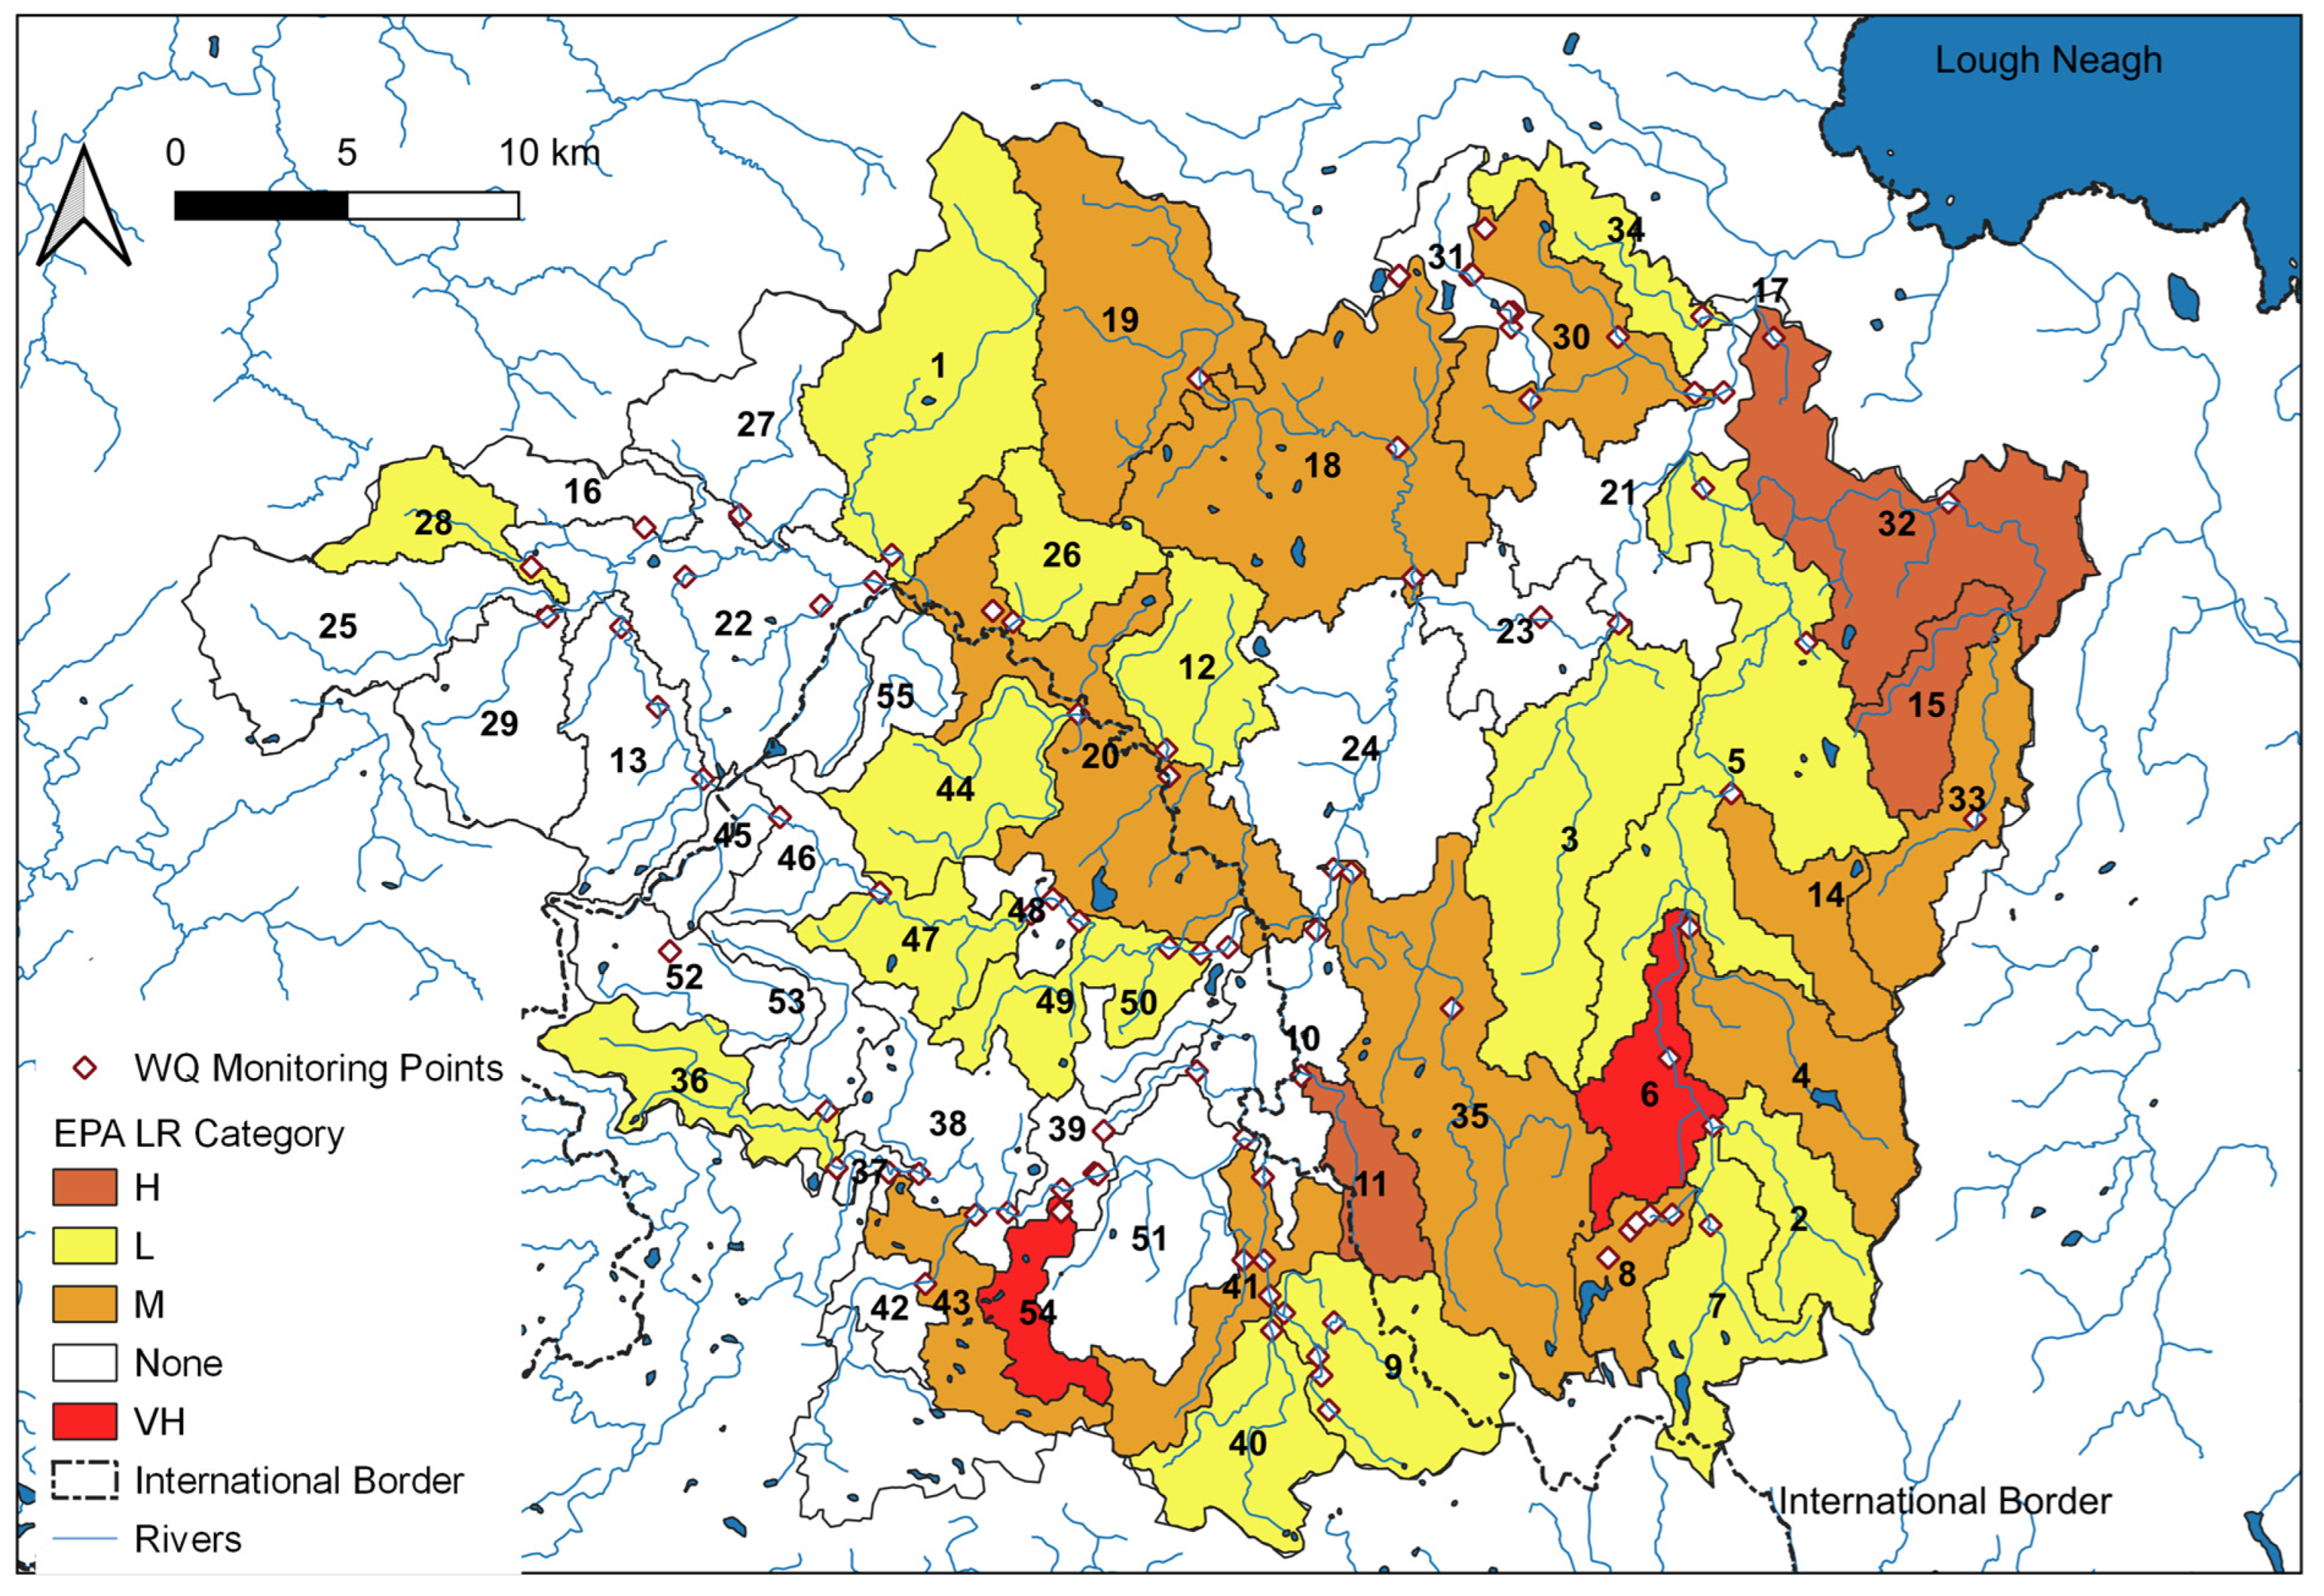
Here, a “donor” approach was used to transfer parameters from the nearest gauged catchment with similar soils and vegetation types to ungauged sub-catchment models. This process created 4 parameter sets in all, one obtained from each of the gauged sub-catchments and one “High WFD” set obtained using observed SRP concentration data in a headwater sub-catchment without discharge measurements.
    
Runoff was divided into low and high classes (based on annual mean Prec ≥ 1070 mmyr−1 as “High”), where Prec is the average annual rainfall from WY 2005 to 2017, calculated from the CEH-GEAR gridded rainfall data (recall that runoff ≈ Prec − AET).
    
Therefore, set 2 represents a parameter set reflecting high runoff and “Moderate” (i.e., the WFD status assessed for SRP) water quality. Set 4 also represents high runoff and was used for sub-catchments achieving “Good” or better water quality. This idealized “High WQ” parameter set was created to represent the best possible conditions which were achieved between 2015 and 2019 in the upper Blackwater headwater sub-catchments, using SRP data from one of the headwater sub-catchments with observed P data (but no discharge) to calibrate the model’s SRP component parameters, water flow parameters were identical to set 2 parameters. Sets 1 and 3 were created for low runoff sub-catchments with set 1 representing “Moderate” to “Good” water quality and set 3 “Bad” to “Poor” water quality. There were no sub-catchments combining high runoff with “Poor” or worse water quality.
Step 2. 
The OCM was used to model discharge from the larger Maydown Bridge (BWMB) catchment, which contains two of the three nested catchments modeled in Step 1. To assess the performance of the OCM, the daily model results were then compared with the weekly observed nutrient data to check the performance of the OCM’s phosphorus sub-model. The OCM’s P parameters were calibrated using values obtained in Step 1 as a first approximation to a best-fit “Expert” set. The model performance was assessed against the weekly SRP and TP data, allowing the parameters controlling PP generation in the model to be adjusted, if necessary, since PP will have a direct influence on modeled TP concentrations, these were not calibrated in Step 1 as there were no TP data available in the monthly monitoring dataset.
Step 3. 
The DCM was evaluated on the same weekly nutrient data used in Step 2 and the results were compared against the OCM results (from Step 2) for SRP and TP, to see which model formulation worked the best in performance terms (reproducing observed TP and SRP loads, and concentrations). Importantly, the flow (runoff generation) components of the two models are identical so the model results for nutrients but not discharge differ between versions. Regarding model choice, a decision was taken following the simulations in Step 3 using a Minimum Information Requirement (MIR) philosophy [2], i.e., as to whether having the additional complexity in adopting the DCM was justified in this case.
Step 4. 
A selected set of Mitigation scenarios was evaluated on the BWMB catchment using the chosen variant of the model, assuming that the mitigation measures such as sediment and nutrient traps cover the whole area. This is not feasible to achieve due to a limitation on available land use and realistic stakeholder take-up of the measures but was used as a sensitivity analysis. These scenarios are described in more detail below.
Step 5. 
The MultiCRAFT model was set up using a nested approach with the selected variant (Original or Dynamic) as the sub-catchment CRAFT model, to simulate all 55 sub-catchments individually, each using a parameter set with categories assigned from Step 1 according to observed SRP concentrations and runoff.
Step 6. 
The best-performing mitigation options from Step 4 were evaluated at the sub-catchment level, where an LR was required, to see how well the mitigation scenario(s) work at a local level, using MultiCRAFT to run all 55 sub-catchments again but with mitigation features adopted covering part of the sub-catchment area.

2.5. Mitigation Scenarios

To simulate a set of mitigation scenarios using either variant of CRAFT in Steps 4 and 6, a series of mitigation parameter sets were developed, which could, for example, simulate (with the OC variant): (i) reduced SRP concentrations in fast-subsurface and/or surface runoff representing reduced slurry application rates and/or reduced fertilizer application rates alongside improved soil P management; (ii) reduced PP concentrations in surface runoff (e.g., by reducing parameter KSR(PP)). In both variants of the CRAFT the following scenarios can be evaluated: (i) reducing SRP concentrations in background flow (CSRPGW) representing a point source load reduction (Please note that, in both variants of the model, the slow groundwater (GW) flow pathway includes the effect of point sources (i.e., “background” flows)); (ii) using the attenuation store, which can trap and remove PP from the model’s surface runoff flow pathway by setting a removal efficiency (RE) > 0).
The mitigation scenarios were then evaluated in modeling Steps 4 and 6 as follows:
In Step 4 the entire BWMB catchment was assumed to have mitigation measures which were expected to have a large impact on P loads and concentrations at the catchment outlet. Running these scenarios was a useful exercise in terms of assessing the sensitivity of the chosen version of the CRAFT to simulate these measures, either individually in a single-option scenario or combined with multiple options. For example, a combined scenario could include improved land management to reduce surface runoff plus sediment traps, herein two single scenarios were combined into one, hopefully more effective scenario. The model was then rerun to reduce nutrient loads exported from the entire BWMB, as one unit (i.e., as a single catchment). This approach assumed that the scenarios are applied everywhere, as it was primarily a sensitivity study to identify the most effective measures (from the full set of scenarios) in terms of reducing P loads.
In Step 6 the best-performing, single or combined scenarios were applied to the sub-catchments upstream of BWVB that require a LR (refer to the map shown in Figure 3 in Results). This exercise covered the entire Blackwater catchment. The first estimate of the mitigated area which is then treated with mitigation measures (Amit) was estimated from the P load LPBaseline (calculated from the individual CRAFT simulations above) and the required LRi, expressed by Equation (6) as
Amiti = (LRi/LPBaselinei) AreaSCi
where AreaSC is the area of the sub-catchment and suffix i denotes the sub-catchment number. Further adjustment of this area was required if the modeled LR does not equal or exceed the assessed (i.e., the required) LR. The modeled LRs were likely to be initially too low as the mitigated area still generates some P loads, albeit these should be much smaller loads per unit area than the unmitigated area will export.
An explanation of the different mitigation scenarios follows: Group 1 targeted the Fast SS flow pathway, representing reducing nutrient loadings from the soil as follows (in the DCM, refer to S1.1. for more information on the process equations): (i) 1A Pinitial can be reduced to achieve this (in this case by 50%) from its baseline value of 1 kg Pha−1; (ii) 1B the diffusion coefficient Kd can be reduced from 0.15 to lock more P into the topsoil and reduce fast-subsurface flow pathway SRP concentrations; (iii) 1C Increasing PDIST can move more P into the topsoil (hence potentially increase the risk of pollution swapping, by increasing PP transported by surface runoff) i.e., from 0.95 to 0.99 in this case. Group 2 targeted surface runoff (SR) reduction which simulates improved soil management without changing the P input as follows: (i) 2A increased maximum surface drainage parameter SDMAX by 50% to allow more infiltration into the soil store; (ii) 2B reduced PDIST (from 0.95 to 0.94) to move more P into the subsoil (again a risk of pollution swapping) to reduce PP loads in SR. In the Group 3 scenario, the modeling assumed that effective sediment traps as in-line mitigation measures are introduced thus trapping sediment and particulate P using a removal efficiency (RE) of 60% (0.6). In Group C the modeling considered a set of combined mitigation approach(es) and analyzed which one performed the best out of the two selected: Scenarios C1 and C2.

3. Results

3.1. Load Reductions

The observed weekly nutrient data indicated that based on the 2011–2016 monitoring period the FWMC of SRP was 104 µg P L−1 at the downstream-most monitoring point (VB). The catchment SRP load and export (load per unit area) were estimated at, respectively, 99.2 tonnes P and 0.72 kg P ha−1 year−1. Based on the 69 µg P L−1 “Good” WFD threshold for SRP (for the “Lowland high Alkalinity” class) [46] reduced by applying a safety factor of 0.9, to 62.1 µg P L−1, the load reduction (SRP) required (calculated using the SM above and Equation (2)) is approximately 33.8 tonnes P year−1 (expressed as export = 0.25 kg P ha−1year−1). This calculation used the runoff (specific discharge) data from the BWMB gauge (Mean annual runoff = 627 mm: WY 1998–2016) and treated the catchment as a single unit not divided up into sub-catchments. The concentration of SRP was below the WFD threshold value for “Good” status 39.7% of the time. For the BWMB catchment, the total catchment P load was estimated by multiplying the ratio of the different catchment areas by the load estimate measured at VB above, resulting in a figure of 69.7 tons P (as SRP).
Figure 3 expresses the sub-catchment LRs as classes based on the EPA’s WFD Cycle 2 EPA, 2018 [46] national scale for river basin management plans (RMBPs) (in kg P ha−1 year−1), with “Very High” being >1, “High” being 0.5–1, “Medium” 0.25–0.5, and “Low” less than 0.25. In Figure 3 these EPA LR classes are used to highlight those areas of the Blackwater catchment requiring the greatest LRs, using the same classification bands to assess the NI portion of the catchment as well. The red-shaded areas represent the highest category “VH” of LR in the catchment.
Summing up LRs in individual sub-catchments (as TP), the total LR needed was 40.3 tonnes P year−1 across the entire Blackwater (VB) catchment (north and south of the border), of which 5 tonnes P year−1 was required to come from the ROI sub-catchments. Comparing this figure with the estimate using the data at VB alone, the LRs calculated by the different methods differed by about 20% (48.3 tonnes P year−1 vs. 40.3 tonnes P year−1). Considering the LR from just the BWMB catchment calculated by summing up the individual sub-catchment LRs, the total LR was 18.4 tonnes P year −1. These figures also indicate that the lower reaches of the catchment tended to have worse water quality (i.e., higher SRP concentrations) than the upper catchment as the lower 30% (in terms of area) of the catchment contributed 47% of the total load reduction. In percentage terms, the SRP load reduction required to achieve good status at BWMB was calculated to be 20% of the estimated load (based on using concentrations from monthly NIEA samples and the load estimation methods [25].
These LR calculations for the ungauged catchments used observed gridded rainfall (from 1 km squares) along with AET, to estimate sub-catchment runoff using Equation (1). An additional source of load reduction may be occurring in the main channel between the sub-catchments and the outlet to Lough Neagh through the deposition of sediment-bound P or uptake of SRP by benthic communities living in the watercourses. However, Douglas et al. [34] found that low-flow SRP concentrations increased with increasing upstream area monitored in the Oona Water, possibly due to the release of P from sediment stores of P in the riverbed. It is reasonable to assume that the same processes can take place in the larger Blackwater catchment as mean monthly SRP concentrations showed an increasing trend downstream between monitoring points (from 68 µg P L−1 at Maydown Bridge (MB) to 90 µg P L−1 at Bonds Bridge (BB)) based on monthly grab samples collected between 2014 and 2019 by NIEA.
Please note that the observed SRP LRs (calculated from the gap between the target and observed SRP concentrations) were multiplied by 0.7 to estimate the TP LRs for the WFD sub-catchments, whereas CRAFT model results discussed below are based on modeling TP and SRP separately. This approximation may introduce additional uncertainty into the LR estimates (as TP) as a range of say 0.5–0.8 could be used (based on discussions with P. Jordan (pers comm 2020)).

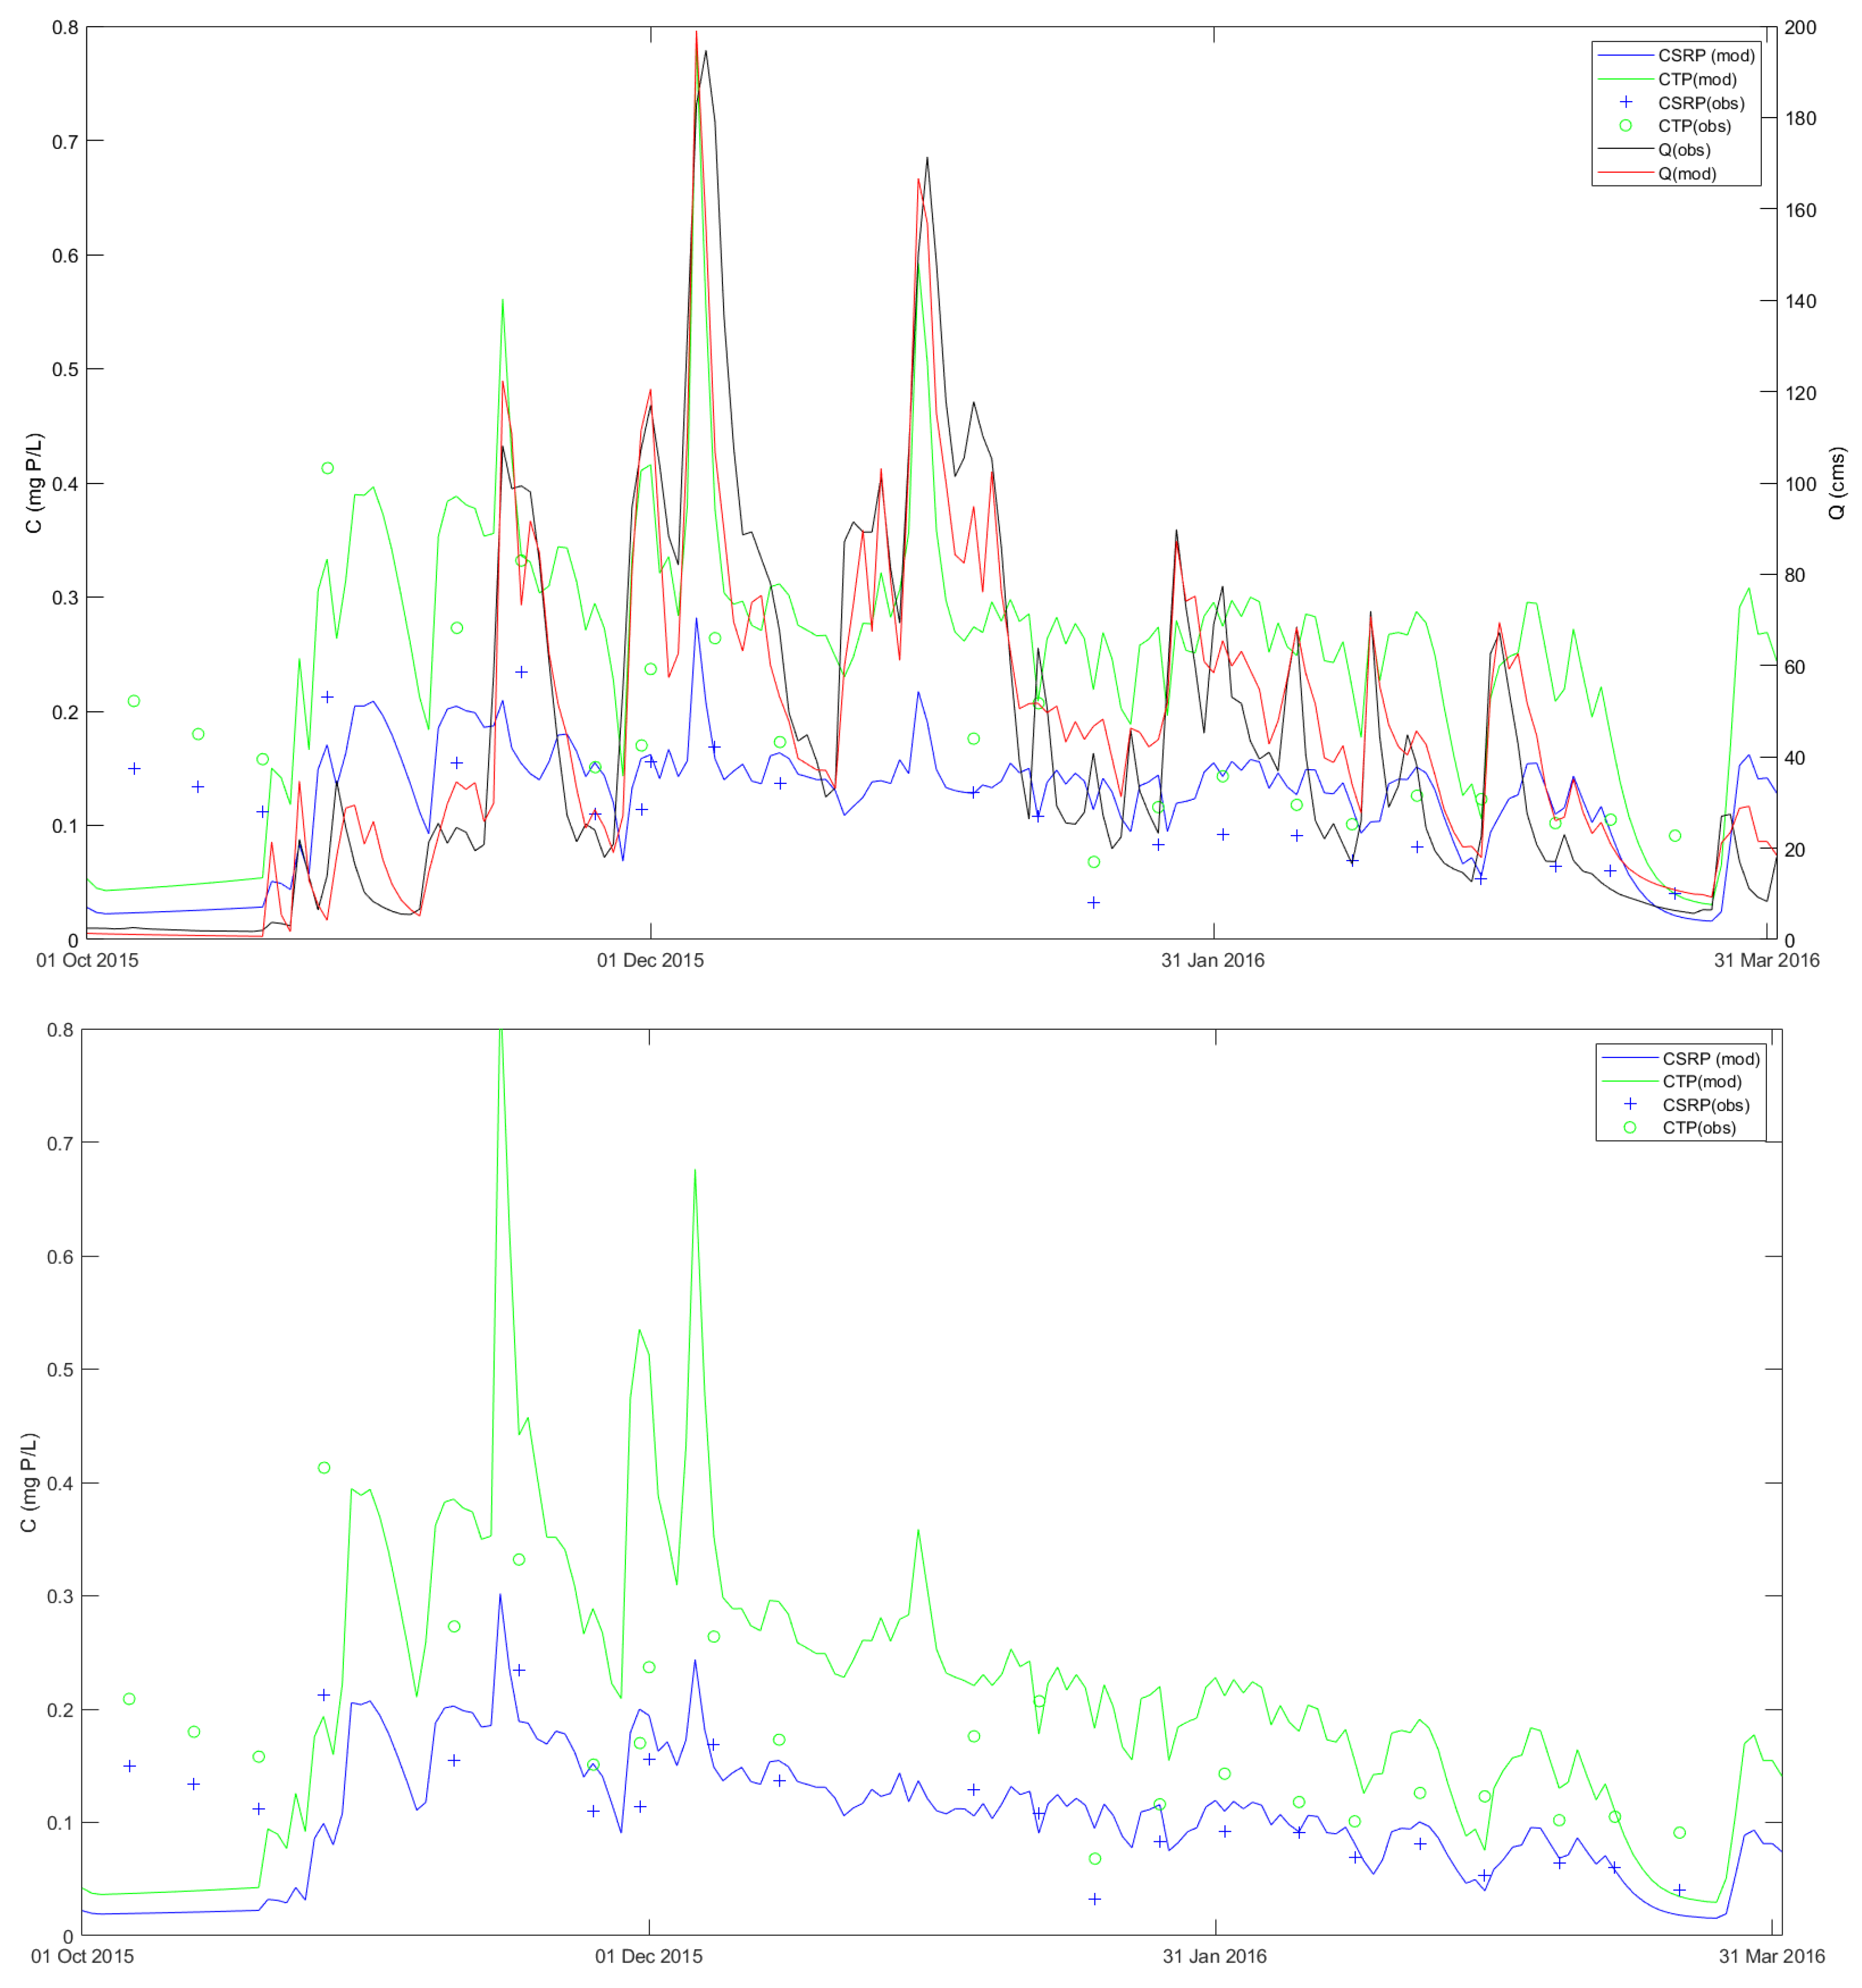
3.2. Water Quality Modeling

3.2.1. Model Results: Steps 1–3 and 5

The results from each of the modeling steps are summarized below. In Step 1 we established a baseline simulation of the three sub-catchments listed in Table 1: BWDM, CALL, and OOSM. The period modeled (WY 2005–2016) was split into calibration and validation periods using data from the periods WY 2005–2010 and WY 2011–2016, respectively, for each. The results in terms of Q and SRP are shown in Table 2. The metrics shown in Table 2 for Q are PBIAS and NSE, and for SRP PBIAS and NRMSE. The model performance from Step 1 was classed as “good” [42] for both metrics in both the calibration and validation periods for both Q. One minor cause for concern was a tendency for Q at OOSM to be overpredicted with PBIAS < −10%; however, “good” NSE values > 0.7 were achieved for both time periods. In terms of nutrients (SRP) the model performance was acceptable for all three sub-catchments for both calibration and validation periods. A brief description of the model parameters can be found in Table S1 in the Supplementary Materials.
The model evaluation in Step 2 made use of observations of both TP and SRP measured at the VB monitoring point which were used to calibrate the OCM model parameters that control the generation of particulate P (PP), since TP = PP + SRP. Again, the complete modeled period was split into two for calibration and validation of the model. The results are shown in Table 3 in terms of the metrics assessing Q, SRP, and TP, as above in Step 1. As the catchment scale increased, it was expected that model performance would improve, and results showing the metrics assessing Q and SRP indicated that the model performed best on the larger combined BWMB (Q) + VB (SRP and TP) sub-catchment compared to the smaller sub-catchments evaluated in Step 1. For BWMB it can be seen, moving downstream that (i) the NSE increased for Q; (ii) that the predicted PBIAS decreased for both Q and SRP compared with the upstream sites at OOSM and BWDM (excepting the lower PBIAS for OOSM in the Calibration period). Model parameters derived from Steps 1 and 2 and allocated to sets 1 to 4 are listed in Table S1.
The next set of results from Steps 2 and 3 are depicted using scatter plots of the modeled daily TP and SRP loads predicted by the DCM against observed loads calculated at VB, for the entire modeled period. Also shown are scatter plots of specific discharge (q) at the BWMB gauge to evaluate the performance of the DCM variant of the CRAFT. The DCM CRAFT simulation achieved an improved fit with a more advanced “dynamic” P component. This simulation was set up with this store to be replenished on an annual basis; it is then depleted over time as the drainage water from the upper model store removes SRP via the fast-subsurface flow pathway (ref Methods). Figure 4 is tiled so that each row represents a model variant for comparison of loads and specific discharges (labeled “runoff”) predicted by both variants by simulating the catchment as one area, and lastly with MultiCRAFT. The results are plotted across each row of Figure 4 as (L to R) runoff (q), SRP loads, and TP loads.
These results were interesting and indicated that the DCM model had performed slightly better than the OCM model (in terms of predicting SRP loads), although there was still a large degree of scatter in the DCM’s results. There was a clear underprediction of the SRP and TP loads by the OCM; however, this was less noticeable for the DCM which was able to predict the higher P loads quite well. TP loads include SRP but also PP both of which the DCM simulates slightly differently by calculating the detachment of PP from the top layer of a dynamic soil store with time-varying P content (see Supplementary Material S1.1) so the results differed between the OCM and DCM variants, with the DCM generally outperforming the OCM at simulating TP loads.
Concentrations are also important in terms of modeling capability as their long-term or even episodic elevation to high levels can have damaging effects on aquatic ecosystems, as one of a multiple series of stressors [47] therefore the temporal pattern of concentrations was examined for both SRP and TP. A representative period of modeled and observed P and Q values at the VB monitoring point is shown in the following pair of time series plots in Figure 5, which begins just after the dynamic P store in the DCM is replenished in October 2015, with the TP predictions shown by the red lines and SRP predictions by the black lines. Modeled and observed discharge (solid lines, for the OCM simulation only) also indicate when runoff events took place and whether these mobilized larger concentrations of TP in the model (green lines). The results from both the OCM and DCM simulations are shown. These results will be discussed further below in Section 4.1.
Table 2 also shows results from Step 3 in terms of the metrics assessing SRP and TP (alongside the results from Steps 1 and 2) from the DCM results assessed over two periods: Calibration and Validation. Here, the main aim of this step was to examine how well the DCM fitted P concentrations and loads with limited calibration of the additional DCM parameters. However, for SRP the results indicated that the absolute PBIAS for the calibration period was slightly higher from the DCM than the OCM, with a negative sign indicating that both variants overpredicted SRP; however, the reverse applied for NRMSE which was higher from the OCM than from the DCM results. Surprisingly, for SRP both variants performed better in terms of PBIAS over the validation period and underpredicted SRP concentrations in both cases. The DCM also performed better for TP over the validation period than the calibration period in terms of PBIAS and outperformed the OCM for validation but not calibration phases. TP NRMSE values were quite similar for both periods for the DCM simulation and did not indicate any deterioration of model performance in the validation phase.
In Step 4 we investigated how sensitive the chosen CRAFT variant was to adjust the parameters that represent the impact of mitigation measures in a catchment. Before simulating the mitigation measures across the entire BWMB catchment in this step a decision was made that the DCM performed better than OCM so subsequently the DCM was used in the simulations in Steps 4 to 6. The evaluation of the Step 4 results will be discussed below under the heading of mitigation scenarios.
In Step 5 we simulated the entire BWMB catchment with baseline conditions using a MultiCRAFT simulation (using the DCM as the model variant) with four different categories of model parameters assigned according to sub-catchment characteristics (see Methods). Table 2 also contains the metrics for Q, SRP, and TP as above for the MultiCRAFT results. Again, the model evaluation was made using the same metrics for Q, SRP, and TP as in Steps 1–3 above, with observed P data sampled at the VB site. The results were quite interesting in that the combined MultiCRAFT simulation with 55 sub-catchments outperformed a DCM single catchment simulation of the same area in terms of both PBIAS and NRMSE (calibration and validation periods) for SRP as well as TP. It appears that the additional time lag introduced in the MultiCRAFT simulations (Equation (3)) has improved the results when assessed at BWMB. The routing parameter KDel was calibrated roughly by reducing it from unity down to 0.25 (unity implies that the delay applied to a headwater catchment’s flow pulse reaching Maydown Bridge gauge is one day for each additional sub-catchment located between the headwater and BWMB) which led to the highest value of the NSE metric for Q. The results are plotted in the lower row of Figure 4 as (L to R) specific discharge (q), SRP loads and TP loads.
Lastly, the results from Step 6 will be discussed below in the following section on the mitigation scenario results for the combined scenarios.

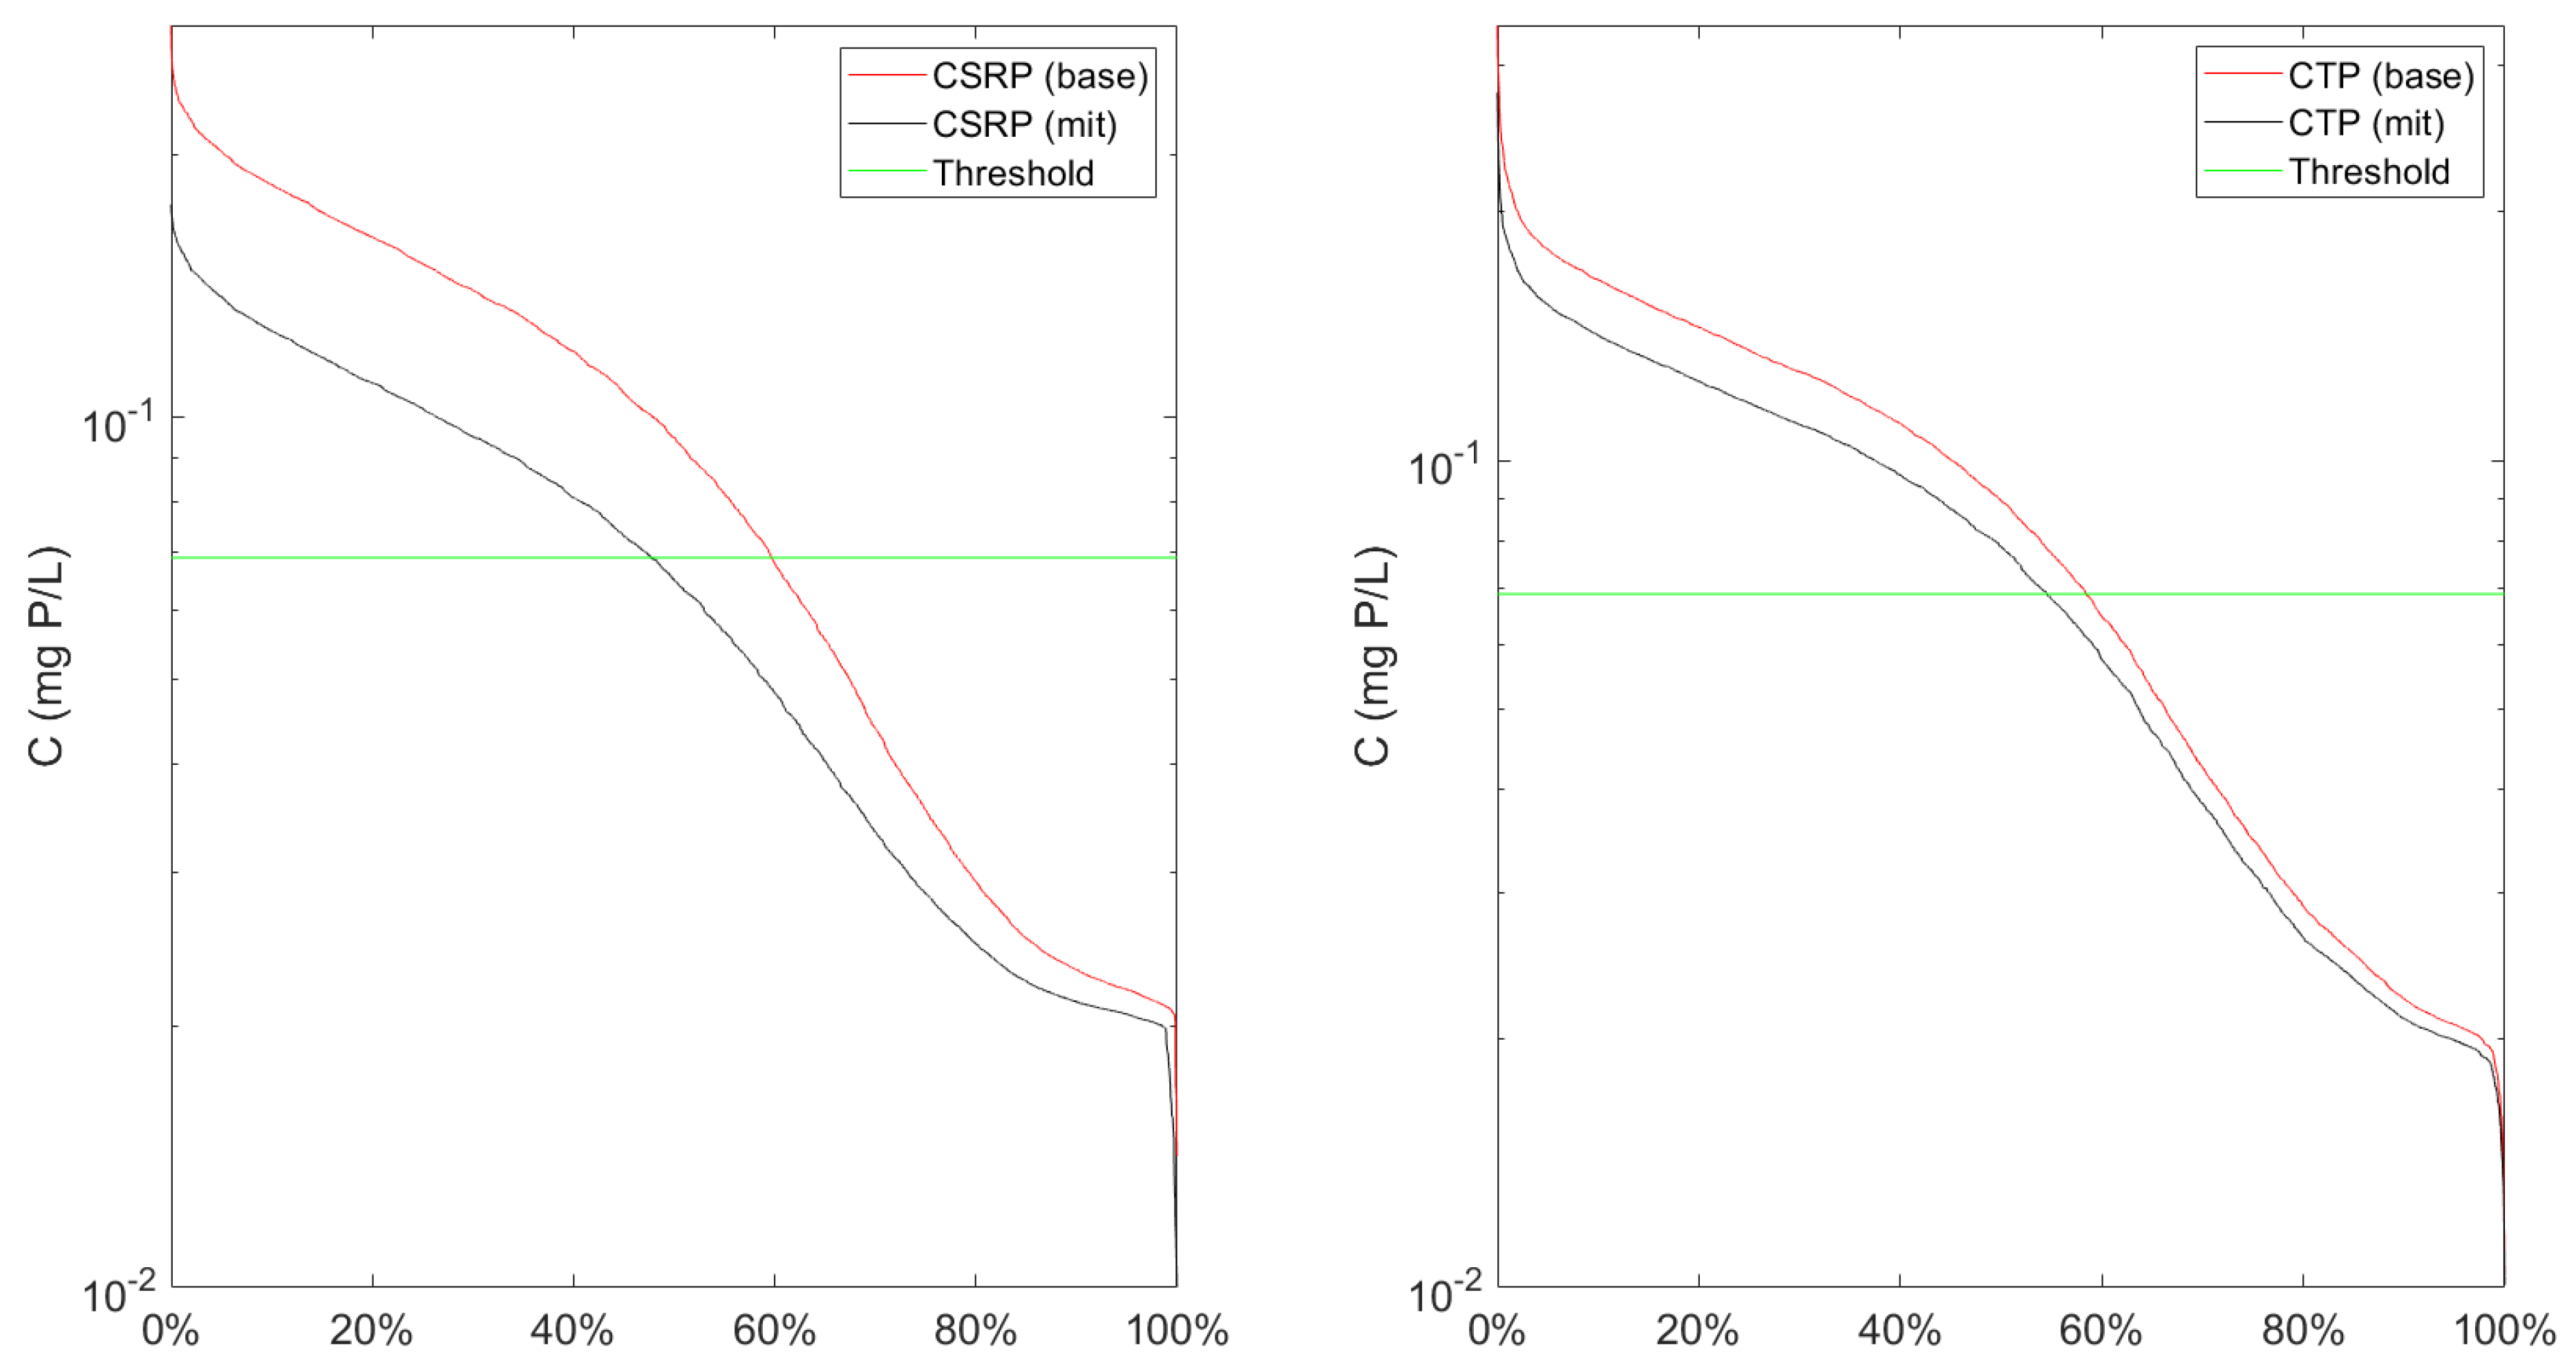
3.2.2. Model Results: Mitigation Scenarios (Steps 4 and 6)

Individual Scenarios: These were evaluated in Step 4 using the DCM simulating the entire BWMB catchment as one homogeneous unit, and the results are shown below in terms of changes in the daily mean values of P during the full simulation time period Figure 6a (for Cs) and Figure 6b (for loads). Broadly speaking the relative changes in mean TP and SRP loads for each scenario were similar to the relative changes in mean TP and SRP concentrations. The changes in model parameters in the different scenarios are shown in Table 3 below.
Table 3. Summary of Mitigation Scenario Model Parameters.
ScenarioPInitial (kg P ha−1)P Removal Efficiency RE (-)Other Parameters: Abbreviation (Value/Percentage Change)
Baseline10N/A
1A0.50None
1B10KD (0.05)
1C10PDIST (0.99)
2A10SDMAX (+50%)
2B10SDMAX (+50%)
PDIST (0.94)
3A10.6None
C1 (Combined) 2A + 3A10.6PDIST (0.94)
SDMAX (+50%)
C2 (Combined)
1A + 3A
0.50.6None
There was a considerable difference in the success in terms of load reductions of the different individual mitigation options modeled. Group 1 scenarios were quite effective at removing SRP from the catchment via reducing the available P (scenario 1A), and in 1C moving more P into the upper layer of the soil by simulating nutrient redistribution. Scenario 1C may be difficult to achieve in practice in most soils and may be best considered to be a model sensitivity exercise. Group 2 scenarios were less effective at reducing P and 2B caused an increase in SRP and TP Cs and loads due to transferring more available P into the lower layer of the soil, where it was then transported to the river by the fast-subsurface flow pathway. This was despite 2B reducing surface runoff by increasing the SDMAX parameter (thus allowing more infiltration into the dynamic soil store). The single Group 3 scenario (3A) targeted removing PP using sediment traps with a high RE of 60%, and was therefore highly effective at reducing PP and therefore also TP. In the current version of the model, only the surface runoff flow pathway is diverted into the attenuation store, so the percentage of the TP load removed depends on how much PP is transported by this flow pathway, if the SRP component was not removed. Diverting fast sub-surface flow into this store too may be implemented in future versions of the CRAFT.
Combined Scenarios Following the evaluation of the individual mitigation scenarios discussed above, two combined scenarios C1 and C2 were modeled, first with a single DCM simulation in Step 4 and then in Step 6 with the MultiCRAFT framework. The results from Step 4 in terms of the predicted LRs (shown in Figure 6b above for TP and SRP loads) indicated that scenario C2 was much more effective than C1 in reducing P loads from the BWMB catchment.
Due to more soil P becoming mobilized as SRP through the fast-subsurface flow pathway in C1, there was a small increase in SRP loads under C1 compared to the baseline scenario when these were evaluated in Step 4 (Figure 6b). Both C1 and C2 generated moderate reductions in the predicted PP loads through the application of mitigation measures targeting trapping of PP transported by surface runoff, hence TP load reductions were achieved by C1, albeit very marginal ones due to the increase in the SRP component of the TP load counteracting the decrease in the PP component. In Step 6 when MultiCRAFT was applied over the entire Blackwater catchment, scenario C1 was more effective at achieving higher TP LRs in the ROI sub-catchments than in the NI ones for some reason, perhaps higher surface runoff, entraining higher PP fluxes, was generated in the upstream area, due to locally higher precipitation.
Results from Step 6 extracted from the MultiCRAFT simulations for scenarios C1 and C2 are shown below in Table 4. Table 4 also tabulates the final areas of mitigation measures implemented in the simulations, as a percentage of the total catchment area. These areas were calibrated individually in scenario C2 to achieve the desired LRs but were not calibrated in C1; since it was clear that this scenario increased SRP loads relative to the baseline, it was not pursued further. The explanation for the increase in SRP was that due to more soil P becoming mobilized as SRP through the fast-subsurface flow pathway in C1, there was a small increase in SRP export under C1 compared to the baseline scenario. Both C1 and C2 simulated reductions in PP loads through the application of mitigation measures (sediment traps) targeting surface runoff, hence TP load reductions were achieved by C1, albeit very marginal ones due to the increase in the SRP component of the TP load counteracting the decrease in PP loads in surface runoff. The following section therefore discusses the results from scenario C2 only as this was the preferred option based on the results evaluated above.
Concentrations. The Concentration–Duration (C–D) plots in Figure 7 below indicated that despite the LRs from mitigation measures put into place the mean annual SRP concentration at BWMB was not reduced below the WFD “Good” limit of 69 µg P L−1 in scenario C2, with the mitigation measures introduced in both NI and the ROI but was still as high as 80 µg P L−1. SRP concentrations were below the WFD “Good” limit for approximately 46% of the year on average up from 41% of the year in the “Baseline”. Exceedances of the limit frequently took place at higher flows during wetter periods where there were simulated runoff events. This was the case during the larger storm events as observed in the TP concentrations predicted by the model in mitigation scenario C2.
Loads. Results from scenario C1 (Table 4) indicated some pollution swapping was present in the sub-catchments with an overall increase in load at BWMB of 0.4% or 0.4 tonnes P year−1 (SRP). Due to the incorporation of sediment traps (also trapping PP) in this scenario, there was a small decrease in TP loads in some sub-catchments of 1–3%, even though SRP loads increased slightly. Both these scenarios assumed mitigation measures applied to both NI and ROI areas of the catchment. The results from scenario C2 indicated that there was an LR of 14.5% (SRP) and 15% (TP) from the BWMB catchment, equating to 12.4 tonnes P year−1 (SRP) and 25.1 tonnes P year−1 (TP). However, these figures when compared to the LRs calculated by the “Simple Method” above indicate that the required TP LR of 18.4 tonnes P year−1 has been more than achieved by this scenario (25.1 tonnes P year−1) and that the required SRP LR of 12.8 tonnes P year−1 was almost achieved. For comparison, Table 4 also shows the load reductions calculated at the downstream-most NIEA monitoring point (Bond’s Bridge in sub-catchment ID 21) which includes a set of sub-catchments with moderate or worse water quality (based on the WFD assessment of SRP) between Maydown Bridge gauge and this sampling point (compared to the sub-catchments upstream of here). Refer to Figure 3 for the percentage LRs from this group of sub-catchments.
Scenario C2
The effectiveness of scenario C2 in terms of the modeled measures meeting the specified LRs for the individual sub-catchments is shown below in Figure 8, for both the NI and the ROI sub-catchments. Sub-catchment IDs can be found on the map above in Figure 3. Both the estimates from the “Simple Method” (SM) described above and the model results from scenario C2 are shown.
These results show that on the whole the target LRs were achieved in the individual sub-catchments by adjusting the area covered by the mitigation features in this scenario. Compliance with the upper limit concentration required to achieve “Good” status was harder to achieve for SRP concentrations. Figure 7 (above) shows the SRP C-D curves for (i) the Oona Water, which comprises two WFD sub-catchments IDs #19 and #20 (Figure 3), and (ii) the entire Blackwater catchment. In some of the individual sub-catchments, the results (not shown) showed rather surprisingly that achieving the LR does not always ensure that the upper threshold is not exceeded on a repeated basis. The reasons for this non-compliance require a more detailed interpretation. Exceedances of the upper threshold frequently took place at higher flows during wetter spells, when simulated runoff events generated high P concentrations. This will be discussed in more depth below.

4. Discussion and Conclusions

In the Blackwater catchment, the overall load reductions targeted a figure of 20% of the total SRP load per annum. These load reductions (LRs) are based on the calculations above that use the gap between observed and target SRP concentrations; however, according to the CRAFT model results these LRs do not necessarily reduce either the mean SRP concentration or the time the instantaneous C is below the “Good” threshold significantly in some cases. This is shown quite clearly in the concentration–duration plots (Figure 7) for the best-performing LR scenario (C2).
One explanation may be that in the model the SRP C, on days where samples were taken at high flows, may be reduced more than the SRP C, on days with average or below-average flows, to achieve the required reduction in mean SRP C to below the threshold value. Looking at the Blackwater catchment as a whole (total area ≈ 1400 km2), it is clear that even though the LRs are achieved in the individual sub-catchments, the mean SRP C still exceeds the target threshold for long periods of time in the mitigation scenario 1C. However, at the Oona Bridge sampling point (total area ≈ 100 km2) the SRP C fell below the target threshold (under scenario 1C) for over 50% of the time period (Refer to Figure 7 and Table 4) with an LR of 3.8 tonnes P year−1 (38.8% of the baseline SRP load) so achieving the LRs in two Oona WFD sub-catchments did result in the target threshold at Oona Bridge to be achieved for all of the time; however, this was not the case across all the sub-catchments in the 14× larger Blackwater catchment.
Following on from this observation, after the areas mitigated increased in scenario 1C through calibration, there was a high success rate in terms of achieving the required LRs at the individual sub-catchments but slightly less success in achieving “Good” Status, i.e., the modeled SRP C was only below the limit for around 45% of the time at BWMB (Figure 7). The model simulations showed how the calibrated CRAFT model can be used to determine a set of LRs based on modeling that are different (usually slightly higher) from those based on observations of SRP alone and the gap between the observed and target Cs. The latter set of LRs underestimated what reduction is required to achieve a corresponding reduction concentration in SRP concentration to achieve “Good” status, probably because the concentration dynamics are such that the storm events pull up the tenth percentile Cs to well above the “Good” threshold value. In reality, this probably occurs in catchments such as this one through entraining sediment and distal sources of P in the fields which then become mobilized to transfer to the main watercourse [38]. Higher resolution rainfall data for this catchment are ideally needed to investigate the episodic transfer of P entrained by surface runoff [21,27,48] using the full potential of the CRAFT model.
A more sophisticated LR estimate is required perhaps based on the CRAFT model results (rather than the SM) due to the situation where the LR target can be met without reducing the mean C to below the “Good” threshold values, or for more than 50% of the time (if it is a continuous time series in which case the median C must also be below the threshold). Under these circumstances, if the measured SRP C is still above the target “Good” threshold the watercourse would still fail to achieve this status. It may be necessary to revisit the sampling frequency debate, i.e., would monthly grab samples, collected mainly below Q10 flow rates, give results indicating that the mean C was below the threshold whereas more frequent sampling would result in the watercourse persistently failing?

4.1. Model Variants and Performance

This study provided an opportunity to vigorously test new variants of the model. The DCM variant can be nested in a multiple catchment modeling framework (MultiCRAFT) as was tested here. The results discussed above indicated that the DCM outperformed the OCM in simulating SRP and TP loads at the VB monitoring point. Simulations also indicated that in terms of concentrations, the DCM could better predict the depletion of SRP concentrations observed over the course of the year in the catchment monitoring data (Figure 5). The weekly monitoring data proved invaluable for model calibration as the monthly monitoring data at other sites did not capture sufficient high-flow events whereas the VB data indicated that there were high TP concentrations measured on sampling days with discharge above the Q10 value (i.e., exceeded for only 10% of the time).
Modeling showed that the DCM variant proved itself to be a useful tool if there is some variation in P concentrations over the year that OCM cannot reproduce very well (Figure 5). There were some periods, particularly in autumn 2015 where neither variant predicted SRP concentrations especially well corresponding to a period of low flows. It appears that background concentrations of SRP were elevated during this period, and the modeled constant background value (CSRP(GW)) may have been too low. Later in autumn 2015 neither variant predicted TP especially well with concentrations first underpredicted and then overpredicted. This may have been due to the propagation of errors in the predicted discharge which will have a knock-on effect on the predicted concentrations of PP in surface runoff. In general, the pattern of P concentrations predicted from the DCM appears visually to confirm that the DCM has performed better than the OCM. The DCM has a depletion term for the soil P store which in a wet year will reduce further than in a dry year, which will have a knock-on effect on SRP concentrations in the fast-subsurface flow pathway also (these will reduce more towards the end of the cycle if there is a significant depletion of the store). In Figure 5 the depletion effect can be seen in both the episodic TP concentrations during runoff events and the background SRP concentrations, which in the DCM gradually decreased from October to March. In the OCM simulations, the TP concentrations during runoff events were a linear function of the surface runoff predicted by the model and thus varied directly in proportion to the magnitude of the event. SRP concentrations did not vary over time at all, the lower SRP concentrations were predicted during periods when baseflow (slow groundwater flow pathway) conditions dominated, as the baseflow SRP concentration was less than the fast-subsurface SRP concentration.
The DCM also performed better at predicting SRP concentrations on an inter-annual basis at VB than the OCM was able to do, the relatively simple model structure of the latter tends to lead to a pattern of little variation in predicted P concentrations between different years (the P load will vary according to discharge which is a function of the annual precipitation).
One final discussion point here is how MultiCRAFT can be used to evaluate mitigation measures applied to local areas in a larger catchment i.e., sub-catchments, rather than simulate the catchment as one homogeneous unit. These sub-catchments are required to have mitigation measures adopted to reduce the TP load from the total Blackwater catchment, which in this case was assessed at a scale of approximately 900–1500 km2. The results, in this case, indicated that the MultiCRAFT version of the CRAFT (incorporating the DCM) performed as least as well as and arguably better than a single catchment simulation of the 970 km2 BWMB catchment. For smaller catchments, ranging from tens of km2 to perhaps 100 km2 (Oona Bridge/OOSM) a lumped CRAFT model of the whole catchment should suffice providing the effect of mitigation measures can be examined either by assuming that these measures are constructed across the entire catchment or in a smaller “mitigated” sub-catchment (here the catchment is then broken into two as in the EdenDTC modeling [18]). The first approach should enable policymakers to target any interventions that are required (at the local scale) although it could be argued that determining the load reductions required from each sub-catchment by the “simple” method as a first step may suffice before running a more complex model requiring daily forcing data coupled with observations of water quality measured at least monthly, to effectively calibrate a parsimonious catchment model.

4.2. Load Reductions and Mitigation Requirements

In Irish catchments, significant load reductions of nutrients including phosphorus are required to achieve the Water Framework Directive objectives, especially in agricultural catchments. This study used a simple approach to estimate these load reductions coupled with a parsimonious rainfall-runoff model (the CRAFT) to provide insights into potential mitigation scenarios. The study catchment was the trans-border Blackwater catchment which drains into the largest freshwater body in the UK and Ireland (Lough Neagh). The results indicated that a load reduction of approximately 20% was required, the bulk of which will need to come from grassland (pasture) sub-catchments with a few point sources serving small towns in the catchment. A combined mitigation scenario that modeled the removal of particulate P in sediment traps and the reduction of the excess P in topsoil performed the best from a suite of individual and combined scenarios. The message for policymakers is that along with a parsimonious and effectively parameterized catchment model, higher resolution rainfall measurements and water quality data that are collected at least weekly, but ideally more frequently still, will prove invaluable in tackling the water quality issues in Irish catchments.

Supplementary Materials

The following supporting information can be downloaded at: https://www.mdpi.com/article/10.3390/hydrology10090184/s1, Supplementary Materials S1 “Dynamic Craft Model Overview”, Table S1: Model Parameters Calibrated in OCM and DCM MultiCRAFT Simulations.

Author Contributions

Conceptualization, R.A.; methodology, R.A.; software, R.A. and P.Q.; validation, R.A.; formal analysis, R.A. and P.Q.; data curation, R.A.; writing—original draft preparation, R.A; writing—review and editing, R.A. and P.Q.; visualization, R.A. and P.Q. All authors have read and agreed to the published version of the manuscript.

Funding

This research was funded by the NI Department of Agriculture, Environment and Rural Affairs (DAERA), Evidence and Innovation grant number 19-4-03, and by CatchmentCARE (INTERREG VA funded project, managed through the Special EU Programs Body (SEUPB), with match funding from DAERA in NI and DHPLG in ROI). The APC was waived for this submission.

Data Availability Statement

The CRAFT software is freely available by contacting the corresponding author. Climatic and hydrological data are also available for research purposes from the organization that collected the original data (CEH, UK). ROI water quality data can be freely downloaded from the EPA website catchments.ie.

Conflicts of Interest

The authors declare no conflict of interest. The funders had no role in the design of the study; in the collection, analyses, or interpretation of data; in the writing of the manuscript; or in the decision to publish the results.

References

  1. Mockler, E.M.; Deakin, J.; Archbold, M.; Daly, D.; Bruen, M. Nutrient load apportionment to support the identification of appropriate water framework directive measures. Boil. Environ. Proc. R. Ir. Acad. 2016, 116B, 245. [Google Scholar] [CrossRef]
  2. Mockler, E.M.; Deakin, J.; Archbold, M.; Gill, L.; Daly, D.; Bruen, M. Sources of nitrogen and phosphorus emissions to Irish rivers and coastal waters: Estimates from a nutrient load apportionment framework. Sci. Total Environ. 2017, 601–602, 326–339. [Google Scholar] [CrossRef]
  3. EC Directive. Directive 2000/60/EC of the European Parliament and of the Council Establishing a Framework for Community Action in the Field of Water Policy. Official Journal, L 327, 22.12.2000. 2000. Available online: https://www.eea.europa.eu/policy-documents/directive-2000-60-ec-of (accessed on 29 August 2023).
  4. Reid, C.T. Mapping post-Brexit environmental law. ERA Forum 2020, 21, 655–665. [Google Scholar] [CrossRef]
  5. Fraser, C.M.; Brickell, J.; Kalin, R.M. Post-Brexit implications for transboundary groundwater management along the Northern Ireland and the Republic of Ireland border. Environ. Res. Lett. 2020, 15, 044022. [Google Scholar] [CrossRef]
  6. Evans, A.E.; Mateo-Sagasta, J.; Qadir, M.; Boelee, E.; Ippolito, A. Agricultural water pollution: Key knowledge gaps and research needs. Curr. Opin. Environ. Sustain. 2019, 36, 20–27. [Google Scholar] [CrossRef]
  7. Mateo-Sagasta, J.; Zadeh, S.M.; Turral, H. Water Pollution from Agriculture: A Global Review. Executive Summary; FAO: Rome, Italy; IMWI: Colombo, Sri Lanka, 2017. [Google Scholar]
  8. EPA. 3rd Cycle Draft Lough Neagh-Lower Bann Catchment Report (HA 03); Catchment Science and Management Unit: Dublin, Ireland, 2021; p. 35.
  9. DAERA. Draft 3rd Cycle River Basin Management Plan: For the North Western, Neagh Bann and North Eastern River Basin Districts 2021–2027; DAERA: Lisburn, UK, 2021; p. 138.
  10. DAERA. Neagh Bann Draft River Basin Management Plan 2008; DAERA: Lisburn, UK, 2008; p. 128.
  11. Wood, R.; Smith, R. Lough Neagh: The Ecology of a Multipurpose Water Resource; Springer Science & Business Media: Berlin/Heidelberg, Germany, 2013; Volume 69. [Google Scholar]
  12. Foy, R.H.; Lennox, S.D. Evidence for a delayed response of riverine phosphorus exports from increasing agricultural catchment pressures in the Lough Neagh catchment. Limnol. Oceanogr. 2006, 51 Pt 2, 655–663. [Google Scholar] [CrossRef]
  13. WFD-UKTAG. UKTAG River Assessment Method—Phosphorus: River Phosphorus Standards; c/o SEPA: Stirling, UK, 2014; p. 13. [Google Scholar]
  14. Schoumans, O.; Chardon, W.J.; Bechmann, M.E.; Gascuel-Odoux, C.; Hofman, G.; Kronvang, B.; Rubæk, G.H.; Ulén, B.; Dorioz, J.-M. Mitigation options to reduce phosphorus losses from the agricultural sector and improve surface water quality: A review. Sci. Total Environ. 2014, 468–469, 1255–1266. [Google Scholar] [CrossRef] [PubMed]
  15. Bieroza, M.; Bergström, L.; Ulén, B.; Djodjic, F.; Tonderski, K.; Heeb, A.; Svensson, J.; Malgeryd, J. Hydrologic Extremes and Legacy Sources Can Override Efforts to Mitigate Nutrient and Sediment Losses at the Catchment Scale. J. Environ. Qual. 2019, 48, 1314–1324. [Google Scholar] [CrossRef]
  16. Zhang, Y.; Collins, A.; Johnes, P.; Jones, J. Projected impacts of increased uptake of source control mitigation measures on agricultural diffuse pollution emissions to water and air. Land Use Policy 2017, 62, 185–201. [Google Scholar] [CrossRef]
  17. Barber, N. Sediment, Nutrient and Runoff Management and Mitigation in Rural Catchments. Ph.D. Thesis, Newcastle University, Newcastle Upon Tyne, UK, 2014. [Google Scholar]
  18. Adams, R.; Quinn, P.; Barber, N.; Reaney, S. The Role of Attenuation and Land Management in Small Catchments to Remove Sediment and Phosphorus: A Modelling Study of Mitigation Options and Impacts. Water 2018, 10, 1227. [Google Scholar] [CrossRef]
  19. Old, G.; Hutchins, M.; Miller, J.; Acreman, M.; Bowes, M.; Redhead, J.; Trill, E.; Blackstock, K.; Kuhfuss, L. Evaluation of Knowledge Gained from the National Demonstration Test Catchment; DEFRA: London, UK, 2020; p. 181.
  20. Adams, R.; Quinn, P.; Barber, N.; Burke, S. Identifying Flow Pathways for Phosphorus Transport Using Observed Event Forensics and the CRAFT (Catchment Runoff Attenuation Flux Tool). Water 2020, 12, 1081. [Google Scholar] [CrossRef]
  21. Adams, R.; Quinn, P.F.; Perks, M.; Barber, N.J.; Jonczyk, J.; Owen, G.J. Simulating high frequency water quality monitoring data using a catchment runoff attenuation flux tool (CRAFT). Sci. Total Environ. 2016, 572, 1622–1635. [Google Scholar] [CrossRef] [PubMed]
  22. Foy, R.; Lennox, S.; Gibson, C. Changing perspectives on the importance of urban phosphorus inputs as the cause of nutrient enrichment in Lough Neagh. Sci. Total Environ. 2003, 310, 87–99. [Google Scholar] [CrossRef]
  23. Heaney, S.I.; Foy, R.H.; Kennedy, G.J.A.; Crozier, W.W.; Connor, W.C.K.O. Impacts of agriculture on aquatic systems: Lessons learnt and new unknowns in Northern Ireland. Mar. Freshw. Res. 2001, 52, 151–163. [Google Scholar] [CrossRef]
  24. Barry, C.D.; Foy, R.H. Assessing the Success of Regional Measures for Lowering Agricultural Nutrient Pollution in Headwater Streams. J. Environ. Qual. 2016, 45, 1329–1343. [Google Scholar] [CrossRef]
  25. Doody, D.; Foy, R.; Barry, C. Accounting for the role of uncertainty in declining water quality in an extensively farmed grassland catchment. Environ. Sci. Policy 2012, 24, 15–23. [Google Scholar] [CrossRef]
  26. DAERA. Environmental Statistics Report; DAERA: Belfast, UK, 2022; p. 60.
  27. Jordan, P.; Arnscheidt, A.; McGrogan, H.; McCormick, S. Characterising phosphorus transfers in rural catchments using a continuous bank-side analyser. Hydrol. Earth Syst. Sci. 2007, 11, 372–381. [Google Scholar] [CrossRef]
  28. Monaghan, R.; Smith, L.; Muirhead, R. Pathways of contaminant transfers to water from an artificially-drained soil under intensive grazing by dairy cows. Agric. Ecosyst. Environ. 2016, 220, 76–88. [Google Scholar] [CrossRef]
  29. Mellander, P.E.; Jordan, P.; Shore, M.; McDonald, N.T.; Wall, D.P.; Shortle, G.; Daly, K. Identifying contrasting controls and surface water signals from groundwater phosphorus flux. Sci. Total Environ. 2016, 541, 292–302. [Google Scholar] [CrossRef]
  30. Edwards, A.C.; Kay, D.; McDonald, A.T.; Francis, C.; Watkins, J.; Wilkinson, J. Wyer Farmyards, an overlooked source for highly contaminated runoff. J. Environ. Manag. 2008, 87, 551–559. [Google Scholar] [CrossRef]
  31. Stutter, M.; Glendell, M.; Ibiyemi, A.; Palarea-Albaladejo, J.; May, L. Can prediction and understanding of water quality variation be improved by combining phosphorus source and waterbody condition parameters? Front. Water 2022, 4, 852883. [Google Scholar] [CrossRef]
  32. Fenton, O.; Tuohy, P.; Daly, K.; Moloney, T.; Rice, P.; Murnane, J.G. A Review of On-farm Roadway Runoff Characterisation and Potential Management Options for Ireland. Water Air Soil Pollut. 2021, 232, 1–22. [Google Scholar] [CrossRef]
  33. Cassidy, R.; Jordan, P. Limitations of instantaneous water quality sampling in surface-water catchments: Comparison with near-continuous phosphorus time-series data. J. Hydrol. 2011, 405, 182–193. [Google Scholar] [CrossRef]
  34. Douglas, R.W.; Menary, W.; Jordan, P. Phosphorus and sediment transfers in a grassland river catchment. Nutr. Cycl. Agroecosyst. 2007, 77, 199–212. [Google Scholar] [CrossRef]
  35. Tanguy, M.; Dixon, H.; Prosdocimi, I.; Morris, D.G.; Keller, V.D.J. Gridded Estimates of Daily and Monthly Areal Rainfall for the United Kingdom (1890–2019) [CEH-GEAR]; NERC EDS Environmental Information Data Centre: Wallingford, UK, 2021.
  36. Tanguy, M.; Prudhomme, C.; Smith, K.; Hannaford, J. Historical gridded reconstruction of potential evapotranspiration for the UK. Earth Syst. Sci. Data 2018, 10, 951–968. [Google Scholar] [CrossRef]
  37. Jordan, C.; Higgins, A.; Wright, P. Slurry acceptance mapping of Northern Ireland for run-off risk assessment. Soil Use Manag. 2007, 23, 245–253. [Google Scholar] [CrossRef]
  38. Hayes, E.; Higgins, S.; Geris, J.; Nicholl, G.; Mullan, D. Weighted risk assessment of critical source areas for soil phosphorus losses through surface runoff mechanisms. CATENA 2023, 225, 107027. [Google Scholar] [CrossRef]
  39. Jordan, C.; McGuckin, S.; Smith, R. Increased predicted losses of phosphorus to surface waters from soils with high Olsen-P concentrations. Soil Use Manag. 2006, 16, 27–35. [Google Scholar] [CrossRef]
  40. Bárdossy, A. Calibration of hydrological model parameters for ungauged catchments. Hydrol. Earth Syst. Sci. 2007, 11, 703–710. [Google Scholar] [CrossRef]
  41. Quinn, P.F.; Hewett, C.J.M.; Dayawansa, N.D.K. TOPCAT-NP: A minimum information requirement model for simulation of flow and nutrient transport from agricultural systems. Hydrol. Process. 2007, 22, 2565–2580. [Google Scholar] [CrossRef]
  42. Sharpley, A.; Menzel, R. The Impact of Soil and Fertilizer Phosphorus on the Environment. Adv. Agron. 1987, 41, 297–324. [Google Scholar]
  43. Flügel, W. Delineating hydrological response units by geographical information system analyses for regional hydrological modelling using PRMS/MMS in the drainage basin of the River Bröl, Germany. Hydrol. Process. 1995, 9, 423–436. [Google Scholar] [CrossRef]
  44. Moriasi, D.N.; Arnold, J.G.; van Liew, M.W.; Bingner, R.L.; Harmel, R.D.; Veith, T.L. Model evaluation guidelines for systematic quantification of accuracy in watershed simulations. Trans. ASABE 2007, 50, 885–900. [Google Scholar] [CrossRef]
  45. Moriasi, D.N.; Gitau, M.W.; Pai, N.; Daggupati, P. Hydrologic and Water Quality Models: Performance Measures and Evaluation Criteria. Trans. ASABE 2015, 586, 1763–1785. [Google Scholar]
  46. EPA. 2nd Cycle Blackwater (Lough Neagh–Lower Bann) Catchment 2010–2015. Assessment (HA 03); Catchment Science and Management Unit: Dublin, Ireland, 2018; p. 32.
  47. Lemm, J.U.; Venohr, M.; Globevnik, L.; Stefanidis, K.; Panagopoulos, Y.; Gils, J.; Posthuma, L.; Kristensen, P.; Feld, C.K.; Mahnkopf, J.; et al. Multiple stressors determine river ecological status at the European scale: Towards an integrated understanding of river status deterioration. Glob. Change Biol. 2021, 27, 1962–1975. [Google Scholar] [CrossRef]
  48. Mellander, P.-E.; Jordan, P. Charting a perfect storm of water quality pressures. Sci. Total Environ. 2021, 787, 147576. [Google Scholar] [CrossRef]
Figure 2. Schematic diagram of DynamicCRAFT soil model. Where: QSR, QSS, and QGW are modeled CRAFT flows in each flow pathway (Surface Runoff (SR), Fast-subsurface (SS), slow groundwater (GW)); “SR ATTN. STORE” refers to the surface runoff attenuation store. “FAST SS MIXING STORE” refers to the fast-subsurface runoff mixing store; abbreviations “P(TOP)” and “P(SOIL)” refer to storages of phosphorus in topsoil and deeper soil and these processes and stores are described in detail in the Supplementary Materials S1.1.; “PL = Phosphorus Load; PC = Phosphorus Concentration.
Hydrology 10 00184 g002
Figure 3. Map of the Blackwater Catchment indicating WFD sub-catchments and required load reductions (using EPA’s classification scheme) “WQ” = Water Quality. Labels in black refer to the sub-catchment IDs.
Hydrology 10 00184 g003
Figure 4. Scatter plots of Observed (Obs) vs. Modeled (Mod) Runoff and Load (L) for 3 sets of simulations: top row OCM, middle row OCM-both single catchments; bottom row DCM embedded in MultiCRAFT.
Hydrology 10 00184 g004
Figure 5. Time series results of concentrations: CSRP = SRP, CTP = TP, suffixes (obs) = observed, (mod) = modeled; Observed Q(obs) and modeled Q(mod) discharge (shown in the (top pane) only), on right–hand y-axis (cms = m3s1) (OCM (top pane), DCM (bottom pane)).
Hydrology 10 00184 g005
Figure 6. Results from Individual and combined scenarios evaluated on the BWMB catchment using DCM: (a) Concentrations; (b) Loads. Abbreviations (e.g., “1A” etc.) refer to the scenarios listed in Table 3.
Hydrology 10 00184 g006
Figure 7. Plots of Concentration–Duration for SRP under “base” (Baseline) and “scenario” (scenario C2) for (L) Oona catchment (R) BWMB catchment. The green horizontal line “Threshold” indicates the upper limit for SRP to meet “Good” WFD status.
Hydrology 10 00184 g007
Figure 8. Simple Method estimates (“SM”) and Scenario C2 Modeled LRs: NI (1–35) and ROI sub-catchments (IDs 36–54).
Hydrology 10 00184 g008
Table 1. Catchment Characteristics (source CEH NRFA data and NIEA (SRP Conc.)).
Catchment
(and Abbreviated Form)
NRFA ID 1Gauged Area (km2)% Area (Grassland)% Area (Non-Agricultural)Mean Annual Rainfall (mm)Mean Annual Runoff (mm)Measured SRP Conc.
(2014–2019)
(mg P L−1)
Blackwater@Derrymeen Br (BWDM)203022182.975.922.31142826.40.056
Blackwater@Maydown Br
(BWMB)
203010970.183.610.91008584.80.068
Oona (OOSM)20304394.192.64.310035960.10
Callan (CALL)203025166.982.37.69334030.136
1 NRFA = National River Flow Archive. Refer to Figure 1 for the location of the gauging stations.
Table 2. Model Results from OCM (OriginalCRAFT), DCM (DynamicCRAFT), and MultiCRAFT, for Q (Discharge); C(oncentrations) of SRP and TP, at the locations indicated in Table 1 (e.g., “CALL” = Callan catchment). The metrics used to assess performance are described in the Methods: NSE = Nash-Sutcliffe Efficiency, NRMSE = Normalized root-mean-square error, PBIAS = Percentage Bias. The “Phase” was either Cal(ibration) or Val(idation). Please note that “BWMB” refers to Maydown Bridge and “BWVB” to Verners Bridge for the sites used to evaluate model performance with respect to discharge and nutrients, respectively, in the larger Blackwater catchment. All values are dimensionless.
CatchmentStep 1QSRP (C)
PhaseNSEPBIASNRMSEPBIAS
BWDMCal7612.51.40−9.4
Val749.71.7716.0
BWMB/BWVBCal88−7.51.65−7.69
Val87−4.71.36−2.9
CALLCal783.21.648.39
Val78−0.82.20−9.2
OOSMCal75−13.31.39−3.6
Val71−11.11.1412.2
Catchment: BWMB (Q), BWVB (P)Steps 2, 3, 5QSRP (C)TP (C)
VariantPhaseNSEPBIASNRMSEPBIASNRMSEPBIAS
OCMCal87−4.71.66−7.881.95−13.2
Val88−7.51.375.51.6310.4
DCMCal87−4.71.56−11.381.79−18.91
Val88−7.51.517.71.75−5.47
MultiCRAFT + DCMCal82−0.41.44−8.11.54−4.89
Val85−0.11.355.41.498.8
Table 4. Summary of results from mitigation simulations evaluated at different points in the Blackwater catchment under Scenarios C1 and C2 (BWBB = Bond’s Bridge).
ScenarioEvaluation PointArea
Mitigated (%)
Load
Reductions (t P Year−1 (%))
Time in “Good” Status
(SRP) (%)
SRPTPBaselineScenario
C1BWMB18−0.4 (−0.4)3.5 (2.10)41.541.6
C2Oona 1513.8 (33.2)7.8 (34.8)40.352.2
C2BWMB2012.4 (14.5)25.1 (15.0)41.545.5
C2BWBB2419.8 (16.5)41.4 (17.2)39.743.6
1 “Oona” in this case refers to a water quality monitoring (Oona Bridge) site in the Oona WFD sub-catchment #18 which is also downstream of the OOSM flow gauging station (Figure 3).
Disclaimer/Publisher’s Note: The statements, opinions and data contained in all publications are solely those of the individual author(s) and contributor(s) and not of MDPI and/or the editor(s). MDPI and/or the editor(s) disclaim responsibility for any injury to people or property resulting from any ideas, methods, instructions or products referred to in the content.

