Article

Potential Impacts of Climate Change on the Al Abila Dam in the Western Desert of Iraq

1
Anbar Technical Institute, Middle Technical University, Baghdad 10074, Iraq
2
Dams and Water Resources Engineering Department, College of Engineering, University of Anbar, Ramadi 31001, Iraq
3
Soil Physics and Land Management Group, Wageningen University, 6700 AA Wageningen, The Netherlands
*
Author to whom correspondence should be addressed.
Hydrology 2023, 10(9), 183; https://doi.org/10.3390/hydrology10090183
Submission received: 30 April 2023 / Revised: 15 June 2023 / Accepted: 12 September 2023 / Published: 14 September 2023

Abstract

:
The potential impacts resulting from climate change will cause significant global problems, particularly in underdeveloped nations where the effects are felt the most. Techniques for harvesting water such as small dams provide an alternative supply of water and are adaptive solutions to deal with water scarcity in the context of future climate change. However, it is difficult to determine how rainwater harvesting (dams) may be impacted by climate change since general circulation models (GCMs), widely utilized for predicting potential future climate change scenarios, work on an extremely large scale. The primary aim of this research was to quantify the effect of climate change on water availability at the catchment scale by statistically downscaling temperature and rainfall from the GCMs. Then, using a water harvesting model, the performance of the Abila Dam in Iraq’s western desert was evaluated in both the current climate (1990–2020) and various future climate change scenarios (2020–2100). Precipitation generally decreases as the annual temperature increases. To simulate future water availability, these changes in meteorological factors were incorporated into the water harvesting model. In total, 15% or less of net storage might fulfil the whole storage capacity during the baseline period, whereas it is 10% in RCP 2.6 in 2011–2040 for future scenarios. In contrast, RCP 8.5 will be able to meet water needs at a pace of 6% in 2011–2040. The findings of this study proved that the Al Abila dam will be unable to supply the necessary water for the area surrounding the Al Abila dam in the future scenarios.

1. Introduction

Water availability is a major issue for arid and semi-arid areas (ASARs) all over the world. Iraq’s western desert faces a serious water shortage due to extremely low annual rainfall, averaging 120 mm, and highly variable rainfall distribution. In recent years, global awareness of climate change has increased significantly, particularly in poor nations that are most severely impacted by its effects. Natural systems, particularly water resources, face short- and long-term threats from climate change. In all scenarios that have been examined, fluctuations in streamflow and timing are expected to receive a detrimental effect on freshwater in several catchments in the mid-to-long term [1]. Under the United Nations Framework Convention on Climate Change, climate change is defined as “a change of climate which is attributed directly or indirectly to human activity that alters the composition of the global atmosphere and which is in addition to natural climate variability observed over comparable time periods” [2]. As stated by the Intergovernmental Panel on Climate Change [3], the mean global temperature is predicted to increase around 0.3 to 0.7 degrees Celsius from 2016 to 2035 and between 2.6 and 4.8 degrees Celsius from 2081 to 2100. The Netherlands Ministry of Foreign Affairs (MoFAN) has predicted that Iraq will experience an increase in mean annual temperature of 2 degrees Celsius, a 9% decrease in rainfall, particularly in winter, and a 22% decrease in the average runoff by the year 2050. MoFAN further stated that climate change will have an influence on protracted drought periods, increased flood occurrences, and increased desertification [4]. To curtail the effects of climate change and meet growing water demands, rainwater harvesting (RWH) systems are being modified by ASAR residents [5]. RWH provides a unique adaptable method to deal with climate change and a water shortage [6]. To make sure that RWH procedures are successfully and sustainably adapted to modulate the impacts of climate change, regional climate variables and scenarios must be determined [7]. To obtain these values, estimate variables of climatic change can be “downscaled” from general circulation model (GCM) results, which entails translating the predictions from large-resolution GCMs to smaller resolutions, whether using dynamic or statistical approaches [8]. Climate change projections for hydrology are connected to climate change estimation methods such as greenhouse emission scenarios, downscaling methods, and GCMs. Using different emission scenarios, GCMs, and downscaling approaches, some of the uncertainties brought on by climate change could be reduced [9,10,11].
During the last several decades, several studies have evaluated the climate change impacts on surface water [12,13]. Although several investigations have concentrated on small watersheds, most have evaluated the climate change influence on dams, RWH performance, water availability, and water budget in large watersheds [14]. Al-Ansari et al. [15] used data from global climatic projections produced by the HadCM3 GCM to assess the applicability of RWH systems in the Sulaimaniyah area of Iraq. Mohammad [16] estimated that the consequences of climate change scenarios A2 and B2 will be a rise in temperature, a dip in rainfall, and a reduction in runoff in the Qarasu basin in Iran. Climate change may modify the hydrological regime, and runoff in the 21st century will probably vary dramatically due to changed precipitation patterns and increasing temperatures. The simulation also revealed how hydrological conditions in regions with low and moderate latitudes will be affected by climate change.
Adamo et al. [17] used GCMs in the SWAT model to examine how the Tigris River might respond to three future climate change scenarios, A2, A1B, and B1. They concluded that rainfall would decline in all five branches of the Tigris River Basin, implying that a reduction in surface and groundwater due to temperature increases and a decline in precipitation would occur.
Using the SWAT model, which is based on the medium emission scenario (A1B) and five climate projection models, Hilo et al. studied [18] the effect of climate change on streamflow at the Dokan Dam in the north of Iraq until the year 2050. A monthly time step was used to calibrate and validate meteorological input data from SWAT that was acquired using a Climatic Forecasting System Reanalysis (CFSR) during the years of 1980 and 2013. The estimated streamflow until 2050 showed a considerable drop in waterflow. Also, the study revealed that 65% of the total simulated runoff originated from the Iranian portion of the Dokan Dam Watershed. To address the anticipated water scarcity, it is strongly advised to increase the water consumption efficiency for both present and potential water projects [18].
Visweshwaran [19] examined the effects of climate change on the Indian Bharathapuzha River Basin (BRB). Five downscaled GCMs were employed to comprehend the climate change impacts on the hydrological variables in the BRB. These GCMs were developed for two representative concentration pathway (RCP) scenarios, 4.5 for the normal condition and 8.5 indicating the worst-case scenario for predicted carbon and greenhouse gas concentrations in the lower atmosphere. In this work, researchers used the SWAT hydrological model to obtain a continuous simulation of hydrological data. The outcomes indicated that evapotranspiration and soil moisture will increase in modest to large amounts in the coming years and rainfall patterns will change.
In the Iranian Shazand plain, Soltani et al. [20] evaluated the climate change impacts on groundwater and surface water as well as their interactions. They applied the integrated hydrological model MODFLOW-OWHM to forecast future climate data and used the HEC-HMS model to forecast future river discharge. According to the findings, river discharges might be reduced due to future climatic circumstances and the average groundwater level may be much lower in 2060. The outcomes of this research demonstrated climate change’s anticipated negative effects on the region’s water supplies and highlighted the necessity of sustainable management to reduce these potential negative consequences.
The efficiency of RWH in ASARs has not been improved by incorporating adaptive techniques in climatic and hydrological models [2]. Therefore, it is vital to evaluate the effectiveness of rainwater harvesting systems utilizing the limited water available. More research is essential to see whether RWH constructions could be modified to better suit future conditions. To evaluate the effectiveness of current RWH procedures and enhance the RWH’s structure design, a new tool was created [21].
The main objective of this study was to quantify the effect of climate change on water availability at the catchment scale by statistically downscaling temperature and rainfall from the GCMs. Then, using a water harvesting model, the performance of the Abila Dam in Iraq’s western desert was evaluated in both the current climate (1990–2020) and various future climate change scenarios (2020–2100).

2. Materials and Methods

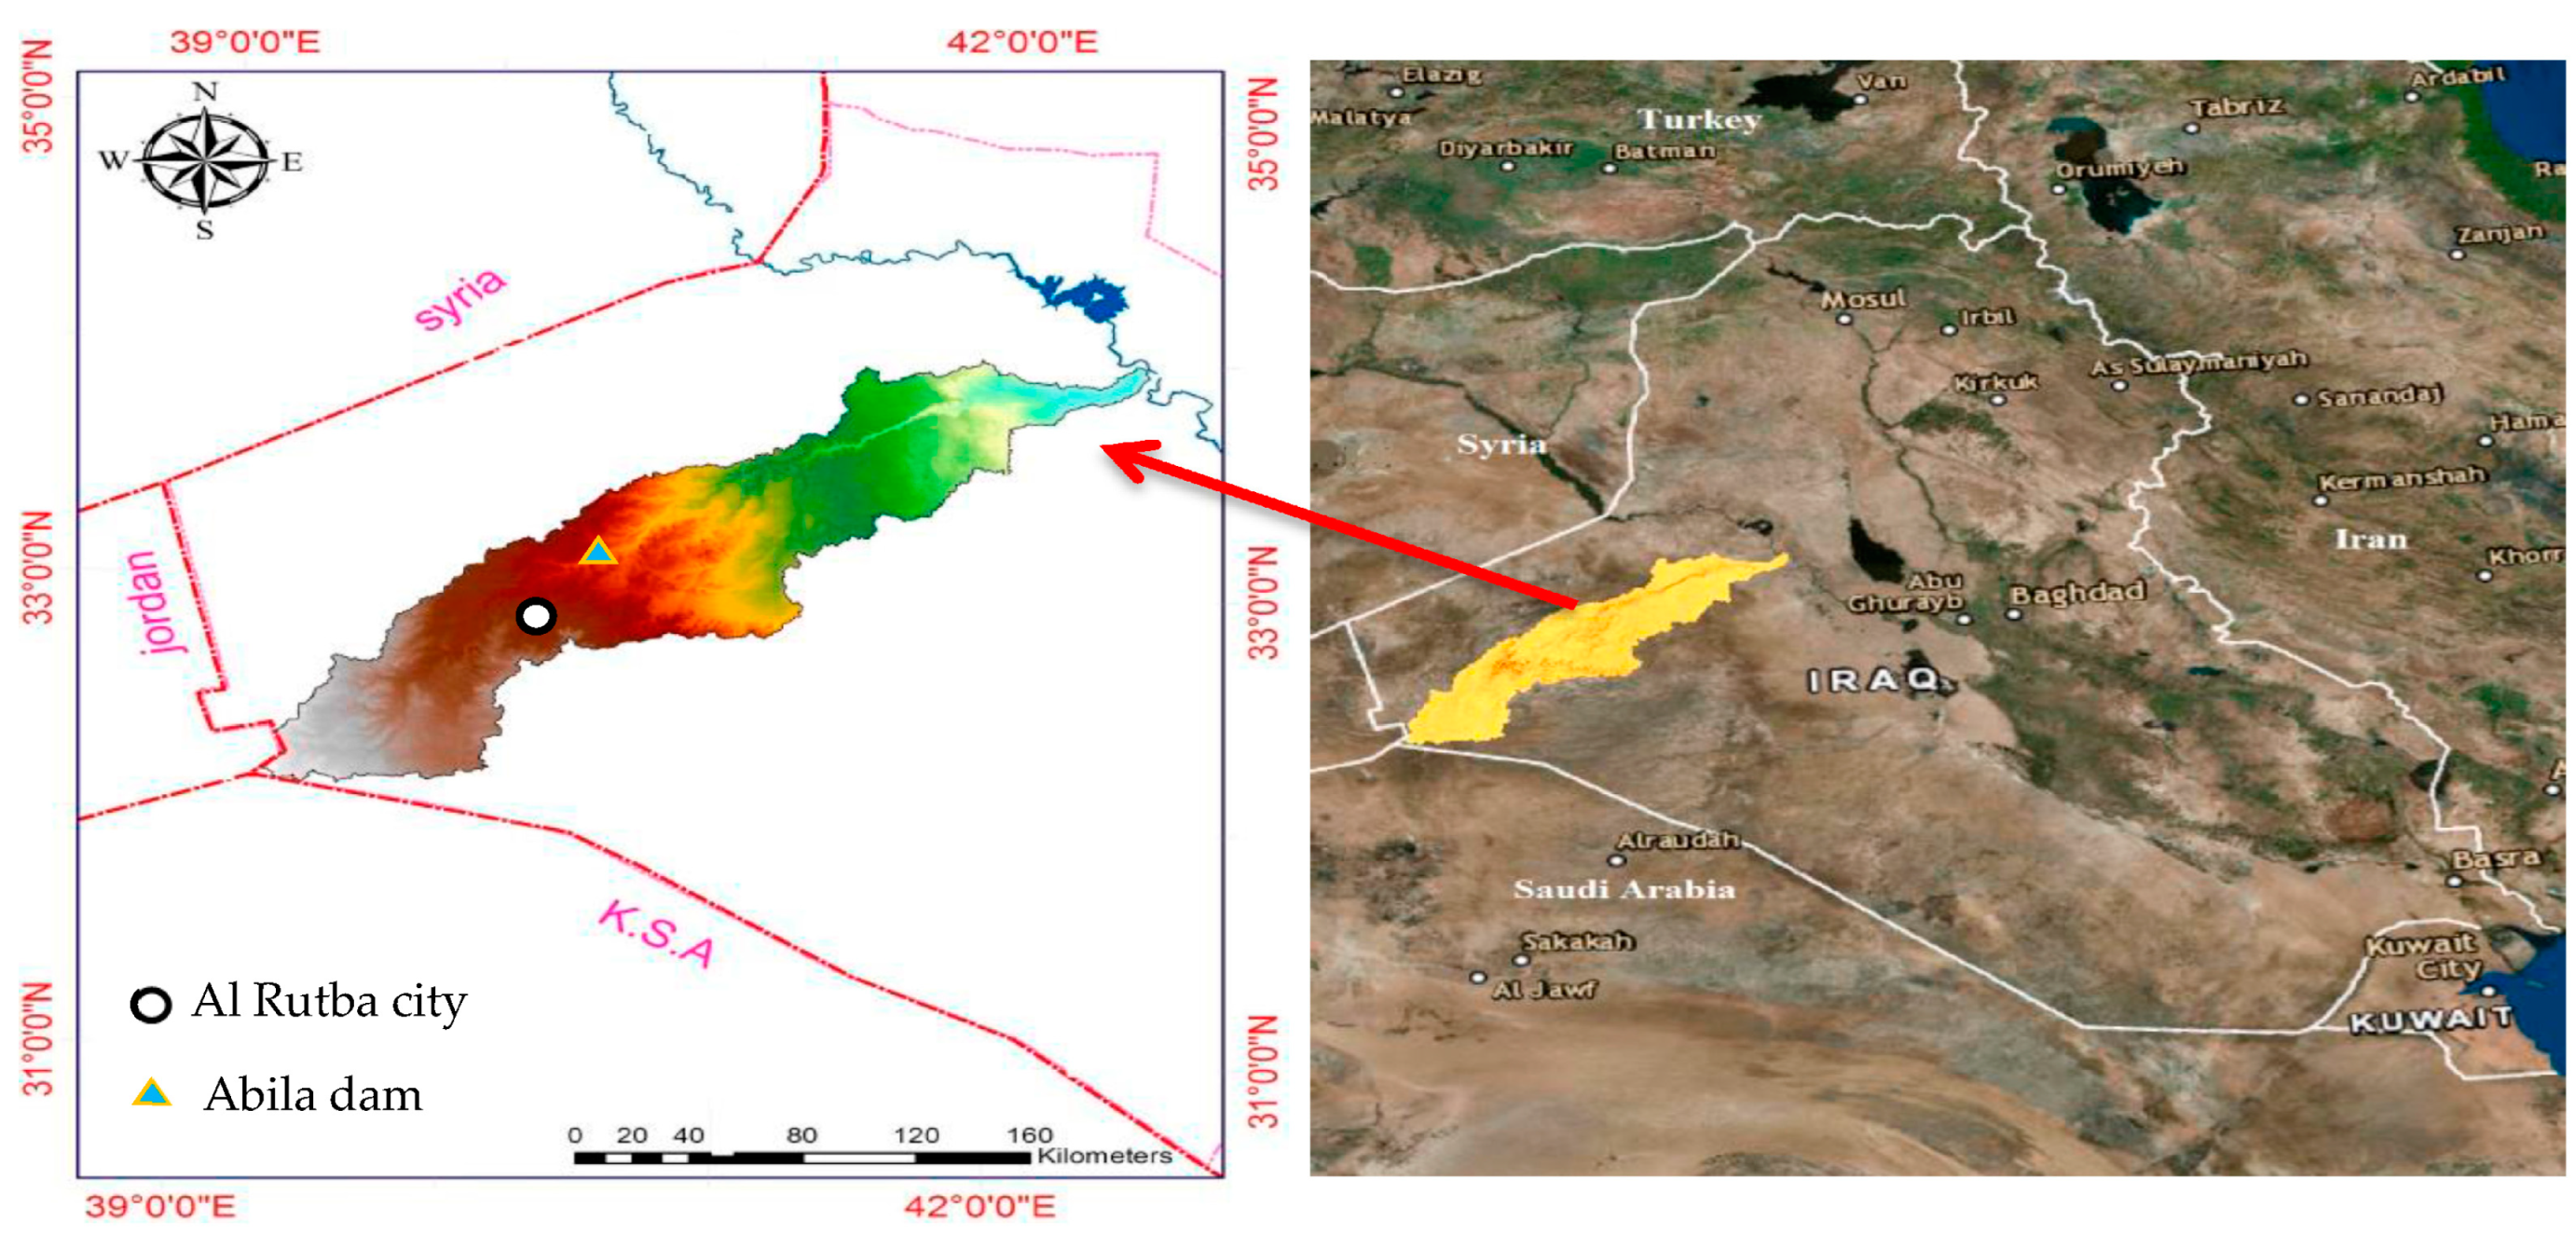
2.1. Study Area and Data Used

Wadi Horan is a significant valley situated in the Iraqi’s western desert with a catchment area that is 13,107.83 square kilometers. It originates at the Iraqi–Saudi border and flows northeast before going crossing Al Rutba city and ending close to Euphrates River near the city of Al Baghdadi south of Haditha [22]. The Al Abila dam is one of the four existing dams on the Wadi Horan and it is situated 15 kilometers north of the city of Rutba as shown in Figure 1. Winter and spring are typically the wet seasons, whereas summer is the dry season.
The mean yearly precipitation in the research area is around 120 mm, with around 50% of the total rain falling in the winter months, 15% in autumn, and 35% in spring. A temperature of 21 °C is the annual mean temperature. Dry conditions and high temperatures lead to a high probable evaporation rate of roughly 3000 mm per year. There are vast differences in temperatures throughout the year; the hottest month is July, while the coldest month is January [23].
For our investigation, two different sorts of data were needed. The first kind were employed in downscaling and climate change modeling. Data on daily precipitation, the highest and lowest temperatures, and their ranges were gathered from the Al Rutbah meteorological stations. By reanalyzing the data from the National Centers for Environmental Prediction (NCEP) and the National Center for Atmospheric Research (NCAR), daily data for large-scale predictor variables characterizing contemporary climatic conditions (1961–2005) were obtained. The Canadian Climate Data and Scenarios website (http://ccds-dscc.ec.gc.ca (accessed on 1 March 2023) was used to obtain the NCEP data.
The input data for the water harvesting model (WHCatch) made up the second category of data [5]. The Al Abila dam’s physical properties were measured to obtain these statistics. In each sub-catchment, soil texture was collected using sample collection, and the region’s slope was calculated using a DEM and a GIS. A double ring infiltrometer was used to assess infiltration rates in the field, and runoff coefficients from earlier research were applied.

2.2. Methodology Overview

The following methods were used to evaluate how climate change may affect the effectiveness of RWH techniques:
  • Using GCMs to evaluate climate variables on a large scale.
  • Applying GCMs to downscale the climatic variables to local scales.
  • Simulating the influence of climate change on the Al Abila dam utilizing the WHCatch model.

2.2.1. Climate Variable Simulation and GCMs

Beginning in 2011, the Coupled Model Intercomparison Project’s fifth phase (CMIP5) began publishing GCM climate change data [2]. The atmosphere, sea ice, earth surface, and oceans are all represented using numerically coupled models known as GCMs. Typically, GCMs are used to estimate future climatic conditions brought on with forcing from aerosols and greenhouse gases and to simulate the current climate [24]. The GCMs were initially created in 1956 to mimic synoptic-scale air circulation patterns, but since then, various GCMs have been developed and enhanced for weather prediction, climatology, and the identification of impending climatic changes [25]. The Canadian Earth System Model, second-generation (CanESM2) was the only model we utilized in the current study. CanESM2 has been widely utilized in numerous locations. CanESM2 was created by the Canadian Centre for Climate Modelling and Analysis (CCCma). Only the CanESM2 model produces daily predictor variables that may be utilized directly in the statistical downscaling model (SDSM). Also, this model was used in the earlier study [2] and is consistent with the SDSM model. Essentially as an addition to the IPCC’s Fifth Assessment Report (AR5), CanESM2 was created for CMIP5 [26]. During the same time (1961–2005), along with the large-scale atmospheric data from CanESM2, CCCma also provided the NCEP/NCAR predictor variables. The website of the Canadian Climate Data (http://ccds-dscc.ec.gc.ca (accessed on 1 March 2023)) was utilized to retrieve the CanESM2 and NCEP/NCAR data. The three representative concentration pathways (RCPs), 2.6, 4.5, and 8.5, which were analyses, were imported as CanESM2 outcomes. These hypothetical scenarios were created and employed to prepare AR5. Climate scenarios are pictures of the future or the possible future that describe likely future climatic conditions [27]. Climate scenarios are now a crucial component of studying climate change and outline conceivable future climate pathways. The WHCatch model was utilized to assess the effects of climate change on the Al Abila dam for the three scenarios RCP 2.6, 4.5, and 8.5 using daily rainfall, max. temperature, and min. temperature values obtained from CanESM2.

2.2.2. Downscaling Methods

GCMs lack critical sub-grid-scale characteristics like topography and land use because of their coarse resolution [28]. GCMs were not created to analyze the climate change impacts at the local level or to produce precise projections of how hydrological systems will respond to these changes [24]. Therefore, to analyze how climate change is affecting sub-grid scales, a hydrological model is required. The strategies used to convert GCM results to the regional meteorological variables required for accurate hydrological modeling are known as “downscaling” procedures [24]. The statistical method applied in this work demonstrates practical correlations relating local-scale predictands and global predictors. Statistical downscaling was used to modify scenarios for particular geographies, scales, and issues while being computationally less expensive and less technically challenging than dynamic models [27].

Using the Statistical Downscaling Model (SDSM 4.2)

The statistical downscaling model (SDSM) is frequently used in climate change investigations [2,16,29]. A decision support method for statistical downscaling was created by Wilby et al. in 2000 to evaluate the effects of regional climate change. The co-public/SDSM website was utilized to download this model. The SDSM model is divided into four basic components: identifying the predictors/predictands, calibrating, generating weather, and creating a future climatic variable. In the prior article [2], specifics regarding these four components, variables, and the primary SDSM values that were used were discussed.

Predictor Variable Selection

In the process of developing statistical downscaling, choosing the right predictor variables is an essential issue. In SDSM, the screening option helps in selecting the right predictor variables for downscaling. To determine the proportion of variation explained with each predictand–predictor combination, the predictors of the reconstructed NCEP/NCAR (1961–2005) data were used. The final group of predictor variables were chosen, and each one was picked because it had the best correlation (r) and lowest significance level (p) value for each of the predictands (Table 1). The p-variable had a value of 0.00 for each combination of predictor and predictand.
The air temperature two meters above the ground is the most significant predictor of maximum and minimum temperatures (Table 1). Total precipitation served as the primary indicator of precipitation. The reason they were chosen, even though certain predictor variables (p1zhgl) had a weak relationship with precipitation (r = 0.185), was because groupings of one or more may indicate the conditional process for rainfall. It was easier to select the predictors for minimum and maximum temperature since rainfall is a conditioning procedure.

2.2.3. Water Harvesting Model (WHCatch)

A watershed’s runoff volume can be calculated using mathematical formulas called “hydrological models” based on the amount of rainfall the watershed has received. To assess the effectiveness of the Al Abila dam based on the present and projected climate variables, we used the water harvesting model (WHCatch), which was created and applied in [2,21].
The volume fluctuation in water storage was calculated using the variations in input and output flow amounts. Therefore, the water-balance model could be expressed as follows [30]:
S = I Q
where S represents the change of storage during a predetermined period, I represents the inflow, and Q is the outflow, all expressed in m3.
S = Q r u n o f f   + Q r a i n f a l l + Q i n Q o u t Q l o s s
where Qrunoff is the runoff volume from the catchment area, Qrainfall is the rainfall in the dam reservoir, Qin is the upstream inflow volume, Qout is the reservoir overflow volume, and Qloss is the infiltration losses and evapotranspiration. More details for each parameter can be found in the earlier study [2].

3. Results and Discussion

3.1. Statistical Downscaling

SDSM 4.2 was used to analyze the effect of zonal climate change. The predictor variables were chosen, the SDSM was calibrated and validated, and a set of potential climatic variables was produced.

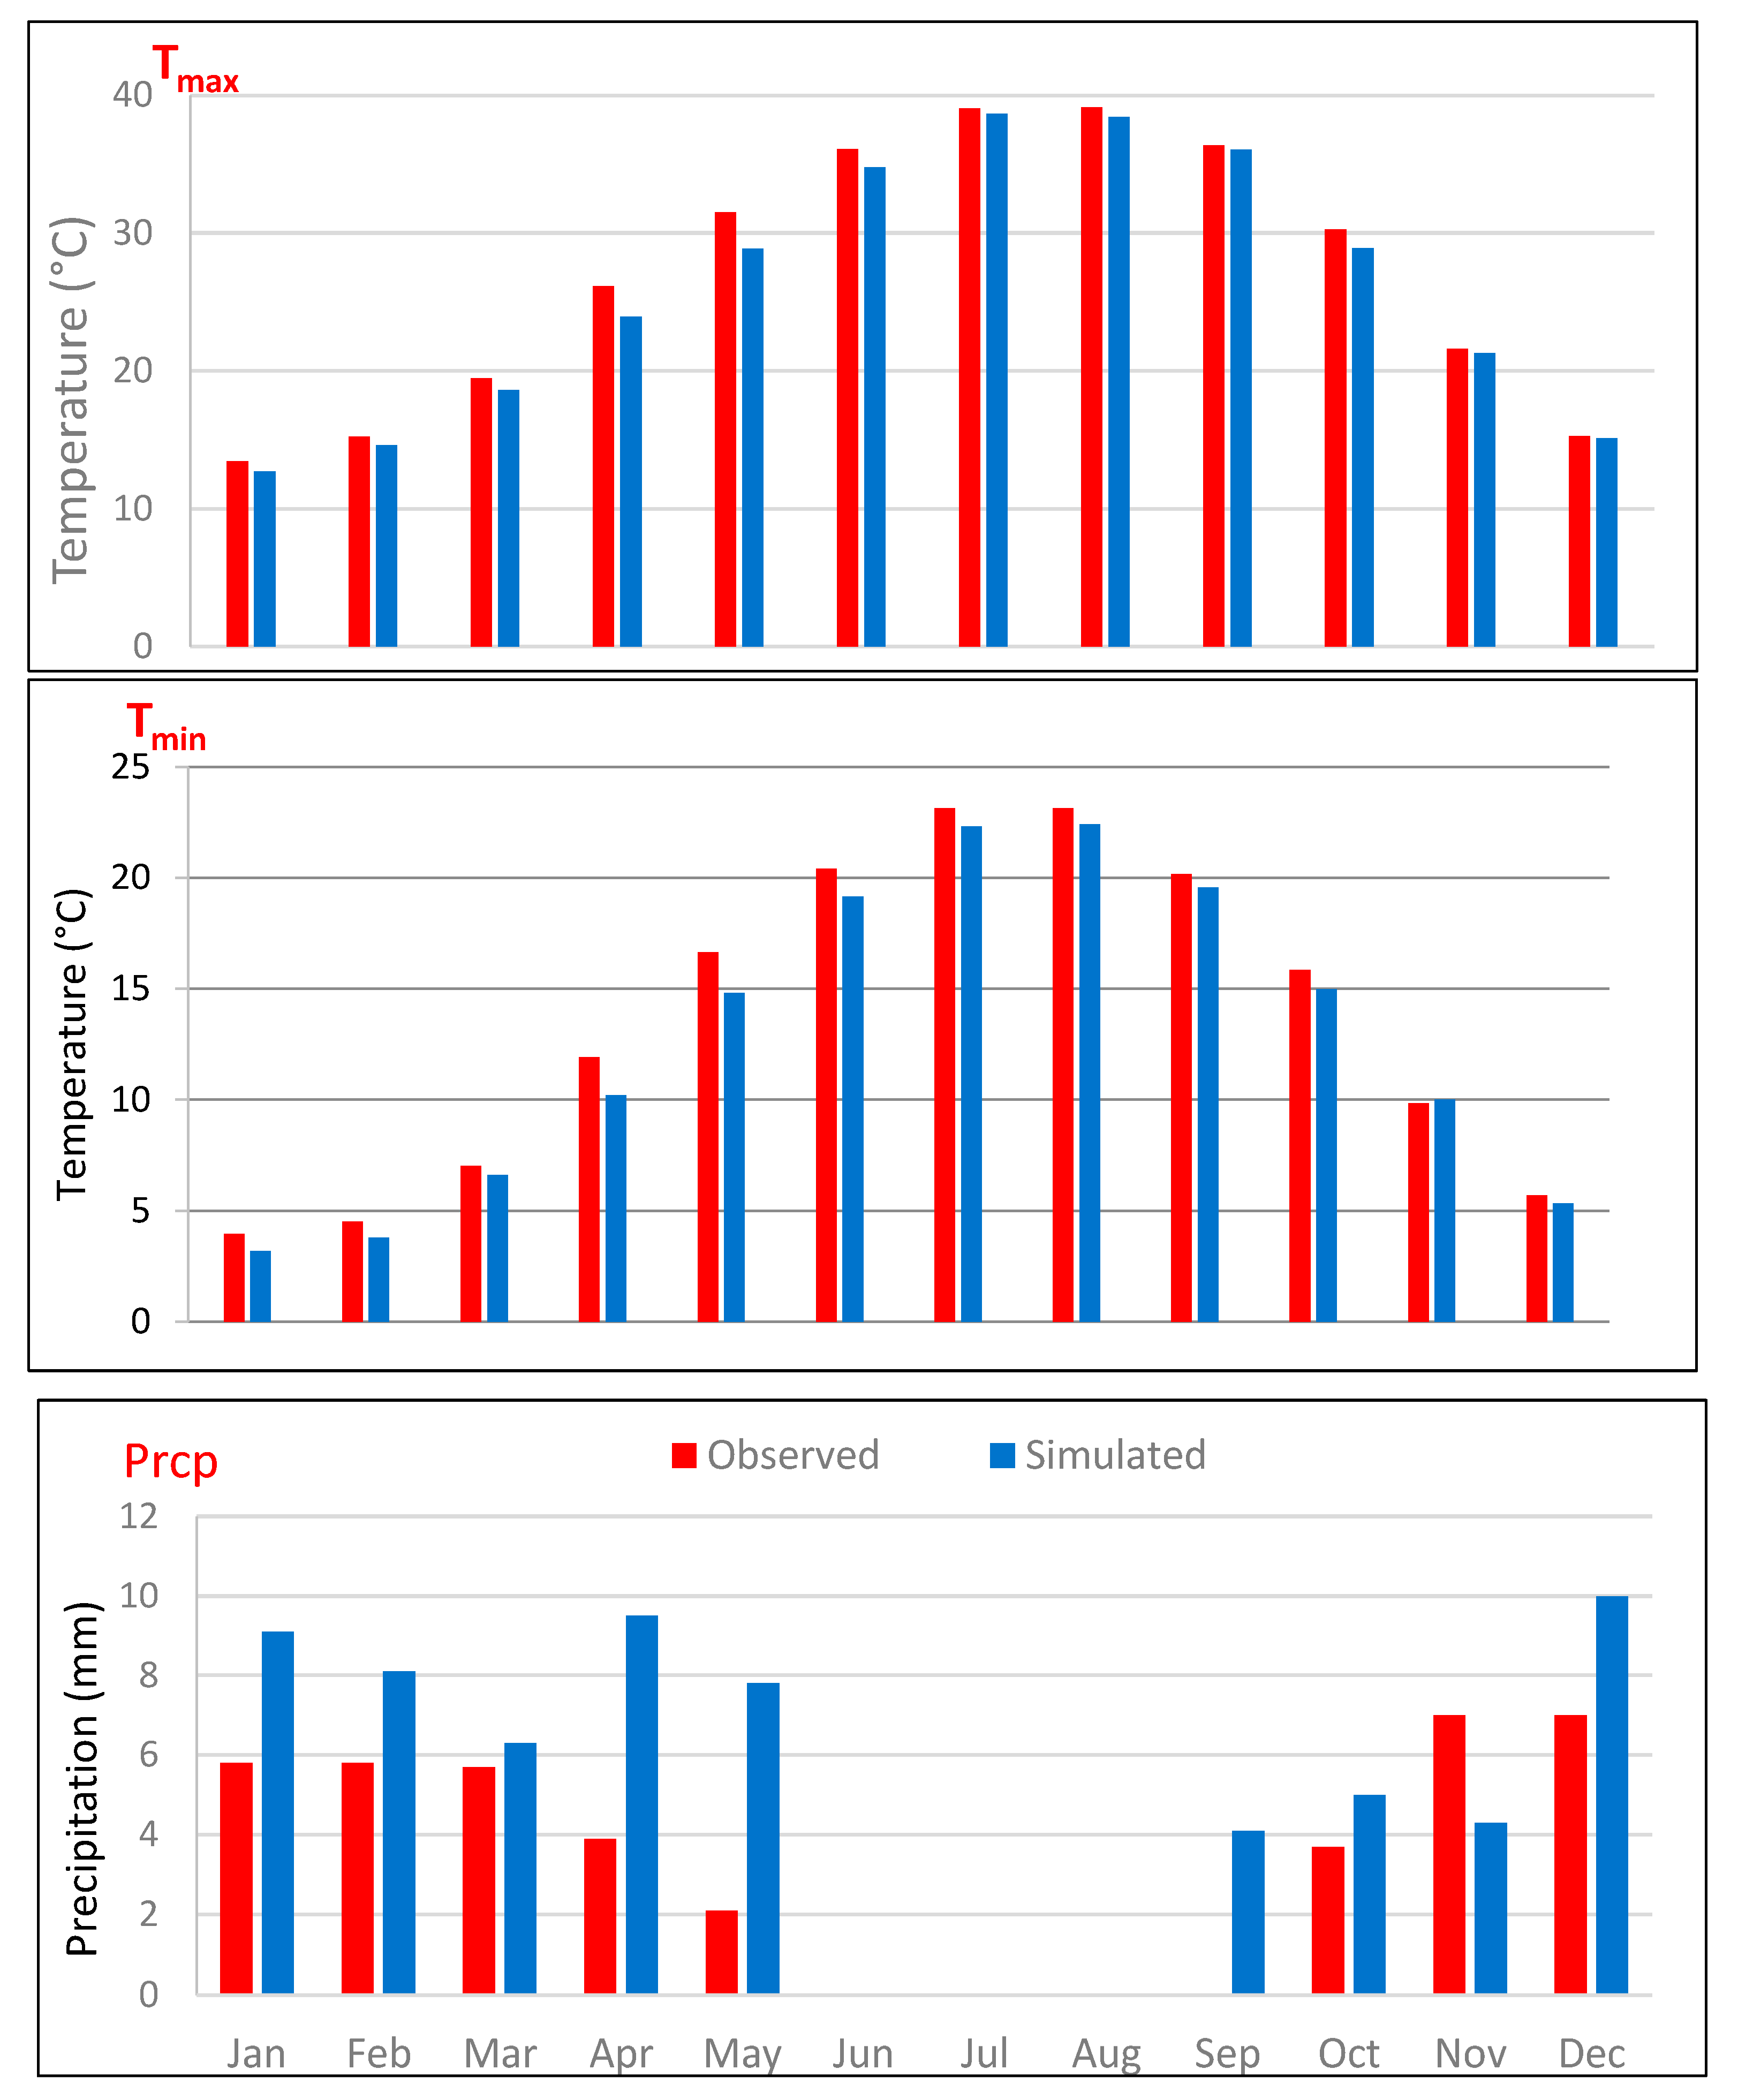
3.1.1. Performance of SDSM

SDSM performance was assessed by downscaling the rainfall and temperature of the research region. The calibration module of the SDSM (1961–1990) was used to automatically assess the performance of the SDSM using R2 over the first 30 years. The R2 values for maximum and minimum temperature (Tmax and Tmin) and precipitation (Prcp) were 0.99, 0.98, and 0.60, respectively. These findings showed that the SDSM functioned moderately for precipitation, which was more complicated than temperature, and functioned effectively for downscaling maximum and minimum temperatures. The conditional process of the rainfall makes downscaling rainfall more difficult.
Validation was performed using the weather-generator module of the SDSM. Following that, a frequency analysis for 1991–2005 was employed to contrast the collected data and the outcomes of the climate simulation (Figure 2).
The outputs of observed and simulated maximum and minimum temperatures were quite close and demonstrated a strong link between the monthly mean Tmax, Tmin, and Prcp. For Tmax, Tmin, and precipitation, the R2 values were 0.99, 0.98, and 0.75, respectively. According to these findings, SDSM performed poorly for the calibration of precipitation, and performed well for validation, possibly as a result of missing rainfall data (observed), which had a detrimental impact on the SDSM’s performance. Overall, there was a reasonable level of consistency amongst the simulated and observed monthly maximum and minimum temperature and precipitation.

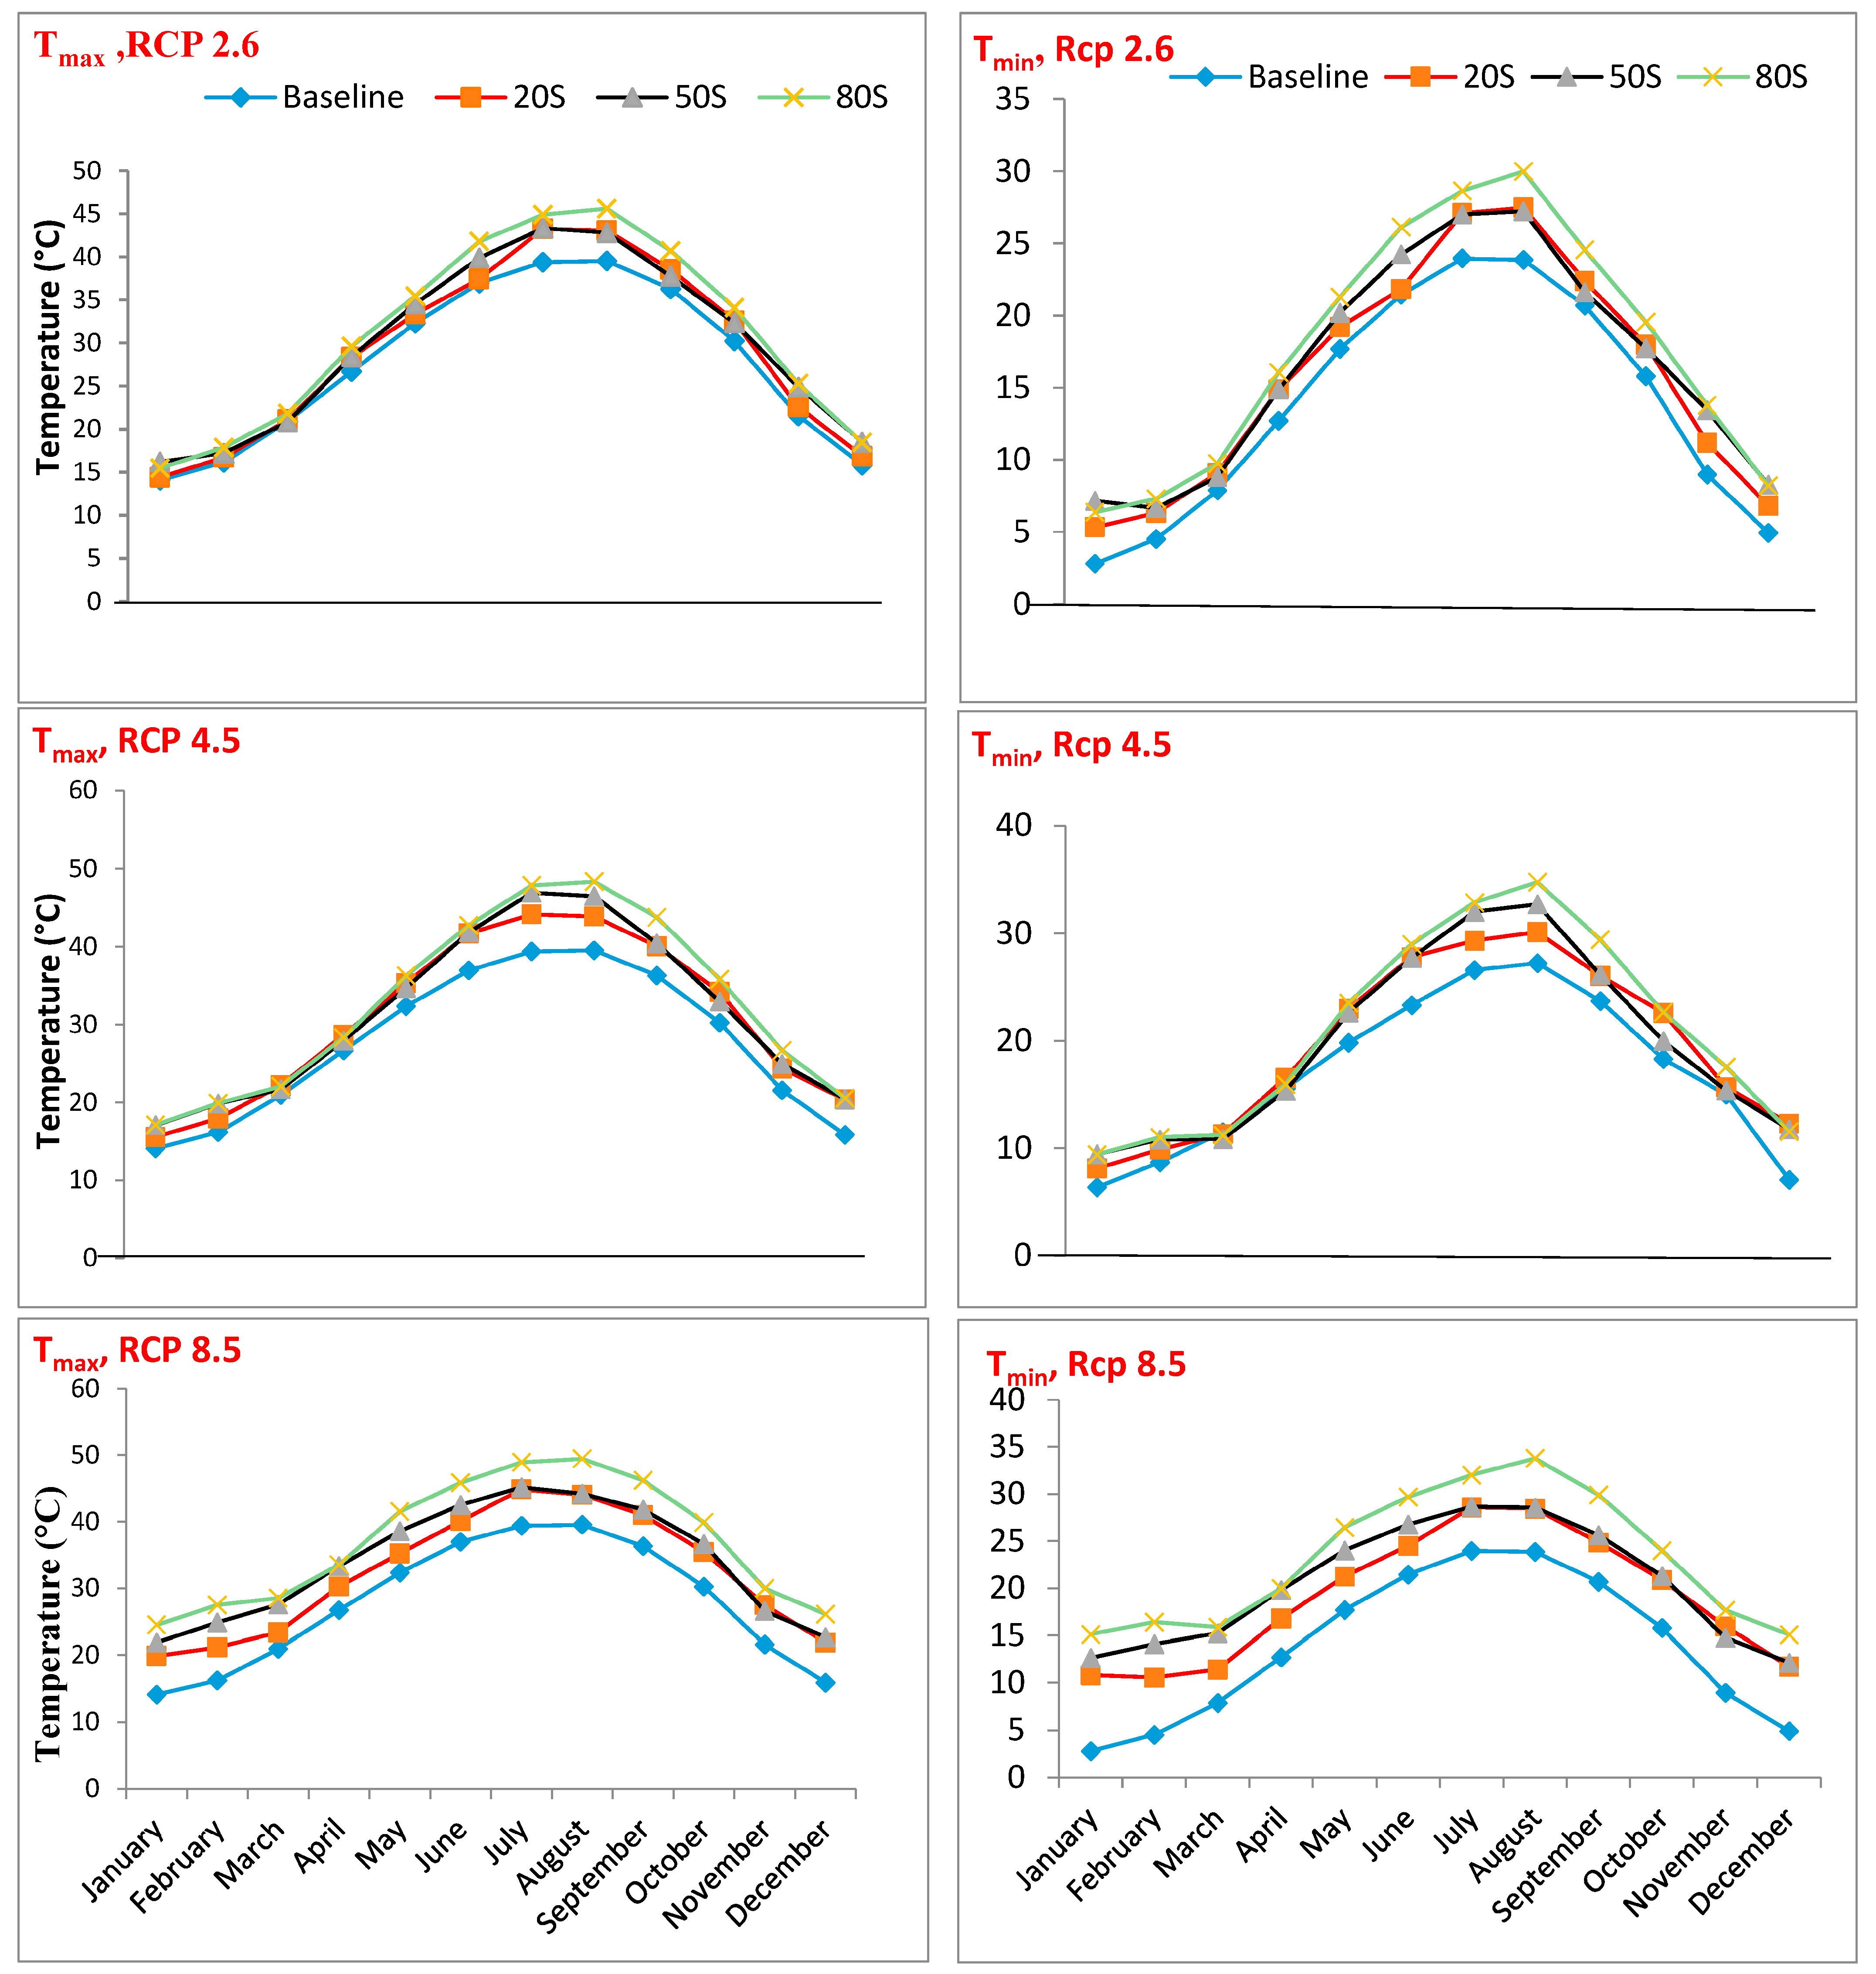
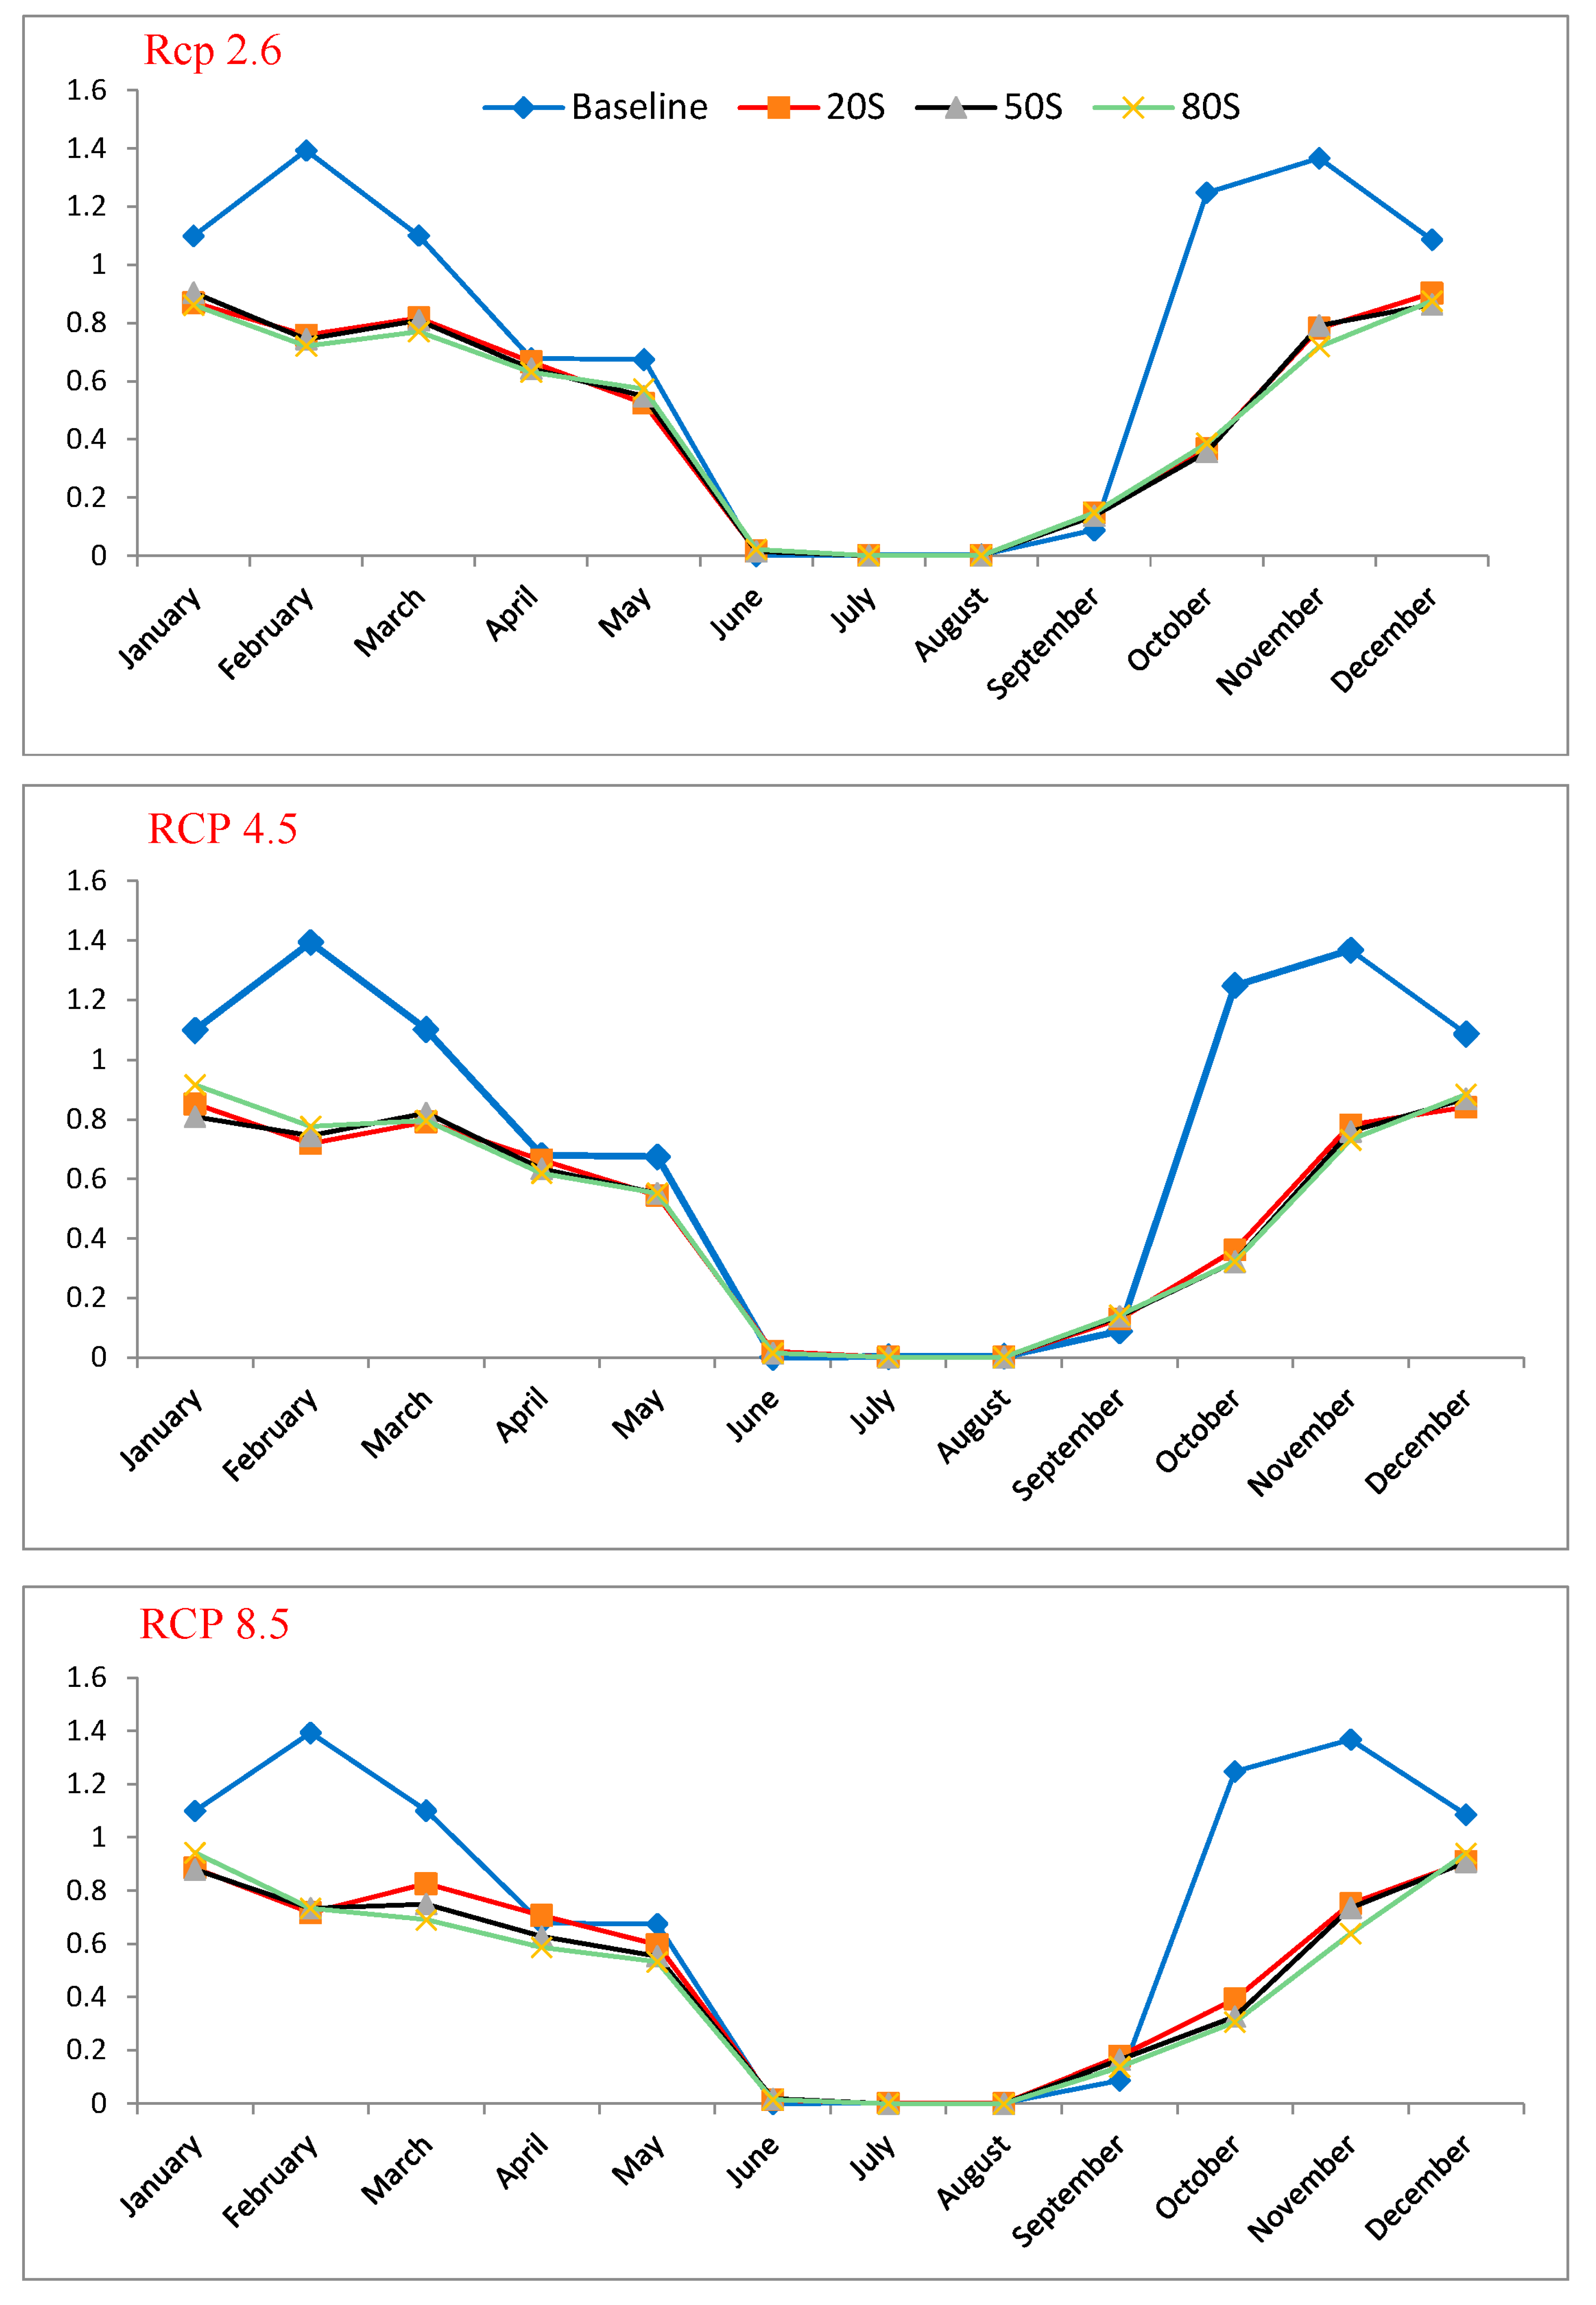
3.1.2. Temperature and Precipitation Projection

Following validation, the future climate change scenario that the GCM predicted was downscaled using the SDSM 4.2. Predictors for this study’s usage were supplied with CanESM2’s output, as previously mentioned. The variables of the future for three RCPs, 2.6, 4.5, and 8.5, were calculated using the average of 20 ensembles for every 30-year period, i.e., the 2020s (2011–2040), 2050s (2041–2070), and 2080s (2071–2100). The baseline data (1990–2020) were compared to the projected values. In all future periods and for three scenarios, the downscaled Tmax and Tmin clearly showed an increase in the average monthly temperature (Figure 3).
According to the RCP 2.6 scenario, the mean maximum temperature increased by 1.5 °C during the 2020s period (from 2011 to 2040), by 2.2 °C during the 2050s period (from 2041 to 2070), and by 3.4 °C during the 2080s period (from 2071 to 2100). The months of July and August reported the greatest temperature readings during this period, which were higher than all other months of the year. In the scenario RCP 4.5, there was a rise in the yearly average temperature in each of the three time periods, with the 2080s showing the largest increase of 4.9 °C. Under the scenario RCP 8.5, we saw the scenario’s highest temperature increase, averaging 4.5 °C throughout the 2020s period. It progressively increased, reaching 6.3 °C for the 2050s until it peaked in the 2080s. Even though the rate of increase was 9.3 °C, RCP 2.6 was generally expected to have the lowest emission owing to mitigating measures, whereas RCP 4.5 and RCP 8.5 forecasted higher greenhouse gas emissions. The yearly averages for Tmax, Tmin, and precipitation for each of the three scenarios during each of the three time periods are shown in Table 2 (the 2020s, 2050s, and 2080s).
The maximum and minimum temperatures tended to increase across all future scenarios (RCPs) and all periods. Precipitation, however, tended to decrease.
The annual mean minimum temperature will rise in the coming years as well, with the increase occurring gradually throughout the three scenarios and future periods. In the scenario RCP 2.6, for example, the increase reached 2.02 °C in the 2020s and the temperature started to rise after that to 2.7 °C in the 2050s. The greatest average temperature for the following years was recorded in July and August when it reached 3.9 °C during the 2080s period as shown in Table 2 and Figure 3. Also, the RCP 4.5 scenario showed an increase in intermediate future temperatures of 3.7 °C during the 2020s. The 2050s period had a rise of 4.1 °C, while the 2080s period saw the largest increase of 5.2 °C. The greatest temperatures were recorded for July and August. The predicted annual average temperatures increased under the RCP 8.5 scenario, with increases of 5.04 °C, 6.5 °C, and 9.2 °C during the 2020s, 2050s, and 2080s time periods, respectively, particularly in August and September.
According to rainfall predictions, the average annual precipitation will drop for each of the three scenarios and each of the three time periods, as illustrated in Figure 4 and Table 2.
With an RCP of 8.5, the average daily precipitation dropped annually by around 27.2% in the 2080s, 29% in the 2050s, and 32% in the 2020s. The amount of precipitation varied every month. Rainfall drops by 29.2% in the 2080s period and by 28% in the 2050s period under the RCP 4.5 scenario. The maximum rainfall was observed for all three periods and situations from March to November.

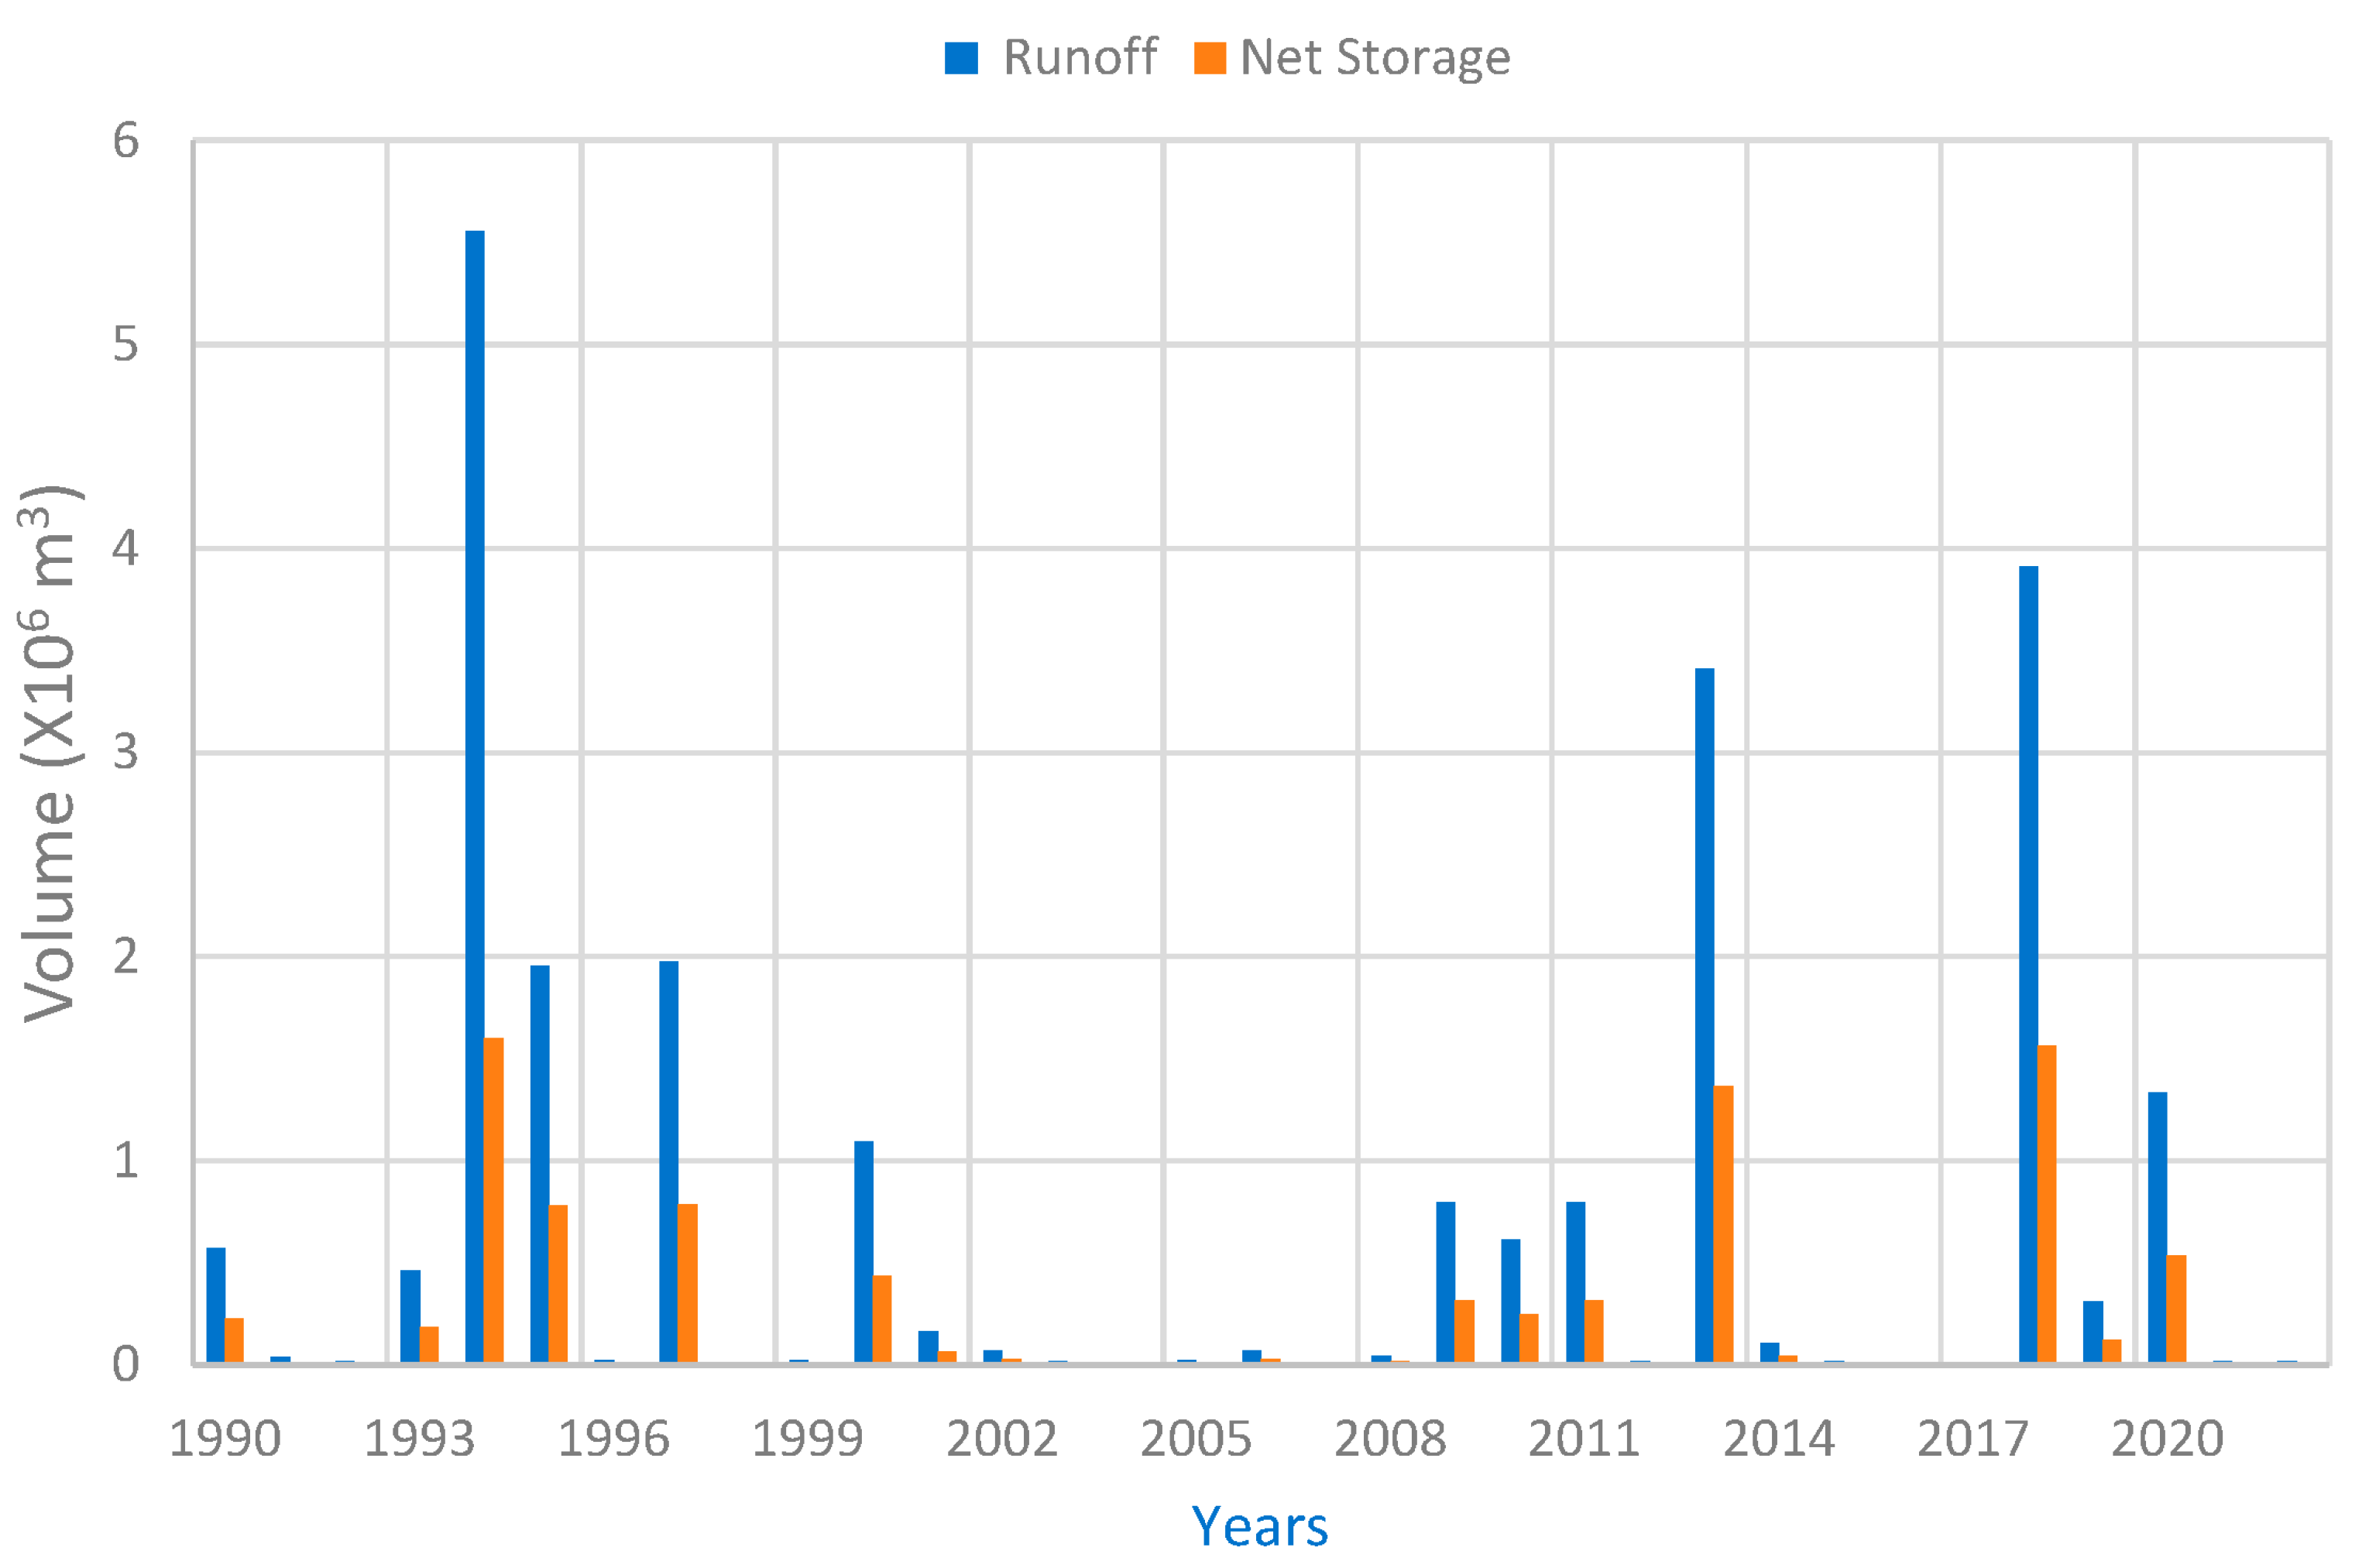
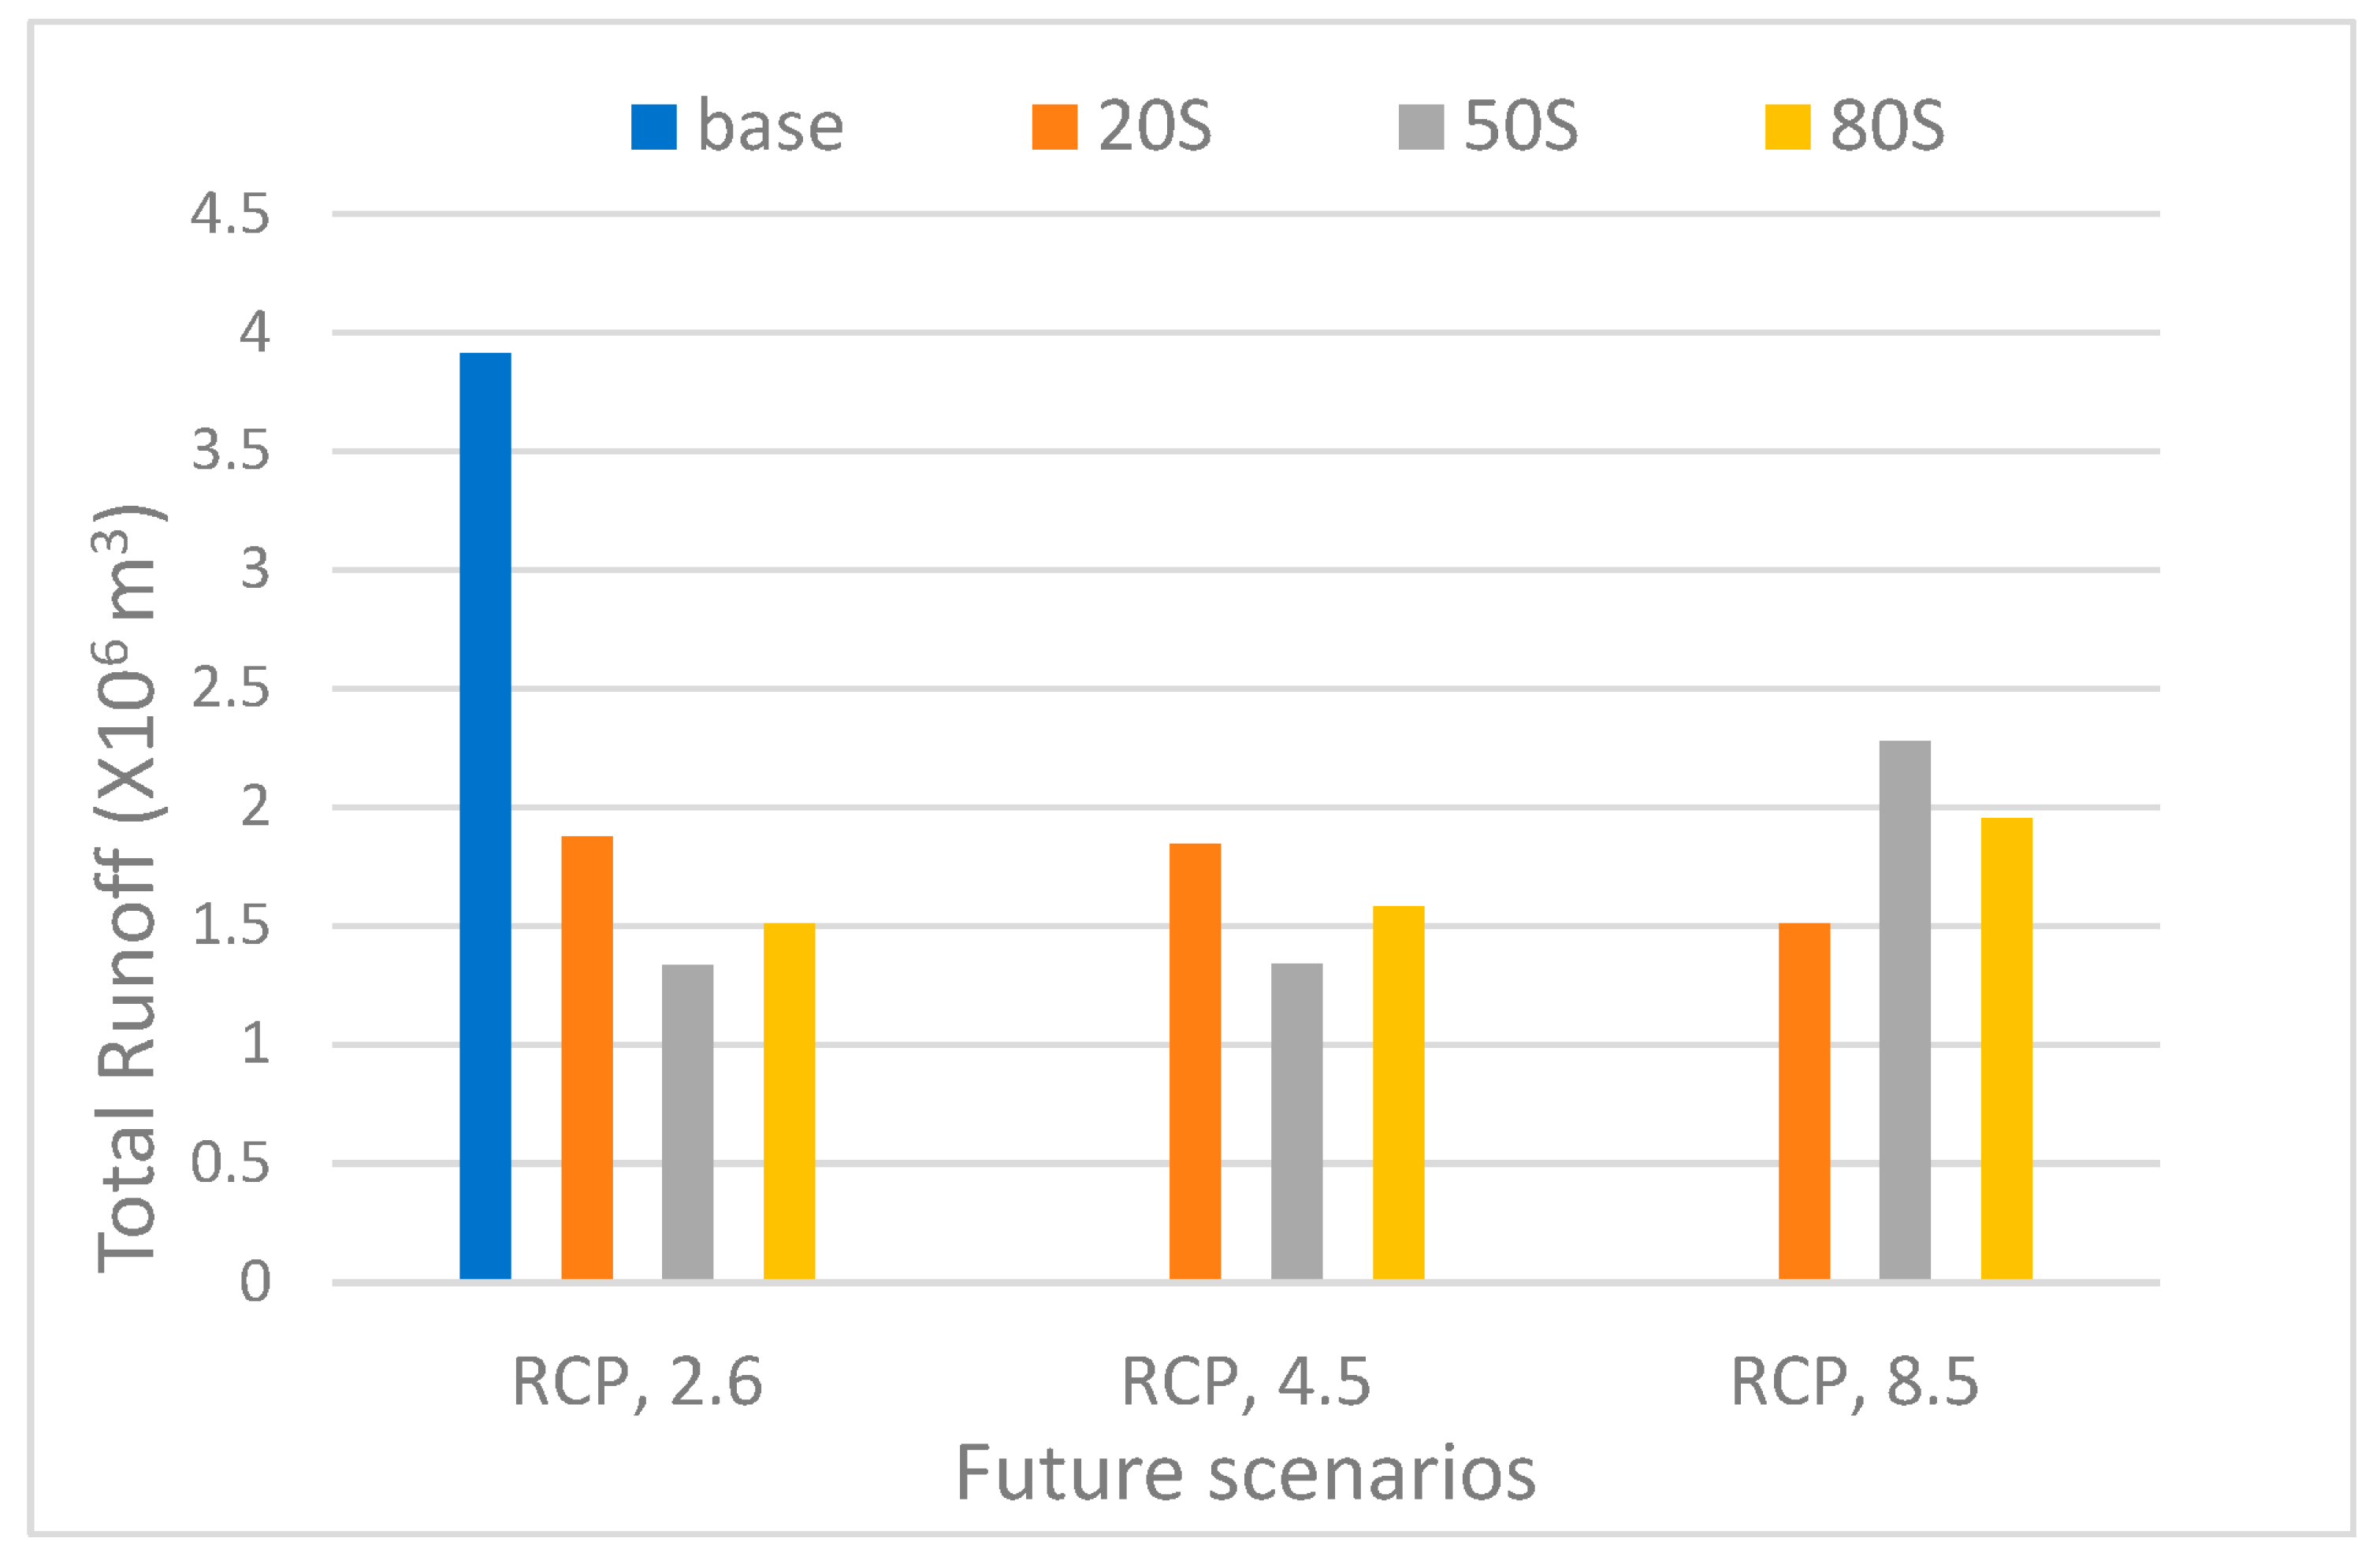
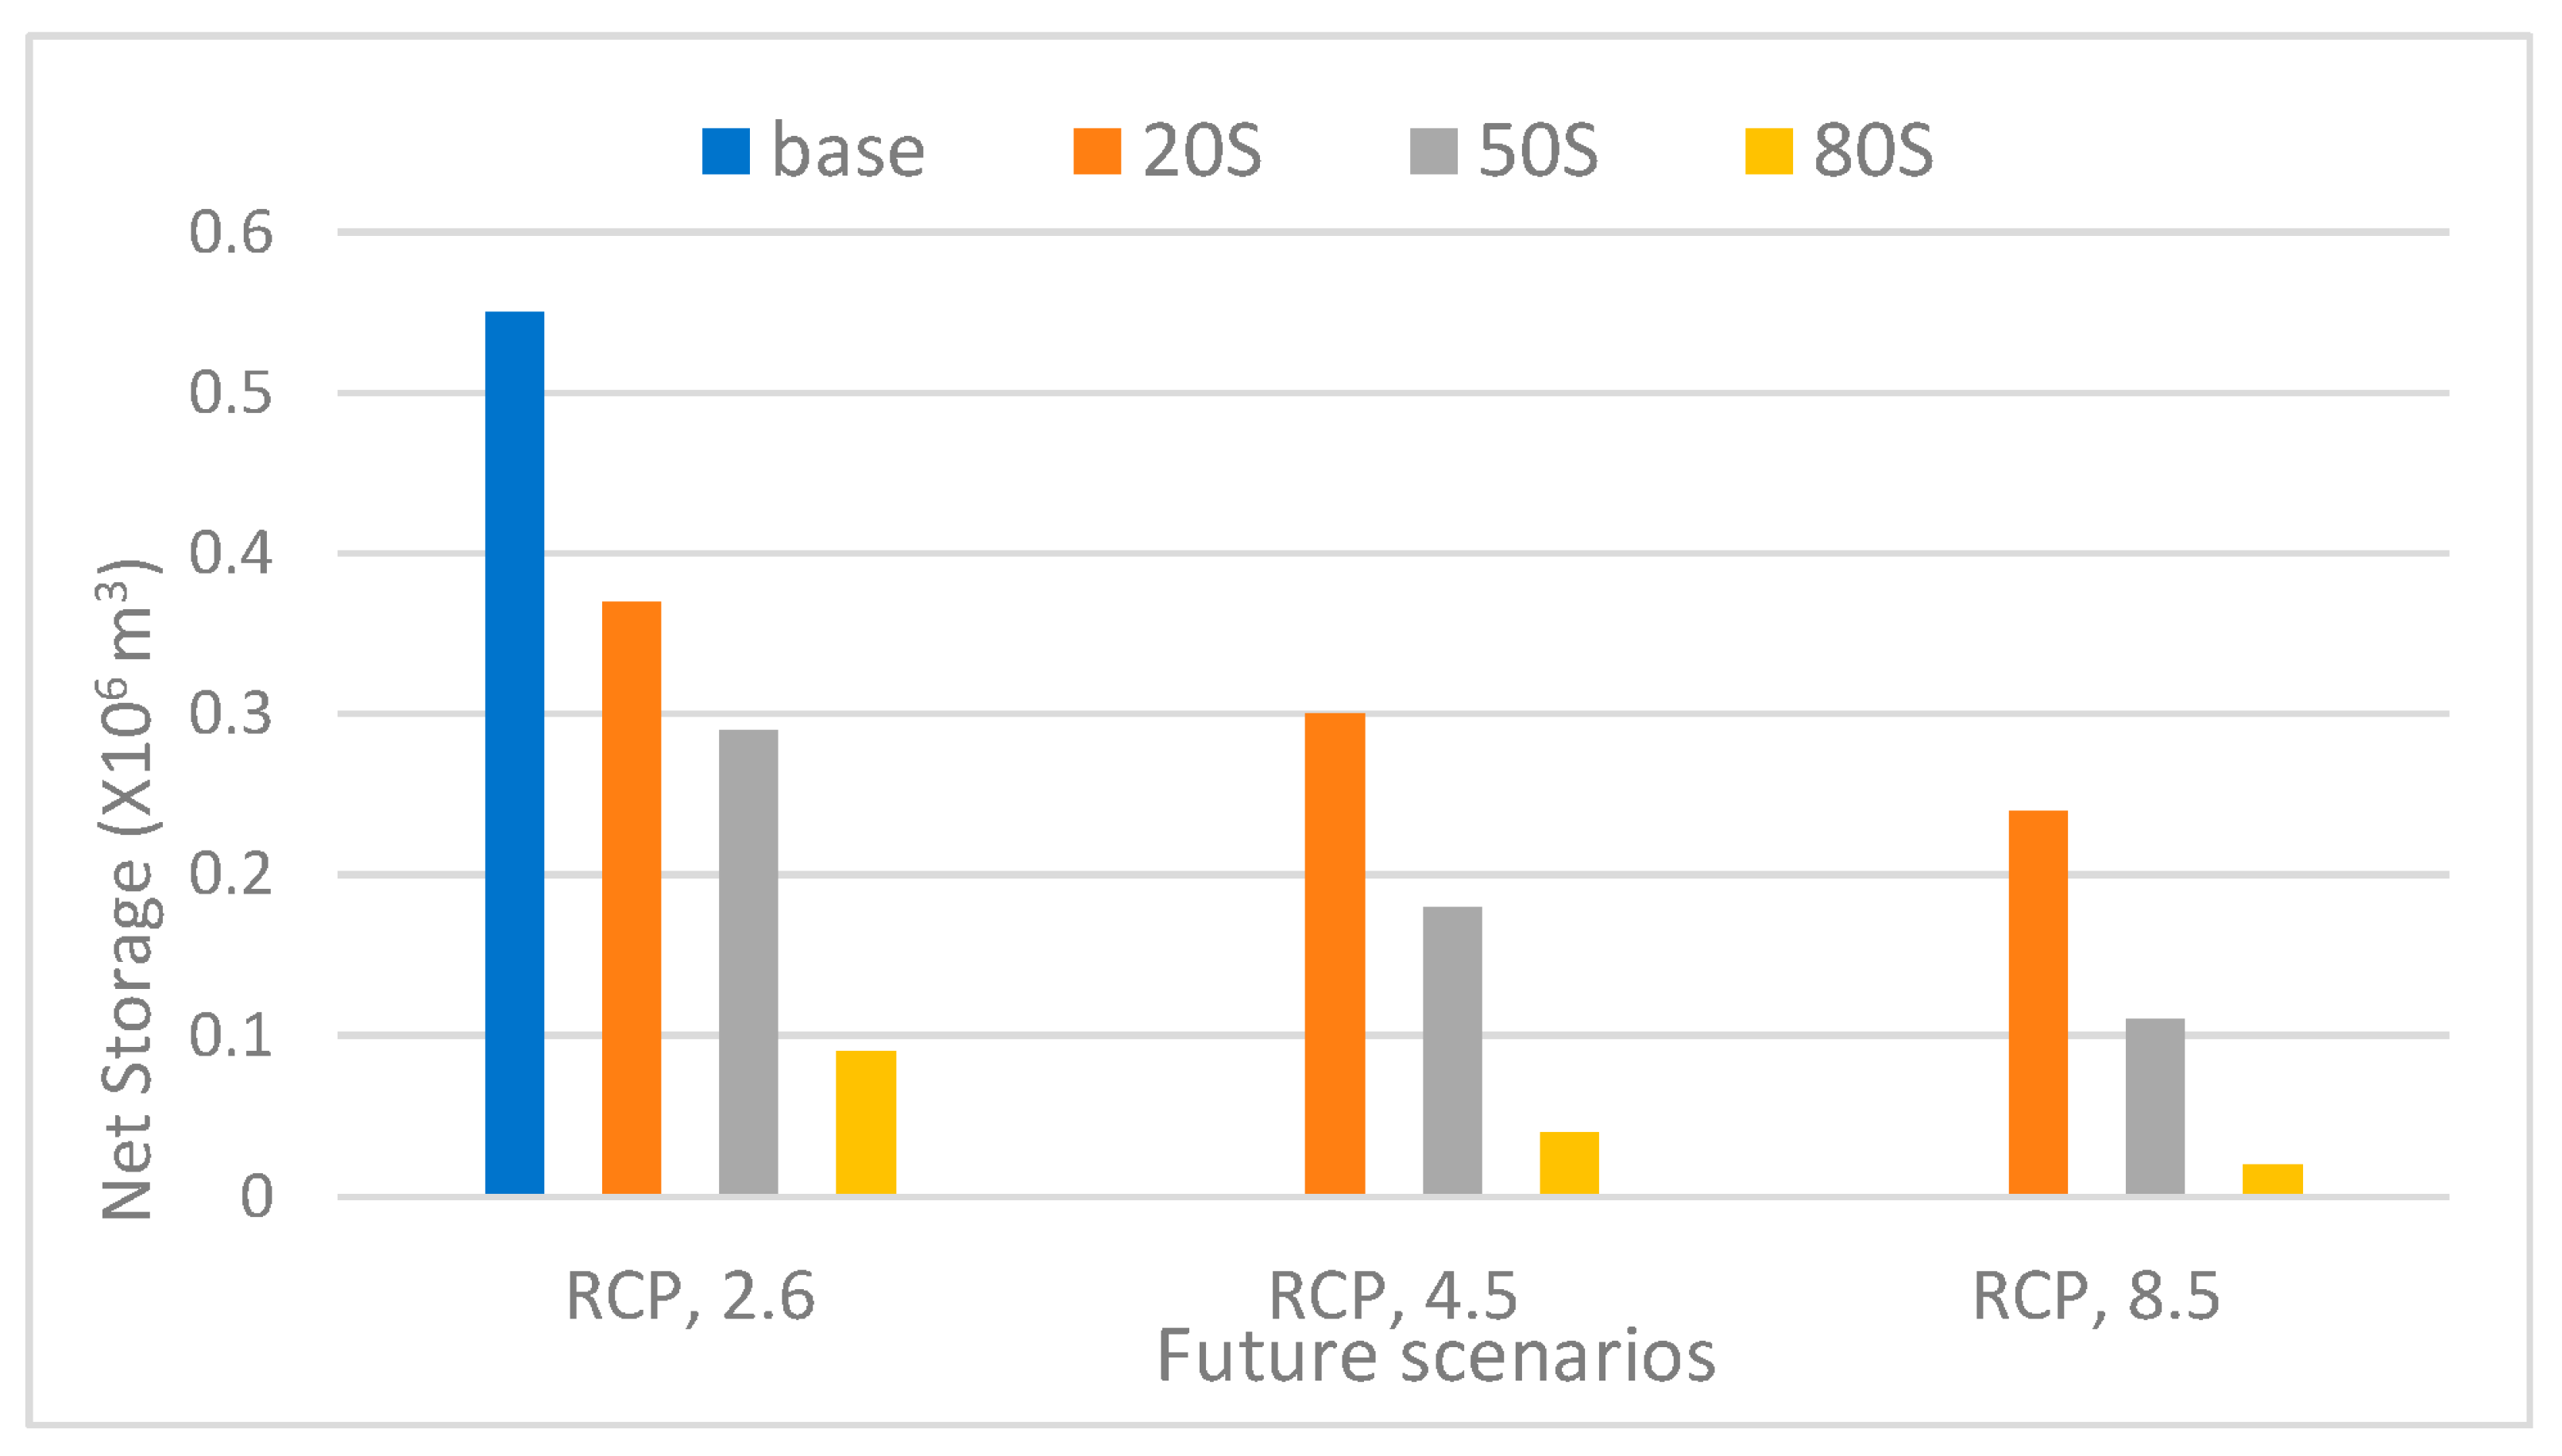
3.2. Water Harvesting Model (WHCatch)

The water availability at Al Abila dam was determined using the WHCatch. The volume of precipitation in the Al Abila dam and the real evapotranspiration are two key factors that will determine how much water the dam will be able to hold. As a result, changes in temperature and precipitation will directly affect the amount of water available and the overall functionality of the Al Abila dam.
The data depends on the greatest depth of daily precipitation recorded at the Al-Rutba station between 1990 and 2020. These data were analyzed utilizing the WHCatch in the Abila dam under Microsoft Excel to determine the variation in water storage volume. The design capacity of the Abila dam is 4 × 10⁶ cubic meters. The reservoir of the dam only reached its target level once, in 1994, as seen in Figure 5. In addition, there was not much runoff between 2000 and 2009, which made the dam’s storage dry and rendered it unusable.
According to the research, 5.2% of the years from 1990 to 2020 had enough surface runoff to enable the water to reach the dam reservoir and allow it to hold all of its 4 × 10⁶ m3 planned capacity. Actually, the results show that the dam’s reservoir has a larger storage capacity than anticipated. The Abila dam often faces seepage along its body because the trench’s foundation has not been winded to access the strata layers. A back trench (toe drain) located downstream of the dam is also missing.
The amount of surface runoff was determined differently in each of the three future scenarios. Figure 6 compares the simulations for the Al Abila dam for RCP 2.6, 4.5, and 8.5 during the 2020s, 2050s, and 2080s with the baseline period (1990–2020). The 2020s period, indicated using the year 2035, had the greatest surface runoff of 1,875,681.8 m3. In the 2050s, the surface runoff in the year 2070 was 1,335,167.9 m3, while in the 2080s, the surface runoff in the year 2090 under the RCP 2.6 scenario was 1,506,788.98 m3.
The amount of water that can be held in a dam reservoir relies on the surface runoff that is collected, and the water required. The Al Abila dam’s current reliability and sustainability have already been evaluated and discussed in previous studies [31,32]. Under RCP 2.6, 4.5, and 8.5, the reservoir of the Al Abila dam will hold less water in the future scenarios (Figure 7). WHCatch findings matched projected precipitation estimates exactly (Figure 4). During the baseline period, 15% or less of net storage was able to satisfy the total storage capacity. Regarding future scenarios under RCP 2.6, 10% of the possible storage capacity would be met in the 2020s, 8% in the 2050s, and 3% in the 2080s. Under RCP 4.5 for the 2020s, 2050s, and 2080s, there will be a decrease of 8%, 5%, and 2%, respectively, whereas for RCP 8.5, the rates will be 6% in the 2020s, 3% in the 2050s, and 1% in the 2080s (Figure 7). These findings, however, demonstrate that the Al Abila dam will be unable to provide the required water. Due to evaporation from soil surfaces and reservoirs, as well as the previously mentioned technical issues, the water availability is incredibly limited in these light-rain locations. Hence, there is minimal water productivity [2].

4. Conclusions

This study showed that rainwater harvesting (RWH) might be used as a tool for adaptation to reduce water shortages due to climate change and ultimately increase availability of water both today and in the future. According to the results, the Al Abila dam will be unable to supply the necessary water. The climate change impact on the water availability of the Abila dam in the western desert of Iraq was evaluated under both the current climate and various future climate change scenarios. During the baseline period, only 15% or less of the net storage might fulfil the whole storage capacity and that number goes to 10% for RCP 2.6 in the 2020s for future scenarios. RCP 8.5 can provide for water needs at a pace of 6% in the 2020s. As a result, by modifying the storage capacity to be able to store the volume of water lost through runoff, the Al Abila dam’s performance might be enhanced.
The minimum and maximum temperatures increased in all future greenhouse gas emission scenarios, while rainfall tended to fall more frequently in the 2020s, 2050s, and 2080s. In general, the increases in mean maximum and minimum temperatures found in this analysis were like those seen in other studies projecting growing trends into the twenty-first century. Potential evapotranspiration is also expected to rise because of the rising temperatures.
Due to the requirement of local meteorological data in the hydrological models used for impact studies, downscaling was required; consequently, the statistical downscaling model (SDSM) model was utilized. An SDSM can tailor scenarios for particular regions, scales, and issues while requiring less technical expertise than other modeling and costing less to compute.
The findings may be crucial for planners, decision makers, and farmers as they attempt to prepare for changing climatic conditions and/or mitigate their negative effects on water supplies. To fully realize the influence of climate change on water availability, future research is needed to incorporate different GCMs, downscaling models, and land use/cover changes into simulation models under CMIP5.
The key limitations of this study include the challenges in obtaining reliable information on temperature and rainfall in the study region, as well as the challenges in obtaining access to that location owing to security concerns.

Author Contributions

Conceptualization, A.A. and R.A.; methodology, A.A.; software, A.A. and R.A.; validation, A.A. and M.F.A.; formal analysis, A.A. and M.F.A.; investigation, A.A. and R.A.; resources, A.A. and C.R.; data curation, R.A.; writing—original draft preparation, A.A. and R.A.; writing—review and editing, C.R.; visualization, A.A. and M.F.A.; supervision, C.R.; project administration, C.R. and A.A. All authors have read and agreed to the published version of the manuscript.

Funding

This research received no external funding.

Data Availability Statement

Some data in this manuscript were obtained from the Ministry of Agriculture and the Ministry of Water Resources, small dam management in the Western Desert. The other data were gathered from fieldwork and previous studies.

Conflicts of Interest

The authors declare no conflict of interest.

References

  1. IPCC. Climate Change 2022: Impacts, Adaptation, and Vulnerability. Contribution of Working Group II to the Sixth Assessment Report of the Intergovernmental Panel on Climate Change; Pörtner, H.-O., Roberts, D., Tignor, M., Poloczanska, E., Mintenbeck, K., Alegría, A., Craig, M., Langsdorf, S., Löschke, S., Möller, V., et al., Eds.; Cambridge University Press: Cambridge, UK, 2022; In Press. [Google Scholar]
  2. Adham, A.; Wesseling, J.G.; Abed, R.; Riksen, M.; Ouessar, M.; Ritsema, C.J. Assessing the impact of climate change on rainwater harvesting in the Oum Zessar watershed in Southeastern Tunisia. Agric. Water Manag. 2019, 221, 131–140. [Google Scholar] [CrossRef]
  3. IPCC. Climate Change 2014: Impacts, Adaptation and Vulnerability. Contribution of Working Group II to the Fifth Assessment Report of the Intergovernmental Panel on Climate Change; Field, C.B., Barros, V.R., Dokken, D.J., Mach, K.J., Mastrandrea, M.D., Bilir, T.E., Chatterjee, M., EBI, K.L., Estrada, Y.O., Genova, R.C., et al., Eds.; Cambridge University Press: Cambridge, UK; New York, NY, USA, 2014. [Google Scholar]
  4. Ministry of Foreign Affairs. Climate Change Profile, Iraq; Governmental Report; MoFAN: Den Haag, The Netherland, 2019. [Google Scholar]
  5. Ammar, A.; Riksen, M.; Ouessar, M.; Ritsema, C.J. Identification of suitable sites for rainwater harvesting structures in arid and semi-arid regions: A review. Int. Soil Water Conserv. Res. 2016, 4, 108–120. [Google Scholar] [CrossRef]
  6. Mukheibir, P. Water resources management strategies for adaptation to climate-induced impacts in South Africa. Water Resour. Manag. 2008, 22, 1259–1276. [Google Scholar] [CrossRef]
  7. Wilby, R.L.; Wigley, T.M.L. Precipitation predictors for downscaling: Observed and general circulation model relationships. Int. J. Climatol. 2000, 20, 641–661. [Google Scholar] [CrossRef]
  8. Ipcc-Tgic, A. General Guidelines on the Use of Scenario Data for Climate Impact and Adaptation Assessment. Version 2. 2007. Available online: http://www.ipcc-data.org/guidelines/TGICA_guidance_sdciaa_v2_final.pdf (accessed on 1 March 2023).
  9. Chen, J.; Brissette, F.P.; Poulin, A.; Leconte, R. Overall Uncertainty Study of the Hydrological Impacts of Climate Change for a Canadian Watershed. Water Resour. Res. 2011, 47, W12509. [Google Scholar] [CrossRef]
  10. Kingston, D.G.; Taylor, R.G. Sources of Uncertainty in Climate Change Impacts on River Discharge and Groundwater in a Headwater Catchment of the Upper Nile Basin, Uganda. Hydrol. Earth Syst. Sci. 2010, 14, 1297–1308. [Google Scholar] [CrossRef]
  11. Wilby, R.L.; Harris, I. A Framework for Assessing Uncertainties in Climate Change Impacts: Low-Flow Scenarios for the River Thames, UK. Water Resour. Res. 2006, 42, W02419. [Google Scholar] [CrossRef]
  12. Bhatta, B.; Shrestha, S.; Shrestha, P.K.; Talchabhadel, R. Evaluation and application of a SWAT model to assess the climate change impact on the hydrology of the Himalayan River Basin. Catena 2019, 181, 104082. [Google Scholar] [CrossRef]
  13. Chaemiso, S.E.; Abebe, A.; Pingale, S.M. Assessment of the impact of climate change on surface hydrological processes using SWAT: A case study of Omo-Gibe River basin, Ethiopia. Model. Earth Syst. Environ. 2016, 2, 1–15. [Google Scholar] [CrossRef]
  14. Chiew, F.H.S.; Whetton, P.H.; McMahon, T.; Pittock, B. Simulation of the impacts of climate change on runoff and soil moisture in Australian catchments. J. Hydrol. 1995, 167, 121–147. [Google Scholar] [CrossRef]
  15. Al-Ansari, N.; Abdellatif, M.; Ali, S.S.; Knutsson, S. Long term effect of climate change on rainfall in northwest Iraq. Cent. Eur. J. Eng. 2014, 4, 250–263. [Google Scholar] [CrossRef]
  16. Mohammad Reza Pour, O. The effect of climate change on stream flow used Statistical downscaling of HADCM3 model and Artificial Neural Networks. J. Water Soil Conserv. 2016, 23, 317–326. [Google Scholar]
  17. Adamo, N.; Al-Ansari, N.; Sissakian, V.K.; Knutsson, S.; Laue, J. Climate Change: Consequences on Iraq’s Environment. J. Earth Sci. Geotech. Eng. 2018, 8, 43–58. [Google Scholar]
  18. Hilo, A.N.; Saeed, F.H.; Al-Ansari, N. Impact of climate change on water resources of Dokan Dam Watershed. Engineering 2019, 11, 464–474. [Google Scholar] [CrossRef]
  19. Visweshwaran, R.; Ramsankaran, R.A.A.J.; Eldho, T.I.; Jha, M.K. Hydrological Impact Assessment of Future Climate Change on a Complex River Basin of Western Ghats, India. Water 2022, 14, 3571. [Google Scholar] [CrossRef]
  20. Soltani, F.; Javadi, S.; Roozbahani, A.; Massah Bavani, A.R.; Golmohammadi, G.; Berndtsson, R.; Ghordoyee Milan, S.; Maghsoudi, R. Assessing Climate Change Impact on Water Balance Components Using Integrated Groundwater–Surface Water Models (Case Study: Shazand Plain, Iran). Water 2023, 15, 813. [Google Scholar] [CrossRef]
  21. Adham, A.; Wesseling, J.G.; Riksen, M.; Ouessar, M.; Ritsema, C.J. A water harvesting model for optimizing rainwater harvesting in the wadi Oum Zessar watershed, Tunisia. Agric. Water Manag. 2016, 176, 191–202. [Google Scholar] [CrossRef]
  22. Adham, A.; Riksen, M.; Ouessar, M.; Ritsema, C.J. A Methodology to Assess and Evaluate Rainwater Harvesting Techniques in (Semi-) Arid Regions. Water 2016, 8, 198. [Google Scholar] [CrossRef]
  23. Kamel, A.; Sulaiman, S.; Sayl, K. Hydrologic study for Iraqi western desert to assessment of water harvesting projects. Iraqi J. Civ. Eng. 2012, 7, 2. [Google Scholar]
  24. Dibike, Y.B.; Coulibaly, P. Hydrologic impact of climate change in the Saguenay watershed: Comparison of downscaling methods and hydrologic models. J. Hydrol. 2005, 307, 145–163. [Google Scholar] [CrossRef]
  25. Xu, C. Climate change and hydrologic models: A review of existing gaps and recent research developments. Water Resour. Manag. 1999, 13, 369–382. [Google Scholar] [CrossRef]
  26. Taylor, K.E.; Stouffer, R.J.; Meehl, G.A. An overview of CMIP5 and the experiment design. Bull. Am. Meteorol. Soc. 2012, 93, 485–498. [Google Scholar] [CrossRef]
  27. Setegn, S.G.; Rayner, D.; Melesse, A.M. Climate change impact on agricultural water resources variability in the Northern Highlands of Ethiopia. In Nile River Basin: Hydrology, Climate and Water Use, 1st ed.; Melesse, A.M., Ed.; Springer: Berlin/Heidelberg, Germany, 2011; pp. 241–265. [Google Scholar] [CrossRef]
  28. Grotch, S.L.; MacCracken, M.C. The use of general circulation models to predict regional climatic change. J. Clim. 1991, 4, 286–303. [Google Scholar] [CrossRef]
  29. Hassan, Z.; Shamsudin, S.; Harun, S. Application of SDSM and LARS-WG for simulating and downscaling of rainfall and temperature. Theor. Appl. Climatol. 2014, 116, 243–257. [Google Scholar] [CrossRef]
  30. Boers, T.M.; Zondervan, K.; Ben-Asher, J. Micro-Catchment-Water-Harvesting (MCWH) for arid zone development. Agric. Water Manag. 1986, 12, 21–39. [Google Scholar] [CrossRef]
  31. Adham, A.; Seeyan, S.; Abed, R.; Mahdi, K.; Riksen, M.; Ritsema, C. Sustainability of the Al-Abila Dam in the Western Desert of Iraq. Water 2022, 14, 586. [Google Scholar] [CrossRef]
  32. Adham, A.; Abed, R.; Mahdi, K.; Hassan, W.H.; Riksen, M.; Ritsema, C. Rainwater Catchment System Reliability Analysis for Al Abila Dam in Iraq’s Western Desert. Water 2023, 15, 944. [Google Scholar] [CrossRef]
Figure 1. The study region with the position of the Al-Abila Dam (Adham et al. [22]).
Hydrology 10 00183 g001
Figure 2. SDSM’s performance validation for maximum and minimum temperature (Tmax and Tmin) and precipitation (Prcp).
Hydrology 10 00183 g002
Figure 3. Monthly average Tmax and Tmin for three RCPs, 2.6, 4.5, and 8.5, for the baseline and three periods (2020s (2011–2040), 2050s (2041–2070), and 2080s (2071–2100)).
Hydrology 10 00183 g003
Figure 4. Monthly averaged precipitation for the three RCPs in the baseline and the projected periods (2020s (2011–2040), 2050s (2041–2070), and 2080s (2071–2100)).
Hydrology 10 00183 g004
Figure 5. The amount of net storage and total yearly runoff.
Hydrology 10 00183 g005
Figure 6. Results of water-harvesting modelling; in the Al Abila dam, surface runoff is simulated (2020s (2011–2040), 2050s (2041–2070), and 2080s (2071–2100)).
Hydrology 10 00183 g006
Figure 7. Future net storage capacity of the Abila dam for the three time periods (2020s (2011–2040), 2050s (2041–2070), and 2080s (2071–2100)) and the baseline.
Hydrology 10 00183 g007
Table 1. Shows how each predictor was chosen according to its significance level (p) and correlation (r) values for each predictand. The p-variable is 0.00 for each combination of predictor and predictand.
PredictandPredictorPredictor DescriptionPartial r
precipitationp5_ugl500 hPa Zonal wind component−0.095
shumgl1000 hPa Specific humidity0.192
tempglAir temperature at 2 m−0.117
p1zhgl1000 hPa Divergence of true wind0.185
T_MAXp500gl500 hPa Geopotential0.341
shumgl1000 hPa Specific humidity0.104
tempglAir temperature at 2 m0.709
p1zhgl1000 hPa Divergence of true wind0.152
T_MINp500gl500 hPa Geopotential0.160
shumgl1000 hPa Specific humidity0.364
tempglAir temperature at 2 m0.659
Table 2. The yearly averages of precipitation and minimum and maximum temperature for each of the three scenarios and time periods (2020s, 2050s, and 2080s).
T. maxT. minPrecipitation (%)
2080s3.44.99.33.95.29.2−29−29.2−27.2
2050s2.23.76.32.74.16.5−30−28−29
2020s1.53.24.52.023.75.04−30.2−29−32
Rcps2.64.58.52.64.58.52.64.58.5
Disclaimer/Publisher’s Note: The statements, opinions and data contained in all publications are solely those of the individual author(s) and contributor(s) and not of MDPI and/or the editor(s). MDPI and/or the editor(s) disclaim responsibility for any injury to people or property resulting from any ideas, methods, instructions or products referred to in the content.

