Article

Analysis of Changes in Water Flow after Passing through the Planned Dam Reservoir Using a Mixture Distribution in the Face of Climate Change: A Case Study of the Nysa Kłodzka River, Poland

by
Łukasz Gruss
1,
Mirosław Wiatkowski
1,*,
Maksymilian Połomski
1,2,
Łukasz Szewczyk
3 and
Paweł Tomczyk
1
1
Institute of Environmental Engineering, Wrocław University of Environmental and Life Sciences, pl. Grunwaldzki 24, 50-363 Wrocław, Poland
2
State Water Holding Polish Waters-Regional Water Management Authority in Wrocław, Norwida 34, 50-950 Wrocław, Poland
3
Institute of Meteorology and Water Management, National Research Institute in Warsaw, Podleśna 61, 01-673 Warszawa, Poland
*
Author to whom correspondence should be addressed.
Hydrology 2023, 10(12), 226; https://doi.org/10.3390/hydrology10120226
Submission received: 25 October 2023 / Revised: 23 November 2023 / Accepted: 29 November 2023 / Published: 1 December 2023
(This article belongs to the Special Issue Recent Advances in Hydrological Modeling)

Abstract

:
Climate change and extreme weather events have the potential to increase the occurrences of flooding and hydrological droughts. Dam reservoir operation can mitigate or aggravate this impact. This study aims to evaluate the influence of the planned Kamieniec Ząbkowicki dam reservoir on the flow patterns of the Nysa Kłodzka river in the context of changing hydrological conditions and climate change. In the study, a 40-year observational series of hydrological data was used to simulate changes in water flow through the river valley in a numerical model. This simulation was conducted both for the natural river valley and for the same river valley but with the added reservoir dam. Flow simulations revealed that dam operation increased downstream flow values, reducing variability in extreme high-flow events. Addition, the mixture log-normal distribution shows that the operation of the dam resulted in a reduction in the variability of both low flows and extreme high-flow events. Furthermore, the model illustrates that moderate-flow conditions remain relatively stable and similar before and after dam construction. The Mann–Kendall trend test, Sen slope trend test and Innovative Trend Analysis indicated that the dam had a significant impact on flow trends, reducing the negative trend. This hydrotechnical structure stabilizes and regulates flows, especially in response to climate-induced changes. These findings highlight the effectiveness of the dam in mitigating flood risk and supporting water resource management. It is essential to consider the role of the dam in adapting to changing hydrological conditions influenced by climate change. For practical application, efficient flow regulation by reservoir administration is crucial.

1. Introduction

Extreme weather events, such as very heavy rainfall, lead to an increased occurrence of flooding [1,2,3,4,5,6]. Previous research (using data predicted from climate models) indicates that the observed changes in floods and hydrological droughts were broadly consistent with climate change scenarios. This includes a study on the impact of climate change on hydroelectric power production (a global model covering 1593 hydropower dams distributed across 107 countries in Europe, Asia, Africa, North America, South America, and Australia) [7]. This also involves additional research on the influence of climate change on the reliability of water and hydropower supply from the Chungju multipurpose dam in South Korea [8], as well as on the quantity and quality of water from the Mahabad dam in Iran [9]. Another study further investigated flood risk for the Yongdam Dam on the Geum River in South Korea [10], and similar analyses were used for global data [11]. Therefore, climate change is estimated to likely have an impact on the occurrence of these two hydrological extreme phenomena: floods and hydrological droughts [2,12,13]. It is worth noting that climate change also affects stream flow, and reservoir operation can mitigate or aggravate this impact [14]. Furthermore, the characteristics of dam reservoirs play a key role in influencing local climate change, demonstrating correlations with meteorological variables [15,16]. Dam reservoirs can have localized cooling effects on the climate in the vicinity of the reservoir. The large surface area of a reservoir can lead to increased evaporation, resulting in localized cooling. Hence, this effect is typically limited to the immediate vicinity of the reservoir [16]. However, the construction of dams is often seen as a prime solution for addressing the growing demand for water, food, and energy in the future, even though it can significantly impact the natural environment in their vicinity [15,16,17,18]. The impacts related to the construction of a dam water reservoir (as well as other objects constituting a transverse obstacle in the riverbed, e.g., hydropower plants or weirs) include an impact on the surface water quality, hydrological conditions, processes of accumulation and erosion of sediment and living conditions for aquatic organisms (especially fish) [19,20,21,22]. Moreover, dam reservoirs can impact the availability of water downstream, which, in turn, can significantly alter the flow duration, frequency, and magnitude (high-frequency events of low-magnitude events in the post-dam period) [23,24]. Therefore, quantitative studies are necessary to assess dam reservoirs in terms of climate changes that affect the catchment area [24]. The flow downstream of the dam is influenced by its operation and regulation [25]. The impact of the dam on downstream flow depends on factors such as capacity, operational rules, and local hydrology [26,27]. Analysis of flow data after the construction of a dam reservoir due to changes in the flow regime can involve a shift in the probability distribution parameters [27,28]. This shift can be estimated using statistical methods [28]. The mixture distribution model can be used to analyze and model flow data both before and after the construction of the dam reservoir. These models provide a more flexible framework for modeling flows compared to traditional single-distribution models, as they can capture complex dependencies in the data [29]. Mixture models are used in hydrology to account for the presence of multiple processes that contribute to extreme flows. Various hydrological processes may represent different flood-generating mechanisms [30,31]. For example, one component might represent base flow, another may represent rainfall-induced flow, and another may represent the snow-melt-induced flow [32]. A log-normal distribution is often chosen to be the best candidate for both maximum and minimum streamflow in the temperate climate zone [33,34,35,36,37]. The relationship between flow before and after the construction of the dam reservoir and log-normal distributions comes into play when one must account for the potential changes in flow patterns caused by the dam operation [38,39]. Before the log-normal model is built, the mixture model can help to identify and model the various components of the natural flow that contribute to the observed flow data [29]. After the reservoir is in operation, the mixture distribution model can be used to assess how the influence of the dam may have altered the components of the composition of the flow mixture and how this has affected the overall flow distribution [29,40]. The construction of reservoirs can change the trend of the time series of river flows. To evaluate the impact of the dam, researchers often compare the results of the Mann–Kendall test [41], Sen slope trend test and Innovative Trend Analysis (ITA) for flow data before and after construction [42]. The Mann–Kendall trend test is commonly used to assess the presence of trends in time series data [33,43]. Specifically, when it comes to flow series data from the two periods, pre-dam construction and post-dam construction, this test is used to examine whether the reservoir has had a significant impact on flow patterns [41,44]. However, Sen’s slope and ITA have also found application in this type of research [42]. A significant trend of flow series data in post-dam construction may indicate the presence of natural flow patterns (such as air temperature and precipitations) or other external factors influencing flow data (such as economic development, demands of growing population, and intensive urbanization and agriculture) [24,45]. Assessing the impact of the reservoir on flow trends during the post-dam period can be facilitated using the Mann–Kendall test [45,46] and ITA [42]. A change from a significant trend before construction to a nonsignificant trend after construction may suggest that the dam reservoir has influenced the flow patterns, possibly by reducing natural variability [24] (reducing maximum flows and increasing minimum flows as a result of creating an artificial reservoir [47]). On the contrary, a significant negative trend after construction may indicate the impact of the dam on flow behavior, which can have implications for downstream ecosystems, water resource management, and other related fields [48].
The aim of the study is to evaluate the influence of the Kamieniec Ząbkowicki reservoir dam on the flow patterns of the Nysa Kłodzka river in the context of changing hydrological conditions and in the face of climate change. Furthermore, it is assumed that the operation of the dam can help mitigate climate-induced changes in river flows, providing stability and protection against extreme events while supporting local ecosystems. To confirm this, flow simulation in numerous models, trend tests, and mixture distribution models were undertaken. The combination of these analyses will allow us to provide information on changes in drought and flood mechanisms resulting from dam operation.

2. Materials and Methods

2.1. Study Area

The Nysa Kłodzka River, located in southwestern Poland, has a high flood potential and has historically been the cause of numerous floods in the region. As a result, numerous flood protection actions were taken. In the 1960s, the construction of the dam reservoir Kamieniec Ząbkowicki was proposed. The dam (50°30′58.98″ N 16°51′18.79″ E) is located in the Upper Oder Basin on the Nysa Kłodzka River in southwestern Poland in Central Europe (Figure 1).
At the beginning of the 21st century, numerous conceptual and design works of the Kamieniec Ząbkowicki reservoir were carried out. Currently, construction has not begun yet, but current investment plans indicated in state legal regulations assume its launch in the coming years. The assumed reservoir parameters are presented in Table 1.
The length of the frontal dam will be 2260 m and the maximum height will be 18.7 m. The width of the crown will be 8 m and the inclination of the upstream slope will be 1:2.5, while the inclination of the downstream slope will be 1:2 with a bench 1:3. The discharge structure will consist of outlets and overflows.

2.2. HEC-RAS Model

To assess the impact of the Kamieniec Ząbkowicki dam reservoir on the flow distribution in the Nysa Kłodzka river below this structure, a one-dimensional hydraulic model developed in the HEC-RAS software was used (Figure 2). The shape of the valley was recreated using a Digital Terrain Model with a grid of 1 m × 1 m points, derived from airborne laser scanning (ALS), known as LIDAR. For the elevation measurements in the study area, we used the European Vertical Reference Frame (PL-EVRF2007-NH) system [50]. In the HEC-RAS model, according to the initial project, the reservoir area, the shape of the dam and parameters of the discharge devices were assumed. The latter includes 4 bottom outlet conduits measuring 2 × 2.5 m each, as well as 3 spillway spans with a width of 14 m each. The hydraulic parameters of the dam were as follows: the headwater maximum elevation was equal to the elevation of the top of the dam, and the maximum flow that could pass through the spillway block devices was 1994 m3·s−1. The designed flow was 1994 m3·s−1 [49]. Within the model, 21 active cross-sections were delineated, with 9 in the existing river and 12 within the hypothetical reservoir area, as depicted in Figure 2. Model calibration and validation were performed using the highest situated cross-section (number 3727), for which numerous data regarding flow values and water levels and stage-discharge rating curves were collected. The dam was placed at cross-section number 774, and the flow distribution analysis was conducted for the lowest situated cross-section, identified as number 85.
As hydrological input data for the model, the average terrain slope in the study area and the actual daily flows, in addition to the water levels between 1980 and 2020 at cross-section number 3727, were used as boundary conditions. An “Unsteady Flow” analysis was applied, facilitated by the HEC-RAS program. The computation and output intervals were set at the same level, which was one day. Through the reservoir, the entire flow series from the period 1980–2020 was released while keeping three spillways and four bottom outlets open.
To illustrate the impact of the reservoir on flows at cross-section 85, an alternative version of the model was created. In this version, the geometry reflects the actual state of the river in that segment, without any impounding structures and with a higher density of active cross-sections, as shown in Figure 3. For this geometry, similar flow boundary conditions were adopted as in the model considering the reservoir. In this variant, the analyzed cross-section is also labeled as number 85.
Comparing the models from both scenarios (with a dam and without a dam), it should be noted that, in relation to the model without the dam, only the cross-sections reflecting the reservoir inundation zone have been modified. The cross-section used for model calibration (number 3727) and cross-section number 85, for which calculations were performed along with their visualization, remain unchanged in both models.

2.3. Hydrological Data Collection and Temporal Trend Analysis

The daily water level and flow values for the Nysa Kłodzka River from the Bardo profile were used for the analysis. Figure 4 shows the daily flows used as input for the HEC-RAS model (Figure 4). The profile is marked as cross-section number 3727 in Figure 2 and Figure 3. The water level and flow values are derived from the period 1980–2020. The data source is the Institute of Meteorology and Water Management, the National Research Institute in Warsaw. These data have been processed. The stage-discharge rating curve, time series of water levels, and flow rates from the Bardo profile were used for the calibration and validation of the valley HEC-RAS model both with dam and without dam.
The flow series from the period 1980–2020 was selected to simulate the flow in both models. As a result of the simulation, flows from cross-section no. 85 were obtained, which were recorded separately for these two models: one for the period before the construction of the reservoir and another for the period after the construction.
In the present study, the non-parametric Mann–Kendall trend test was used to detect the presence of temporal trends [33]. This method is widely used to determine the temporal trends of hydrological data. The Mann–Kendall trend test statistic S was calculated using the following equation [41,52]:
S = k = 1 n 1 j = k + 1 n s g n ( x j x k ) ,
s i g n   ( x ) = 1   i f     x > 0 0   i f   x = 0 1   i f   x < 0 ,
where xj, xk are sequential data in series, and n is the length of the data series [33,41,43].
The variance (σ2) of S is defined by (3):
σ 2 = [ n ( n 1 ) ( 2 n + 5 ) ] 18
The standard test statistic z was calculated using the following Equation (4) [41,52]:
z = S 1 σ   i f     S > 0 0   i f   S = 0 S + 1 σ   i f   S < 0 ,
A positive z value indicates an upward trend in the time series, while a negative value indicates a downward trend (4) [52].
Analyzing the Mann–Kendall trend test (S statistic and p-value) for a flow series before and after the construction of a dam reservoir can help determine whether the presence of the reservoir has had a significant impact on water flow. The S statistic and p-value were determined for each period (pre-dam and post-dam) [33,41].
The positive S statistic for either period indicates an increasing trend and the negative S statistic for either period indicates a decreasing trend. In turn, an S-statistic close to zero suggests no significant trend [41]. The significance level was set at 5% [52]. The R Software version 4.3.1 was used to compute the Mann–Kendall trend test [53].
To validate the results obtained through the Mann–Kendall test, we employed the Sen slope test and Innovative Trend Analysis.
This non-parametric test computes the trend slope in a time series [54]. It assesses the slope difference for each data point throughout time. The trend’s slope can be estimated by the median of all slopes between the data pairs within the same season. These slope pairs are ranked from smallest to largest, and if the calculated number of slopes (n) is odd, the median slope gives the slope S. If n is even, the two median slopes are averaged. The slope of each pair of data is predicted by Sen’s estimator [55]:
S = Q 2 Q 1 T 2 T 1 ,
S = S ( n + 1 ) / 2   n = e v e n S n / 2 = o d d ,
where:
Q represents the data,
n—the length of the data,
T—the time.
The significance level was set at 5%.
In Innovative Trend Analysis, the hydrological time series is partitioned into two equal halves, each sorted in ascending order. The first half series is plotted on the X-axis, while the second half series is plotted on the Y-axis of the Cartesian coordinate system. The 1:1 line on the coordinate system serves as the no-trend line, distinguishing between increasing and decreasing trends. Scatter points above (below) the 1:1 line indicate a monotonic increasing (decreasing) trend in the time series [52,55,56]. Next, it is examined in which cluster the data are among the low, medium, or high clusters. Finally, if the data are clustered around the 1:1 line, it is concluded that there is no trend [56]. As a complement to this method, the non-parametric statistical significance test was introduced—the trend slope (s) test. The calculation of this test is based on the following equation [55,57]:
E s = 2 n [ E y ¯ 2 E ( y ¯ 1 ) ] ,
where:
y ¯ 1 and y ¯ 2 —represent the arithmetic averages of the two equal parts obtained by dividing the time series,
E(s) is the first-order moment of the slope,
n—the data length.
The significance level was set at 5%.

2.4. A Mixture Log-Normal Model

The flows used for mixture model fitting can be raw data from the period 1980–2020.
The probability density function of the log-normal mixture model f(x) is presented using equation [58]:
f x = w 1 · 1 x σ 1 2 π e ln x μ 1 2 2 σ 1 2 + w 2 · 1 x σ 2 2 π e ln x μ 2 2 2 σ 2 2 + w 3 · 1 x σ 3 2 π e ln x μ 3 2 2 σ 3 2
where:
x is the random variable,
w1, w2 and w3 are the proportions of the three components in the mixture,
μ1, μ2, and μ3 are the means of each log-normal components,
σ1, σ2, and σ3 are the standard deviations of each log-normal component.
The mixed three components model for the log-normal family using the expectation–maximization (EM) algorithm was performed, using the MixR package. Based on the raw data, the number of components in the log-normal distribution was assumed. It was assumed that the Nysa Kłodzka River primarily experiences low, medium, and high flows, with a predominance of low flows. Therefore, it was decided to adopt a 3-component mixture. Additionally, the characteristic type of flood for the Nysa Kłodzka River is typically related to heavy rainfall, snowmelt, or a combination of both. Additionally, the optimal log-normal mixture model was selected using the Bayesian Information Criterion (BIC). The “initz” function returned the mean and standard deviation for each component of the mixture model, enabling the calculation of the probability density function for the log-normal mixture [58].

3. Results and Discussion

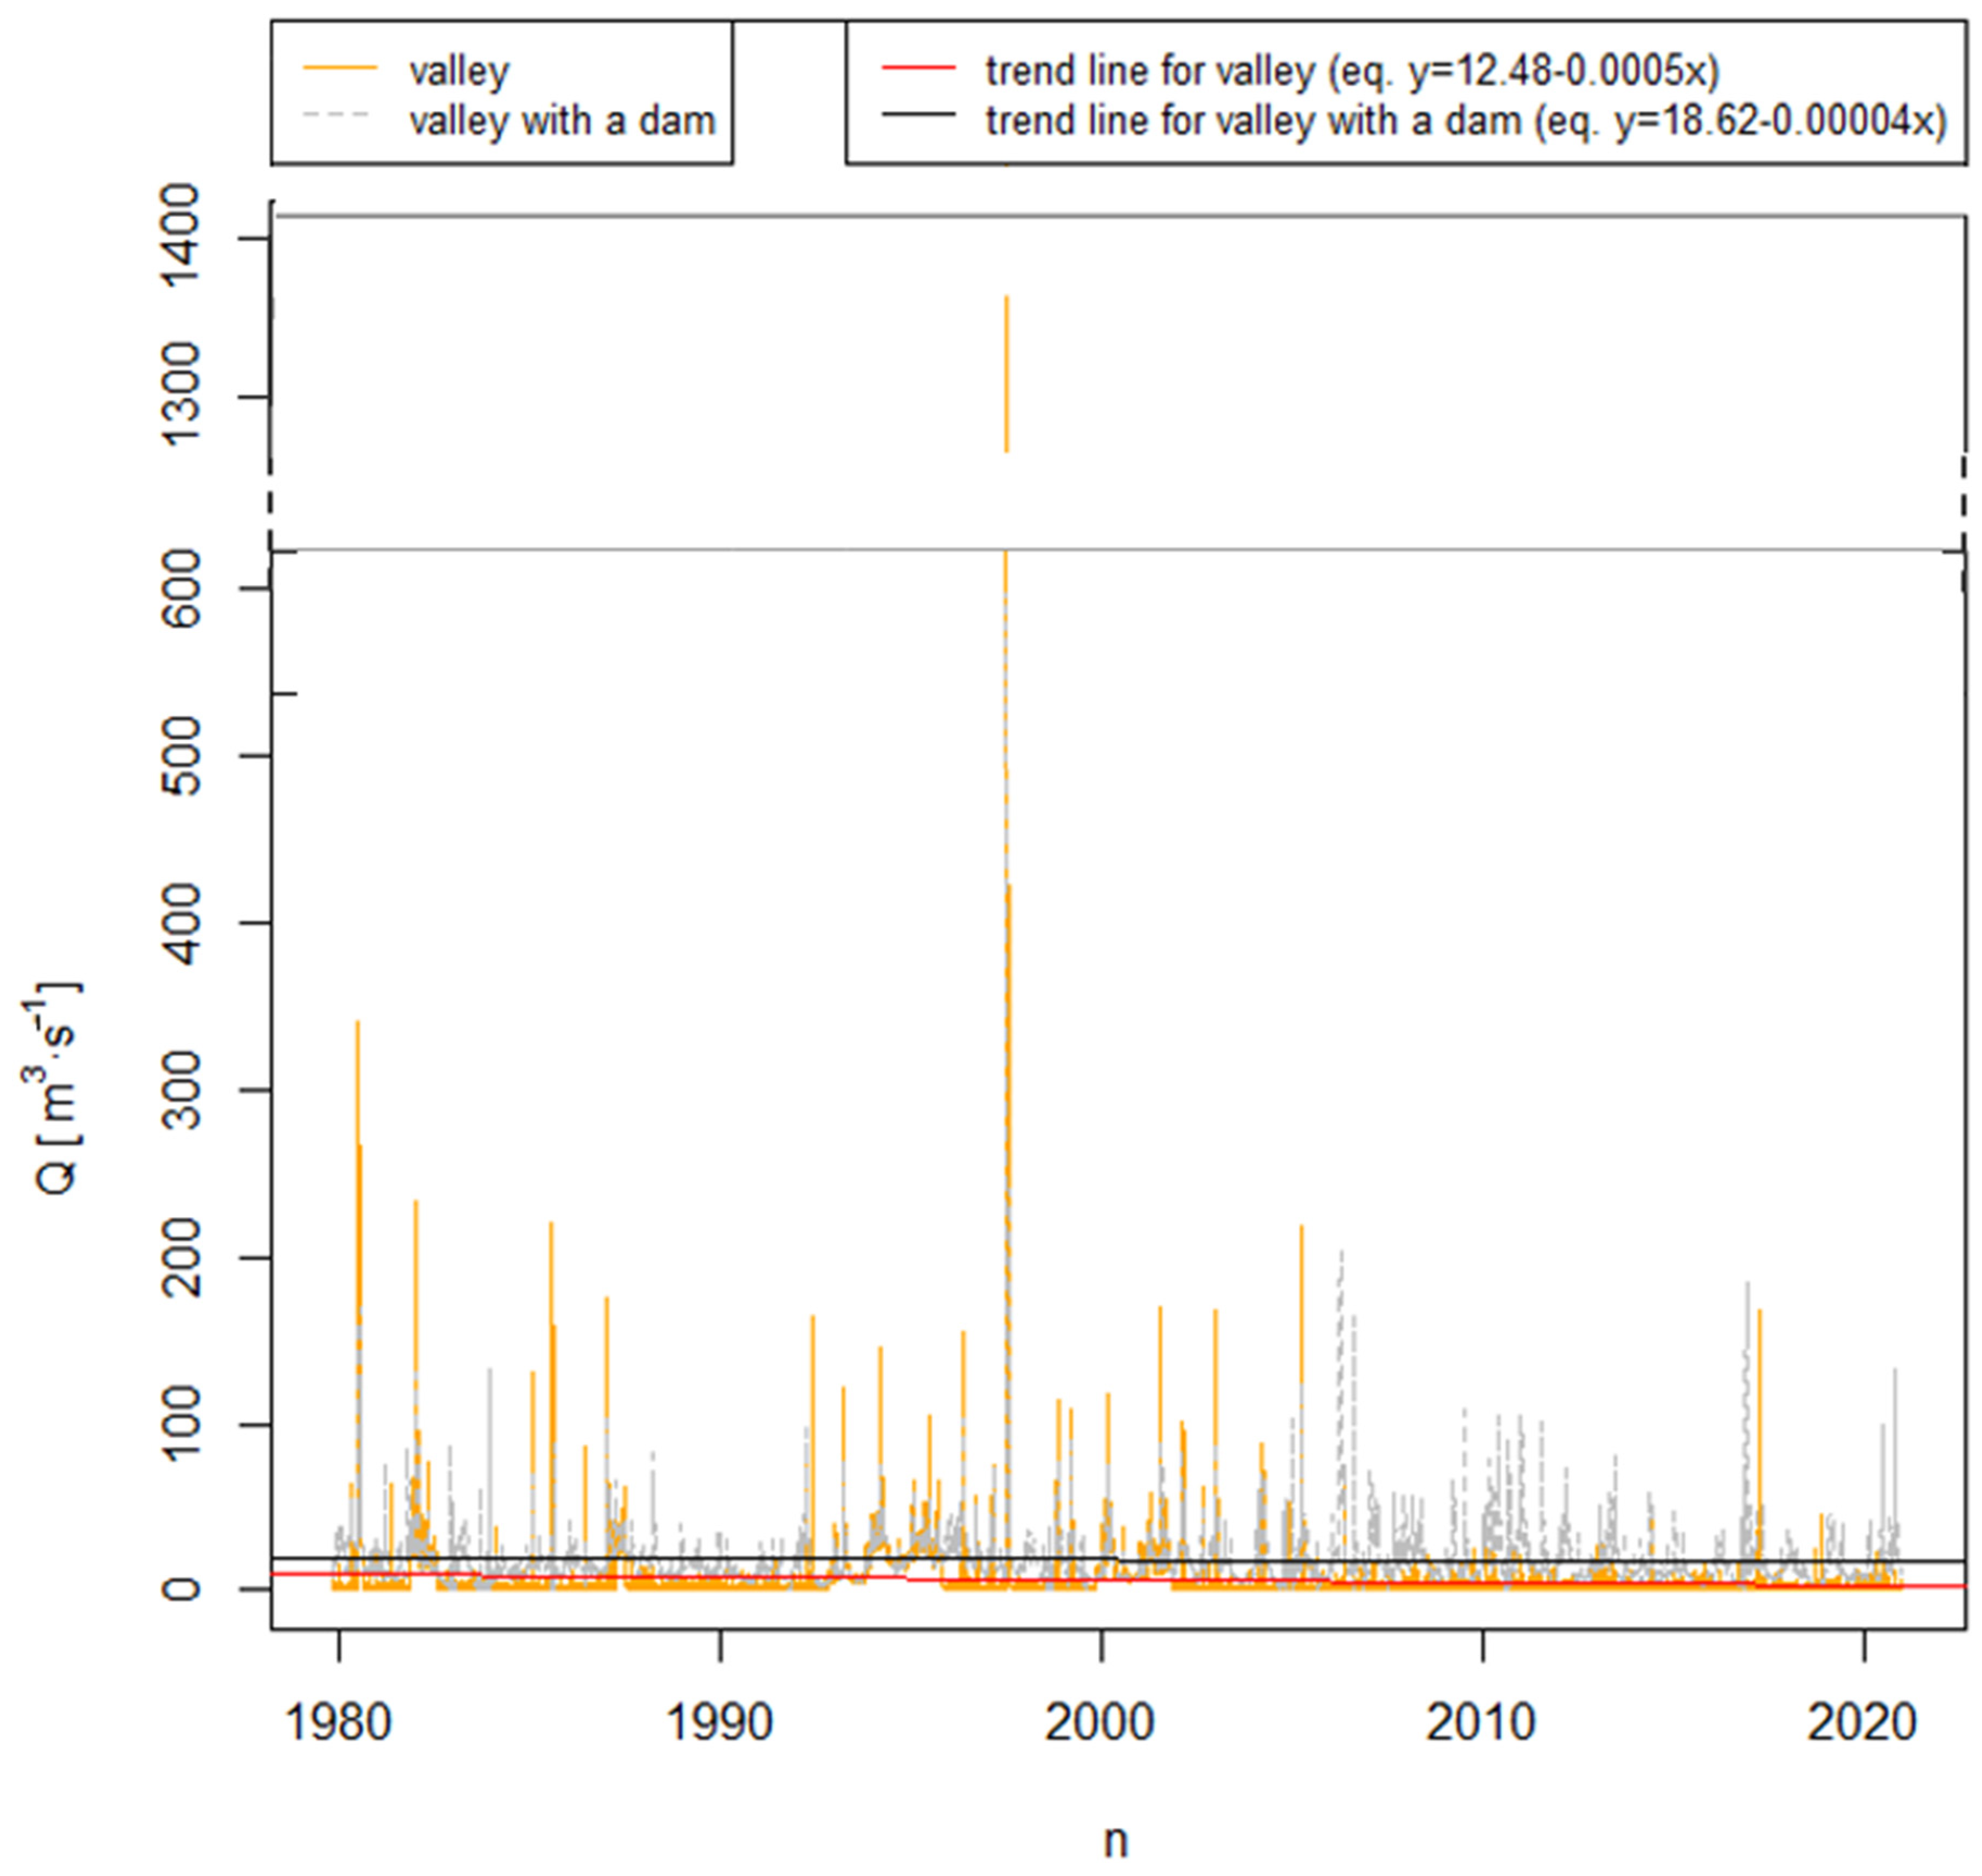
A model of the Nysa Kłodzka river valley was developed, covering a length of 12.12 km, extending from the Bardo profile (cross-section number 3727) to section no. 85, hereinafter referred to as pre-dam. Hydrological data were inputted and flow simulations were performed through the valley model. Additionally, a second model was created that incorporated the proposed Kamieniec Ząbkowicki reservoir. In this model, flow values were analyzed at the same cross-section no. 85; however, a dam above this cross-section was included; hence, it will be referred to as post-dam. Hydrological data were also inputted for this model, followed by calibration and validation and flow simulations through the valley model. Flow data spanning 1980 to 2020 were presented for both HEC-RAS models (Figure 2 and Figure 3). The plot shows flows in the period 1980–2020 (Figure 5). The X-axis represents years and the Y-axis represents flows. The valley series means data from HEC-RAS simulations before the construction of the reservoir (orange color, pre-dam) and the valley with dam series means data after the construction of the reservoir (grey color, post-dam). In particular, the flow values for the pre-dam model, for most of the analyzed period, are lower (orange points) compared to the post-dam model (gray points) (Figure 5). Additionally, there is a noticeable time shift in the flow, as clearly seen in the maximum flow values. Most of the maximum flow rates during the pre-dam period were higher than during the post-dam period (Figure 5). This is consistent with ref. [24], which recorded a reduction in the extreme maximum and minimum flows after the construction of a dam reservoir, but the mean flows, including environmental flows, did not change. In turn, ref. [59] reported a varied impact of reservoirs on flows in the downstream direction that are closely associated with the regulating activities of the reservoirs. However, those studies indicate the beneficial effect of existing reservoirs and the construction of new dam reservoirs on regional water resource management and the restoration of eco-environmental systems. Another study also indicates that the average water flow in the river increased in the downstream direction of the constructed reservoir dam [41]. However, abnormal anthropogenic activity can cause water shortage below the reservoir [45].
The variance for the pre-dam period is calculated as 355.5. The variance for the post-dam period is calculated as 280.7. A lower variance in this period indicates that the data points are relatively closer to the mean, indicating reduced dispersion compared to the pre-dam period. The data points in the pre-dam period have a higher dispersion from the mean.
Regarding the equations for both periods, the pre-dam (p-value < 0.0001) and post-dam (p-value < 0.0001) regression lines are negative. The constant term (intercept) in the equation for the post-dam period is higher (18.62) compared to the equation for the pre-dam period (12.48). The slope (coefficient of x) in the post-dam equation is smaller (in absolute value) than in the pre-dam equation. This indicates that the relationship between x and y in the post-dam equation is less steep than the relationship between x and y in the pre-dam equation. While both equations show a negative linear relationship, the post-dam equation has a higher intercept and a shallower slope than the pre-dam equation, suggesting that the change in the post-dam equation is less pronounced for the same change in x compared to the pre-dam equation.
Analyzing the Mann–Kendall trend test for a 40-year flow series before and after the construction of a dam reservoir can help determine whether the presence of the reservoir has had a significant impact on the flow of water (Table 2). In the pre-dam period, the magnitude of the statistic is −0.14, which indicates a relatively stronger negative trend in the data. In turn, in the post-dam period, the magnitude of the statistic is −0.05 and a significant reduction in the negative value of this statistic was recorded, as the S statistic began to approach 0, which suggests a weaker negative trend compared to the pre-dam period. This indicates the adaptive action of the reservoir dam in response to climate change. This is in line with the research results of [41,60].
The results obtained by the Mann–Kendall test were further confirmed by other tests commonly used in similar analyses of the impact of adaptive actions to climate change, such as the Sen slope test and ITA (Table 2). Another study using the Mann–Kendall test and ITA showed that hydraulic structure has a significant impact on flow changes because the maximum discharge and annual minimum discharge were insignificant below the hydraulic structure (Dubrava dam) [52].
In other studies, the analysis of flow during dry and wet seasons after dam construction indicates that the negative flow trend after dam construction of the dam decreased, and the negative trend during the dry season turned positive, which is associated with the human regulation of dam outflow [41]. Similar results for the Mediterranean region were recorded in another study, where the annual hydrograph exhibited an inversion, indicating a high-flow period during low precipitation months (summer) and a low-flow period during the wet season [24].
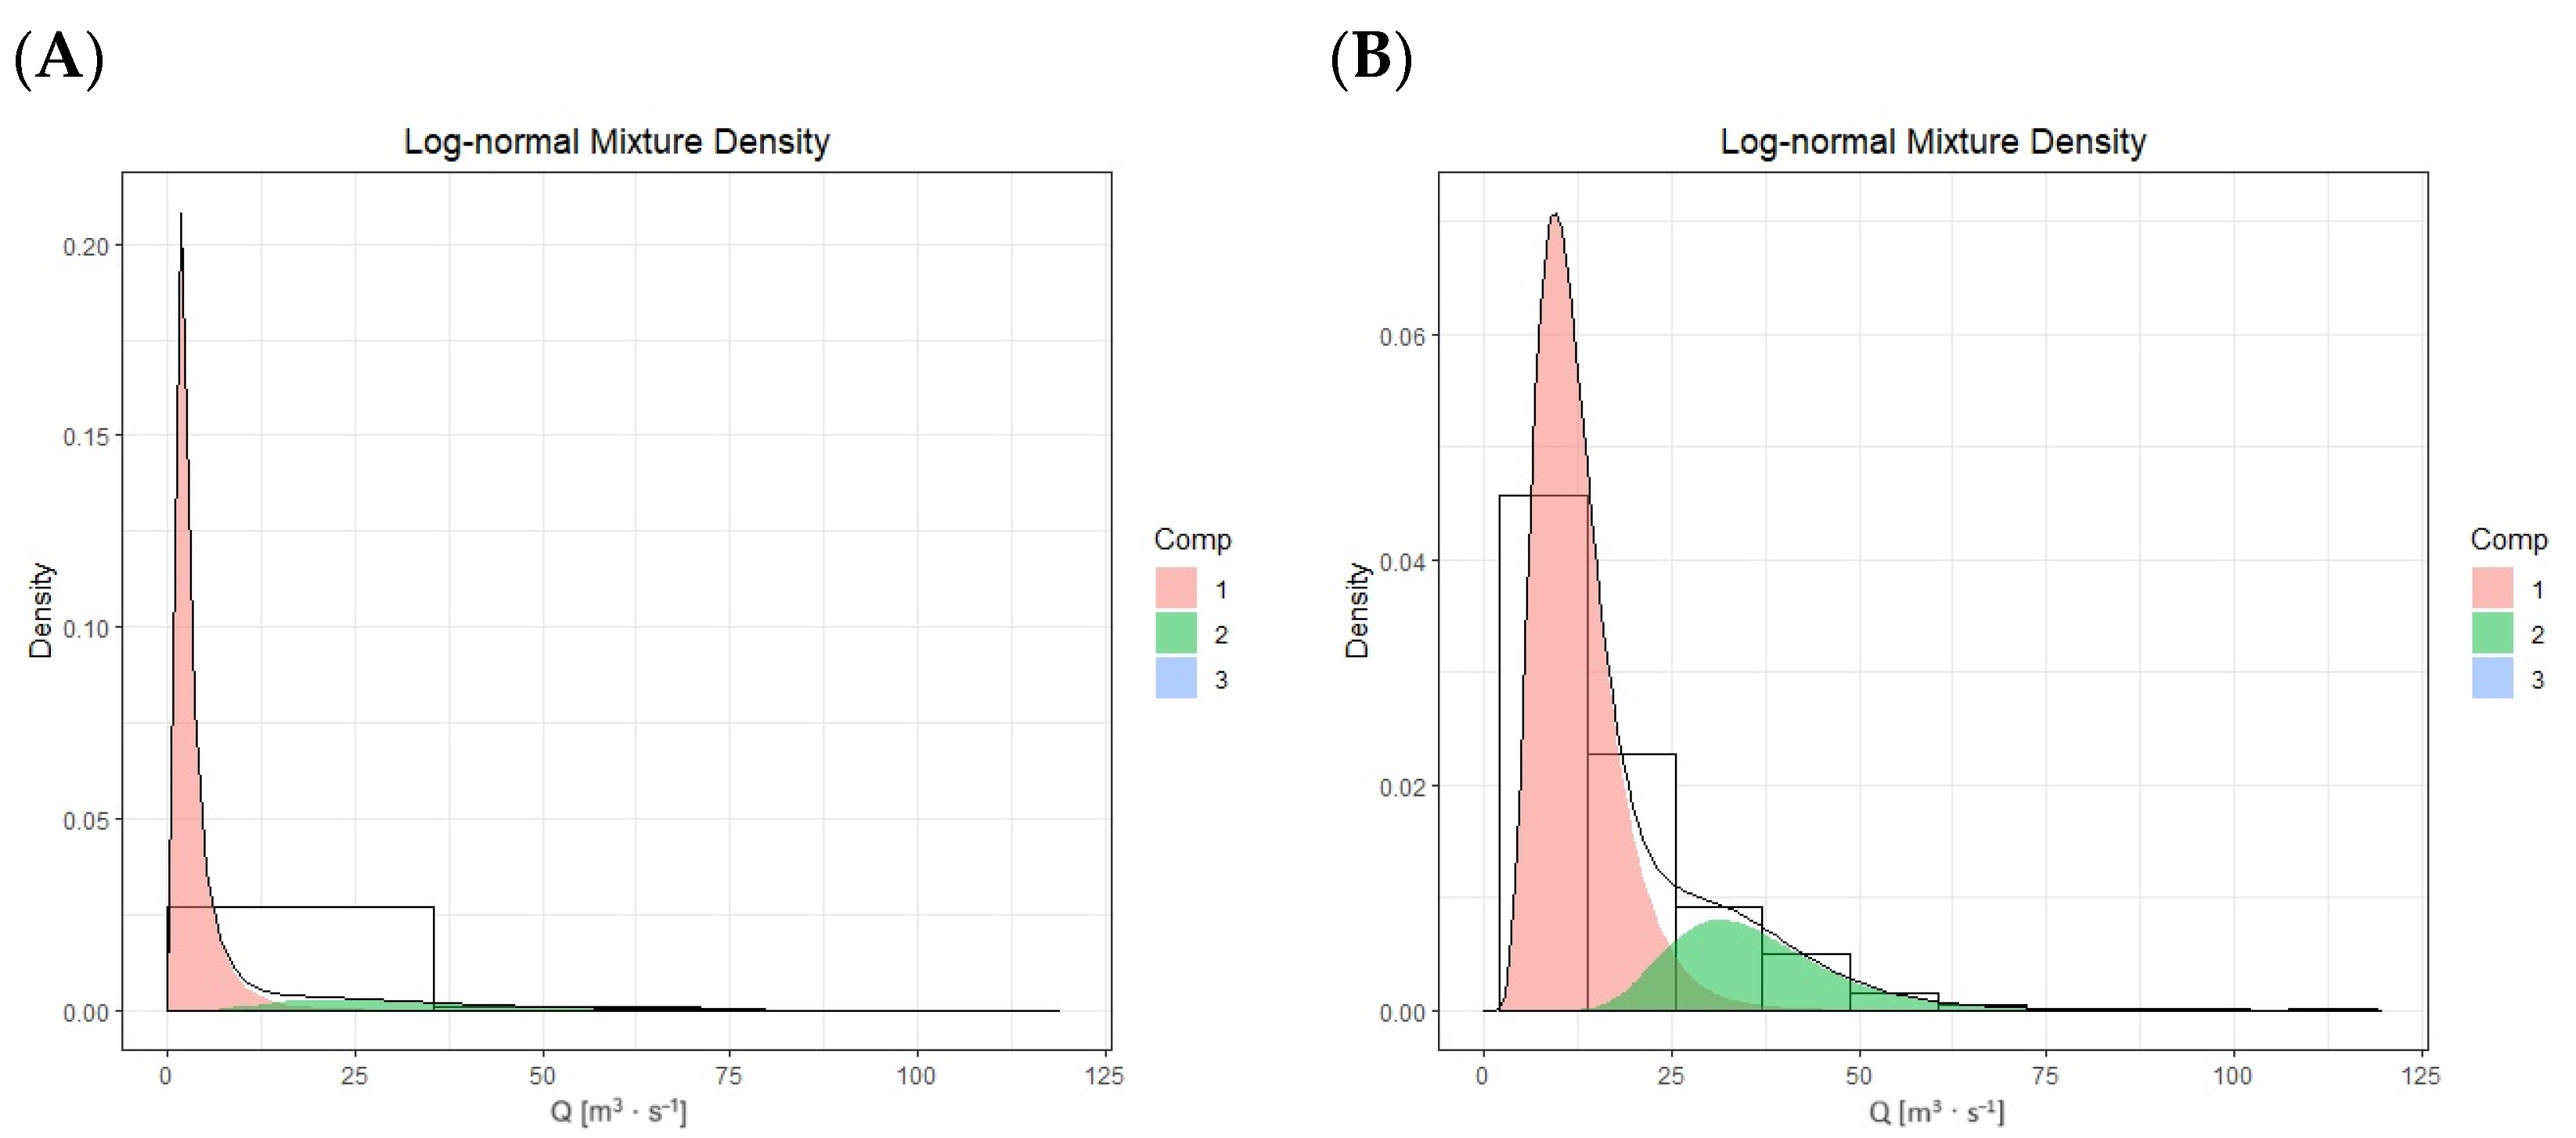
The composition of the log-normal mixture models changed between the “pre-dam” and “post-dam” periods, with shifts in the proportions, means, and standard deviations for the three components (Figure 6, Table 3).
After the construction of the dam (post-dam period), the parameters of the three components had changed compared to the pre-dam period. The proportions of all components were shifted.
Component 1 continued to be dominant in both periods (pre-dam and post-dam), representing low-flow conditions. Component 1 remained the largest contributor, but had a decreased proportion (from 0.893 to 0.780), an increased mean (from 2.725 to 12.219), and a decreased standard deviation (from 3.422 to 5.428). Component 1 shifted to a higher mean and a lower standard deviation. This suggests an increase in the central tendency of the flow data, indicating higher sustained flow levels compared to the pre-dam period.
Component 2 represented moderate to medium-flow conditions. Component 2 had an increased proportion (from 0.106 to 0.212), an decreased mean (from 35.943 to 35.674), and a decreased standard deviation (from 22.217 to 11.312).
Component 3 represented extreme or high-flow conditions. Component 3, while still the smallest contributor, had an increased proportion (from 0.0005 to 0.008), a reduced mean (from 519.56 to 128.30), and a decreased standard deviation (from 378.77 to 65.801). This indicated a reduction in the variability of extreme high-flow conditions. The means of Component 1 and Component 3 changed significantly, while the mean of Component 2 remained relatively stable. The construction of the dam caused changes in the standard deviations of the components, with some components experiencing reduced variability.
Dam construction has impacted the flow regime by increasing sustained flow levels, possibly due to flow regulation, and reducing variability in extreme high-flow events. These changes reflect the influence of the dam on the river’s hydrology and the regulation of flow patterns in the post-dam period.
The operation of the dam has resulted in the reduction in extreme high-flow variability, as seen in the significant changes in Component 3. This implies that the dam is effective at controlling and limiting extreme flood events, potentially providing flood protection benefits downstream. Component 1’s increased mean and decreased SD values indicate a shift towards more consistent and sustained flow levels after the dam construction. This suggests that the main role of the dam is to regulate and stabilize the flow, which can be beneficial for the management of water resources and mitigating flood risks. Component 2 represents moderate-flow conditions that appear relatively stable and similar before and after dam construction. This indicates that the primary impact of the dam is on extreme events and low flows. This is in line with the research results of [41,60]. Analyses of flow changes caused by the dam should be conducted before the dam construction to determine whether the dam construction will not worsen the flow conditions below the impounding structure [24,45]. Another study from the same country shows that the environmental and fluvial morphology impacts of dams could be mitigated through careful site selection and operational practices [20]. The dam reduced water supply and sediment transport compared to the pre-dam situation. Upstream, the river flow regime remains almost similar to the pre-dam state, with insignificant changes in hydraulic parameters. In the downstream area during the wet season, water is stored behind the dam, maintaining consistent water supply in both wet and dry seasons [20].
The results obtained by mixed distribution before and after the construction of the reservoir confirm the results obtained on the hydrograph (Figure 5). The river has a snow–rain regime [61] and is fed by snowmelt floods, rainfall floods and their mixtures. Similar results for such river feeding were obtained by [62], in which a mixed model was used that also comprised three components, distinguishing low, medium, and high flows, reflecting significant hydrological variables such as rainfall and stream flow. These components were treated as if the data records originated from three distinct populations.
While the direct influence of the dam on flows is evident, it is important to consider how climate change might impact the river regime without dam reservoirs and with dam reservoirs. The reason for dam construction was related to the need to adapt to changing local hydrological conditions, which are influenced by climate change (increased frequency of floods and prolonged droughts). This is consistent with the study [63] in which the regulation of river flows by dam reservoirs mitigated climate-driven alteration in both rivers with a positive and negative trend. Water infrastructures should also be strategically planned with consideration for future variations in meteorological processes from a hydrological perspective [64]. Hence, the operation of the dam can be seen as a local response to the changing hydrological conditions influenced by climate change. Changes in flow characteristics observed post-dam may reflect a local response to mitigate the impact of climate-related fluctuations in flow, i.e., stabilize flow levels, protect against flooding, ensure a more reliable water supply, and support local ecosystems.

4. Conclusions

The flow analysis for the Nysa Kłodzka river, carried out using the valley model (pre-dam) and the valley model with the Kamieniec Ząbkowicki reservoir dam (post-dam), reveals significant differences in flows. It is worth noting that flow values in the model without the dam generally have lower flow values compared to the model with the dam, with a noticeable time shift in the maximum flow values and their reduction.
Regression analysis and the Mann–Kendall trend test reveal that the presence of the dam reservoir has led to changes in the river’s flow dynamics, increasing the value of downstream flow.
The composition of the log-normal mixture models changed after dam construction. Component 1, representing low-flow conditions, remained dominant in both periods, but underwent shifts in proportion, mean, and standard deviation. Components 2 and 3, representing moderate and high-flow conditions, also exhibited notable changes.
Dam construction influenced the flow regime, increasing sustained flow levels and reducing variability in extremely high flows. This reflects the role of the dam in regulating flow patterns, providing potential benefits in mitigating flood risk and stabilizing water resources.
Dam operation is closely associated with adapting to changing local hydrological conditions, which are influenced by climate change. It is important to note that the presence of a dam reservoir can help mitigate climate-induced changes in river flows, providing stability and protection against extreme events. Simulation of the changes in flow characteristics after dam construction indicates a local response to climate fluctuations, increasing the reliability of water supplies and supporting local ecosystems.
These conclusions suggest that the construction of the Kamieniec Ząbkowicki dam reservoir may have a significant impact on river flow dynamics, helping to regulate and stabilize flows, especially in response to the changes caused by climate change, but this will depend on flow regulation by the reservoir administration.

Author Contributions

Conceptualization, M.W., Ł.G. and M.P.; methodology, Ł.G.; software, Ł.G. and M.P.; validation, M.W., Ł. S. and P.T.; formal analysis, Ł.G.; investigation, Ł.G.; resources, Ł.G., M.P., Ł.S. and P.T.; data curation, Ł.G., M.P. and Ł.S.; writing—original draft preparation, Ł.G. and M.W.; writing—review and editing, M.W., Ł.G. and P.T.; visualization, Ł.G., M.P. and P.T.; supervision, M.W. All authors have read and agreed to the published version of the manuscript.

Funding

This research received no external funding.

Data Availability Statement

The dataset analyzed in this study is publicly available. These data can be found at the Institute of Meteorology and Water Management—National Research Institute (IMWM-NRI) (https://danepubliczne.imgw.pl, accessed on 10 July 2023). The data presented in this study are also available upon request from the corresponding author.

Acknowledgments

The authors would like to express their sincere gratitude to the State Water Holding Polish Waters-Regional Water Management Authority in Wrocław for the release of the dam parameters and the Institute of Meteorology and Water Management—National Research Institute in Warsaw for the release of the flow data.

Conflicts of Interest

The authors declare no conflict of interest.

References

  1. Hunt, K.M.R.; Menon, A. The 2018 Kerala Floods: A Climate Change Perspective. Clim. Dyn. 2020, 54, 2433–2446. [Google Scholar] [CrossRef]
  2. Rudd, A.C.; Kay, A.L.; Sayers, P.B. Climate Change Impacts on Flood Peaks in Britain for a Range of Global Mean Surface Temperature Changes. J. Flood Risk Manag. 2023, 16, e12863. [Google Scholar] [CrossRef]
  3. Barbhuiya, S.; Ramadas, M.; Biswal, S.S. Nonstationary Flood Frequency Analysis: Review of Methods and Models. In River, Sediment and Hydrological Extremes: Causes, Impacts and Management; Pandey, M., Gupta, A.K., Oliveto, G., Eds.; Disaster Resilience and Green Growth; Springer Nature Singapore: Singapore, 2023; pp. 271–288. ISBN 978-981-9948-10-9. [Google Scholar]
  4. Stathi, E.; Kastridis, A.; Myronidis, D. Analysis of Hydrometeorological Characteristics and Water Demand in Semi-Arid Mediterranean Catchments under Water Deficit Conditions. Climate 2023, 11, 137. [Google Scholar] [CrossRef]
  5. Van Dyck, J.; Willems, P. Probabilistic Flood Risk Assessment over Large Geographical Regions: Probabilistic Flood Risk. Water Resour. Res. 2013, 49, 3330–3344. [Google Scholar] [CrossRef]
  6. Kreibich, H.; Van Loon, A.F.; Schröter, K.; Ward, P.J.; Mazzoleni, M.; Sairam, N.; Abeshu, G.W.; Agafonova, S.; AghaKouchak, A.; Aksoy, H.; et al. The Challenge of Unprecedented Floods and Droughts in Risk Management. Nature 2022, 608, 80–86. [Google Scholar] [CrossRef]
  7. Turner, S.W.D.; Ng, J.Y.; Galelli, S. Examining Global Electricity Supply Vulnerability to Climate Change Using a High-Fidelity Hydropower Dam Model. Sci. Total Environ. 2017, 590–591, 663–675. [Google Scholar] [CrossRef] [PubMed]
  8. Park, J.Y.; Kim, S.J. Potential Impacts of Climate Change on the Reliability of Water and Hydropower Supply from a Multipurpose Dam in South Korea. J. Am. Water Resour. Assoc. 2014, 50, 1273–1288. [Google Scholar] [CrossRef]
  9. Nazari-Sharabian, M.; Taheriyoun, M.; Ahmad, S.; Karakouzian, M.; Ahmadi, A. Water Quality Modeling of Mahabad Dam Watershed–Reservoir System under Climate Change Conditions, Using SWAT and System Dynamics. Water 2019, 11, 394. [Google Scholar] [CrossRef]
  10. Kang, B.; Lee, S.-J.; Kang, D.-H.; Kim, Y.-O. A Flood Risk Projection for Yongdam Dam against Future Climate Change. J. Hydro-Environ. Res. 2007, 1, 118–125. [Google Scholar] [CrossRef]
  11. Boulange, J.; Hanasaki, N.; Yamazaki, D.; Pokhrel, Y. Role of Dams in Reducing Global Flood Exposure under Climate Change. Nat. Commun. 2021, 12, 417. [Google Scholar] [CrossRef]
  12. Blöschl, G.; Hall, J.; Viglione, A.; Perdigão, R.A.P.; Parajka, J.; Merz, B.; Lun, D.; Arheimer, B.; Aronica, G.T.; Bilibashi, A.; et al. Changing Climate Both Increases and Decreases European River Floods. Nature 2019, 573, 108–111. [Google Scholar] [CrossRef] [PubMed]
  13. Rizwan, M.; Li, X.; Chen, Y.; Anjum, L.; Hamid, S.; Yamin, M.; Chauhdary, J.N.; Shahid, M.A.; Mehmood, Q. Simulating Future Flood Risks under Climate Change in the Source Region of the Indus River. J. Flood Risk Manag. 2023, 16, e12857. [Google Scholar] [CrossRef]
  14. Yun, X.; Tang, Q.; Wang, J.; Liu, X.; Zhang, Y.; Lu, H.; Wang, Y.; Zhang, L.; Chen, D. Impacts of Climate Change and Reservoir Operation on Streamflow and Flood Characteristics in the Lancang-Mekong River Basin. J. Hydrol. 2020, 590, 125472. [Google Scholar] [CrossRef]
  15. Zhao, Y.; Liu, S.; Shi, H. Impacts of Dams and Reservoirs on Local Climate Change: A Global Perspective. Environ. Res. Lett. 2021, 16, 104043. [Google Scholar] [CrossRef]
  16. Sun, L.; Jaramillo, F.; Cai, Y.; Zhou, Y.; Shi, S.; Zhao, Y.; Wang, W.; Yi, Y.; Yang, W.; Yang, Z.; et al. Exploring the Influence of Reservoir Impoundment on Surrounding Tree Growth. Adv. Water Resour. 2021, 153, 103946. [Google Scholar] [CrossRef]
  17. Wiatkowski, M. Influence of Słup Dam Reservoir on Flow and Quality of Water in the Nysa Szalona River. Pol. J. Environ. Stud. 2011, 20, 469–478. [Google Scholar]
  18. Gruss, Ł.; Głowski, R.; Wiatkowski, M. Modeling of Water Flows through a Designed Dry Dam Using the HEC-RAS Program. ITM Web Conf. 2018, 23, 9. [Google Scholar] [CrossRef]
  19. Arantes, C.C.; Fitzgerald, D.B.; Hoeinghaus, D.J.; Winemiller, K.O. Impacts of Hydroelectric Dams on Fishes and Fisheries in Tropical Rivers through the Lens of Functional Traits. Curr. Opin. Environ. Sustain. 2019, 37, 28–40. [Google Scholar] [CrossRef]
  20. Ashouri, M.; Piry, Z.; Rezaei Moghaddam, M.H. A Comparison of the Influence of the Sattarkhan Reservoir Dam on the Upstream and Downstream of the Ahar Chai River, NW Iran. Environ. Earth Sci. 2015, 73, 4099–4108. [Google Scholar] [CrossRef]
  21. Mamun, M.; Kim, J.Y.; An, K.-G. Multivariate Statistical Analysis of Water Quality and Trophic State in an Artificial Dam Reservoir. Water 2021, 13, 186. [Google Scholar] [CrossRef]
  22. Tomczyk, P.; Gałka, B.; Wiatkowski, M.; Wdowczyk, A.; Gruss, Ł. Toxicity Studies on Sediments near Hydropower Plants on the Ślęza and Bystrzyca Rivers, Poland, to Establish Their Potential for Use for Soil Enrichment. Land. Degrad. Dev. 2022, 33, 756–770. [Google Scholar] [CrossRef]
  23. Hoque, M.M.; Islam, A.; Ghosh, S. Environmental Flow in the Context of Dams and Development with Special Reference to the Damodar Valley Project, India: A Review. Sustain. Water Resour. Manag. 2022, 8, 62. [Google Scholar] [CrossRef] [PubMed]
  24. Mezger, G.; González Del Tánago, M.; De Stefano, L. Environmental Flows and the Mitigation of Hydrological Alteration Downstream from Dams: The Spanish Case. J. Hydrol. 2021, 598, 125732. [Google Scholar] [CrossRef]
  25. Li, Y.; Wen, Z.; Schneidewind, U.; Liu, H.; Krause, S. Effects of a Large-Scale Dam Structure on Upstream and Downstream Lateral Hyporheic Exchange and Residence Time Distributions—The Xinglong Water Conservancy Dam, China. J. Hydrol. 2023, 625, 130073. [Google Scholar] [CrossRef]
  26. Mailhot, A.; Talbot, G.; Ricard, S.; Turcotte, R.; Guinard, K. Assessing the Potential Impacts of Dam Operation on Daily Flow at Ungauged River Reaches. J. Hydrol. Reg. Stud. 2018, 18, 156–167. [Google Scholar] [CrossRef]
  27. Amirataee, B.; Montaseri, M. Joint Probability Analysis of Storage Reservoir System Characteristics. J. Hydrol. 2023, 622, 129753. [Google Scholar] [CrossRef]
  28. Turner, S.W.D.; Galelli, S. Regime-shifting Streamflow Processes: Implications for Water Supply Reservoir Operations. Water Resour. Res. 2016, 52, 3984–4002. [Google Scholar] [CrossRef]
  29. Yan, L.; Xiong, L.; Liu, D.; Hu, T.; Xu, C. Frequency Analysis of Nonstationary Annual Maximum Flood Series Using the Time-varying Two-component Mixture Distributions. Hydrol. Process. 2017, 31, 69–89. [Google Scholar] [CrossRef]
  30. Evin, G.; Merleau, J.; Perreault, L. Two-component Mixtures of Normal, Gamma, and Gumbel Distributions for Hydrological Applications. Water Resour. Res. 2011, 47, 2010WR010266. [Google Scholar] [CrossRef]
  31. Smith, J.A.; Villarini, G.; Baeck, M.L. Mixture Distributions and the Hydroclimatology of Extreme Rainfall and Flooding in the Eastern United States. J. Hydrometeorol. 2011, 12, 294–309. [Google Scholar] [CrossRef]
  32. Bowers, M.C.; Tung, W.W.; Gao, J.B. On the Distributions of Seasonal River Flows: Lognormal or Power Law? Water Resour. Res. 2012, 48, 2011WR011308. [Google Scholar] [CrossRef]
  33. Gruss, Ł.; Wiatkowski, M.; Tomczyk, P.; Pollert, J.; Pollert, J. Comparison of Three-Parameter Distributions in Controlled Catchments for a Stationary and Non-Stationary Data Series. Water 2022, 14, 293. [Google Scholar] [CrossRef]
  34. Bezak, N.; Brilly, M.; Šraj, M. Comparison between the Peaks-over-Threshold Method and the Annual Maximum Method for Flood Frequency Analysis. Hydrol. Sci. J. 2014, 59, 959–977. [Google Scholar] [CrossRef]
  35. Gottschalk, L.; Krasovskaia, I.; Yu, K.; Leblois, E.; Xiong, L. Joint Mapping of Statistical Streamflow Descriptors. J. Hydrol. 2013, 478, 15–28. [Google Scholar] [CrossRef]
  36. Sangal, B.P.; Biswas, A.K. The 3-Parameter Lognormal Distribution and Its Applications in Hydrology. Water Resour. Res. 1970, 6, 505–515. [Google Scholar] [CrossRef]
  37. Młyński, D.; Wałęga, A.; Ozga-Zielinski, B.; Ciupak, M.; Petroselli, A. New Approach for Determining the Quantiles of Maximum Annual Flows in Ungauged Catchments Using the EBA4SUB Model. J. Hydrol. 2020, 589, 125198. [Google Scholar] [CrossRef]
  38. Adamson, M.J.; Dixon, P.T. On the Application of Mixtures of Two Log-Normal Distributions to the Analysis of Water Quality Data. Water SA 1983, 9, 1–8. [Google Scholar]
  39. Gruss, Ł.; Wiatkowski, M.; Buta, B.; Tomczyk, P. Verification of the Methods for Calculating the Probable Maximum Flow in the Widawa River in the Aspect of Water Management in the Michalice Reservoir. Annu. Set. Environ. Prot. 2019, 21, 566–585. [Google Scholar]
  40. Ma, Q.; Zhang, J.; Xiong, B.; Zhang, Y.; Ji, C.; Zhou, T. Quantifying the Risks That Propagate from the Inflow Forecast Uncertainty to the Reservoir Operations with Coupled Flood and Electricity Curtailment Risks. Water 2021, 13, 173. [Google Scholar] [CrossRef]
  41. Pirnia, A.; Golshan, M.; Darabi, H.; Adamowski, J.; Rozbeh, S. Using the Mann–Kendall Test and Double Mass Curve Method to Explore Stream Flow Changes in Response to Climate and Human Activities. J. Water Clim. Change 2019, 10, 725–742. [Google Scholar] [CrossRef]
  42. Talukdar, S.; Pal, S.; Shahfahad; Naikoo, M.W.; Parvez, A.; Rahman, A. Trend Analysis and Forecasting of Streamflow Using Random Forest in the Punarbhaba River Basin. Environ. Monit. Assess. 2023, 195, 153. [Google Scholar] [CrossRef] [PubMed]
  43. Ali, R.; Kuriqi, A.; Abubaker, S.; Kisi, O. Long-Term Trends and Seasonality Detection of the Observed Flow in Yangtze River Using Mann-Kendall and Sen’s Innovative Trend Method. Water 2019, 11, 1855. [Google Scholar] [CrossRef]
  44. Fentaw, F.; Melesse, A.M.; Hailu, D.; Nigussie, A. Precipitation and Streamflow Variability in Tekeze River Basin, Ethiopia. In Extreme Hydrology and Climate Variability; Elsevier: Amsterdam, The Netherlands, 2019; pp. 103–121. ISBN 978-0-12-815998-9. [Google Scholar]
  45. Yaghmaei, H.; Sadeghi, S.H.; Moradi, H.; Gholamalifard, M. Effect of Dam Operation on Monthly and Annual Trends of Flow Discharge in the Qom Rood Watershed, Iran. J. Hydrol. 2018, 557, 254–264. [Google Scholar] [CrossRef]
  46. Norouzi, N. Climate Change Impacts on the Water Flow to the Reservoir of the Dez Dam Basin. Water Cycle 2020, 1, 113–120. [Google Scholar] [CrossRef]
  47. Li, F.-F.; Liu, C.-M.; Wu, Z.-G.; Qiu, J. Balancing Ecological Requirements and Power Generation in Reservoir Operation in Fish Spawning Seasons. J. Water Resour. Plann. Manage. 2020, 146, 04020074. [Google Scholar] [CrossRef]
  48. Brown, C.A.; King, J.M. Implications of Upstream Water Uses on Downstream Ecosystems and Livelihoods. Int. J. Ecol. Environ. Sci. 2006, 32, 99–108. [Google Scholar]
  49. Unitek Polska Feasibility Study. Kamieniec Ząbkowicki Reservoir on the Nysa Kłodzka River, Implemented as Part of the “Oder Program—2006”. Kamieniec Ząbkowicki Municipality: Bardo Municipality, Poland, 2004; unpublished work.
  50. Head Office of Geodesy and Cartography Geoportal. Access to Spatial Data Services in Poland on the Website. 2023. Available online: https://www.geoportal.gov.pl/en/ (accessed on 2 October 2023).
  51. The Institute of Meteorology and Water Management, the National Research Institute in Warsaw. Time Series of Flows of the Nysa Kłodzka River, Bardo Profile (1980–2020). 2023. Available online: https://danepubliczne.imgw.pl (accessed on 10 July 2023).
  52. Zakwan, M.; Pham, Q.B.; Bonacci, O.; Đurin, B. Application of Revised Innovative Trend Analysis in Lower Drava River. Arab. J. Geosci. 2022, 15, 758. [Google Scholar] [CrossRef]
  53. Pohlert, T. Non-Parametric Trend Tests and Change-Point Detection 2023. CC BY-ND 2016, 4, 1–18. [Google Scholar]
  54. Wang, Y.; Xu, Y.; Tabari, H.; Wang, J.; Wang, Q.; Song, S.; Hu, Z. Innovative Trend Analysis of Annual and Seasonal Rainfall in the Yangtze River Delta, Eastern China. Atmos. Res. 2020, 231, 104673. [Google Scholar] [CrossRef]
  55. Esit, M. Investigation of Innovative Trend Approaches (ITA with Significance Test and IPTA) Comparing to the Classical Trend Method of Monthly and Annual Hydrometeorological Variables: A Case Study of Ankara Region, Turkey. J. Water Clim. Change 2023, 14, 305–329. [Google Scholar] [CrossRef]
  56. Şen, Z. Innovative Trend Analysis Methodology. J. Hydrol. Eng. 2012, 17, 1042–1046. [Google Scholar] [CrossRef]
  57. Şen, Z. Innovative Trend Significance Test and Applications. Theor. Appl. Clim. 2017, 127, 939–947. [Google Scholar] [CrossRef]
  58. Yu, Y. Finite Mixture Modeling for Raw and Binned Data. R Package Version 0.2.0. 2021. Available online: https://cran.r-project.org/web/packages/mixR/index.html (accessed on 20 November 2023).
  59. Yang, T.; Zhang, Q.; Chen, Y.D.; Tao, X.; Xu, C.; Chen, X. A Spatial Assessment of Hydrologic Alteration Caused by Dam Construction in the Middle and Lower Yellow River, China. Hydrol. Process. 2008, 22, 3829–3843. [Google Scholar] [CrossRef]
  60. Kędra, M. Dam-Induced Changes in River Flow Dynamics Revealed by RQA. Eur. Phys. J. Spec. Top. 2023, 232, 209–215. [Google Scholar] [CrossRef]
  61. Perz, A.; Sobkowiak, L.; Wrzesiński, D. Probabilistic Approach to Precipitation-Runoff Relation in a Mountain Catchment: A Case Study of the Kłodzka Valley in Poland. Water 2021, 13, 1229. [Google Scholar] [CrossRef]
  62. Solari, S.; Losada, M.A. A Unified Statistical Model for Hydrological Variables Including the Selection of Threshold for the Peak over Threshold Method. Water Resour. Res. 2012, 48, 2011WR011475. [Google Scholar] [CrossRef]
  63. Chalise, D.R.; Sankarasubramanian, A.; Ruhi, A. Dams and Climate Interact to Alter River Flow Regimes Across the United States. Earth’s Future 2021, 9, e2020EF001816. [Google Scholar] [CrossRef]
  64. Mersin, D.; Tayfur, G.; Vaheddoost, B.; Safari, M.J.S. Historical Trends Associated with Annual Temperature and Precipitation in Aegean Turkey, Where Are We Heading? Sustainability 2022, 14, 13380. [Google Scholar] [CrossRef]
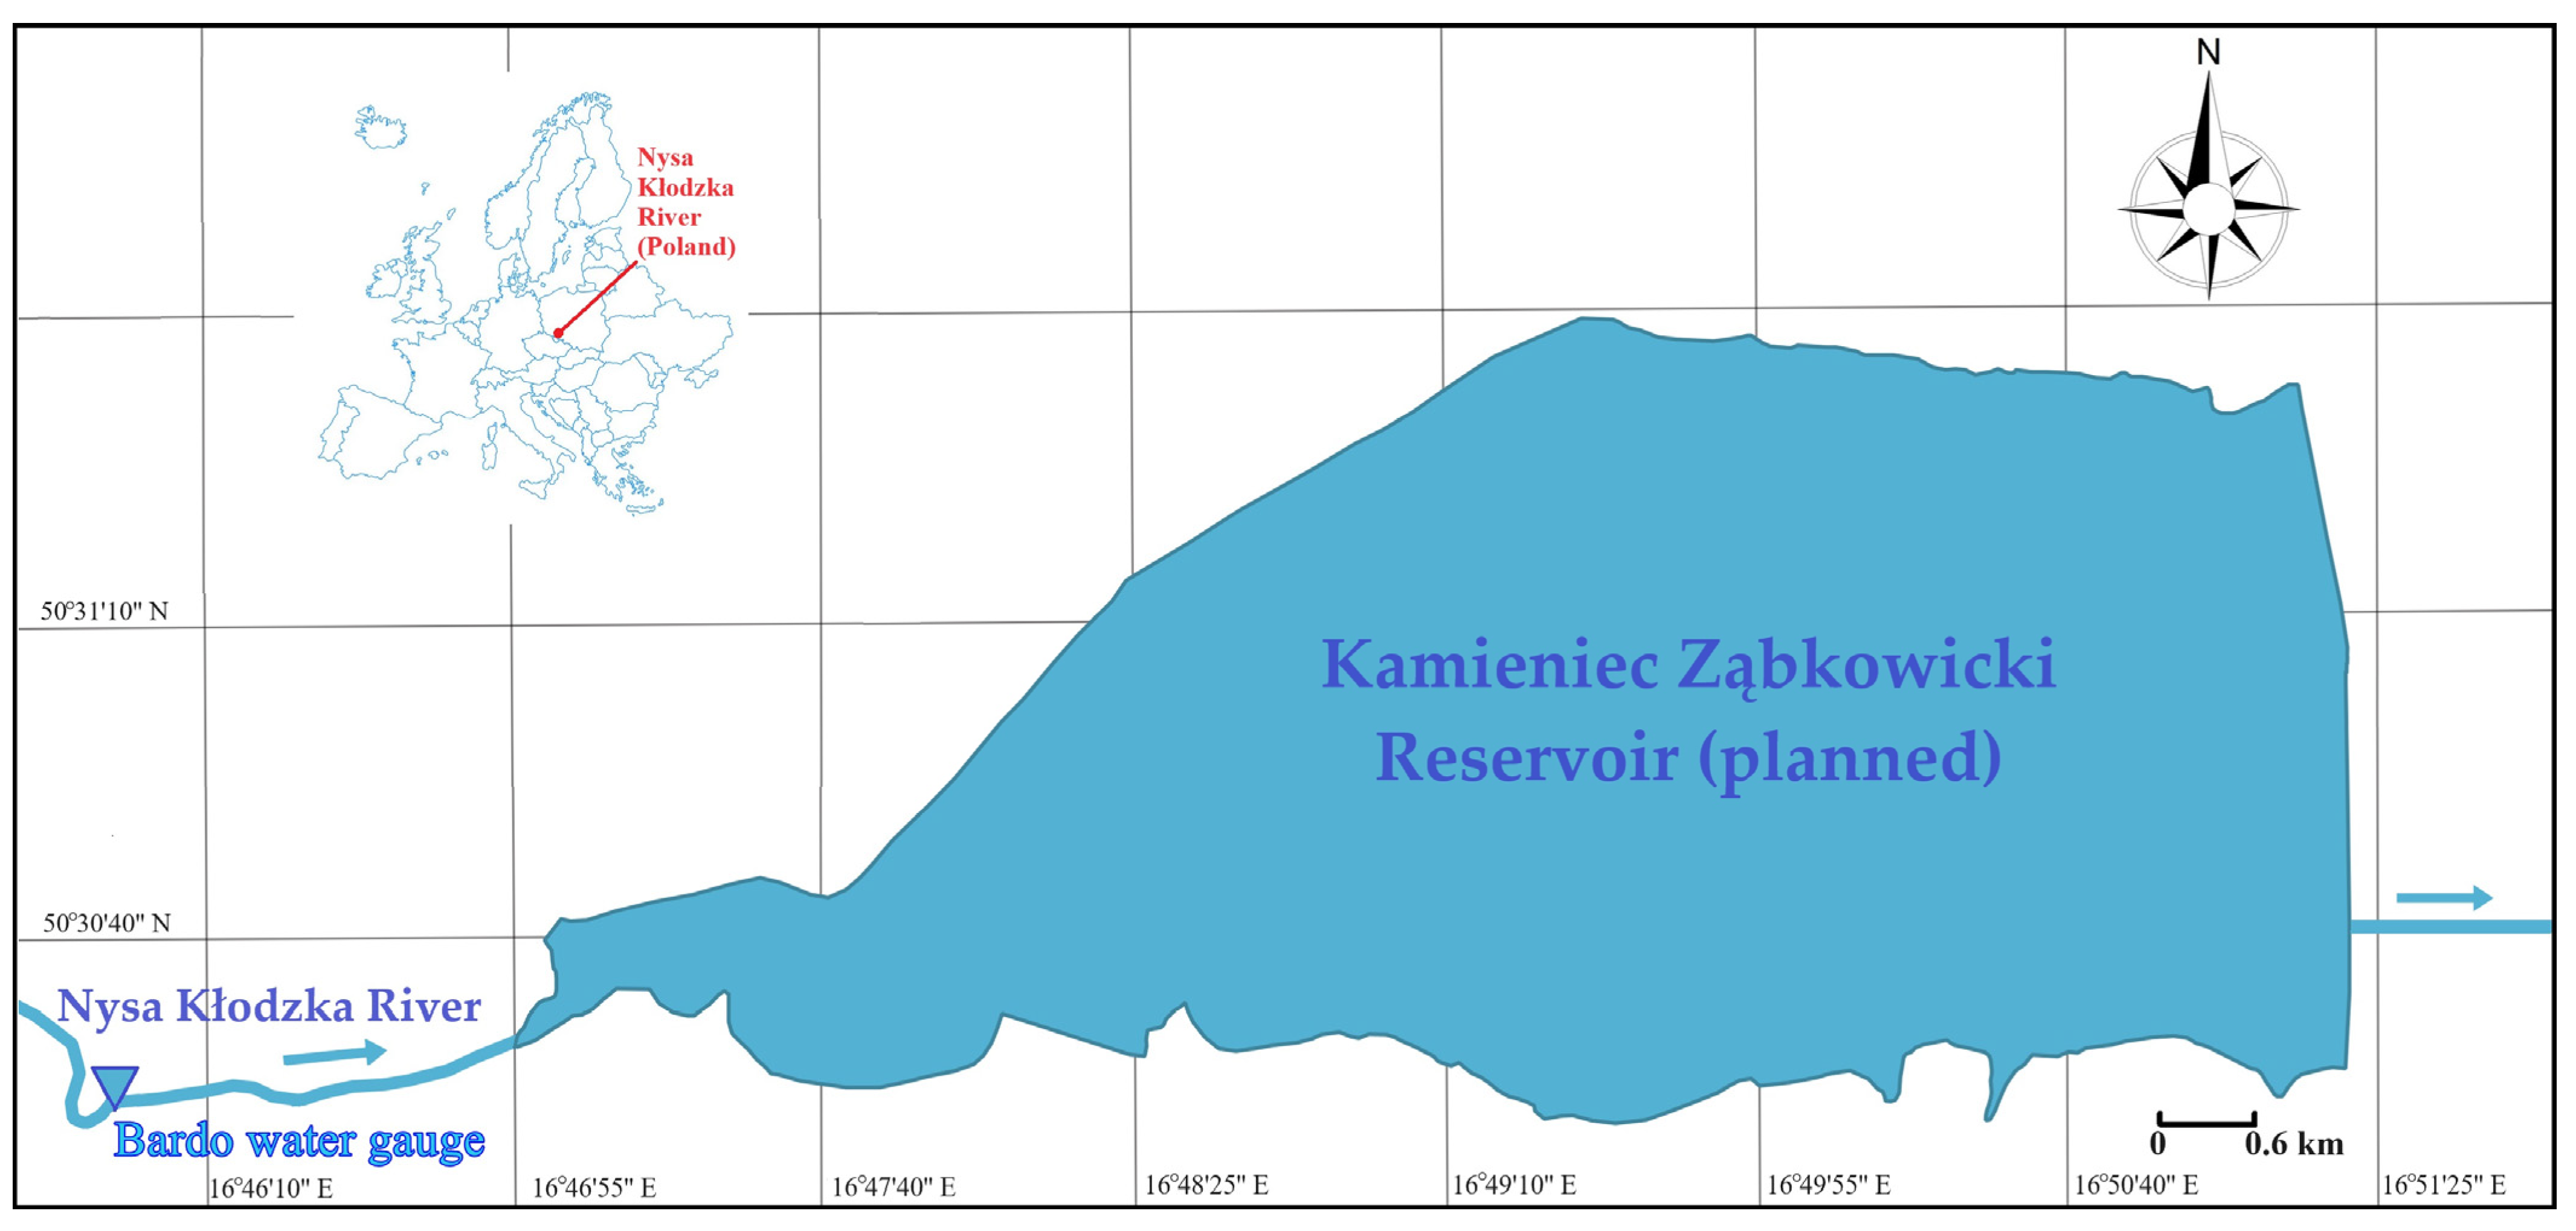
Figure 1. Locations of the Kamieniec Ząbkowicki reserovoir. Source: [49], own work.
Hydrology 10 00226 g001
Figure 2. HEC-RAS post-dam model of the Kamieniec Ząbkowicki. Source: [49,50], own work.
Hydrology 10 00226 g002
Figure 3. HEC-RAS pre-dam model of the Nysa Kłodzka river valley. Source: [50], own work.
Hydrology 10 00226 g003
Figure 4. Time series of flows of the Nysa Kłodzka river from the Bardo profile (1980–2020) for the 3727 cross-section. Data were inputted into the HEC-RAS model. Source: [51], own work.
Hydrology 10 00226 g004
Figure 5. Time series of flows from cross-section 85 in the pre-dam period (orange points) and in the post-dam period (gray points).
Hydrology 10 00226 g005
Figure 6. The probability density function of the mixture of three log-normal distributions for flows in the (A) pre-dam period and (B) post-dam period. 1—low-flow conditions, 2—moderate to medium-flow conditions, 3—extreme or high-flow conditions.
Hydrology 10 00226 g006
Table 1. Basic parameters of the Kamieniec Ząbkowicki reservoir.
No.ParametersValue
1Maximum Pool Elevation255.50 m a.s.l.
2Maximum Pool Capacity83 million m3
3Surface Area at Maximum Pool Elevation in the reservoir920 ha
Source: [49], own work.
Table 2. Trends in pre-dam and post-dam flow data series obtained using Mann–Kendall trend test at cross-section 85 in the Hec-Ras model.
MethodParameterPre-Dam PeriodPost-Dam Period
Mann–Kendallstatistic S−0.14−0.05
Mann–Kendallp-value<0.0001<0.0001
Sen Slopeslope−6.486217 × 10⁻⁵−0.00016
Sen Slopep-value<0.0001<0.0001
Innovative Trend Analysisslope−0.00071−0.0001
Innovative Trend Analysisp-value<0.0001<0.0001
Table 3. The components of the mixture of three log-normal distributions in pre-dam and post-dam flow data series.
Output Flows from the ModelPre-Dam PeriodPost-Dam Period
ParameterComponent 1Component 2Component 3Component 1Component 2Component 3
Proportion0.8930.1060.00050.7800.2120.008
Mean2.72535.943519.5612.21935.674128.30
Standard deviation3.42222.217378.775.42811.31265.801
Disclaimer/Publisher’s Note: The statements, opinions and data contained in all publications are solely those of the individual author(s) and contributor(s) and not of MDPI and/or the editor(s). MDPI and/or the editor(s) disclaim responsibility for any injury to people or property resulting from any ideas, methods, instructions or products referred to in the content.