Article

Stable Isotopic Evaluation of Recharge into a Karst Aquifer in a Glaciated Agricultural Region of Northeastern Wisconsin, USA

1
Department of Natural & Applied Sciences, University of Wisconsin—Green Bay, Green Bay, WI 54311, USA
2
Resch School of Engineering, University of Wisconsin—Green Bay, Green Bay, WI 54311, USA
3
IsoLab, Department of Earth and Space Sciences, University of Washington, Seattle, WA 98195, USA
*
Author to whom correspondence should be addressed.
Hydrology 2023, 10(6), 133; https://doi.org/10.3390/hydrology10060133
Submission received: 29 April 2023 / Revised: 5 June 2023 / Accepted: 15 June 2023 / Published: 17 June 2023
(This article belongs to the Special Issue Advances in Isotope Investigations of Groundwater Resources)

Abstract

:
Ground water contamination from septic systems and the application of dairy cattle manure has been a long-standing problem in rural northeastern Wisconsin, especially in areas with thin soils over karstified Silurian dolostone bedrock, where as many as 60% of the wells show evidence of fecal contamination. We present the results of a citizen science supported water-isotope study in Kewaunee County, Wisconsin to evaluate aquifer recharge processes in the critical zone and to demonstrate the viability of time-series stable isotope data as a supplement to traditional water quality indicators in a contamination-prone aquifer. A meteoric water line was also constructed for Green Bay, Wisconsin, providing reasonable isotopic ranges for aquifer recharge events. Volunteer homeowners collected water samples from their domestic wells for a period of ~14 months to provide a measure of long-term isotopic variation in produced water and to determine whether event-driven responses could be identified using δ18O and δ2H isotopic values. Three shallower wells with a prior history of contamination exhibited significant seasonal variation, while the deepest well with the greatest soil thickness (above bedrock) showed less variation. For moderate precipitation events, the shallowest well showed as much as 5–13% of produced water coming from direct recharge, with smaller contributions for deeper wells. Our case study provides a clear example of how citizen science can collect useful time-series isotopic data to support groundwater recharge studies.

1. Introduction

Regions with karstified carbonate bedrock are widespread, and approximately 20–25% of the global population depends on groundwater resources obtained directly from karst aquifers [1]. The highly complex and heterogenous nature of these aquifers [2] makes them vulnerable to a variety of land use activities. In many cases, residents do not control the land where aquifer recharge occurs. In northeastern Wisconsin, USA, a wide variety of karst features are developed in Silurian dolostone, including solution-enlarged joints, caves, and sinkholes (e.g., [3]). These hydrologic systems have added complexity due to a mantle of Quaternary glacial and alluvial sediment that varies dramatically in thickness and hydraulic conductivity, making this a complicated, dynamic portion of Earth’s critical zone.
Many traditional karst aquifer studies have used temperature, conductivity, hardness, saturation state, and major ion composition to evaluate physical characteristics of aquifers [2]. Stable isotopes have also been used to evaluate recharge in high relief areas [4,5,6], to understand aquifer recharge, flow, and storage characteristics [7,8,9,10,11,12,13,14], and to assess the characteristics of spring systems [2,15,16]. The δ18O and δ2H values of meteoric groundwater reflect those in their source precipitation and are capable of recording seasonal variations of several per mil [17].

Objectives

Citizen science in the field of hydrology is common [18], but examples using isotopes are rare, especially in groundwater applications [19]. We present the results of a citizen science-derived time-series water-isotope study on four domestic wells, in conjunction with a new local meteoric water line (LMWL), with the following goals:
  • To demonstrate the effectiveness of community science on time-series stable isotopic tracer studies of groundwater;
  • To evaluate the aquifer storage characteristics and recharge processes in a karst aquifer covered with a variable thickness of Pleistocene glacial sediments;
  • To evaluate the viability of time-series stable isotope data as a supplementary method to traditional water quality indicators (e.g., coliform bacteria and nitrate) in a contamination-prone aquifer.

2. Study Area Characterization

2.1. Geology and Hydrogeology
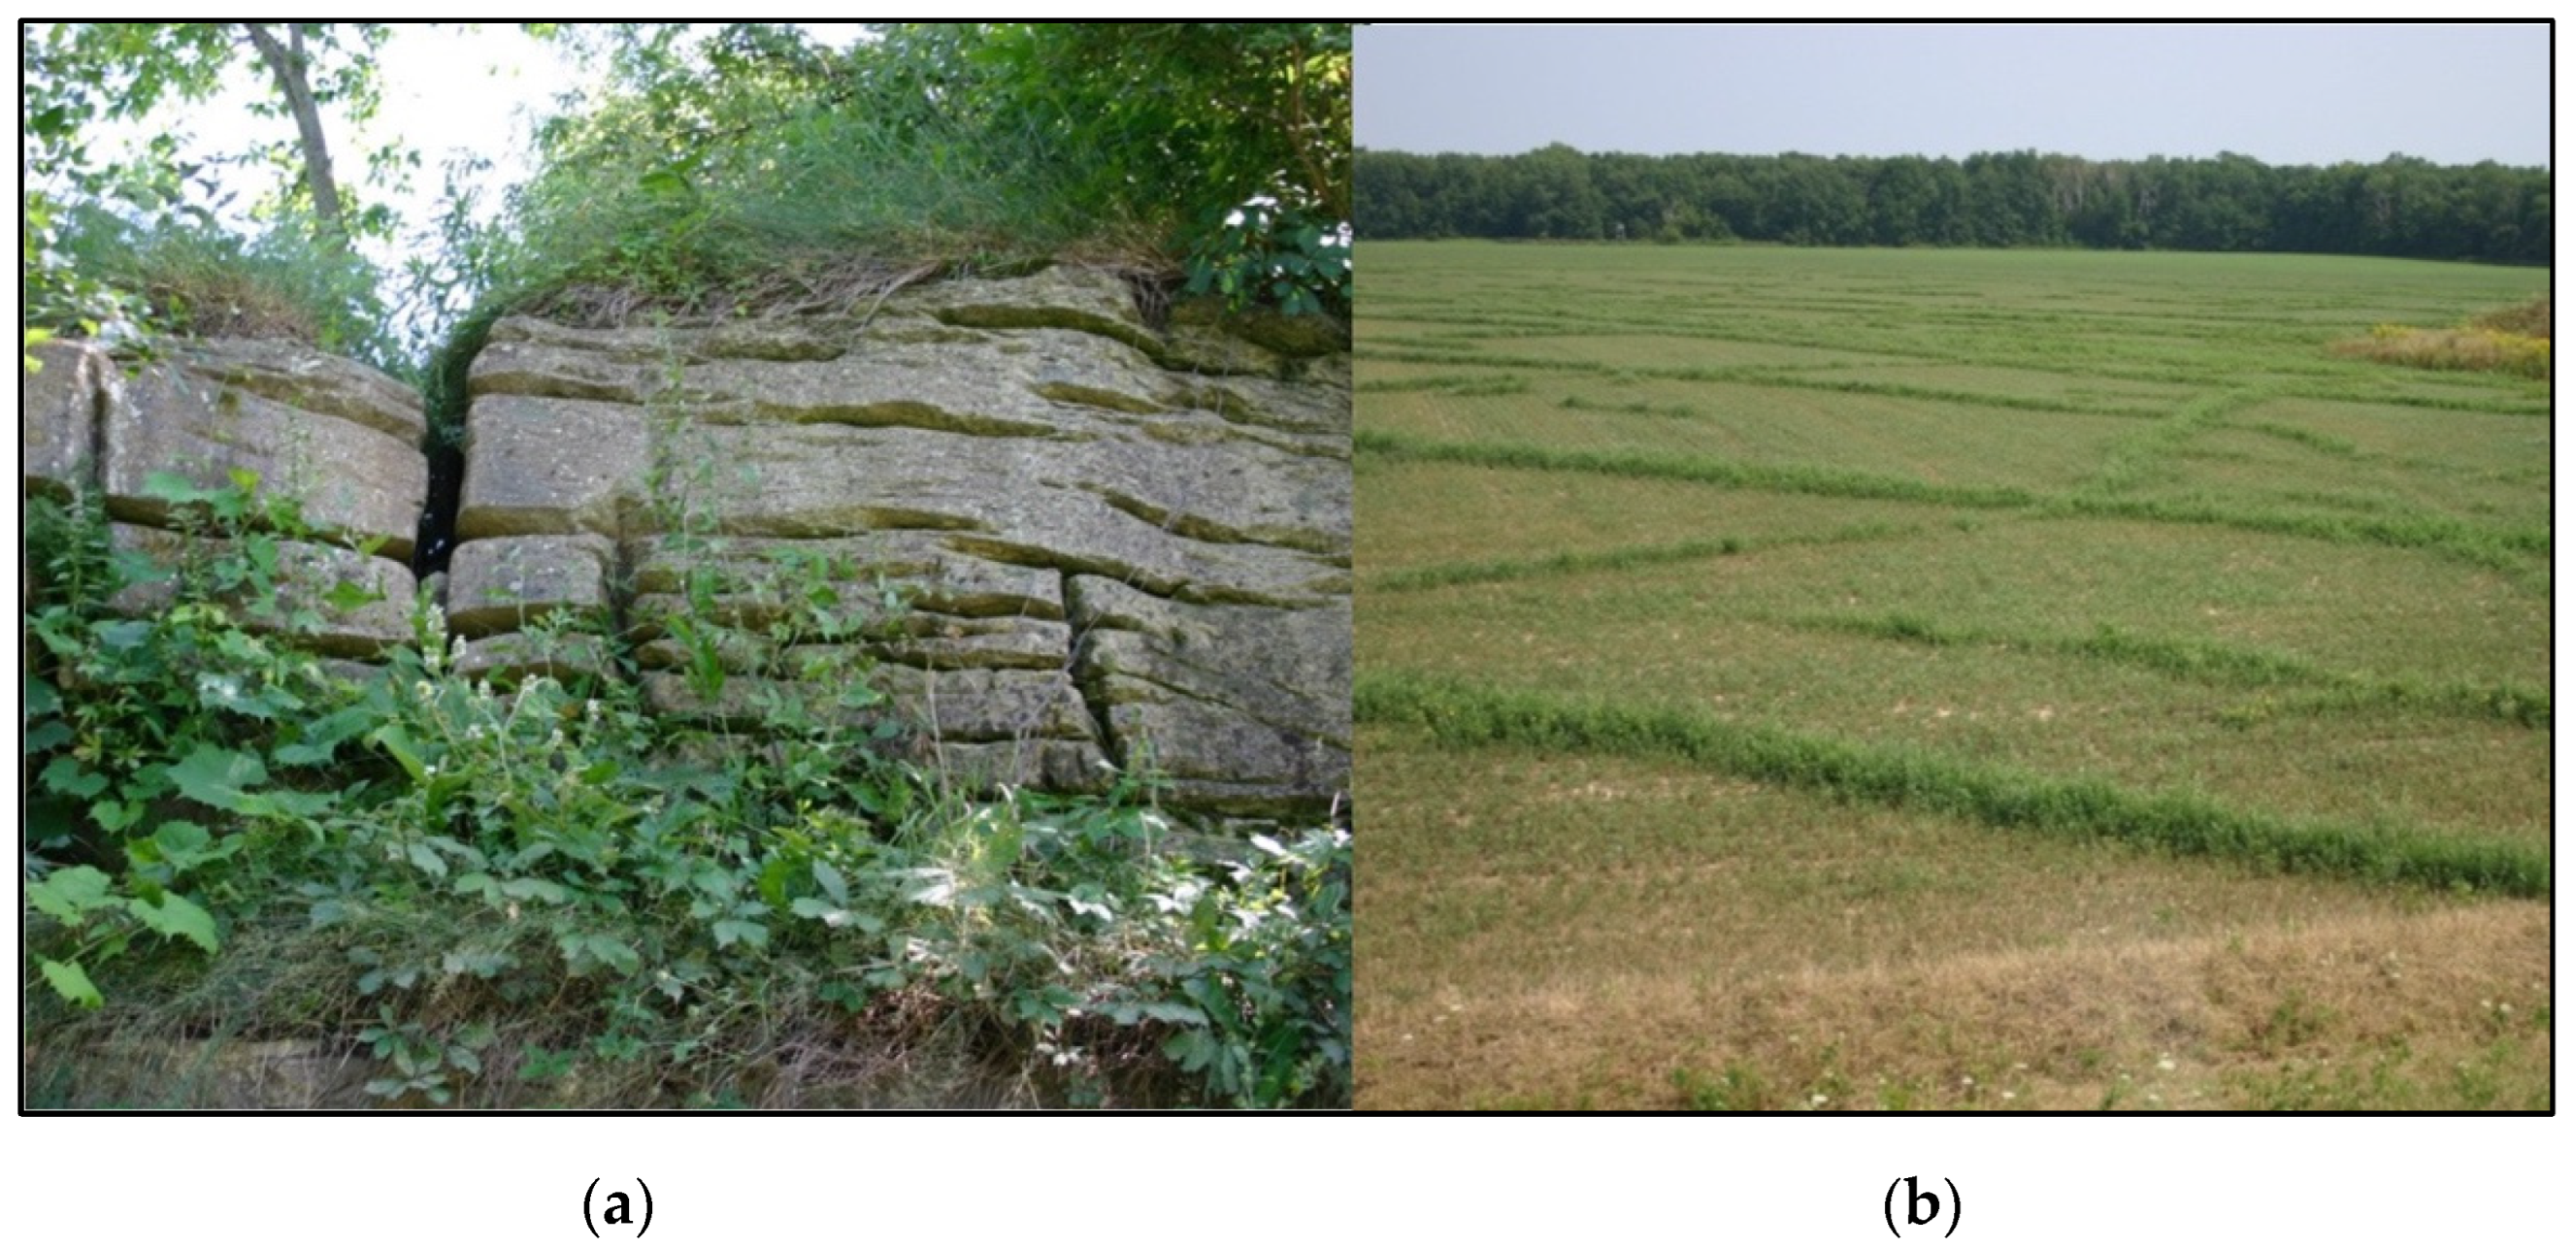
The Door Peninsula of northeastern Wisconsin, USA, is a low-relief, eastward-dipping cuesta composed of up to 150 m of Lower Silurian dolostone overlying an Upper Ordovician shale aquitard (Figure 1) [20,21]. The Silurian aquifer is a karstified, unconfined to partially confined aquifer system that serves as the principal source of water used for agriculture, industry, and drinking water supply in the study area. Hydraulic conductivities of the Silurian aquifer derived from pump testing of municipal wells yielded transmissivities of 980 m2/day [22]. Core-hole packer tests in two studies yielded hydraulic conductivities (K) for the dolomite that vary over six orders of magnitude between 0.0006 m/day to 129.6 m/day, with the highest K values occurring along fourteen regionally correlated high-K zones [20,22]. Vertical solution-enlarged fractures are prevalent in the Silurian dolostone and are observed where bedrock is exposed. Except where additional moisture is available to plants, they are also inferred where seasonally drought-stressed vegetation (typically alfalfa) grows on areas of thin soils (≤1 m) over soil-filled karstified fractures (Figure 2).
Groundwater recharge is not uniform throughout the year, with primary recharge occurring during spring snowmelt and rainfall, along with additional recharge in fall when vegetation becomes less active. Door Peninsula region recharge estimates vary from <2.5 cm/year to as much as 24 cm/year [23,24]. The infiltration rate varies dramatically, based upon soil type and thickness above the karst aquifer, and frozen soils in spring promote runoff instead of local infiltration. The resulting fluctuations in the water table of the Silurian aquifer of northeastern Wisconsin can be dramatic (several meters or more) (e.g., [25]), with corresponding sudden variations in fluid temperature, electrical conductivity, and nitrate and dissolved organic matter concentration [25,26].
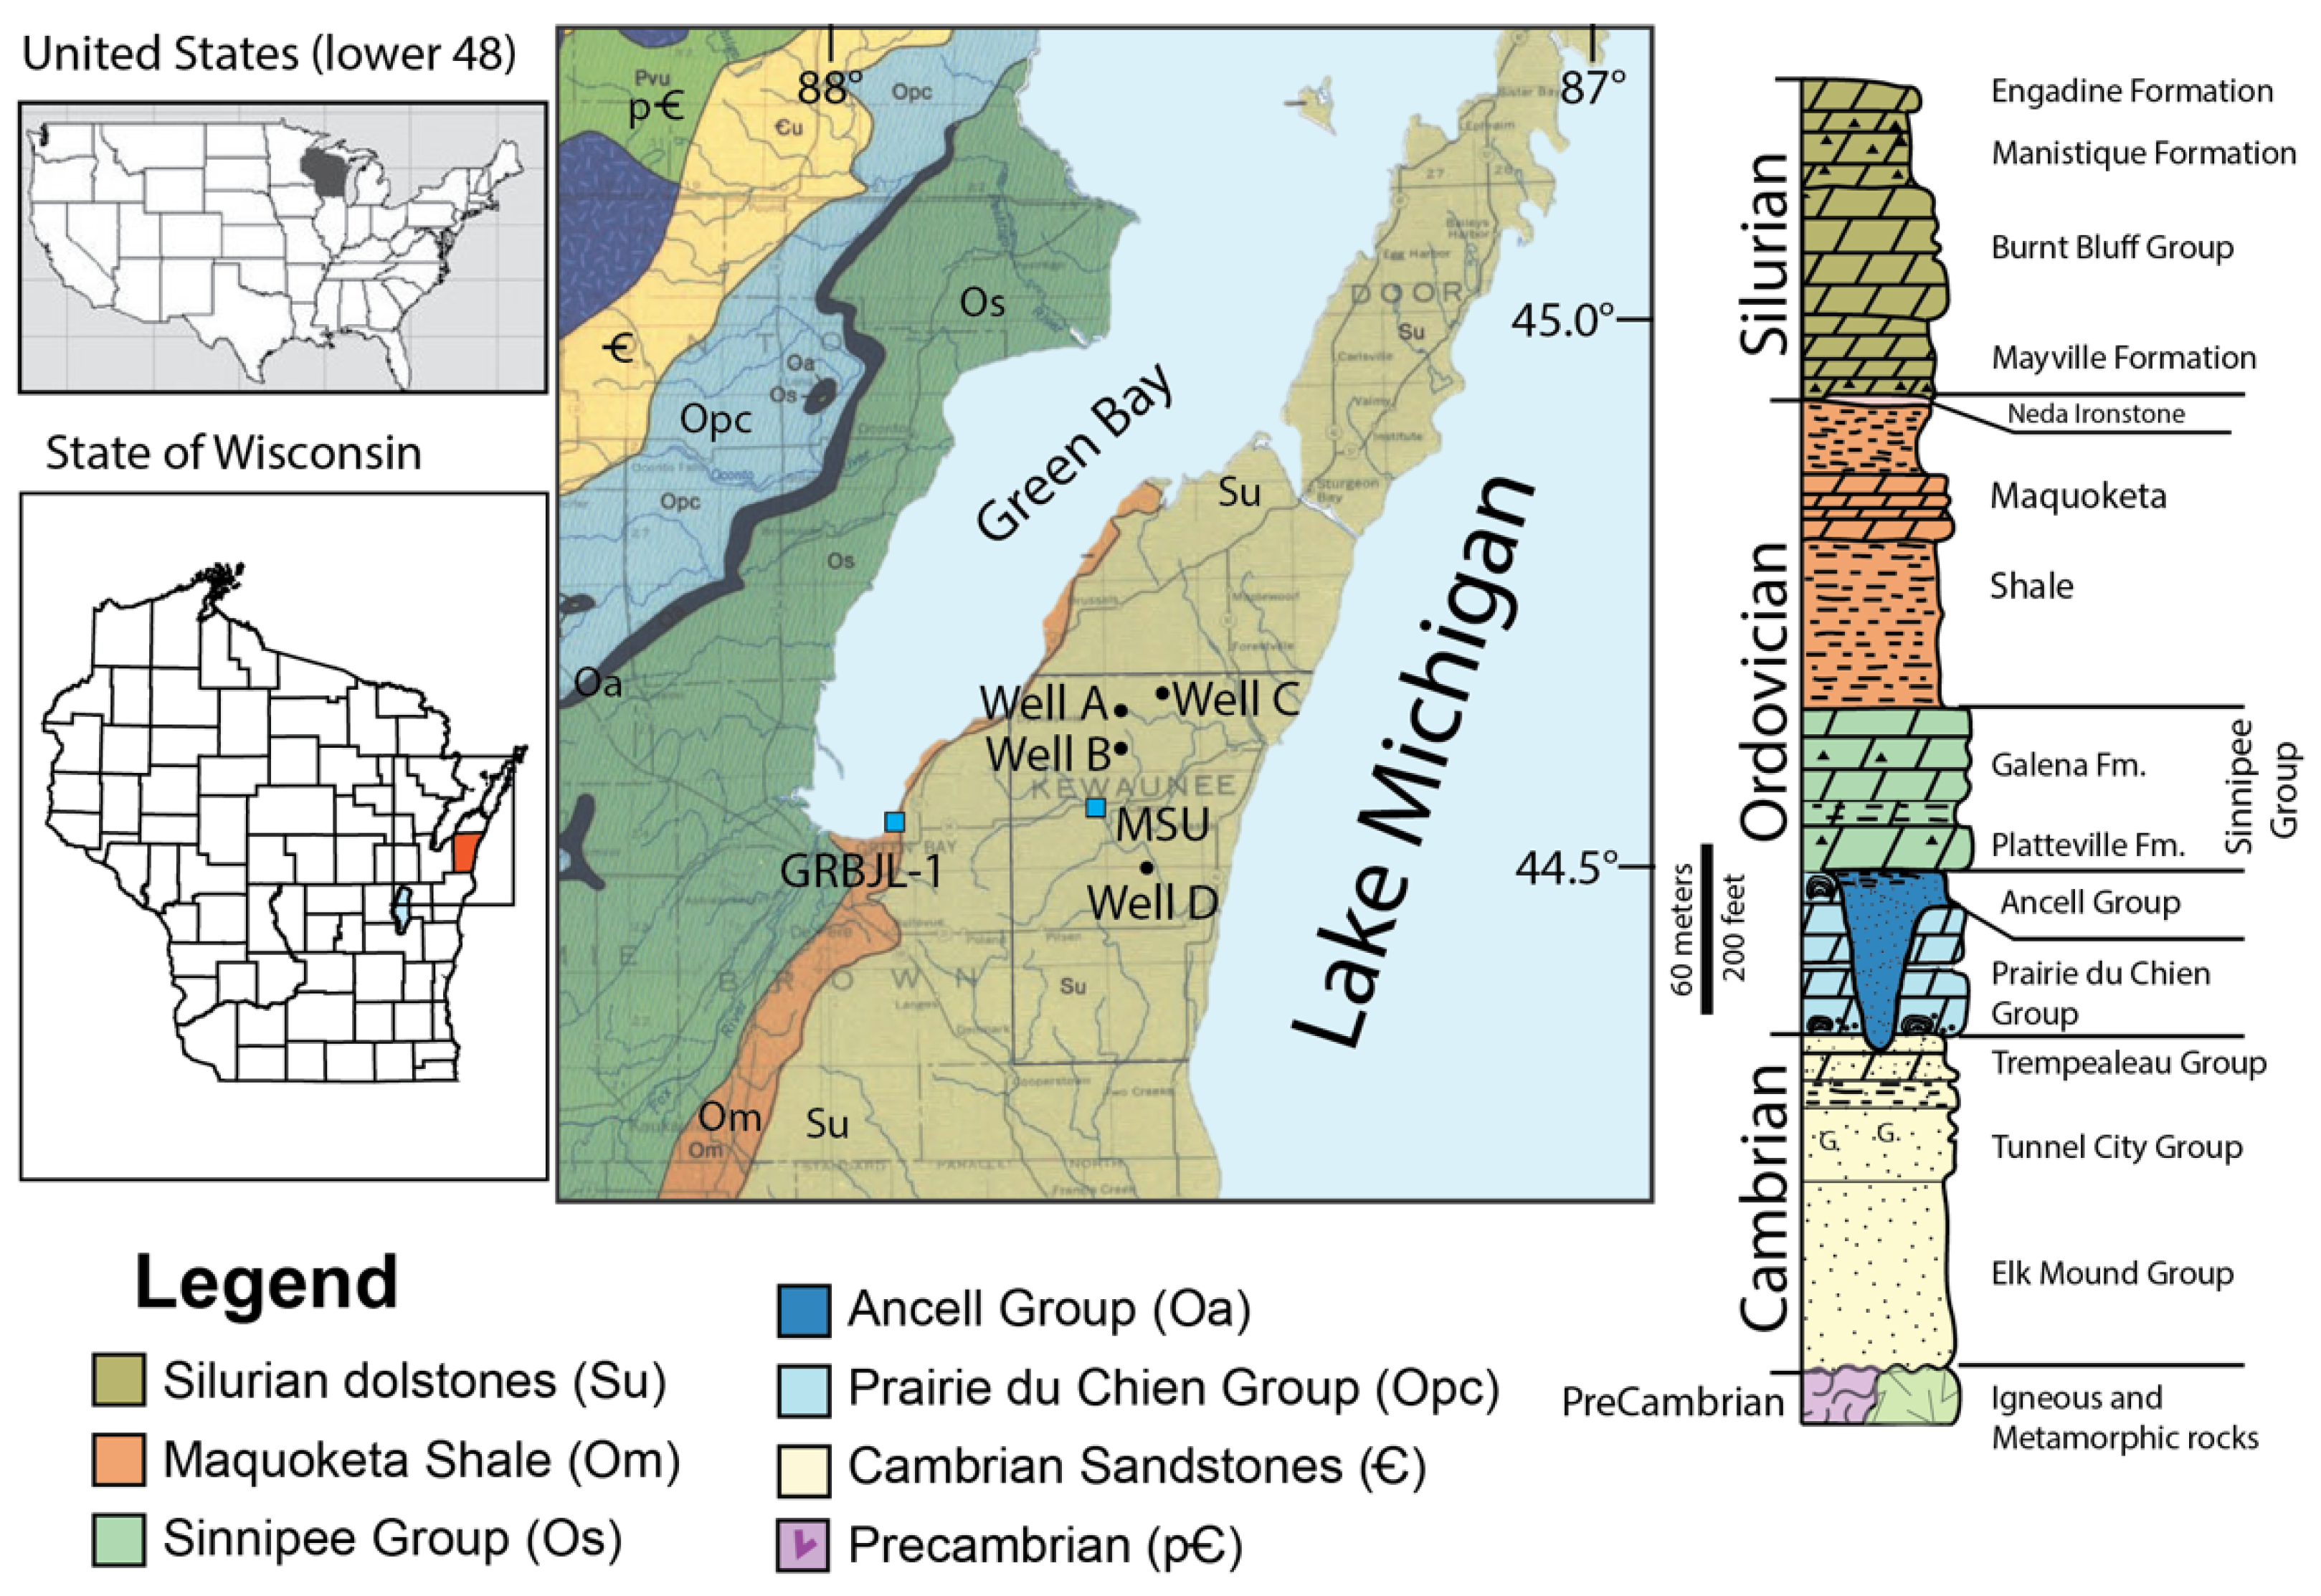
Figure 1. Bedrock geologic map of the study area showing the location of the 4 wells, a nearby Michigan State University weather station, and the GRBJL–1 station used for the LMWL in this study. Base map is from Mudrey et al. [27]. Stratigraphic column is modified from Luczaj et al. [28].
Hydrology 10 00133 g001
Figure 2. The Silurian dolostone in northeastern Wisconsin contains well-developed karst features which have been modified by glaciation. (a) Solution-enlarged vertical fractures and bedding plane fractures in the wall of a quarry beneath thin soils (~10 cm) in Brown County. (b) Evidence of solution-enlarged vertical fractures in a drought-stressed alfalfa field where depth-to-bedrock (i.e., glacial sediment thickness) is ≤1 m (Calumet County). Soil moisture is available within deeper fractures, allowing alfalfa plants with deep root systems to obtain sufficient moisture, resulting in linear patterns that match fracture joint sets in the bedrock below.
Hydrology 10 00133 g002
Ground water contamination has been a long-standing problem in rural northeastern Wisconsin, especially in areas with thin soils over karstified Silurian dolostone bedrock [29,30,31,32,33,34,35] (Figure 1). Two recent county-wide randomized groundwater studies in Kewaunee County, Wisconsin documented extensive contamination related to nitrate, coliform bacteria, and diverse taxa of fecal-associated microbes (bovine- and human-sourced bacteria and viruses), some of which are pathogenic [35,36]. Although their studies showed complex associations between risk factors and various types of water-borne contaminants, the strongest associations occurred with land use, groundwater recharge, and the thickness of unconsolidated Pleistocene sediments above bedrock (i.e., depth-to-bedrock) [35]. One limitation of testing for bacteria and viruses is their episodic presence in well water because their occurrence and concentrations vary widely over space and time in karst aquifers such as those in the study area (even in individual wells over short periods of time) [26]. This variation, coupled with other important variables, such as the timing of manure spreading, recharge events, and presence of frozen soils in winter, indicates that “single snapshot” manual sampling may not always reliably identify whether a well is vulnerable to contamination.
Despite this limitation, more than 60% of the wells sampled in the Kewaunee County study showed fecal-associated contamination [35,37]. As a consequence, well contamination in the county was predicted to cause up to 301 cases of acute gastrointestinal illness (AGI) per year, with 230 connected to bovine fecal pathogens, 12 to human sources, and the rest to unknown sources [36,37].
The pollution sources in Kewaunee County are predominantly of two types: direct application of bovine manure on agricultural fields, and infiltration of leachate from engineered household septic system leach fields [33,35,36]. Larger farms with nutrient management plans apply manure after the spring frost has thawed and throughout the summer and fall seasons. Septic systems operate year-round and deliver leachate directly into the soil at a depth of at least 1 m through perforated pipes. In both cases, soil type and soil thickness play critical roles in filtering or delaying the movement of nutrients and pathogens into the aquifer.

2.2. Climate and Land Use in the Groundwater Study Area

The study area in the southern Door Peninsula of Wisconsin has a humid continental climate with warm summers and cold winters. At the nearby Denmark Wastewater Treatment Plant (WWTP) station in southeastern Brown County (USC00471604), the average January (winter) temperatures are −8.1 °C and average July (summer) temperatures are 20.8 °C. Approximately 76.5 cm/year of precipitation occurs as both rain and snow, with seasonal snowfall totals averaging 133.3 cm for the period 2006–2020 [38].
The topography of northeastern Wisconsin is gently rolling, with limited steep slopes along the Niagara Escarpment and larger river valleys [21]. Elevations in the study area (Kewaunee County) are limited to between 177 m and 316 m above sea level. Land use in central Kewaunee County, Wisconsin is characterized by a mixture of small rural communities and industries, including manufacturing, dairy (bovine) livestock production, and agricultural field crops, with the vast majority of the study area being cultivated land [33]. The principal sources of groundwater contamination in Kewaunee County are from septic systems and from widespread application of dairy cattle manure that is spread on the landscape as part of nutrient management plans [33,37].

2.3. Need for a Northeastern Wisconsin Local Meteoric Water Line

Few LMWL or United States Network for Isotopes in Precipitation (USNIP) sites are established in the western Great Lakes region of North America, despite the fact that this region exhibits the largest range in δ18O values (10 to 16‰) for the lower 48 contiguous United States [39]. The nearest established LMWL is 250 km away and was built from 17 composite samples during 1998–1999 [40]. Proximity to Lake Michigan, coupled with significant latitudinal differences, required the construction of a new LMWL to reduce regional and temporal variation that might arise from using existing data. In order to make quantitative estimates of groundwater recharge during episodic recharge events, precise estimates of the isotopic variation in nearby precipitation were also needed and could be derived from the new LMWL data.

3. Materials and Methods

3.1. Sample Collection for a Green Bay Local Meteoric Water Line

Precipitation samples used for development of the LMWL were acquired at the first author’s residence during a 14-month period between 11 February 2015 and 31 March 2016. The station is designated as GRBJL–1 and is located at latitude 44.5439° N and longitude 87.9117° W, not far from the campus of the University of Wisconsin—Green Bay. Rainfall and some mixed rain–snow measurements were made using a graduated rain gauge (Tru-Chek brand). Temperature data were acquired from a home weather station near the rain gauge. Samples used for isotopic analysis were collected either directly from the rain gauge (larger events), or from a larger HDPE plastic container nearby, depending upon whether enough volume was available to completely fill the sample bottle without head space. During the winter season, snow was collected in a large HDPE storage container, with snow depths measured directly. Snow was transferred to a sealed plastic bag with no head space to be subsequently melted and transferred to a sample bottle.
The samples were transferred to sealed bottles immediately after cessation of precipitation, based upon radar predictions of storm duration, regardless of the timing of precipitation during the 24 h day. The samples were stored in watertight 30 mL HDPE plastic bottles or 8 mL glass vials, depending upon available volumes. The bottle lids were secured with electrical tape to prevent loosening during transport.
A total of 113 events were collected and analyzed during the sampling period (Tables S1 and S2), along with selected duplicates and paired samples from the rain gauge and the HDPE container. Two additional sample vials representing small precipitation events of 1.3 and 2.3 mm were broken during shipment to the laboratory, possibly due to freezing and were, therefore, discarded. In addition, 19 measurable rainfall events were not sampled during the study. Of these, 15 samples represented precipitation events of <1.5 mm and, therefore, did not yield enough liquid. Four small, but measurable events or sub-events between 2.5 and 6.9 mm were missed due to lack of personnel.

3.2. Well Identification and Wellhead Sampling Procedures

Four well owners with domestic drilled water wells were chosen with the assistance of the Kewaunee County Land and Water Conservation Department. Well construction parameters were considered before selection of participants to maximize the ranges of well depths and overburden thicknesses (i.e., depth-to-bedrock), while minimizing the geographic distance between wells. All the wells are cased into and draw from Silurian age bedrock. Areas within 10 km of the shoreline of Lake Michigan were avoided due to the potential climatic influence of the lake. The well construction and related parameters are shown in Table 1.
Water samples from the four domestic wells were collected between early March 2015 and mid-April 2016, with slightly variable starting and ending dates for each well. Each volunteer well owner was instructed to sample their water at a frequency of at least one sample per week, and one sample per day during snowmelt or other major runoff events. Samples were collected in clean dry HDPE plastic bottles, with as little head space as possible. The sample bottles were labeled by date. Baseline general water chemistry samples were obtained from each well by the authors during early July 2015 (summer).
All four well owner volunteers participated for the entire period of the study, albeit with varying levels of sampling frequency. Samples throughout the 13.5-month period were chosen for analysis, with denser sampling intervals targeted near times of major recharge events. Due to funding constraints, not all collected samples were sent to the laboratory for analysis. A total of 410 groundwater samples were analyzed for δ2H and δ18O from the four wells in the study (Wells: A, n = 75; B, n = 116; C, n = 131; D, n = 88). The raw data are available in Tables S3–S6.

3.3. Laboratory Analytical Methods for Isotopic Analysis and General Chemistry

Water samples from precipitation (n = 129) and groundwater (n = 410) were analyzed at the University of Washington’s IsoLab using either a Picarro L1102-i or L2120-i cavity ring-down spectroscopy analyzer with discrete liquid injections into a vaporization module (A0211) by a Leap Technologies LC PAL autosampler. Two in-house reference waters were used to normalize samples to the VSMOW-SLAP scale, with a third in-house reference water treated as an unknown for quality control. The last seven of ten 1–2 µL injections were averaged for each sample and the in-house reference water. The precision (2σ) taken over all analyses (n = 150) of the in-house reference quality control water was 0.54 and 0.14‰ for δ2H and δ18O, respectively.
Precipitation values for δ2H and δ18O at Station GRBJL–1 were best-fit using sine curves to estimate their seasonal ranges. The period of the sine curve was fixed at 365 days, but the amplitude, vertical offset, and phase were allowed to change as the least squares errors were minimized using the “Evolutionary” method in the Solver add-in program in Microsoft Excel (version 16.71).
Major ion chemistry samples were delivered on ice to Pace Analytical Services Inc. (1241 Bellevue Street, Green Bay, WI, USA 54302). The laboratory is certified by the State of Wisconsin (Wisconsin Certification #: 405132750) and reported analytical precision of ± 10–20% for the methods used in this study. Calcium, magnesium, manganese, potassium, sodium, and strontium were prepared with method EPA 3010 and analyzed using method EPA 6010. Alkalinity, total as CaCO3, was analyzed using method SM2320B. Ion chromatography anions (chloride, fluoride, sulfate, and nitrate) were analyzed using method EPA 300.0.

3.4. Data Pretreatment

All results from the LMWL portion of the study were used in the analysis after finding no evidence of leakage or sample alteration, and all samples were analyzed within 190 days of collection (Table S1). Eighteen additional samples (Table S2) were collected that were not used in the construction of the LMWL because they included duplicates, partial events, an alternate snow sample location (blizzard deposit), and 3 h delayed sampling duplicates to assess whether evaporation affected the isotopic composition.
Some of the results from the groundwater study were removed from the dataset before plotting and modeling, with the majority of discarded data from just one of the wells. The decision to exclude certain data was based upon analysis of duplicates and new samples analyzed between existing sample dates, which indicated sample-bottle leakage or evaporation. Evidence for leakage was present in some bottles that were analyzed more than 365 days after sample collection, which typically resulted in changes toward heavier isotopic values (up to +1.92‰ for δ2H and up to +0.70‰ for δ18O) and lower d-excess values (+0.25 to −3.69‰) for samples with hold times ≥500 days. A safety margin was assigned so that analyses from samples with a hold time longer than 300 days were not included in the analysis and modeling results, which resulted in the removal of an additional 6 data points from non-crucial intervals. Overall, the sample-culling effect is minimal for all wells except Well C, from which 36 of 131 samples were discarded. For the other wells, this included only 3 of 75 samples from Well A (2 samples and 1 duplicate), 2 of 116 samples from Well B, and 3 of 88 samples from Well C that were discarded due to hold times. Fortunately, most of these discarded data are from the summer season, leaving the snow melt and spring rain portion of the dataset largely unaltered. One additional sample result for Well D on 4 August 2015 was removed because its value for δ2H was far outside 2 standard deviations for that portion of the year, and its anomalously lighter isotopic signature cannot be explained by a precipitation event response (summer), nor is it consistent with a leaking bottle (wrong direction).

3.5. Climatological Data for Kewaunee County

Rainfall data were available for the 2015–2016 period (MSU station) [41] in the immediate study area in central Kewaunee County. For months with frozen precipitation, data for snow depth at other regional stations were examined collectively, along with notes from homeowners, to establish snow depth, soil temperature, and air temperature to identify periods of frost thaw and snow melting as potential recharge events.
Unlike the rainfall data, snowfall and snow depth measurements were not available for central or northern Kewaunee County, but Global Historical Climatology Network (GHCN) climate data were available for stations USC00471604 (Denmark WWTP), US1WIBN0014 (Green Bay 3.8 SSE), and USC00474195 (Kewaunee) that are between 23 and 32 km away from the study area [32,42,43,44].

3.6. Modeling of Time-Series Data

The modeled time-series δ2H and δ18O data (Table S7) were from groundwater samples collected between March 2015 and April 2016. To enable us to see strong features and structures in our data, we used standard noise filtering techniques for time-series data. For such modeling, we used SageMath (open-source mathematics software v. 9.8) and NumPy (a package for scientific computing with Python).
We calculated a moving average from the measurements during a window of plus or minus three days. We then linearly interpolated for dates where no daily sample was available. We used this as our initial filter to model the data. Next, we used traditional filtering techniques with the Fast Fourier Transform and Power Spectral Density thresholds to remove more noise from the initial filtered signal (i.e., the initial filter that models the data). Since our data were collected over approximately 14 months, we modeled the data over the first 12 months and the last 12 months then averaged the overlapping values.
To estimate the contribution of event-driven infiltration to the proportion of produced groundwater for selected wells and recharge events, three isotopic values were required, including:
  • The pre-event groundwater signal (δ18OPEGS or δ2HPEGS, measured at the well);
  • The event groundwater signal (δ18OEGS or δ2HEGS, measured at the well);
  • The precipitation isotopic signal (δ18OPRECIP or δ2HPRECIP), measured at station GRBJL–1.
Equation (1) was used to estimate the proportion of recharge water contributed to overall well discharge, expressed as a percentage of the δ18O signal:
( δ 18 O EGS   δ 18 O PEGS δ 18 O PRECIP   δ 18 O PEGS ) × 100 ,

4. Results and Analysis

4.1. General Chemistry

The analysis of the major ion chemistry of the domestic wells in the study revealed a Ca-Mg-HCO3-type water (Table 2), as expected for an unconfined to partially confined karst dolostone aquifer, with variable amounts of chloride and nitrate. Elevated Cl and NO3-N occur in the three shallowest wells with the lowest depth to bedrock values (Table 1 and Table 2) and are consistent with anthropogenic inputs from manure spreading and septic systems (Cl and NO3-N) and winter-applied road salt (Cl). Cl concentrations were highest in the two shallowest wells (A and B) and lowest in the deeper wells (C and D). The lack of known coliform bacteria detections, and the lack of significant NO3-N in the deepest well (D) is consistent with a well that is sufficiently protected from agricultural land-use activities by a thick mantle of unconsolidated sediments.

4.2. A Local Meteoric Water Line for Green Bay (The Seasonal Input Signal)

Table S1 contains the field data and isotopic results for precipitation samples used to construct the LMWL for Green Bay, Wisconsin (Figure 3). Because precipitation data were available across parts of 14 months, three linear regression analyses were performed for the sample results using the LINEST() function in Excel to determine the LMWL for the study area (Table 3). The regression for all precipitation data (rain and snow) yielded a LMWL of δ2H = 8.029 × δ18O + 12.05 (R2 = 0.9877), which differs from the Global Meteoric Water Line (GMWL) of δ2H = 8.0 × δ18O + 10 and a historical LMWL for Madison, Wisconsin (Table 3). Two additional regression lines were calculated for 12-month subsets of the data to act as a “water year”. These regressions yielded similar results and are shown in Table 3.
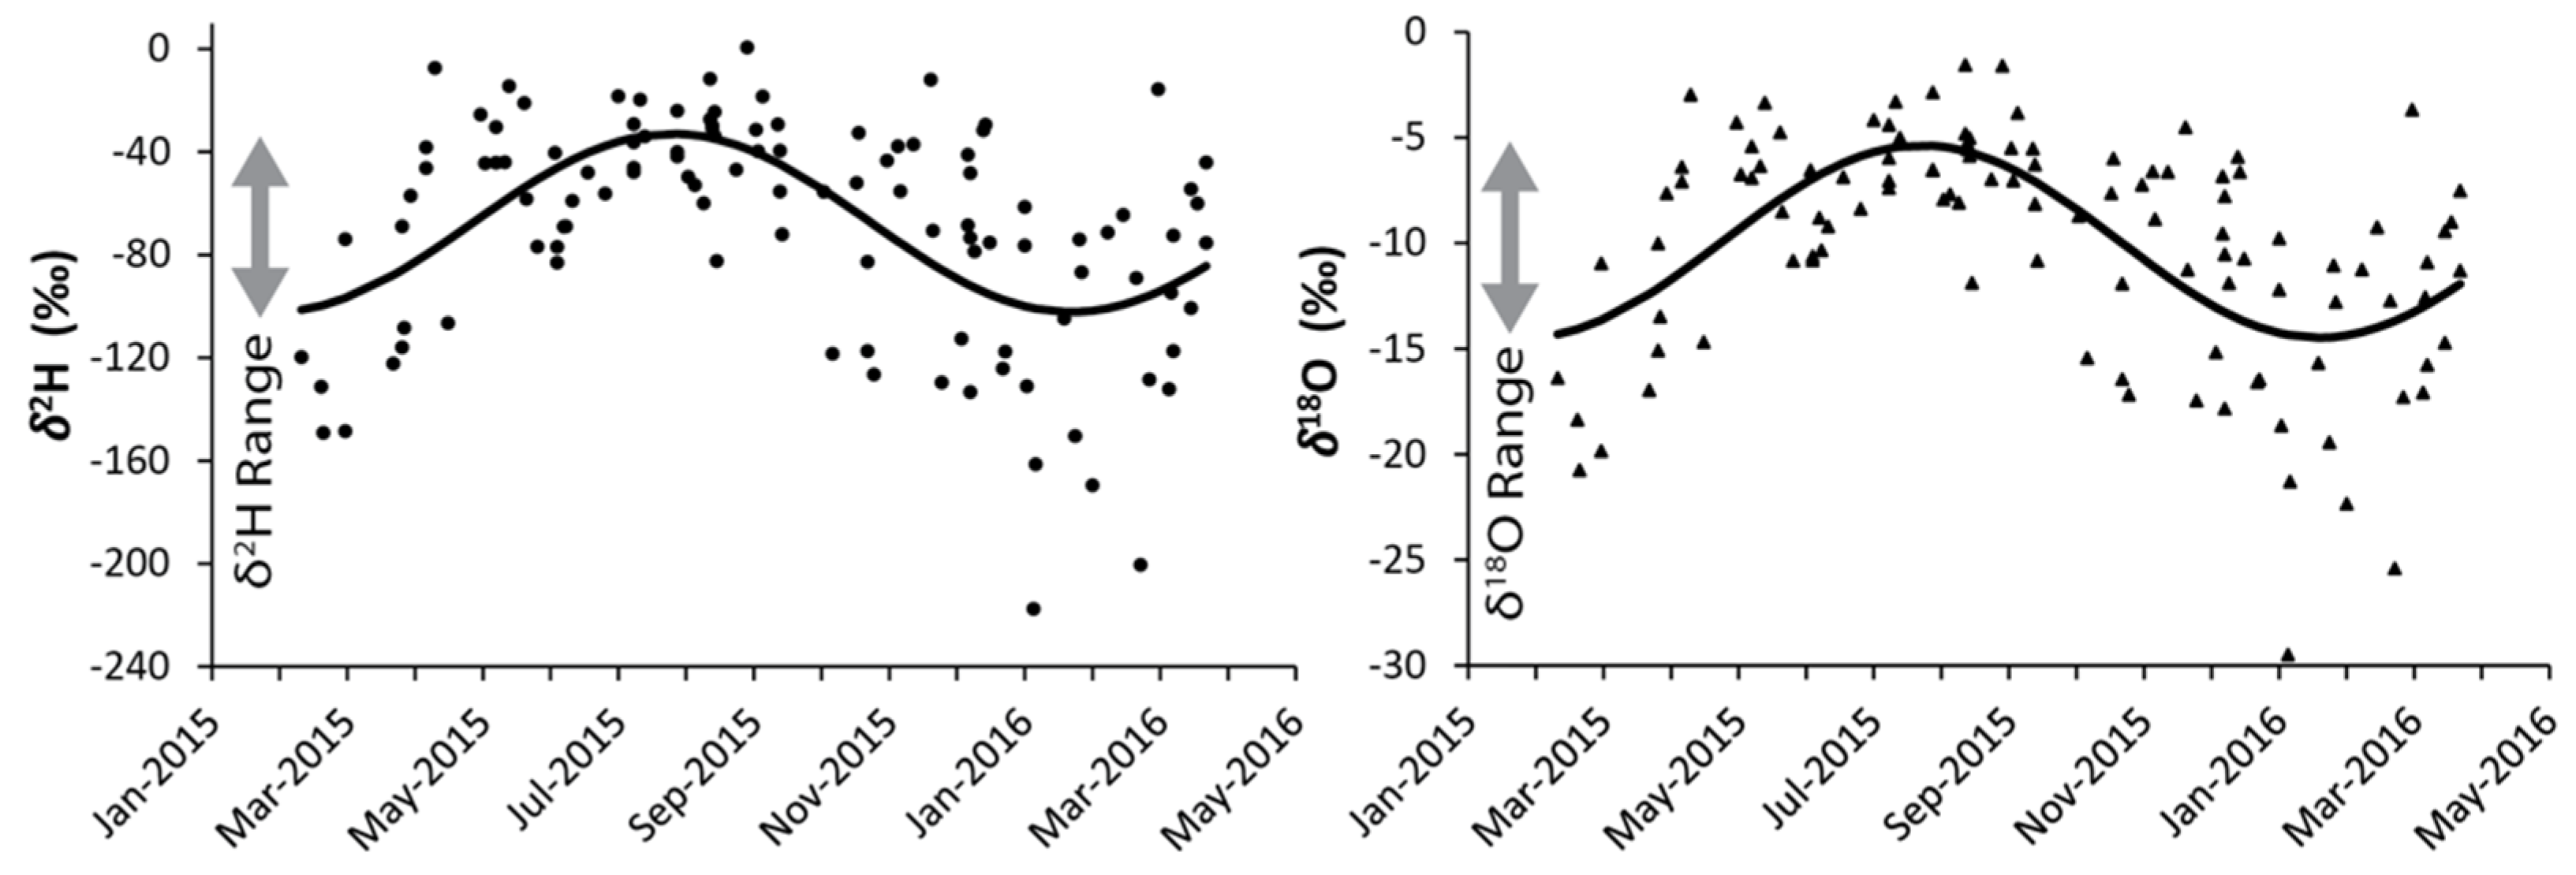
The new LMWL will serve as a high-quality tool for researchers in the western Great Lakes region on the upwind side of Lake Michigan where recycled moisture from “Lake Effect” precipitation is limited or nonexistent [46,47]. In the context of this research, however, the 2015–2016 time-series δ2H and δ18O isotopic composition of precipitation shown in Figure 4 illustrates the seasonal cyclic range of the “input signal” during recharge events. Although the precipitation data are from an adjacent county, approximately 25 km west of the study area, they will serve as a reasonable reference dataset for most large precipitation events (see below).
The clear large seasonal range for δ2H and δ18O presented in Figure 4 is far greater than the 2-sigma errors of the analyses (Table S1). This phenomenon is well known in continental regions of North America where large seasonal temperature ranges occur [39]. The advantage of performing isotopic studies in such geographic regions is that the seasonal signal in precipitation becomes an extremely effective “input signal” for groundwater recharge events.
Detection of this “input signal” can be accomplished through the identification of temporal variations in the isotopic composition of the groundwater reservoir produced from domestic water wells. For a detection of the input signal to occur in groundwater, it needs to be isotopically distinct, be of sufficient volume, and travel quickly enough through the unsaturated zone before its signal is damped by mixing with the groundwater reservoir. Such rapid transit would be consistent with the detection of viable bacteria or viruses, which have been detected extensively (but episodically) in the study area by other research [35,36].

4.3. Groundwater Stable Isotopic (δ18O and δ2H) Composition

The stable isotopic compositions of groundwater produced from each of the four wells in Kewaunee County, Wisconsin from March 2015 through April 2016 are shown in Figure 5 (and Tables S3–S6), along with the new LMWL for Green Bay (Brown County), Wisconsin. Shallower wells (A and B) plot in a distinctively different isotopic space than the deeper wells (C and D), but all four wells plot along the new LMWL. Nearly all groundwater isotopic data from the four Kewaunee County wells plot to the left of the GMWL. This is not surprising because meteoric water lines for continental interior regions often have higher intercepts and sometimes differing slopes. Despite its similar slope, the LMWL for Green Bay trends through the middle of the dataset for all four wells because of a higher intercept (12.05).
Figure 5 shows notable differences between the wells. First, the trend line for isotopic data from the shallowest well (A) has a distinctly steeper slope (m = 7.0, +/− SE 0.3, R2 = 0.88) than the slopes for the other three wells (m = 1.75 to 2.34, +/− SE 0.2 to 0.3, R2 = 0.16 to 0.52). There are a few factors that are important to consider when comparing these slopes. While wells with shallower slopes (Wells B, C, and D) have smaller δ18O ranges, all four wells have a statistically significant slope that is different from zero (all four wells p < 0.001).
We considered whether water–rock interaction with the dolomite host rock (average δ18OVSMOW = 25.7‰, n = 902; unpublished data) would have altered the δ18O signature of the water toward the heavier values observed. While the trend in δ18O values is in the correct direction, water–rock interaction with the dolomite host rock is unlikely to involve isotopic exchange of oxygen between the water and the bedrock-derived carbonate/bicarbonate ions in solution at low temperatures and is also unlikely to produce a noticeable change in δ2H. Any expected change would only produce a horizontal interaction trend instead of one with a positive slope [48], and we rule this mechanism out as a likely variable.
One possible scenario is that a contribution from evapotranspiration has led to a slight enrichment of the waters (i.e., a “residuum”) in the unsaturated zone, with a corresponding decrease in slope, which is, however, not sufficient to significantly affect d-excess values of the overall groundwater signature. The most significant difference is the steeper slope for Well A, which is partially the result of interannual variation in δ18O (see Figure 6 and Figure 7 and discussion below) for that well only.
A second notable pattern evident in Figure 5 is that the two deepest wells with the deepest well casings (C and D) have similar isotopic compositions but are distinctly isotopically heavier than the two shallower wells with shallower well casings (A and B). The isotopic difference between well pair A and B and well pair C and D is ≥4.64‰ for δ2H and about 0.61‰ for δ18O, which is an unusual but clear pattern. Differences in land surface elevation (Table 2) or regional temperature or precipitation gradients within a given year are insufficient to explain the observed isotopic differences between wells. Although the record is only for 1 year, the average values of 12 months of precipitation recorded for station GRBJL–1 were −9.21‰ and −60.89‰ for δ18O and δ2H, respectively. This precipitation record may reflect warmer and wetter than average conditions than those represented by the groundwater reservoir, consistent with the concept of interannual variations in this region. Furthermore, the hydrogeologic system near the four wells is not influenced by Lake Michigan waters because the elevation of the wells is higher, and the isotopic composition of the groundwater does not resemble that of the Laurentian Great Lakes, which show enriched isotopic compositions, very different deuterium excess values, and have values which plot well below the GMWL [49]. The most likely cause of the variation in isotopic composition with depth is a combination of factors related to interannual differences in seasonal recharge rates and aquifer storage capacity. Further evidence supporting interannual differences is discussed below.
It is important to view the event-response data in the context of the local hydrogeology of each well. For example, recharge might not occur in the vicinity of the wellhead in all cases. Lateral flow velocities and proximity to recharge areas are likely to play a partial role in the signal responses detected in the study wells. Generalized flow paths have been established at the township scale for the parts of the study area that contain Wells A, B, and C [24], and a reasonable inferred flow path for the area near Well D was developed based upon local relief. Depth-to-bedrock values are well constrained in Kewaunee County [24,50]. Not only are Wells A and B located within 1 km of either very shallow (<2 m) or exposed bedrock, but they are also located in areas of significant relief (42.7 m and 32.3 m, respectively) along their respective flow paths. The exposed bedrock occurs at higher elevations in areas with obvious fracture traces (e.g., Figure 2) and, therefore, likely serves as recharge areas for Wells A and B. Conversely, Wells C and D are located on considerably longer flow paths (>2–3 km) with much lower relief (<20 m and 13.4 m, respectively). Well C is in a broad region of very shallow bedrock that serves as a recharge area, but precipitation signals are likely integrated over a 3–4 km path upgradient of the well. Well D is in an area that is ≥2 km from any shallow bedrock but is also in a region of thick clay-rich glacial sediment that is likely to delay and dampen most short-term event signals produced by infiltration.

4.4. Time-Series Analysis of Groundwater Stable Isotopic (δ18O and δ2H) Data

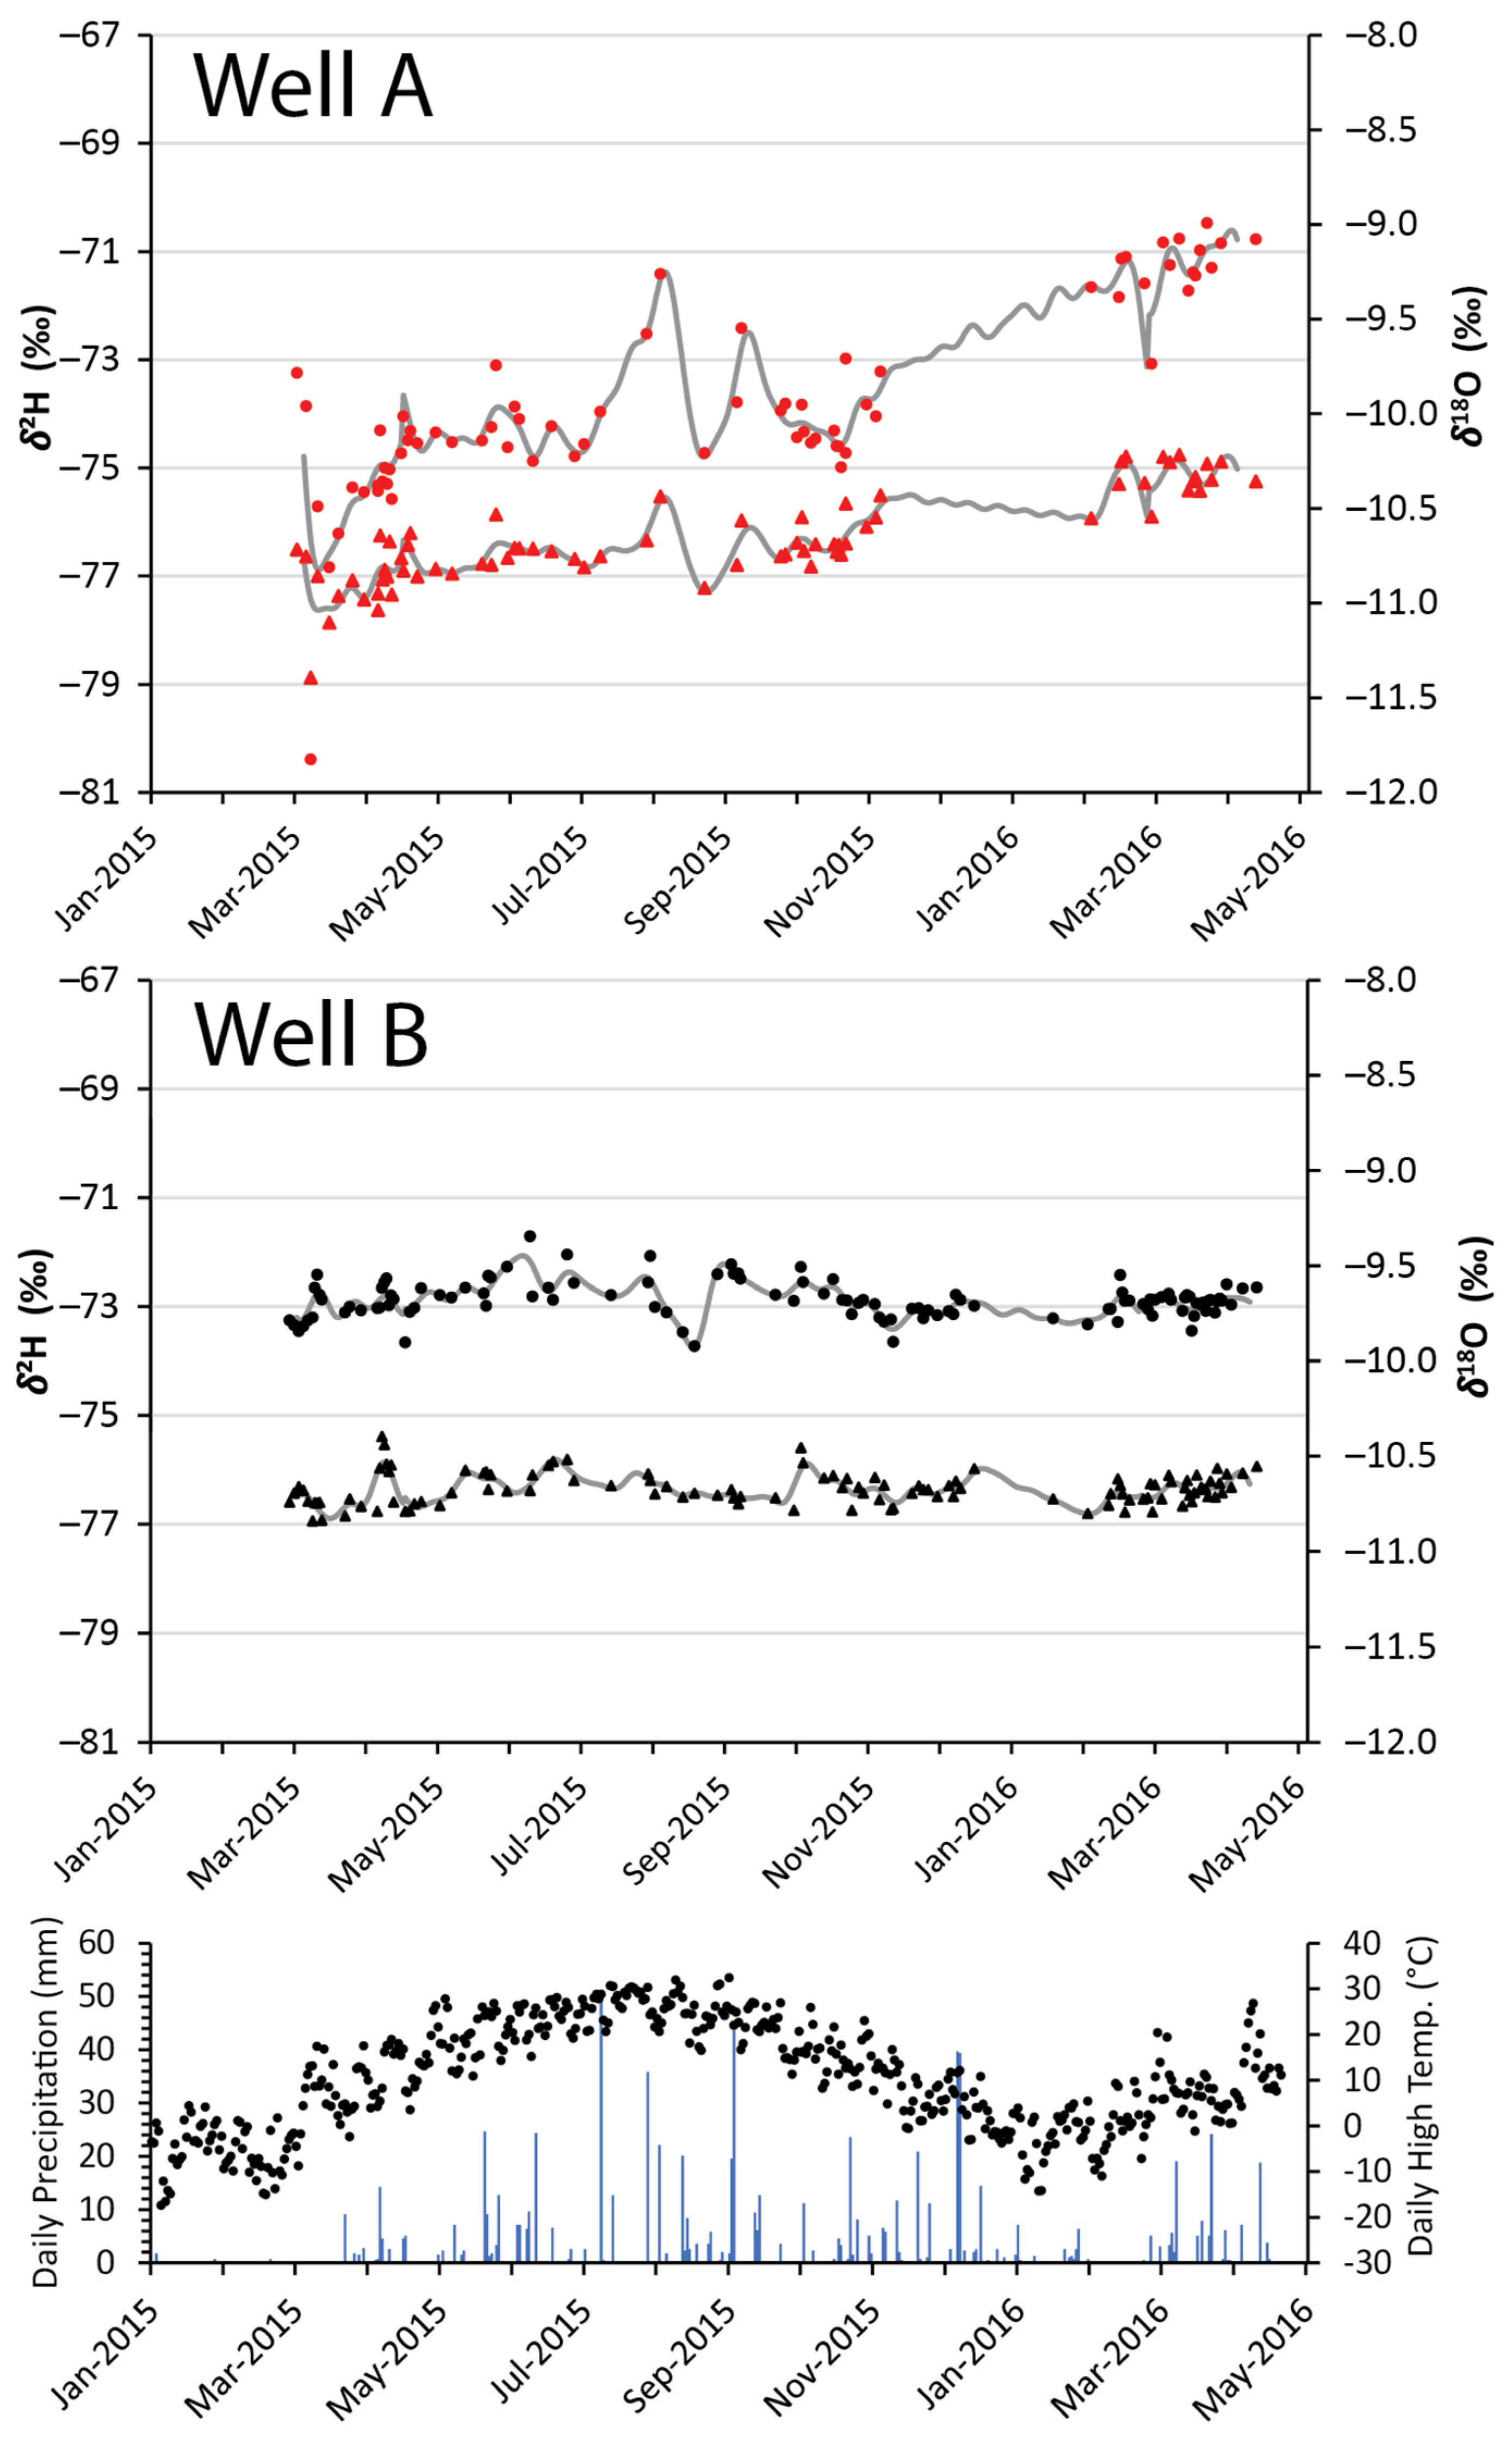
Both long-term and short-term signals are evident in the groundwater time-series data (Figure 6, Figure 7, Figure 8, Figure 9, Figure 10 and Figure 11). Long-term (months or longer) oscillations or trends that show a distinct positive slope are likely the result of either seasonal or episodic variations in the input signal (recharge water) or possibly interannual changes in the isotopic composition of water due to variations in temperature or precipitation amount. Shorter-term (days to weeks) variations appear to be event-driven signals and can be attributed to individual recharge events in many cases. Evidence of these short-term signal responses is present throughout the study period but is best expressed during larger recharge events or when the greatest isotopic difference exists between the input signal and the groundwater reservoir.

4.4.1. Long-Term Time-Series Analysis

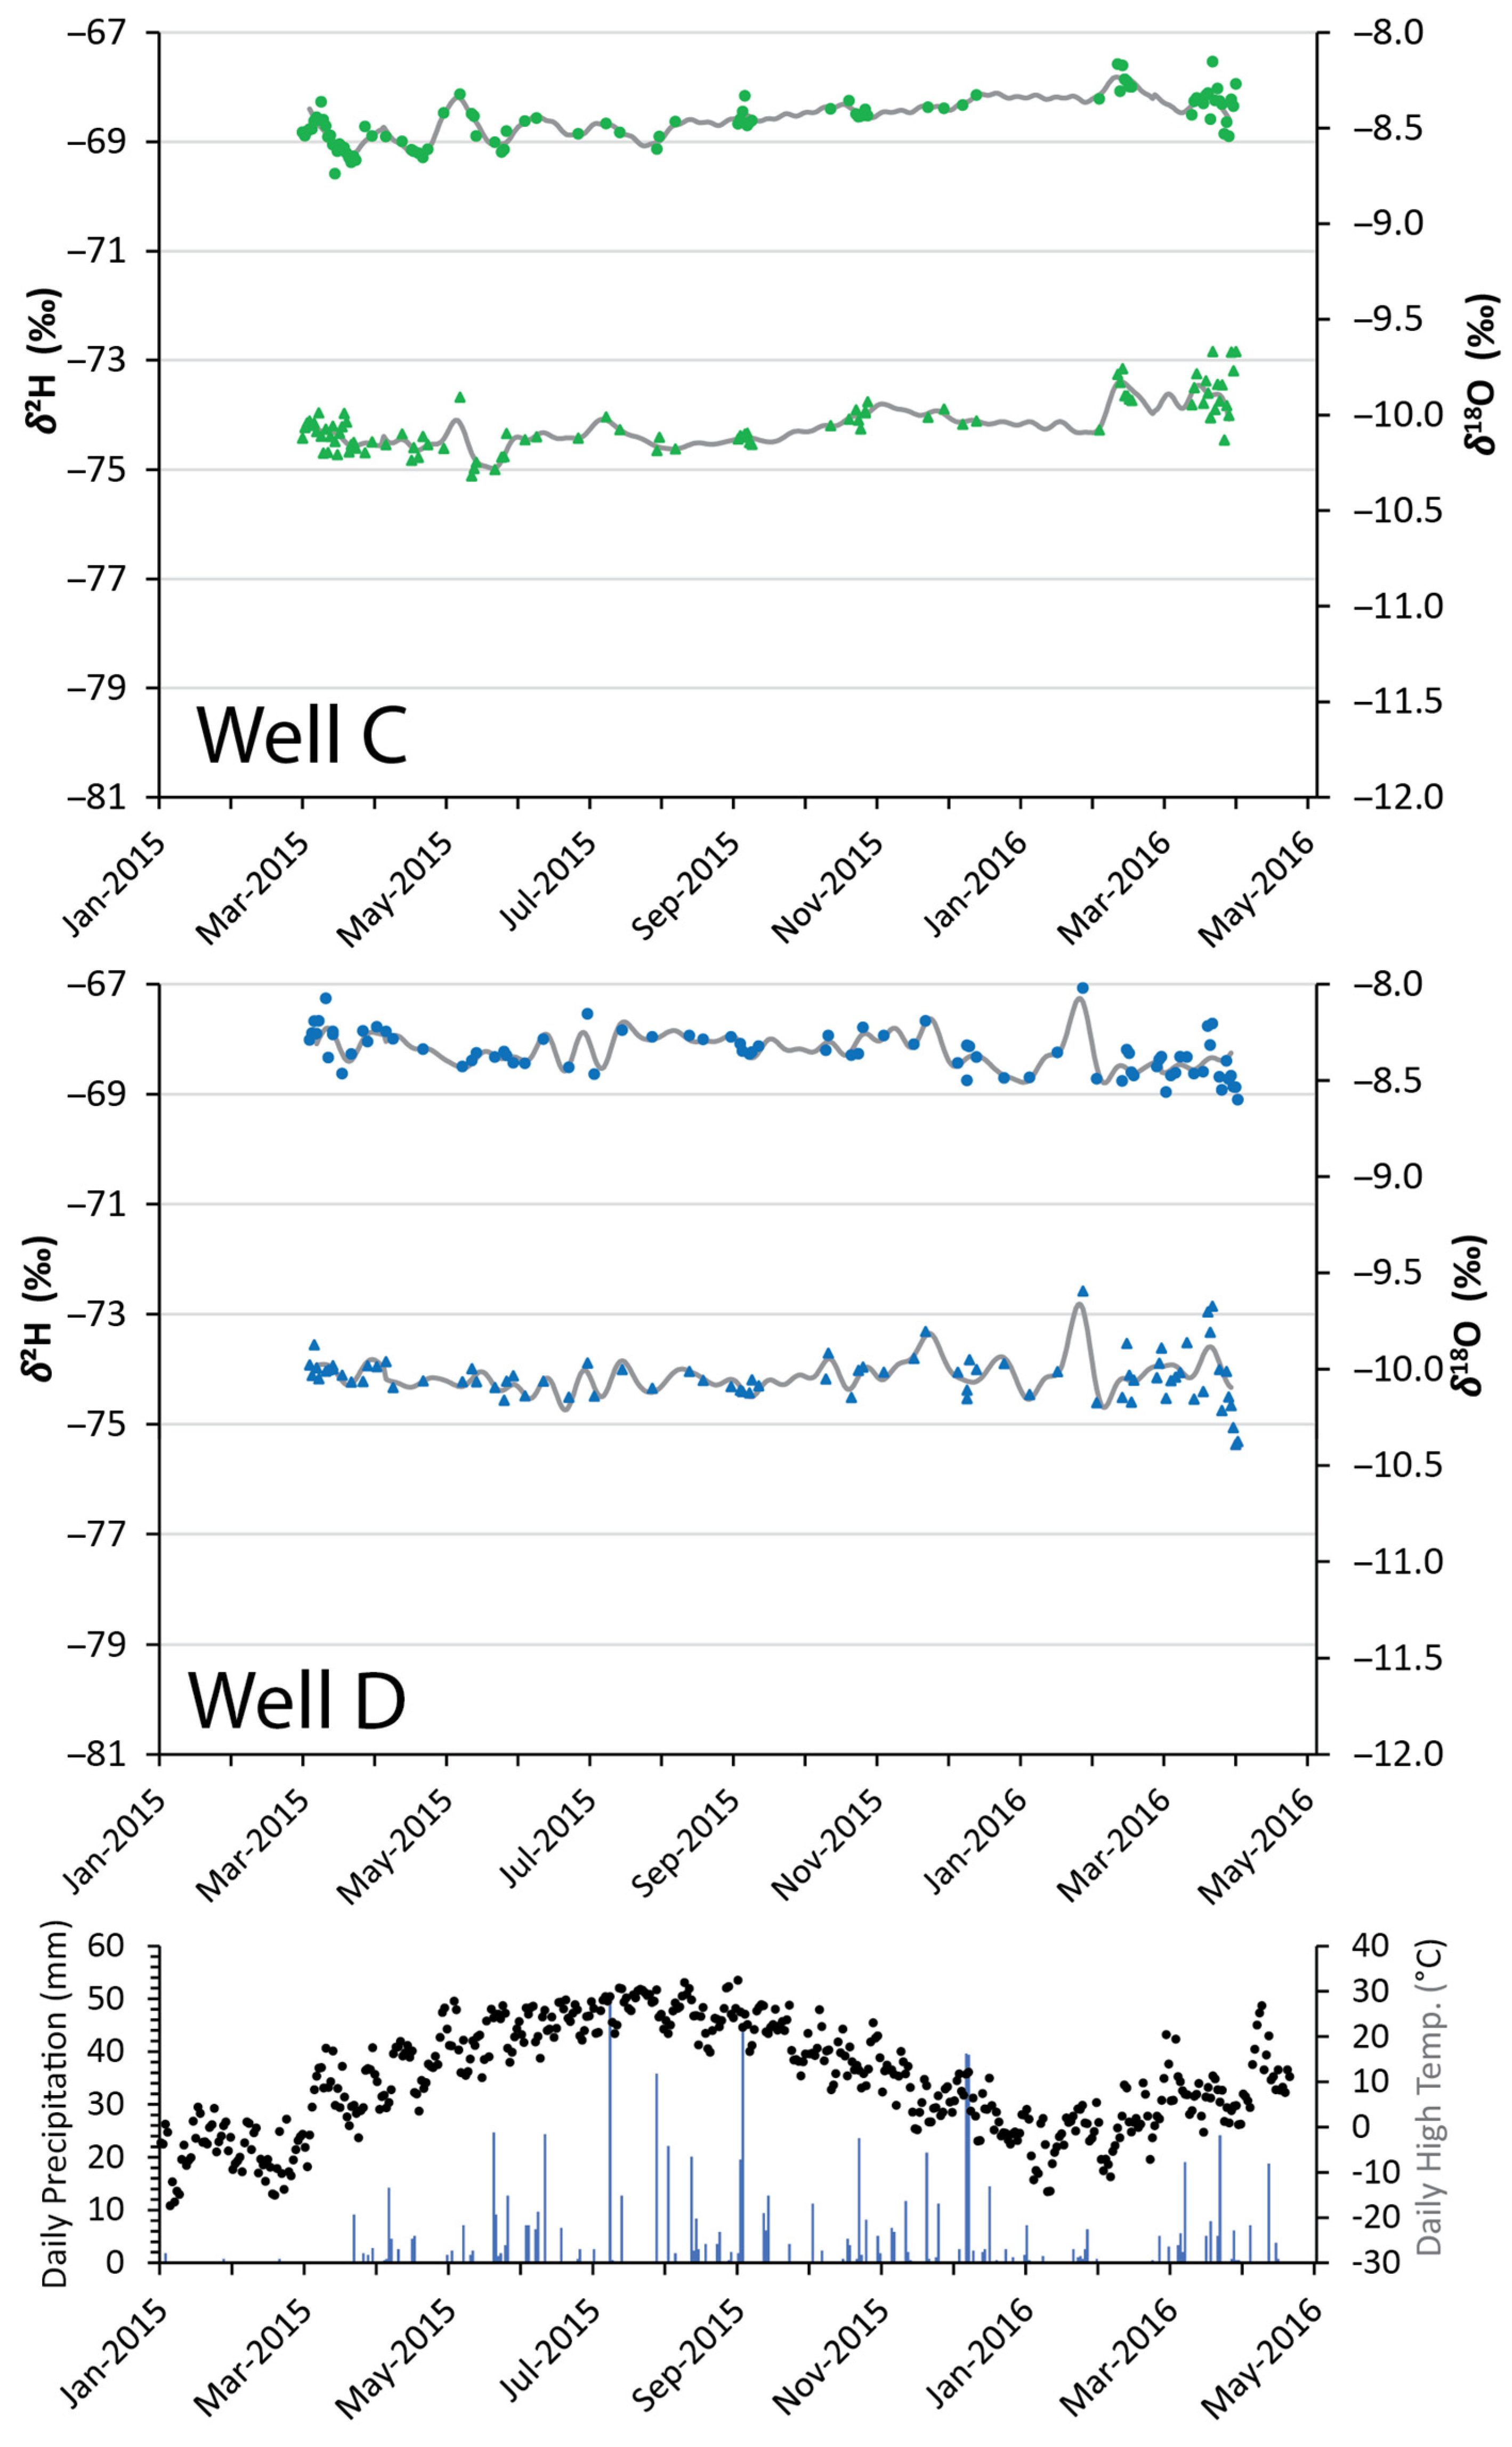
Figure 6 and Figure 7 show the long-term δ18O and δ2H isotopic signals detected in groundwater produced by the four wells in the study. All four wells showed some variation over time, but the shallower wells exhibited the most significant signal responses. For example, Well A showed the largest range in δ18O and δ2H values during the 14-month study (1.18‰ and 9.92‰, respectively), while Wells B, C, and D showed a smaller range in δ18O and δ2H values (≤0.80‰ and 2.05‰, respectively). In addition, Well A exhibits an overall increasing trend in δ18O and δ2H values during the data collection period. As mentioned above, this increasing trend is consistent with interannual variability, most likely related to colder and snowier winters in during the 2012–2013 and 2013–2014 seasons.
Most event-response pairs can be clearly established by examining the δ18O and δ2H values in the context of snowmelt periods, frost thaw, and precipitation data. The strength of our modeling technique is that it can highlight features and structures in the time-series data that help guide us in our inspection of the raw data. Our time-series modeling shows evidence of persistent signals through different threshold levels of filtering.

4.4.2. Short-Term Event-Response Analysis

Figure 8, Figure 9, Figure 10 and Figure 11 show examples of shorter time periods over which individual event-driven responses can be visualized. Ten events were identified based upon either short-term winter-spring recharge events (snow melt or melting of frozen ground) or upon rainfall events with at least 15 mm of rainfall within a 2–3-day period. A signal is considered likely when the change is beyond 0.1‰ for δ18O or 1.0‰ for δ2H. Deflection of isotopic values is observed for both isotopes in most cases.
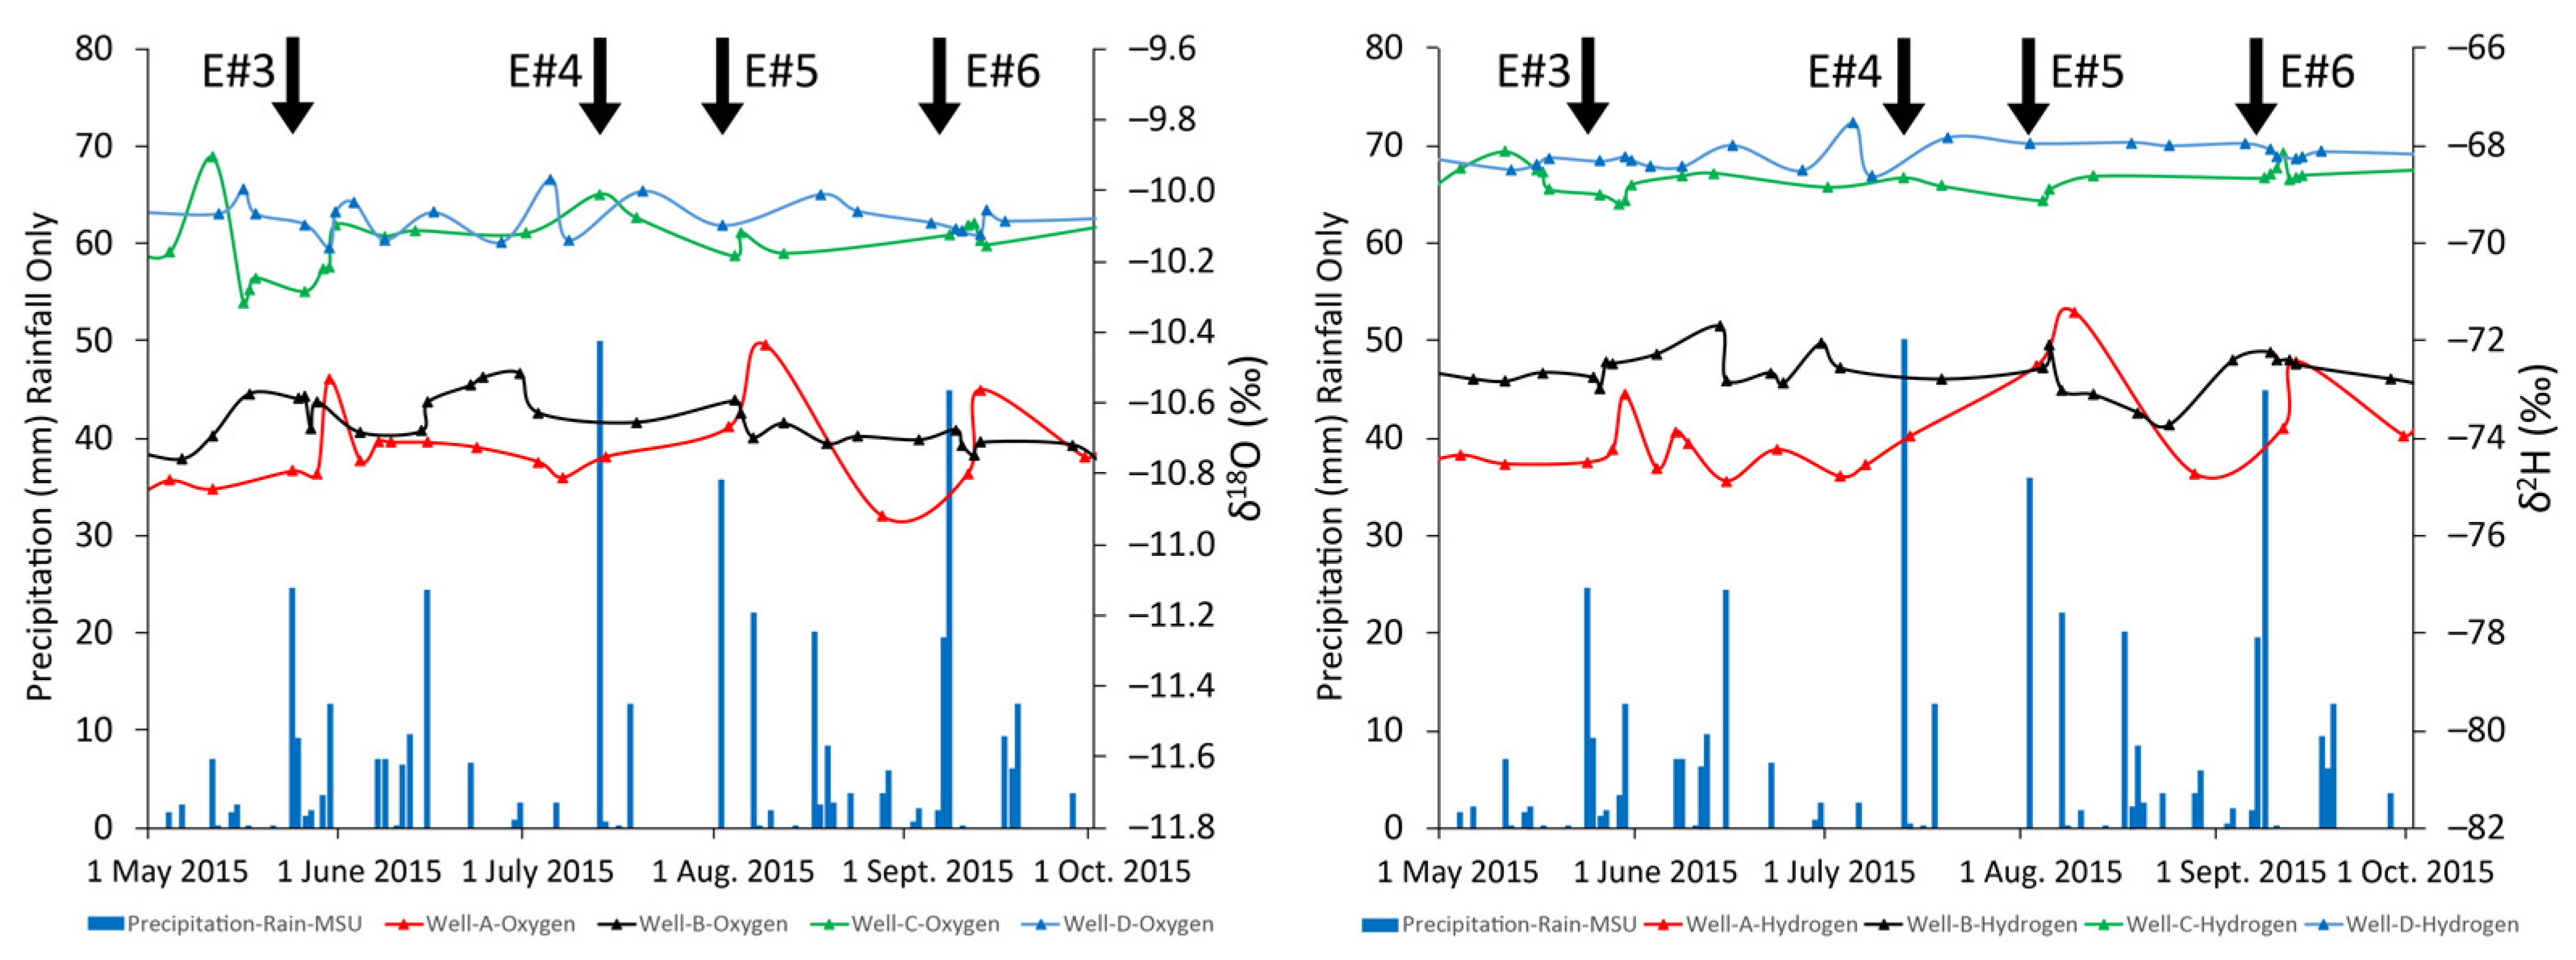
Some oscillations are not obviously paired with a single cause, especially in deeper wells, and are likely the result of multiple short-term events coupled with lag time between recharge and well capture, variations in unsaturated zone storage, heterogeneity of the water along flow paths within the aquifer, and variations in seasonal recharge potential due to frozen ground conditions. One such event occurred during the snowmelt of 18–21 February 2016. All four wells showed a clear response to the event, but the response indicated recharge of enriched waters, not depleted waters as expected from snowmelt. Whether this indicates release of unsaturated zone storage or another source is unknown.
  • Spring 2015: Events #1–3
The Spring 2015 season produced at least three events, which are identified in Figure 8, and one example is discussed here in detail for illustrative purposes. Event #1 has the most pronounced event-response relationship detected during the study and is evident to some degree in all four well records. The response to snow-melt recharge was a negative deflection in the δ18O and δ2H values of groundwater produced from the wells. The most significant response occurred in Well A, the shallowest well, but responses are also evident in Wells B, C, and D. In Well A, the δ18O and δ2H values were deflected by about 0.68‰ and 6.94‰, respectively. This was expected because the isotopic composition of snow is typically more depleted in 18O and 2H than the groundwater reservoir (Figure 5). To estimate the isotopic composition of the “input signal”, in this case snow, we used the δ18O and δ2H values of precipitation from the GRBJL–1 station on the same date (Table S1). For example, in the case of Event #1, we predict that the input signal (snowmelt) had an approximate δ18O and δ2H isotopic composition of −16.59‰ and −119.5‰, respectively. We interpret the event to be caused by warming from frozen conditions, along with complete melting of the snowpack (at least 15 cm) over a period of 4 days between 8 March and 11 March, 2015, based on regional climate data for air temperature and snow depth [42,43]. Deflection of the isotope composition toward more negative (depleted) values supports this interpretation. Considering the isotopic mixing of precipitation and well water, we estimated the minimum percentage of the produced well water that came from recharge was about 13.3% during Event #1 for Well A (Table 4). Events #2 and #3 were rainfall events and produced deflections toward enriched (isotopically heavier) values than the groundwater signal because the recharge was from warmer rains.
  • Summer 2015: Events #4–6
Several rainfall events occurred during Summer 2015, and responses were observed in nearly all cases in Well A, except where sampling frequency was insufficient. Some complex interactions occurred with shorter periods between events or when the input signal of recharge varied (enriched or depleted) during multiple subsequent events. Not all events produced a detected response in the deeper wells.
  • Fall 2015: Events #7–8
Rainfall events continued during Fall 2015, and responses were observed in most cases, except where sampling frequency was insufficient. Some complex interactions occurred with shorter periods between events or when the input signal of recharge varied (enriched or depleted) during multiple subsequent events. Not all events produced a detected response in the deeper wells.
  • Winter 2015 and early 2016: Events #9–10 and subsequent events
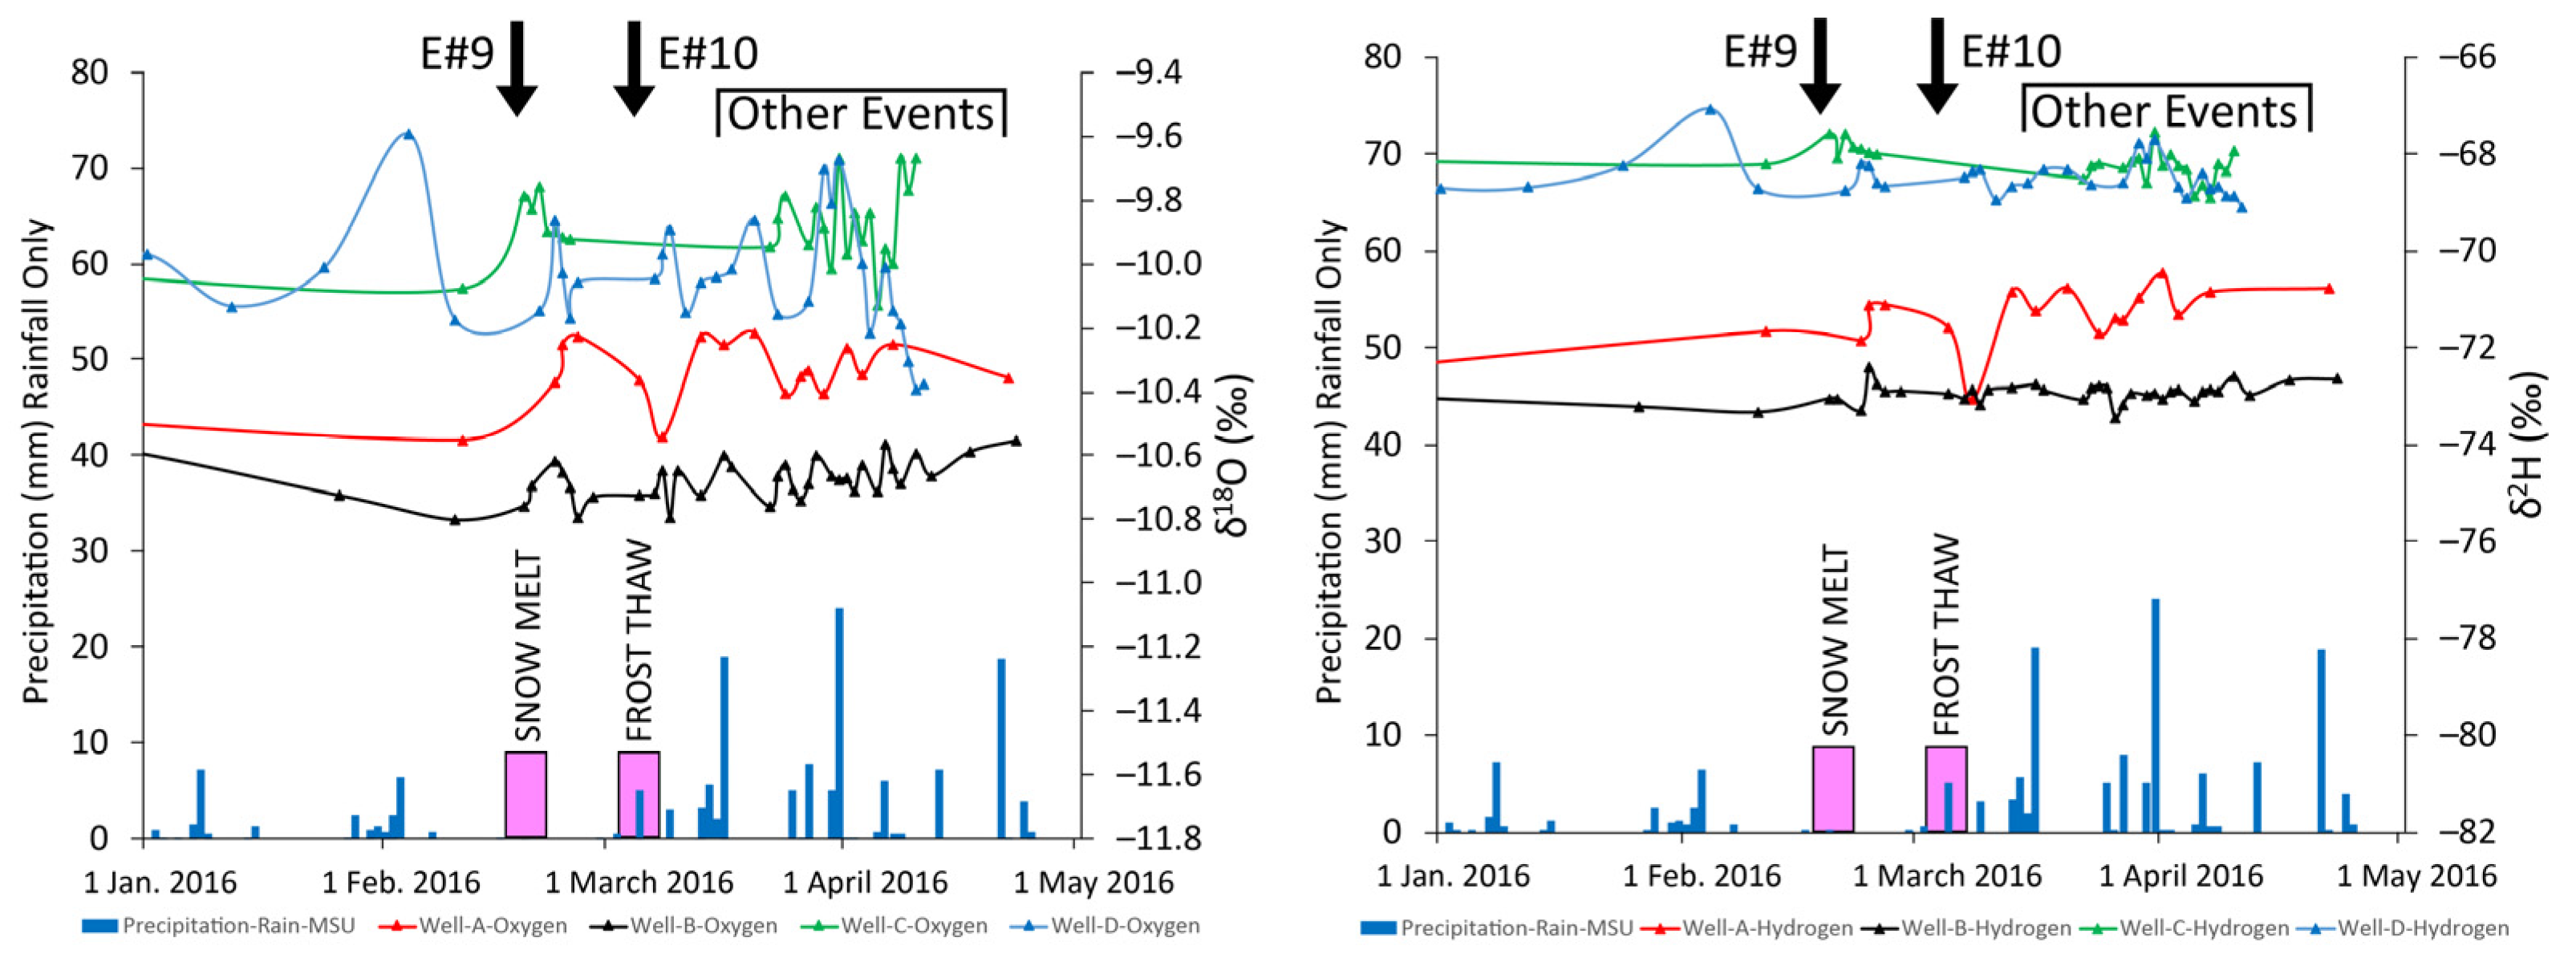
Episodic snowfall and limited rainfall occurred over an extended period during December through March. Event #9 during late February 2016 was produced by a major melting event as temperatures warmed, but because the soil was frozen, direct infiltration was unlikely through the same pathways as during non-frozen conditions. All four wells showed a clearly identifiable response to this event, but the offset direction was toward enriched (heavier) isotopes, suggesting snowmelt was not the water involved. As a result, a percent contribution could not be estimated for Table 4. Instead, we propose that the runoff into streams or direct conduits (i.e., sinkholes) likely affected the hydrologic system by moving other water in storage into each well’s capture zone. Recharging precipitation may be temporarily stored in the unsaturated zone as soil moisture in Pleistocene glacial sediments, epikarst storage at the bedrock surface, diffuse vadose zone storage in bedrock, or as a conduit vadose zone storage in bedrock [2]. The volume of water stored in the unsaturated zone may vary with the properties of the unconsolidated soil and glacial sediment, the thickness of unconsolidated material above the bedrock, and the timing and volume of precipitation events, or other climatic conditions (e.g., presence of frozen ground during winter months). The volume of water within the saturated zone also varies with the effective porosity of the bedrock in the saturated zone and the presence and abundance of karst conduits, such as caves or solution-enlarged joints and bedding planes.
Event #10 followed during early March and was dominated by water released from storage in the unsaturated zone because of the thawing of frozen ground, with limited snowmelt contribution. This event also produced expected responses, but oscillating warm and cold events coupled with frequent precipitation during the rest of spring 2016 made individual events difficult to distinguish. The oscillations in isotopic signals occurred at roughly the same frequency as the rain events but were likely lagged to different degrees in each well. However, greater isotopic ranges for this period, compared with those of summer and fall 2015, are consistent with recharge events from water with rapidly changing isotopic signatures.
Table 4 provides an overview of 10 major events during the year, along with estimates for the percentage of water produced from the aquifer that was recently recharged. The percentage of surface water recharging the aquifer is probably a minimum estimate because the peak deflections are not always expected to have been observed with the available sampling frequency. Nevertheless, the estimates provided in Table 4 show a decreasing proportion of recharge impacting the aquifer in each case. For most events recorded in Well A, approximately 3–13% of the water produced from the well is estimated to have been recent recharge during any individual event. The contribution of freshly input recharge event waters to the saturated zone diminished for deeper wells, with Well B showing 2–5.7% for most events, Well C showing ≤3.8% for all events, and Well D showing ≤4.7% for all events (all but one ≤1.5%). This pattern is consistent with recharge observations in other settings [10].

5. Discussion

Our study design included testing wells with various depths and thicknesses of unconsolidated soils above karstified bedrock. These included three wells known to have been contaminated and one that was free from contamination in the past. As expected, all three wells with prior evidence of contamination showed measurable isotopic responses to recharge events, with the greatest responses observed in groundwater produced from the shallowest wells with shortest overall flow paths.
Regardless of the input signal type (snow or rain), similar event magnitudes produced similar percentage estimates of recharge water produced from each well, suggesting that the procedure was consistent across several events and is reliable. The percentage estimates are also consistent with observations of “Brown Water Incidents” (BWIs) [33], as well as microbial (e.g., bacterial, viral) contamination in well water in the study area, which can sometimes appear within as little as 24–48 h of certain land use activities, such as spreading of dairy manure. Deflections in the groundwater isotopic signal were consistent with these previous water quality observations, although the sampling frequency was not daily in most cases, which adds some uncertainty to the timing of the initial signal deflection. The lag times calculated using the isotopic data were between 0 and 7 days, but typically between 0 and 5 days. Although most precipitation events were detected as isotopic signal deflections, some may have been missed due to insufficient sampling frequencies by homeowners (e.g., Event #4 in Wells A and B).
Consideration was given to whether the isotopic values collected as part of the LMWL study were representative of the isotopic input signal for precipitation near the four wells in the study. There are two principal reasons that we consider the isotopic composition of precipitation at GRBJL–1 to be an adequately representative estimate of the isotopic composition of precipitation near the well sites. First, no significant regional changes in temperature or elevation occur over this small geographic range (~25 km) that would be expected to influence the isotopic composition for the large events identified in this study. Second, a comparison of the precipitation station GRBJL–1 with the Casco precipitation station operated by Michigan State University (Figure 1) reveals that the large precipitation events (i.e., >25 mm) represent regional precipitation events produced by the same weather systems, which would be expected to produce precipitation with similar isotopic composition. A comparison of the seven rain events between the GRBJL–1 and Casco Stations reveals that the difference in precipitation amounts for each of these events was within 32.3% and was typically <20% (range 2.5 to 32.3%). In addition, the isotopic composition of snowmelt, which is lighter than average groundwater, and rainfall, which is heavier than average groundwater, appear to produce the correct directional signal changes for nearly all events. Uncertainties in this method are more likely to have been caused by insufficient well sampling periodicity and variations due to unknown amounts of evapotranspiration or storage in the unsaturated zone.
An additional evaluation was made to determine if there was a significant difference between the isotopic composition of average groundwater and precipitation for the major numbered events outlined in Figure 8, Figure 9, Figure 10 and Figure 11. We investigated whether the recharging water was isotopically different enough to be detected. There is a very large seasonal difference between the isotopic compositions of warm and cold season precipitation in Wisconsin [39]. Snow is very depleted compared with average groundwater, and large rainfall events are enriched, relative to the average groundwater isotopic composition. This results in differences between the groundwater and precipitation of >2‰ and >15‰ for δ18O and δ2H, respectively, with most events having differences of >4‰ and >40‰. Therefore, we are confident that each numbered event has a significant isotopic offset between the precipitation and average groundwater. For example, for Event #1, we used the weighted average of the five preceding snowfall events that had accumulated on the surface between 2 February and 3 March 2015 that melted during the period 8–11 March 2015 to represent the isotopic value for the recharge value (also Table S11). The weighted average for these precipitation events was −16.59‰ and −119.47‰ for δ18O and δ2H, respectively, which are distinctly depleted compared with the average range of groundwater isotopes shown in Figure 8, Figure 9, Figure 10 and Figure 11. For Event #2, the average of two rainfall events recorded on 9 April 2015 was used as the input signal to represent the isotopic value for recharge. In this event, the precipitation had values of −6.69‰ and −41.75‰ for δ18O and δ2H, respectively, which are distinctly enriched compared with the average range of groundwater isotopes observed in all four wells (Figure 8, Figure 9, Figure 10 and Figure 11).
A relationship showing diminished seasonal isotopic variance at increasing depths beneath the water table was shown by Petrella and Celico [10] for a karstified carbonate aquifer in Italy. They noted significant seasonal isotopic variance in the saturated zone between the water table and about 10–15 m below the water table, with lesser isotopic variance observed to a depth of 35 m. For the four wells in this study (Kewaunee County), the two wells with the most seasonal or event-driven isotopic variance (A and B) have the least saturated thickness exposed in the wells (21.3 and 24.9 m, respectively), with Well A having a very limited unsaturated zone (1.22 m). The two wells with less isotopic variance (C and D) penetrate much thicker and deeper saturated portions of the aquifer (45.8 and 94.1 m, respectively).
Well A was likely most vulnerable to rapid recharge events because of the lack of soil filtration capacity near the well (i.e., shallow depth-to-bedrock), coupled with nearby exposed fractured and karstified carbonate bedrock in an area of significant relief. Limited soil would increase recharge rates and would limit the amount of evapotranspiration that might occur before aquifer recharge compared with the other three wells with greater soil thickness. This effect could, in turn, lower the slope of the regression line for Wells B, C, and D. In addition, although this study does not have multiple years of precipitation or groundwater isotopic data to compare, well A had much larger interannual isotopic change during the study period (at least 1–1.5‰ in δ18O; Figure 6), compared with the other wells, which likely led to a steeper slope. The 2013–2014 winter season saw record breaking cold temperatures, with 54 days below −17.8 °C (0 °F) [51], and both the 2012–2013 and 2013–2014 winter seasons had snowfall totals that were about 40% above average. Coupled with this cold, the season also produced abnormally heavy snowfall (14th snowiest on record) that may have loaded the shallower parts of the aquifer with water depleted in 18O and 2H. (i.e., Wells A and B), thereby separating them isotopically from deeper wells that are more likely to represent the long-term isotopic average for the aquifer (e.g., Wells C and D). This effect was noted by Vachon et al. [39] where they concluded that annual isotopic δ18O values are affected by the seasonality of precipitation between years. We suggest that seasons with abnormal temperature and precipitation might also provide a unique opportunity to estimate groundwater recharge vulnerability using long-term time-series isotopic data, especially across multiple years.
While Petrella and Celico [10] concluded that fresh infiltration water can be up to 40% of the whole groundwater pool within 10 m of the water table, they also concluded that below this depth, the percentage of fresh infiltration water was <5% and was, therefore, “negligible”. However, based upon viral or bacterial loading values (e.g., [25,30,35,36]), from a pathogenic perspective, even tenths of a percent of recharging water could drastically affect human health, even though an isotopic response might not be detectable with confidence. Conversely, detectable deviations in the isotopic signature of well water relating to specific recharge events are, therefore, a reasonable test for well vulnerability, regardless of whether detectable microbes are present at any given time or location in the aquifer.
Our initial hypothesis was that spring snow melt seasons would yield the largest signals. Unfortunately, late winter and early spring in both years (2015 and 2016) had below normal snow precipitation, resulting in a diminished potential for an input signal from snow-melt recharge events. Nevertheless, clear isotopic signals for δ18O and δ2H were still detected for two reasons. First, the isotopic difference between the snowmelt and the resident groundwater reservoir was large (up to 16.6‰ and 119.5‰ for δ18O and δ2H, respectively). In addition, the karst nature of the bedrock, especially in areas of thin soils, allowed for rapid recharge to occur, with flow either bypassing or passing through the unconsolidated Pleistocene overburden into the saturated zone of the aquifer. We predict that years with more significant snowfall that are coupled with rapid melting periods should produce stronger signals than we detected during our study period. Recharge-related isotopic signals were also detected for larger rainfall events throughout the year.
Our study clearly shows that stable isotope analysis of δ18O and δ2H can be used to estimate recharge mixing proportions and predict contamination, without the need for an actual contaminant to be present in a well. There are several reasons why this method has merit, whether in conjunction with traditional water quality indicators or as a substitute: (1) The method is relatively inexpensive, with longer hold times and simpler sampling procedures than virus or bacteria sampling. (2) Pathogen occurrence in groundwater is expected to vary considerably in space and time and sampling may, therefore, not capture the precise timing of an impact, and (3) pathogen characterization in groundwater requires large volumes of water to be filtered, limiting temporal characterizations [26].

6. Conclusions

This study demonstrates how citizen science can be used to track water isotopes in well water over time to assist in the indirect assessment of well vulnerability to the influx of surface-derived contaminants. Four homeowners with domestic wells participated in a 14-month study to collect tap water samples representing groundwater from the karstified Silurian dolostone aquifer of Kewaunee County, Wisconsin. A separate endeavor to construct a local meteoric water line (LMWL) nearby in an adjacent county enabled the estimation of isotopic compositions for precipitation, especially for larger regional events. Clear isotopic signals were recorded in well samples shortly after event-driven recharge events. Snow melt and frost thaw events produced deflections of up to 0.7‰ and 6.9‰ for δ18O and δ2H, respectively, for the most extreme event of snow melt infiltration. Some seasonal and interannual changes in the isotopic composition of precipitation were also observed, with one well showing an increase in δ18O and δ2H values of 0.5‰ and 4‰, respectively, during the sampling period. The magnitude of short-term event signals was used to estimate aquifer mixing ratios based upon the known seasonal variation in δ18O and δ2H values, along with known snow and rain isotopic compositions from the LMWL dataset.
The average δ18O and δ2H isotopic compositions of the shallower wells were isotopically lighter by at least 0.6‰ and 4.6‰, respectively, which likely reflects the isotopic influence of recharge from recent colder seasons compared with wells with deeper flow paths, despite all four wells being in reasonably close proximity. We estimate as much as 5–13% of groundwater produced by shallow domestic wells in our study area was from discrete recharge events, but all wells showed at least some isotopic response to recharge events, regardless of well depth or soil cover. Time-series sampling of water stable isotopes from karst aquifer wells is a viable method to evaluate the vulnerability of wells. This method avoids the need for expensive microbial testing protocols and remains possible when contamination may not be present at the time of sampling.

Supplementary Materials

The following supporting information can be downloaded at: https://www.mdpi.com/article/10.3390/hydrology10060133/s1. Table S1: Precipitation δ2H and δ18O data from location GRBJL–1 used to construct the LMWL for Green Bay, Wisconsin; Table S2: Additional precipitation data not used in the construction of the LMWL; Table S3: Groundwater stable isotope data for Well A; Table S4: Groundwater stable isotope data for Well B; Table S5: Groundwater stable isotope data for Well C; Table S6: Groundwater stable isotope data for Well D; Table S7: Modeled δ2H and δ18O data for Well A; Table S8: Modeled δ2H and δ18O data for Well B; Table S9: Modeled δ2H and δ18O data for Well C; Table S10: Modeled δ2H and δ18O data for Well D; Table S11: Calculations of isotopic input signals for recharge for Events #1–10.

Author Contributions

Conceptualization, J.A.L. and A.K.; methodology, J.A.L., A.K. and M.N.; precipitation sample collection, J.A.L.; well sample collection, four anonymous citizen scientists, J.A.L. and A.K.; time-series smoothing and analysis, M.N.; water isotope analysis, A.S.; writing—original draft preparation, J.A.L.; writing—review and editing, J.A.L. and A.S. All authors have read and agreed to the published version of the manuscript.

Funding

Partial funding was provided by three internal research funds at the University of Wisconsin—Green Bay, including the Research Council, the Cofrin Center for Biodiversity’s Heirloom Plant Sale Fund, and the Geoscience Fund.

Data Availability Statement

All supporting data are available either in the tables, Supplementary Files, or through the links cited in the study.

Acknowledgments

We would like to acknowledge the four anonymous private well owners who collected water samples throughout the sampling period, without whom this study would not have been possible; Elizabeth Luczaj and Gary Dallman who collected a few rain water samples used to construct the LMWL; Davina Bonness (Kewaunee County Land and Water Conservation Department) who made the initial connections with homeowners; Erin Berns-Herrboldt who provided valuable feedback and ideas; and Kevin Erb, Steve Meyer, Edward J. Hopkins and other NOAA staff who provided assistance with finding climate-related data. Three anonymous reviewers also helped to improve the manuscript.

Conflicts of Interest

The authors declare no conflict of interest.

References

  1. Ford, D.; Williams, P. Karst Hydrogeology and Geomorphology, 2nd ed.; John Wiley & Sons Ltd.: West Sussex, UK, 2007; pp. 1–562. [Google Scholar]
  2. Lakey, B.; Krothe, N.C. Stable isotopic variation of storm discharge from a perennial karst spring, Indiana. Water Resour. Res. 1996, 32, 721–731. [Google Scholar] [CrossRef]
  3. Zachariasen, G. Caves and karst of the Niagara Escarpment: A caver’s perspective. Geosci. Wis. 2016, 22, 1–9. Available online: https://wgnhs.wisc.edu/pubshare/GS22-a05.pdf (accessed on 16 April 2023).
  4. Sappa, G.; Vitale, S.; Ferranti, F. Identifying Karst Aquifer Recharge Areas using Environmental Isotopes: A Case Study in Central Italy. Geosciences 2018, 8, 351. [Google Scholar] [CrossRef] [Green Version]
  5. Iacurto, S.; Grelle, G.; De Filippi, F.M.; Sappa, G. Karst Recharge Areas Identified by Combined Application of Isotopes and Hydrogeological Budget. Water 2021, 13, 1965. [Google Scholar] [CrossRef]
  6. Mahindawansha, A.; Jost, M.; Gassmann, M. Spatial and Temporal Variations of Stable Isotopes in Precipitation in the Mountainous Region, North Hesse. Water 2022, 14, 3910. [Google Scholar] [CrossRef]
  7. Cane, G.; Clark, I.D. Tracing Ground Water Recharge in and Agricultural Watershed with Isotopes. Ground Water 1999, 37, 133–139. [Google Scholar] [CrossRef]
  8. Doctor, D.H.; Alexander, E.C., Jr.; Petrič, M.; Kogovšek, J.; Urbanc, J.; Lojen, S.; Stichler, W. Quantification of karst aquifer discharge components during storm events through end-member mixing analysis using natural chemistry and stable isotopes as tracers. Hydrogeol. J. 2006, 14, 1171–1191. [Google Scholar] [CrossRef]
  9. Petitta, M.; Scarascia-Mugnozza, G.; Barbieri, M.; Bianchi-Fasani, G.; Esposito, C. Hydrodynamic and isotopic investigations for evaluating the mechanisms and amount of groundwater seepage through a rockslide dam. Hydrol. Process. 2010, 24, 3510–3520. [Google Scholar] [CrossRef]
  10. Petrella, E.; Celico, F. Mixing of water in a carbonate aquifer, southern Italy, analyzed through stable isotope investigations. Int. J. Speleol. 2013, 42, 25–33. [Google Scholar] [CrossRef] [Green Version]
  11. Delbart, C.; Barbecot, F.; Valdes, D.; Tognelli, A.; Fourre, E.; Purtschert, R.; Couchoux, L.; Jean-Baptiste, P. Investigation of young water inflow in karst aquifers using SF6-CFC-3H/He-85Kr-39Ar and stable isotope components. Appl. Geochem. 2014, 50, 164–176. [Google Scholar] [CrossRef]
  12. Kanduč, T.; Grassa, F.; McIntosh, J.; Stibilj, V.; Ulrich-Supovec, M.; Supovec, I.; Jamnikar, S. A Geochemical and stable isotope investigation of groundwater/surface-water interactions in the Velenje Basin, Slovenia. Hydrogeol. J. 2014, 22, 971–984. [Google Scholar] [CrossRef]
  13. Palcsu, L.; Gessert, A.; Túri, M.; Kovács, A.; Futó, I.; Orsovszki, J.; Puskás-Preszner, A.; Temovski, M.; Koltai, G. Long-term time series of environmental tracers reveal recharge and discharge conditions in shallow karst aquifers in Hungary and Slovakia. J. Hydrol. Reg. Stud. 2021, 36, 100858. [Google Scholar] [CrossRef]
  14. Mance, D.; Radišić, M.; Lenac, D.; Rubinić, J. Hydrological Behavior of Karst Systems Identified by Statistical Analyses of Stable Isotope Monitoring Results. Hydrology 2022, 9, 82. [Google Scholar] [CrossRef]
  15. Maloszewski, P.; Stichler, W.; Zuber, A.; Rank, D. Identifying the flow systems in a karstic-fissured-porous aquifer, the Schneealpe, Austria, by modelling of environmental 18O and 3H isotopes. J. Hydrol. 2002, 256, 48–59. [Google Scholar] [CrossRef]
  16. Schwarz, K.; Barth, J.A.C.; Postigo-Rebollo, C.; Grathwohl, P. Mixing and transport of water in a karst catchment: A case study from precipitation via seepage to the spring. Hydrol. Earth Syst. Sci. 2009, 12, 285–292. [Google Scholar] [CrossRef] [Green Version]
  17. Hu, Y.; Liu, Z.; Ford, D.; Zhao, M.; Bao, Q.; Zeng, C.; Gong, X.; Wei, Y.; Cai, X.; Chen, J. Conservation of oxygen and hydrogen seasonal isotopic signals in meteoric precipitation in groundwater: An experimental tank study of the effects of land cover in a summer monsoon climate. Geochim. Cosmochim. Acta 2020, 284, 254–272. [Google Scholar] [CrossRef]
  18. Njue, N.; Kroese, J.S.; Gräf, J.; Jacobs, S.R.; Weeser, B.; Breuer, L.; Rufino, M.C. Citizen science in hydrological monitoring and ecosystem services management: State of the art and future prospects. Sci. Total Environ. 2019, 693, 133531. [Google Scholar] [CrossRef]
  19. Harris, C. World’s Largest Freshwater Citizen Science Project Set to Tap into Groundwater Quality. Australian Water Association (1 December 2022). Available online: https://www.awa.asn.au/resources/latest-news/worlds-largest-freshwater-citizen-science-project-set-to-tap-into-groundwater-quality (accessed on 26 February 2023).
  20. Muldoon, M.A.; Simo, J.A.; Bradbury, K.R. Correlation of hydraulic conductivity with stratigraphy in a fractured-dolomite aquifer, northeastern Wisconsin, USA. Hydrogeol. J. 2001, 9, 570–583. Available online: https://link.springer.com/content/pdf/10.1007/s10040-001-0165-5.pdf (accessed on 16 April 2023).
  21. Luczaj, J.A. Geology of the Niagara escarpment in Wisconsin. Geosci. Wis. 2013, 22, 1–34. Available online: http://wgnhs.uwex.edu/pubs/gs22a01/ (accessed on 28 January 2022).
  22. Rayne, T.W.; Bradbury, K.R.; Muldoon, M.A. Delineation of capture zones for municipal wells in fractured dolomite, Sturgeon Bay, Wisconsin, USA. Hydrogeol. J. 2001, 9, 432–450. [Google Scholar] [CrossRef]
  23. Bradbury, K.R. Door County’s groundwater: An asset or a liability? In Proceedings Conference on Door County and the Niagara Escarpment: Foundations for the Future; Hershbell, K., Ed.; Wisconsin Academy of Sciences, Arts, and Letters: Madison, WI, USA, 1989; pp. 36–44. [Google Scholar]
  24. Parsen, M.J.; Mauel, S.W.; Streiff, C.M. Hydrogeological characterization of the Town of Lincoln, Kewaunee County, Wisconsin. WGNHS Open File Rep. 2017, 2017-05, 33p, Plus Maps and Appendices. Available online: https://wgnhs.wisc.edu/pubshare/WOFR2017-05.pdf (accessed on 6 April 2023).
  25. Muldoon, M.A.; Borchardt, M.A.; Spencer, S.K.; Hunt, R.J.; Owens, D. Using Enteric Pathogens to Assess Sources of Fecal Contamination in the Silurian Dolomite Aquifer: Preliminary Results. In Karst Groundwater Contamination and Public Health, Advances in Karst Science; White, W., Herman, J., Herman, E., Rutigliano, M., Eds.; Springer: Cham, Switzerland, 2018; pp. 209–213. [Google Scholar] [CrossRef]
  26. Owens, D.W.; Hunt, R.J.; Firnstahl, A.D.; Muldoon, M.A.; Borchardt, M.A. Automated Time Series Measurement of Microbial Concentrations in Groundwater -Derived Water Supplies. Groundwater 2019, 57, 329–336. [Google Scholar] [CrossRef] [Green Version]
  27. Mudrey, M.G., Jr.; Brown, B.A.; Greenberg, J.K. Bedrock Geologic Map of Wisconsin; University of Wisconsin-Extension, Geological and Natural History Survey: Madison, WI, USA, 1982; scale = 1:1,000,000. [Google Scholar]
  28. Luczaj, J.A.; Maas, J.; Hart, D.J.; Odekirk, J. Aquifer Drawdown and Recovery in the Northeast Groundwater Management Area, Wisconsin, USA: A Century of Groundwater Use. Geosciences 2017, 7, 11. [Google Scholar] [CrossRef] [Green Version]
  29. Erb, K.R.; Stieglitz, R. Final Report of the Northeast Wisconsin Karst Task Force; University of Wisconsin—Extension: Madison, WI, USA, 2007; pp. 1–46. [Google Scholar]
  30. Borchardt, M.A.; Bradbury, K.R.; Alexander, E.C., Jr.; Kolberg, R.J.; Alexander, S.C.; Archer, J.R.; Braatz, L.A.; Forest, B.M.; Green, J.A.; Spencer, S.K. Norovirus outbreak caused by a new septic system in a dolomite aquifer. Ground Water 2011, 49, 85–97. [Google Scholar] [CrossRef]
  31. Bauer, A.C.; Wingert, S.; Fermanich, K.J.; Zorn, M.E. Well water in karst regions of northeastern Wisconsin contains estrogenic factors, nitrate, and bacteria. Water Environ. Res. 2013, 85, 318–326. [Google Scholar] [CrossRef]
  32. Bonness, D.; Masarik, K. Investigating Intra-Annual Variability of Well Water Quality in Lincoln Township; Final Report; June 2014; pp. 1–42. Available online: http://www.uwsp.edu/cnr-ap/watershed/Documents/Lincoln_FinalReport.pdf (accessed on 28 January 2022).
  33. Erb, K.; Ronk, E.; Koundinya, V.; Luczaj, J.A. Groundwater Quality Changes in a Karst Aquifer of Northeastern Wisconsin, USA: Reduction of Brown Water Incidence and Bacterial Contamination Resulting from Implementation of Regional Task Force Recommendations. Resources 2015, 4, 655–672. [Google Scholar] [CrossRef]
  34. Luczaj, J.A.; Masarik, K. Groundwater Quantity and Quality Issues in a Water-Rich Region: Examples from Wisconsin, USA. Resources 2015, 4, 323–357. [Google Scholar] [CrossRef]
  35. Borchardt, M.A.; Stokdyk, J.P.; Kieke, B.A., Jr.; Muldoon, M.A.; Spencer, S.K.; Firnstahl, A.D.; Bonness, D.E.; Hunt, R.J.; Burch, T.R. Sources and Risk Factors for Nitrate and Microbial Contamination of Private Household Wells in the Fractured Dolomite Aquifer of Northeastern Wisconsin. Environ. Health Perspect. 2021, 129, 067004. [Google Scholar] [CrossRef]
  36. Burch, T.R.; Stokdyk, J.P.; Spencer, S.K.; Kieke, B.A., Jr.; Firnstahl, A.D.; Muldoon, M.A.; Borchardt, M.A. Quantitative Microbial Risk Assessment for Contaminated Private Wells in the Fractured Dolomite Aquifer of Kewaunee County, Wisconsin. Environ. Health Perspect. 2021, 129, 067003. [Google Scholar] [CrossRef]
  37. Nicole, W. Farm to Faucet? Agricultural Waste and Private Well Contamination in Kewaunee County, Wisconsin. Environ. Health Perspect. 2021, 129, 114001. [Google Scholar] [CrossRef]
  38. National Centers for Environmental Information—National Oceanic and Atmospheric Administration. Data Search—National Centers for Environmental Information (NCEI). Available online: https://www.ncei.noaa.gov/access/search/data-search/normals-annualseasonal-2006-2020 (accessed on 5 April 2023).
  39. Vachon, R.W.; White, J.W.C.; Gutmann, E.; Welker, J.M. Amount-weighted annual isotopic (δ18O) values are affected by the seasonality of precipitation: A sensitivity study. Geophys. Res. Lett. 2007, 34, L21707. [Google Scholar] [CrossRef]
  40. Swanson, S.K.; Bahr, J.M.; Potter, K.W. A Local Meteoric Water Line for Madison, Wisconsin. Wis. Geol. Nat. Hist. Surv. Open-File Rep. 2006, 2006-01, 4p. [Google Scholar]
  41. Michigan State University Enviroweather. Casco/Luxemburg, WI—MSU Enviroweather. Available online: https://legacy.enviroweather.msu.edu/weather.php?stn=lux (accessed on 4 April 2023).
  42. Midwest Regional Climate Center. Cli-MATE Daily-Observed Station Selector. Available online: https://mrcc.purdue.edu/CLIMATE/ (accessed on 4 April 2023).
  43. National Centers for Environmental Information—National Oceanic and Atmospheric Administration. Daily U.S. Snowfall and Snow Depth. Available online: https://www.ncei.noaa.gov/access/monitoring/daily-snow/WI/snowfall (accessed on 5 April 2023).
  44. University of Wisconsin—Extension AgWeather. National Weather Service Co-Op Observer Reports Database. Available online: https://agweather.cals.wisc.edu/weather/hyd (accessed on 8 April 2023).
  45. Craig, H. Isotopic variations in meteoric waters. Science 1961, 133, 1702–1703. [Google Scholar] [CrossRef] [PubMed]
  46. Bowen, G.J.; Kennedy, C.D.; Henne, P.D.; Zhang, T. Footprint of recycled water subsidies downwind of Lake Michigan. Ecosphere 2012, 3, 53. [Google Scholar] [CrossRef] [Green Version]
  47. Kunze, T.; Luczaj, J. A Regional Groundwater Isoscape for δ2H and δ18O in the Silurian Aquifer of Northeastern Wisconsin. In Proceedings of the American Water Resources Association—Wisconsin Section Conference, Online, 4 March 2021. [Google Scholar]
  48. Clark, I.D.; Fritz, P. Environmental Isotopes in Hydrogeology; Lewis Publishers: New York, NY, USA, 1997; Volume 2097, 328p, ISBN 9781566702492. [Google Scholar]
  49. Jasechko, S.; Gibson, J.J.; Edwards, T.W.D. Stable isotope mass balance of the Laurentian Great Lakes. J. Great Lakes Res. 2014, 40, 336–346. [Google Scholar] [CrossRef]
  50. Luczaj, J.A.; Houghton, C.J.; Shea, A.W. A Depth-to-Bedrock Map and Deep Aquifer Characterization for Kewaunee County, Wisconsin. In Final Grant Report Submitted to the Wisconsin Department of Natural Resources; Wisconsin Geological and Natural History Survey: Mt Horeb, WI, USA, 2019; 35p. [Google Scholar]
  51. National Oceanic and Atmospheric Administration—National Weather Service. Cold and Snowy Winter of 2013–2014. Available online: https://www.weather.gov/grb/winter2013-14cold#:~:text=What%20made%20the%20winter%20of,days%20set%20in%201916%2D17 (accessed on 28 March 2023).
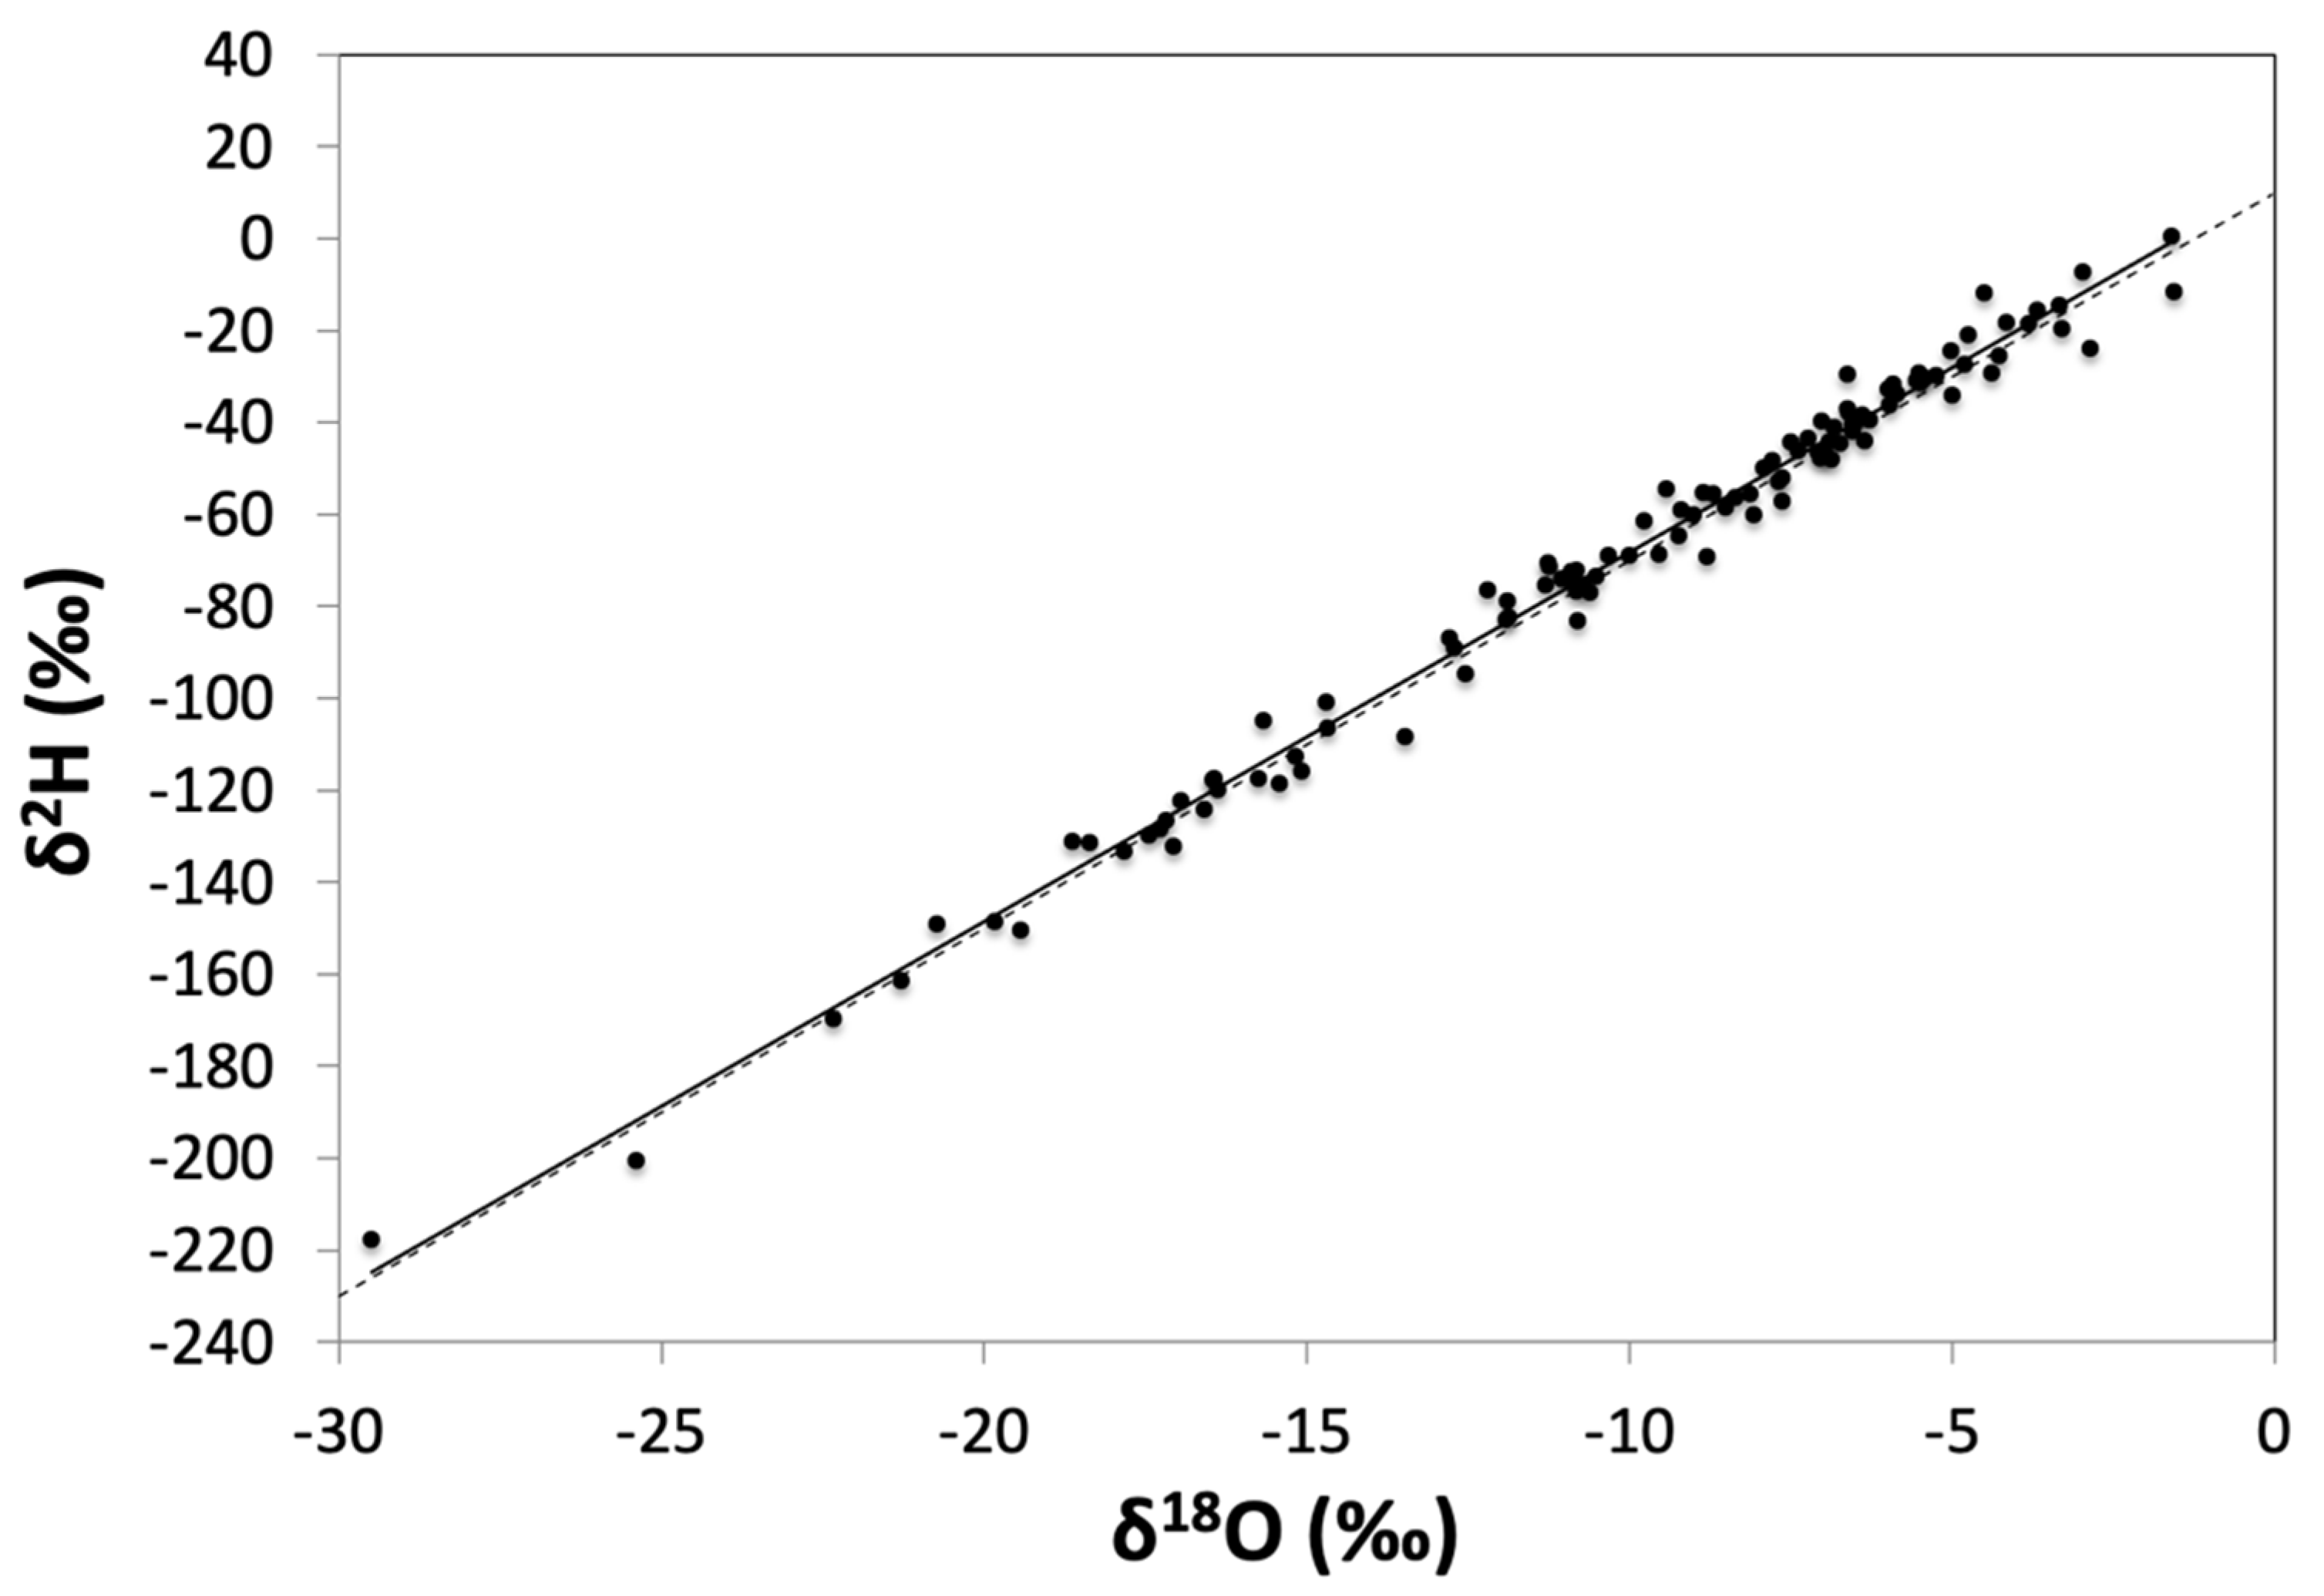
Figure 3. Local meteoric water line (LMWL) for GRBJL–1 in Green Bay, Wisconsin, USA, calculated from 14 months of precipitation samples (rain and snow). LMWL is shown as a solid black line, and the GMWL from Craig [45] is shown as a dashed line. See Table 3 for additional detail.
Hydrology 10 00133 g003
Figure 4. Precipitation samples for GRBJL–1 (Brown County) showing best-fit sine curves for δ2H (circles, left) and δ18O (triangles, right) calculated iteratively until the coefficients of determination were smallest. Seasonal ranges for δ2H and δ18O are estimated to be 69.3‰ and 9.1‰, respectively. Individual event signals (i.e., snow melt) might have a larger range than shown here.
Hydrology 10 00133 g004
Figure 5. Cross-plot showing the stable isotopic composition of groundwater produced by 4 wells in Kewaunee County, Wisconsin during the 2015–2016 sampling campaign. Corresponding linear regression lines and their equations are shown for each well. The solid black line represents the LMWL for Green Bay, Wisconsin (from Figure 3). The dashed line represents the GMWL [45].
Hydrology 10 00133 g005
Figure 6. Plots of time-series data for δ2H (circles) and δ18O (triangles) for groundwater produced from domestic wells A and B, with rainfall and daily maximum temperature for reference (snowfall data are not shown). Colors for each well correspond to those in Figure 5. Gray lines represent filtered modeled time-series data.
Hydrology 10 00133 g006
Figure 7. Plots of time-series data for δ2H (circles) and δ18O (triangles) for groundwater produced from domestic wells C and D, with rainfall and daily maximum temperature for reference (snowfall data are not shown). Colors for each well correspond to those in Figure 5. Gray lines represent filtered modeled time-series data.
Hydrology 10 00133 g007
Figure 8. Events #1–3. Plots of time-series data for δ18O (left) and δ2H (right) for groundwater produced from four domestic wells, with rainfall for reference (snowfall data are not shown). The period of major snow melt is shown for reference as pink bands. Colors for each well correspond to those in Figure 5. Points represent measured samples, while lines were generated using the smoothed lines option in Excel.
Hydrology 10 00133 g008
Figure 9. Events #3–6. Plots of time-series data for δ18O (left) and δ2H (right) for groundwater produced from four domestic wells, with rainfall for reference. Colors for each well correspond to those in Figure 5. Points represent measured samples, while lines were generated using the smoothed lines option in Excel.
Hydrology 10 00133 g009
Figure 10. Events #6–8. Plots of time-series data for δ18O (left) and δ2H (right) for groundwater produced from four domestic wells, with rainfall for reference. Colors for each well correspond to those in Figure 5. Points represent measured samples, while lines were generated using the smoothed lines option in Excel.
Hydrology 10 00133 g010
Figure 11. Events #9–10. Plots of time-series data for δ18O (left) and δ2H (right) for groundwater produced from four domestic wells, with rainfall for reference (snowfall data are not shown). Periods of major snow melt and frost thaw are shown for reference as pink bands. Colors for each well correspond to those in Figure 5. Points represent measured samples, while lines were generated using the smoothed lines option in Excel.
Hydrology 10 00133 g011
Table 1. Well construction parameters for the domestic wells in the study. Depths are in meters.
Well Land Surface
Elevation (m)
Total
Well Depth
Casing
Depth
Depth to Bedrock
from Well Records
Depth to Water
(Day of Drilling)
A23822.51.53.0 *1.22
B23943.213.112.818.3
C22973.218.32.427.4
D219110.924.124.116.8
* Bedrock is <1 m from surface or exposed within 200 m of well.
Table 2. Major ion chemistry for the domestic wells in the study is a Ca-Mg-HCO3-type water, with variable amounts of chloride and nitrate. Conductivity (Cond.) is in µS/cm and was collected with pH on 11 February 2016. Ion concentrations are in mg/L. Alkalinity (Alk.) is in mg/L. Wells A, B, and C were sampled for chemistry on 3 July 2015, and Well D on 8 July 2015.
WellpHCond.CaMgNaKSrClSO4FNO3-NAlk.
A7.4981586.341.522.01.390.046232.112.2<0.204.9358
B--115.055.712.23.540.080359.630.5<0.2023.1357
C7.5773987.043.35.552.210.058817.328.7<0.2014.0288
D--54.247.48.081.990.43808.225.40.23 *<0.15310
* Value was above the limit of detection, but below the lab’s limit of quantitation adjusted for dilution factor and percent moisture. Field notes for pH and conductivity on B and D were lost.
Table 3. Linear regression results for precipitation samples, Green Bay, Wisconsin (2015–2016) and other historical data. Slope (m), y-intercept (b), coefficient of determination (R2), and the sample size (n) are shown for each dataset.
DatasetmbR2n
All samples in Table S18.02912.050.9877111
Subsets of Data
Water Year A (12 months)
(1 March 2015–28 February 2016)
7.97611.450.986496
Water Year B (12 months)
(1 April 2015–31 March 2016)
8.03312.170.9872102
Historical Data
Madison, Wisconsin (1998–1999) 17.7913.10.98610
Global MWL 2810 400
1 Swanson et al., (2006) [40]; 2 Craig (1961) [45].
Table 4. Estimates of the contribution of event-driven infiltration to the proportion of produced groundwater for selected recharge events. Estimates were made using linear interpolation between the groundwater isotopic composition preceding the event and the maximum magnitude of the response.
WellEvent
Type *
Percent
Recharge (δ18O)
Percent
Recharge (δ2H)
Percent
Recharge (Average)
Well A
Event #1Snow melt11.6%15.1%13.3%
Event #2Rain10.9%3.3%7.1%
Event #3Rain4.7%2.8%3.8%
Event #4Rain2.1%4.8%3.4%
Event #5Rain6.5%4.0%5.2%
Event #6Rain8.1%6.1%7.1%
Event #7Rain 12.4%2.2%2.3%
Event #8Rainxxx
Event #9Snow melt 1,2Response 2Response 2Response 2
Event #10Frost thaw, Snow6.0%4.9%5.5%
Well B
Event #1Snow melt3.0%0%<2%
Event #2Rain9.6%1.7%5.7%
Event #3Rainns0.7%<1%
Event #4Rain1.5%2.5%2.0%
Event #5Rainnsnsns
Event #6Rain0.4%4.0%2.2%
Event #7Rain 13.6%1.7%2.6%
Event #8Rain3.6%1.5%2.5%
Event #9Snow melt 1,2Response 2Response 2Response 2
Event #10Frost thaw, Snow1.4%0.7%1.1%
Well C
Event #1Snow melt2.5%1.5%2.0%
Event #2Rain1.6%0%ns
Event #3Rain3.7%0.5%2.1%
Event #4Rainnsnsns 1
Event #5Rain2.2%2.1%2.1%
Event #6Rain2.0%1.3%1.6%
Event #7Rain 11.8%0.7%1.2%
Event #8Rain6.0%1.6%3.8%
Event #9Snow melt 1,2Response 2Response 2Response 2
Event #10Frost thaw, Snow nsnsns
Well D
Event #1Snow melt0.8%0.6%0.7%
Event #2Rainnsnsns 1
Event #3Rain1.2%ns<0.6%
Event #4Rain4.0%3.2%3.6%
Event #5Rain2.9%0.1%1.5%
Event #6Rain1.0%ns 1<0.5%
Event #7Rain 1Response 2Response 2Response 2
Event #8Rain7.3%2.0%4.7%
Event #9Snow melt 1,2Response 2Response 2Response 2
Event #10Frost thaw, Snow2.0%0.7%1.3%
* Event dates are as follows: E1. 8–11 March 2015, E2. 9–10 April 2015, E3. 24–25 May 2015, E4. 13 July 2015, E5. 2–7 August 2015, E6. 7–8 September 2015, E7. 28 October 2015, E8. 13–14 December 2015, E9. 18–21 February 2016, E10. 4–8 March 2016. Later events are not discretely analyzed because of the rapid frequency of events and response oscillations. x = not sampled during period after event or at a sufficient frequency. ns = no obvious signal for event. 1 Some complex interactions occurred with shorter periods between events or when input signal of recharge varied (enriched or depleted) during multiple subsequent events. 2 An event response occurred but was in a direction opposite to the expected offset. Event #9 during 18–21 February 2016 was a snow melt event, but the ground was still frozen. Despite the unanticipated offset, this was one of the clearest signals and was detected in all 4 wells.
Disclaimer/Publisher’s Note: The statements, opinions and data contained in all publications are solely those of the individual author(s) and contributor(s) and not of MDPI and/or the editor(s). MDPI and/or the editor(s) disclaim responsibility for any injury to people or property resulting from any ideas, methods, instructions or products referred to in the content.