
Boron Isotopes in Fresh Surface Waters in a Temperate Coastal Setting

 , , and
Abstract
:1. Introduction
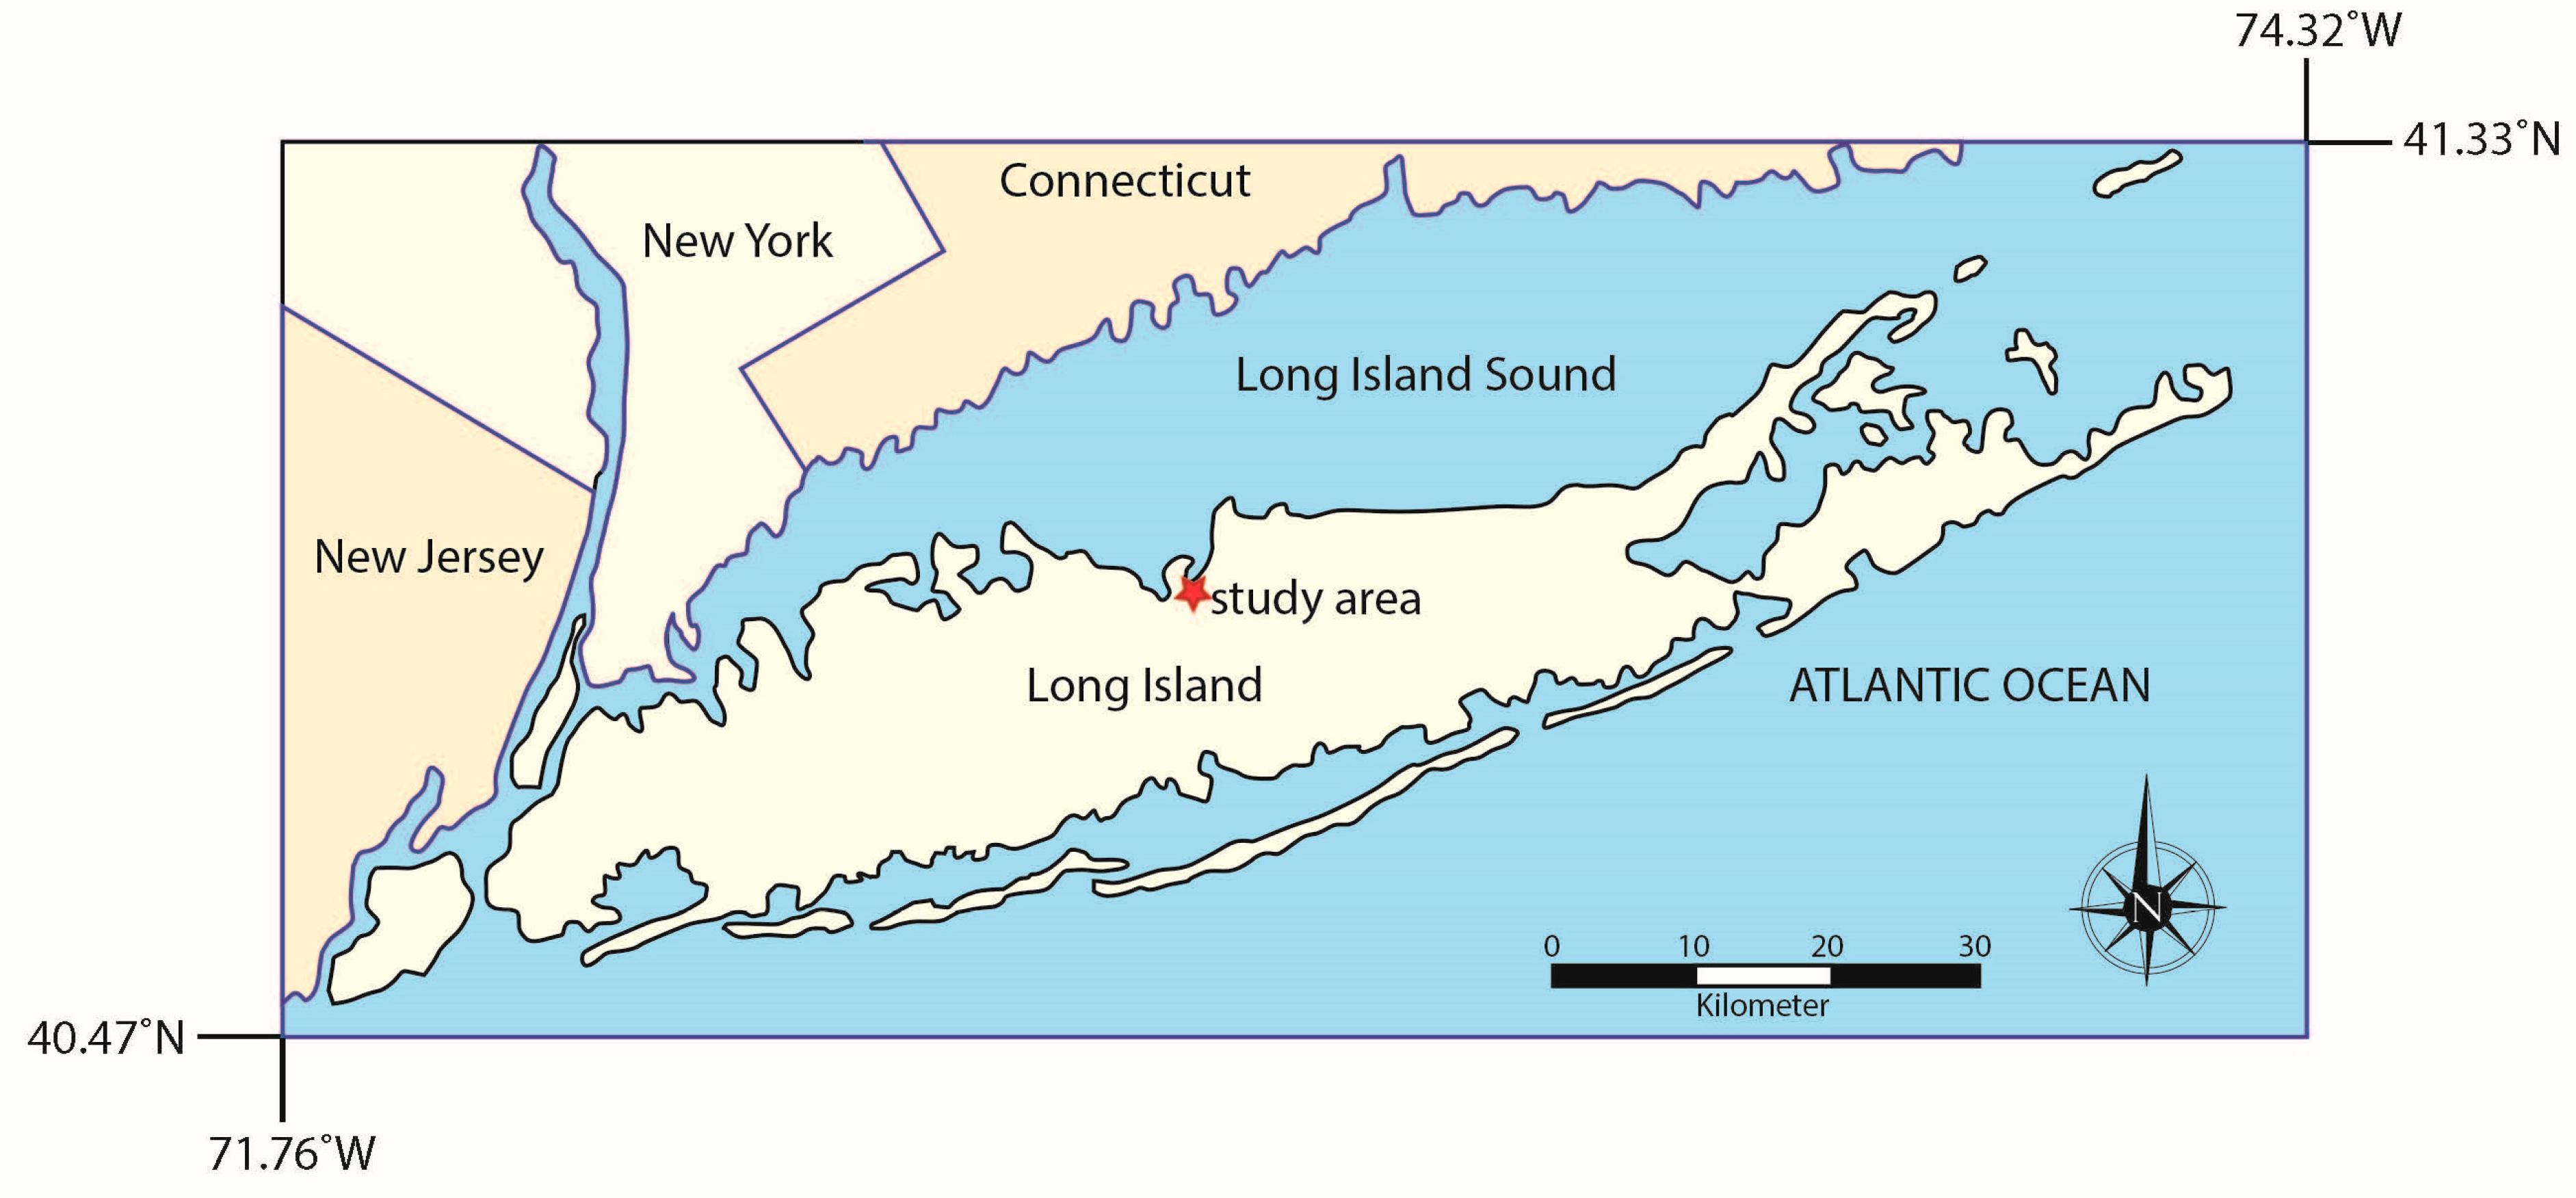
2. Study Area
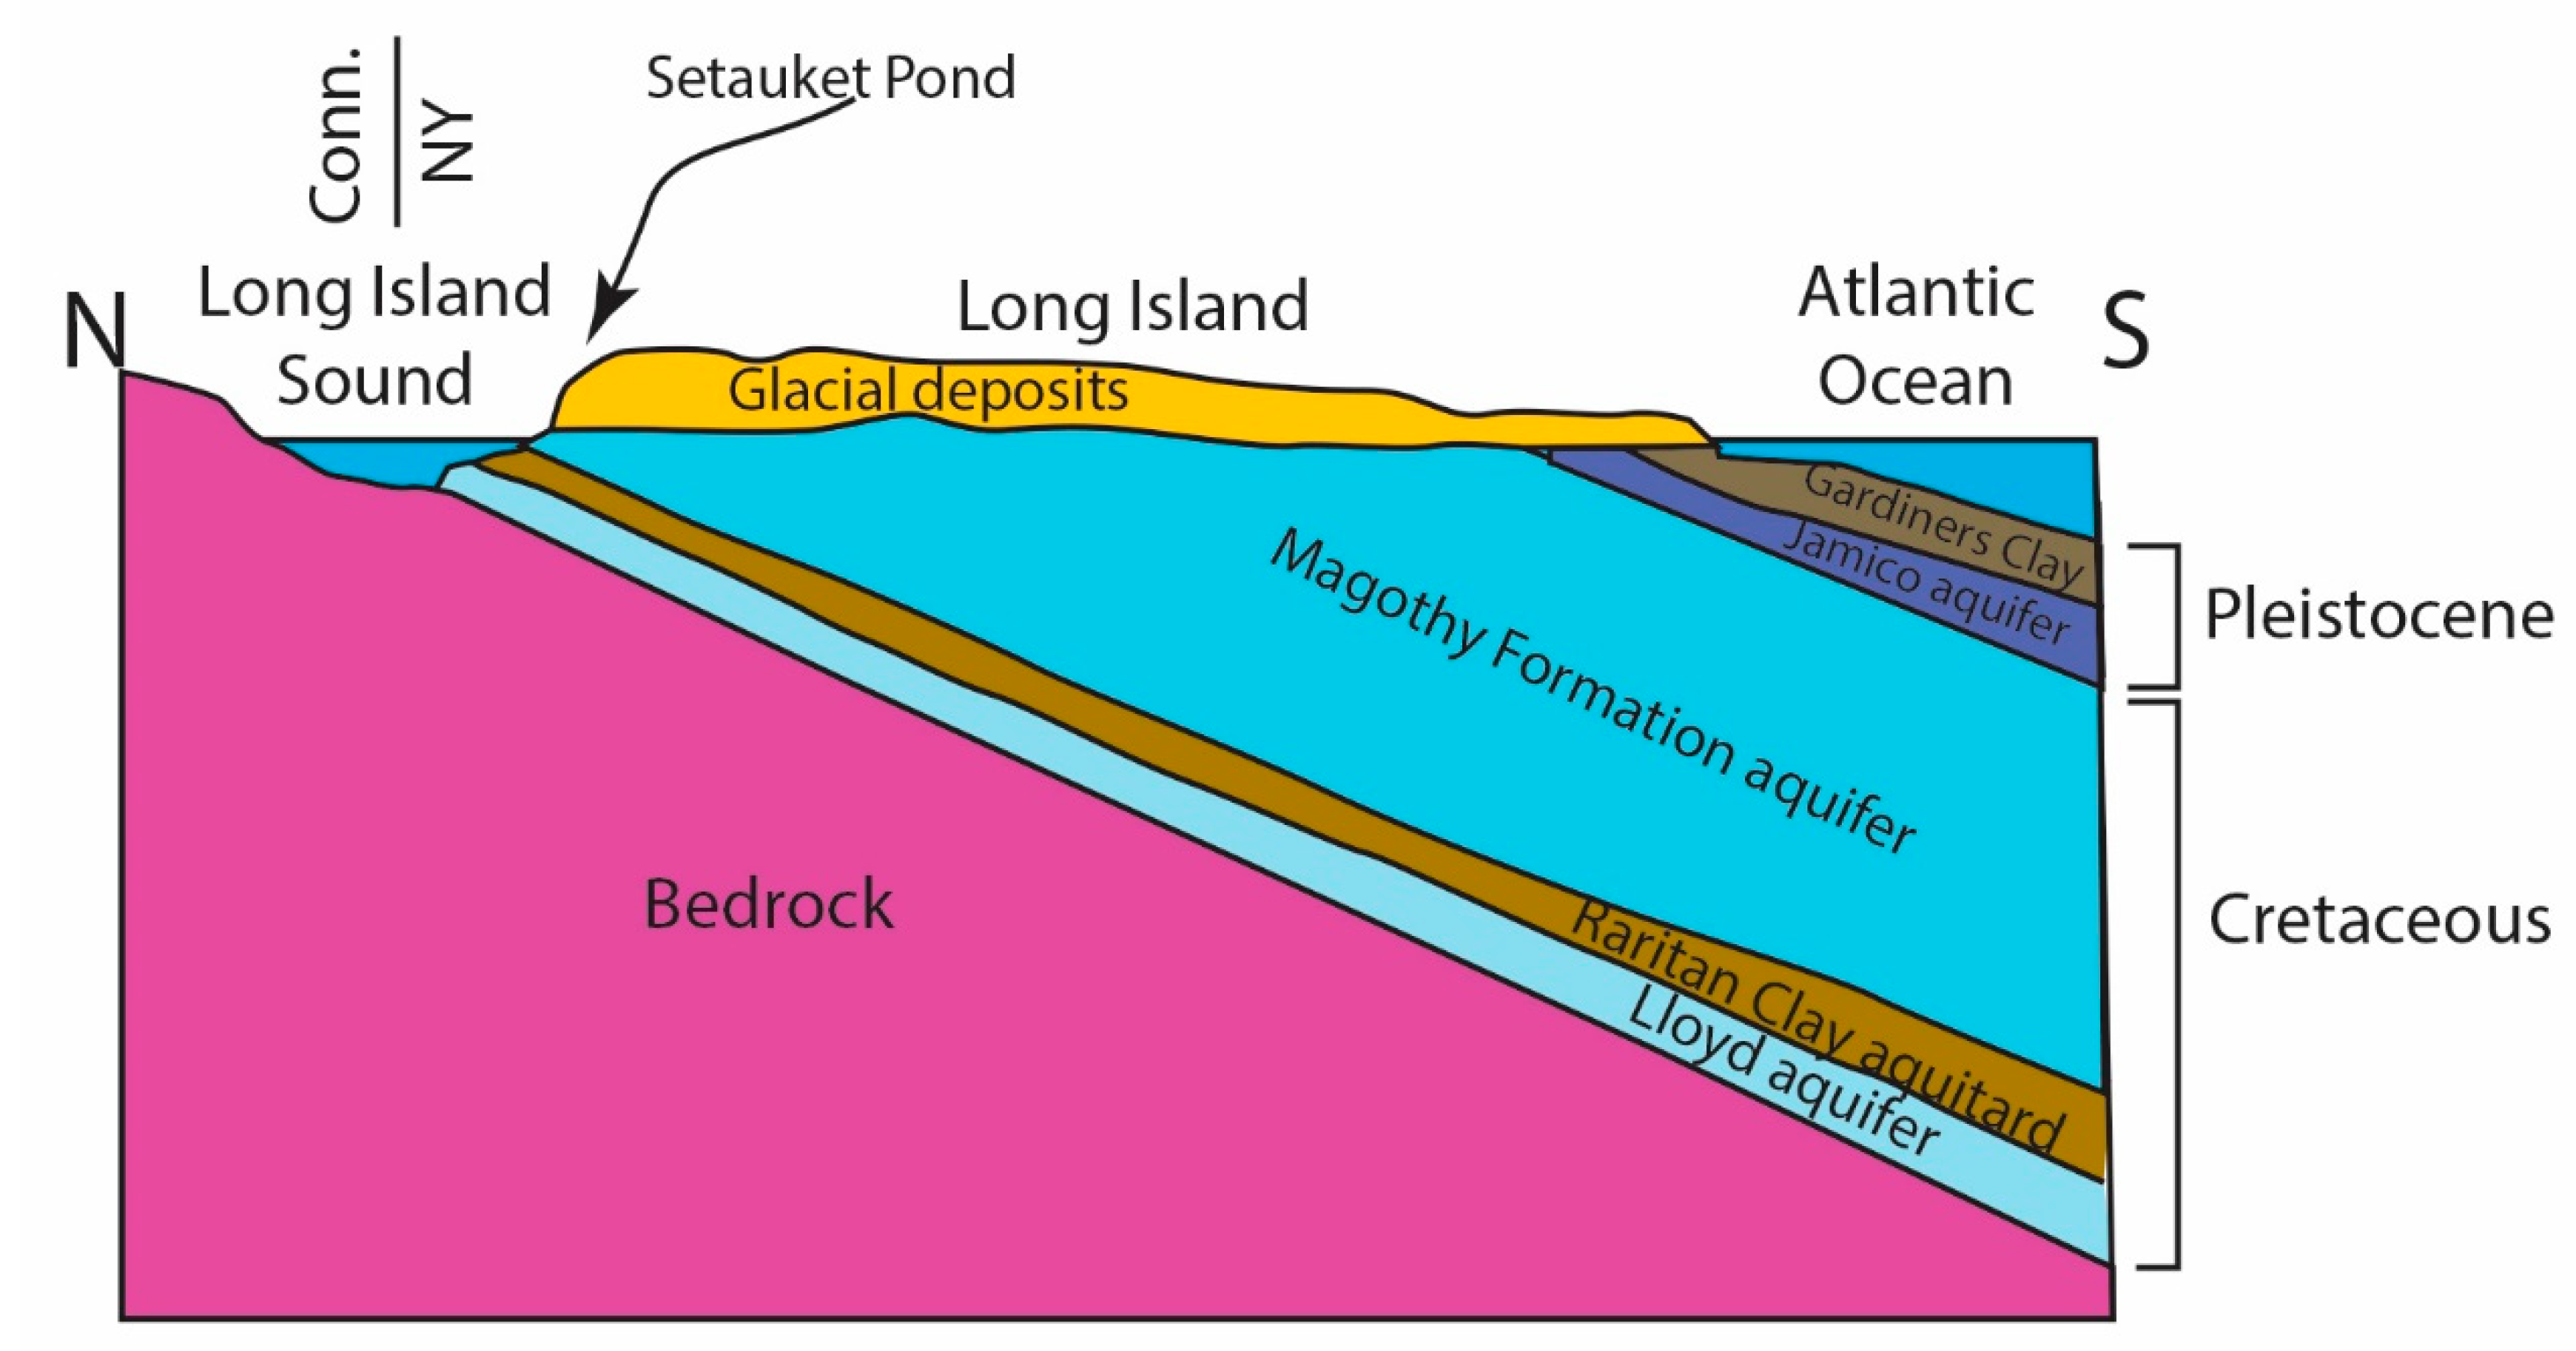
2.1. Background
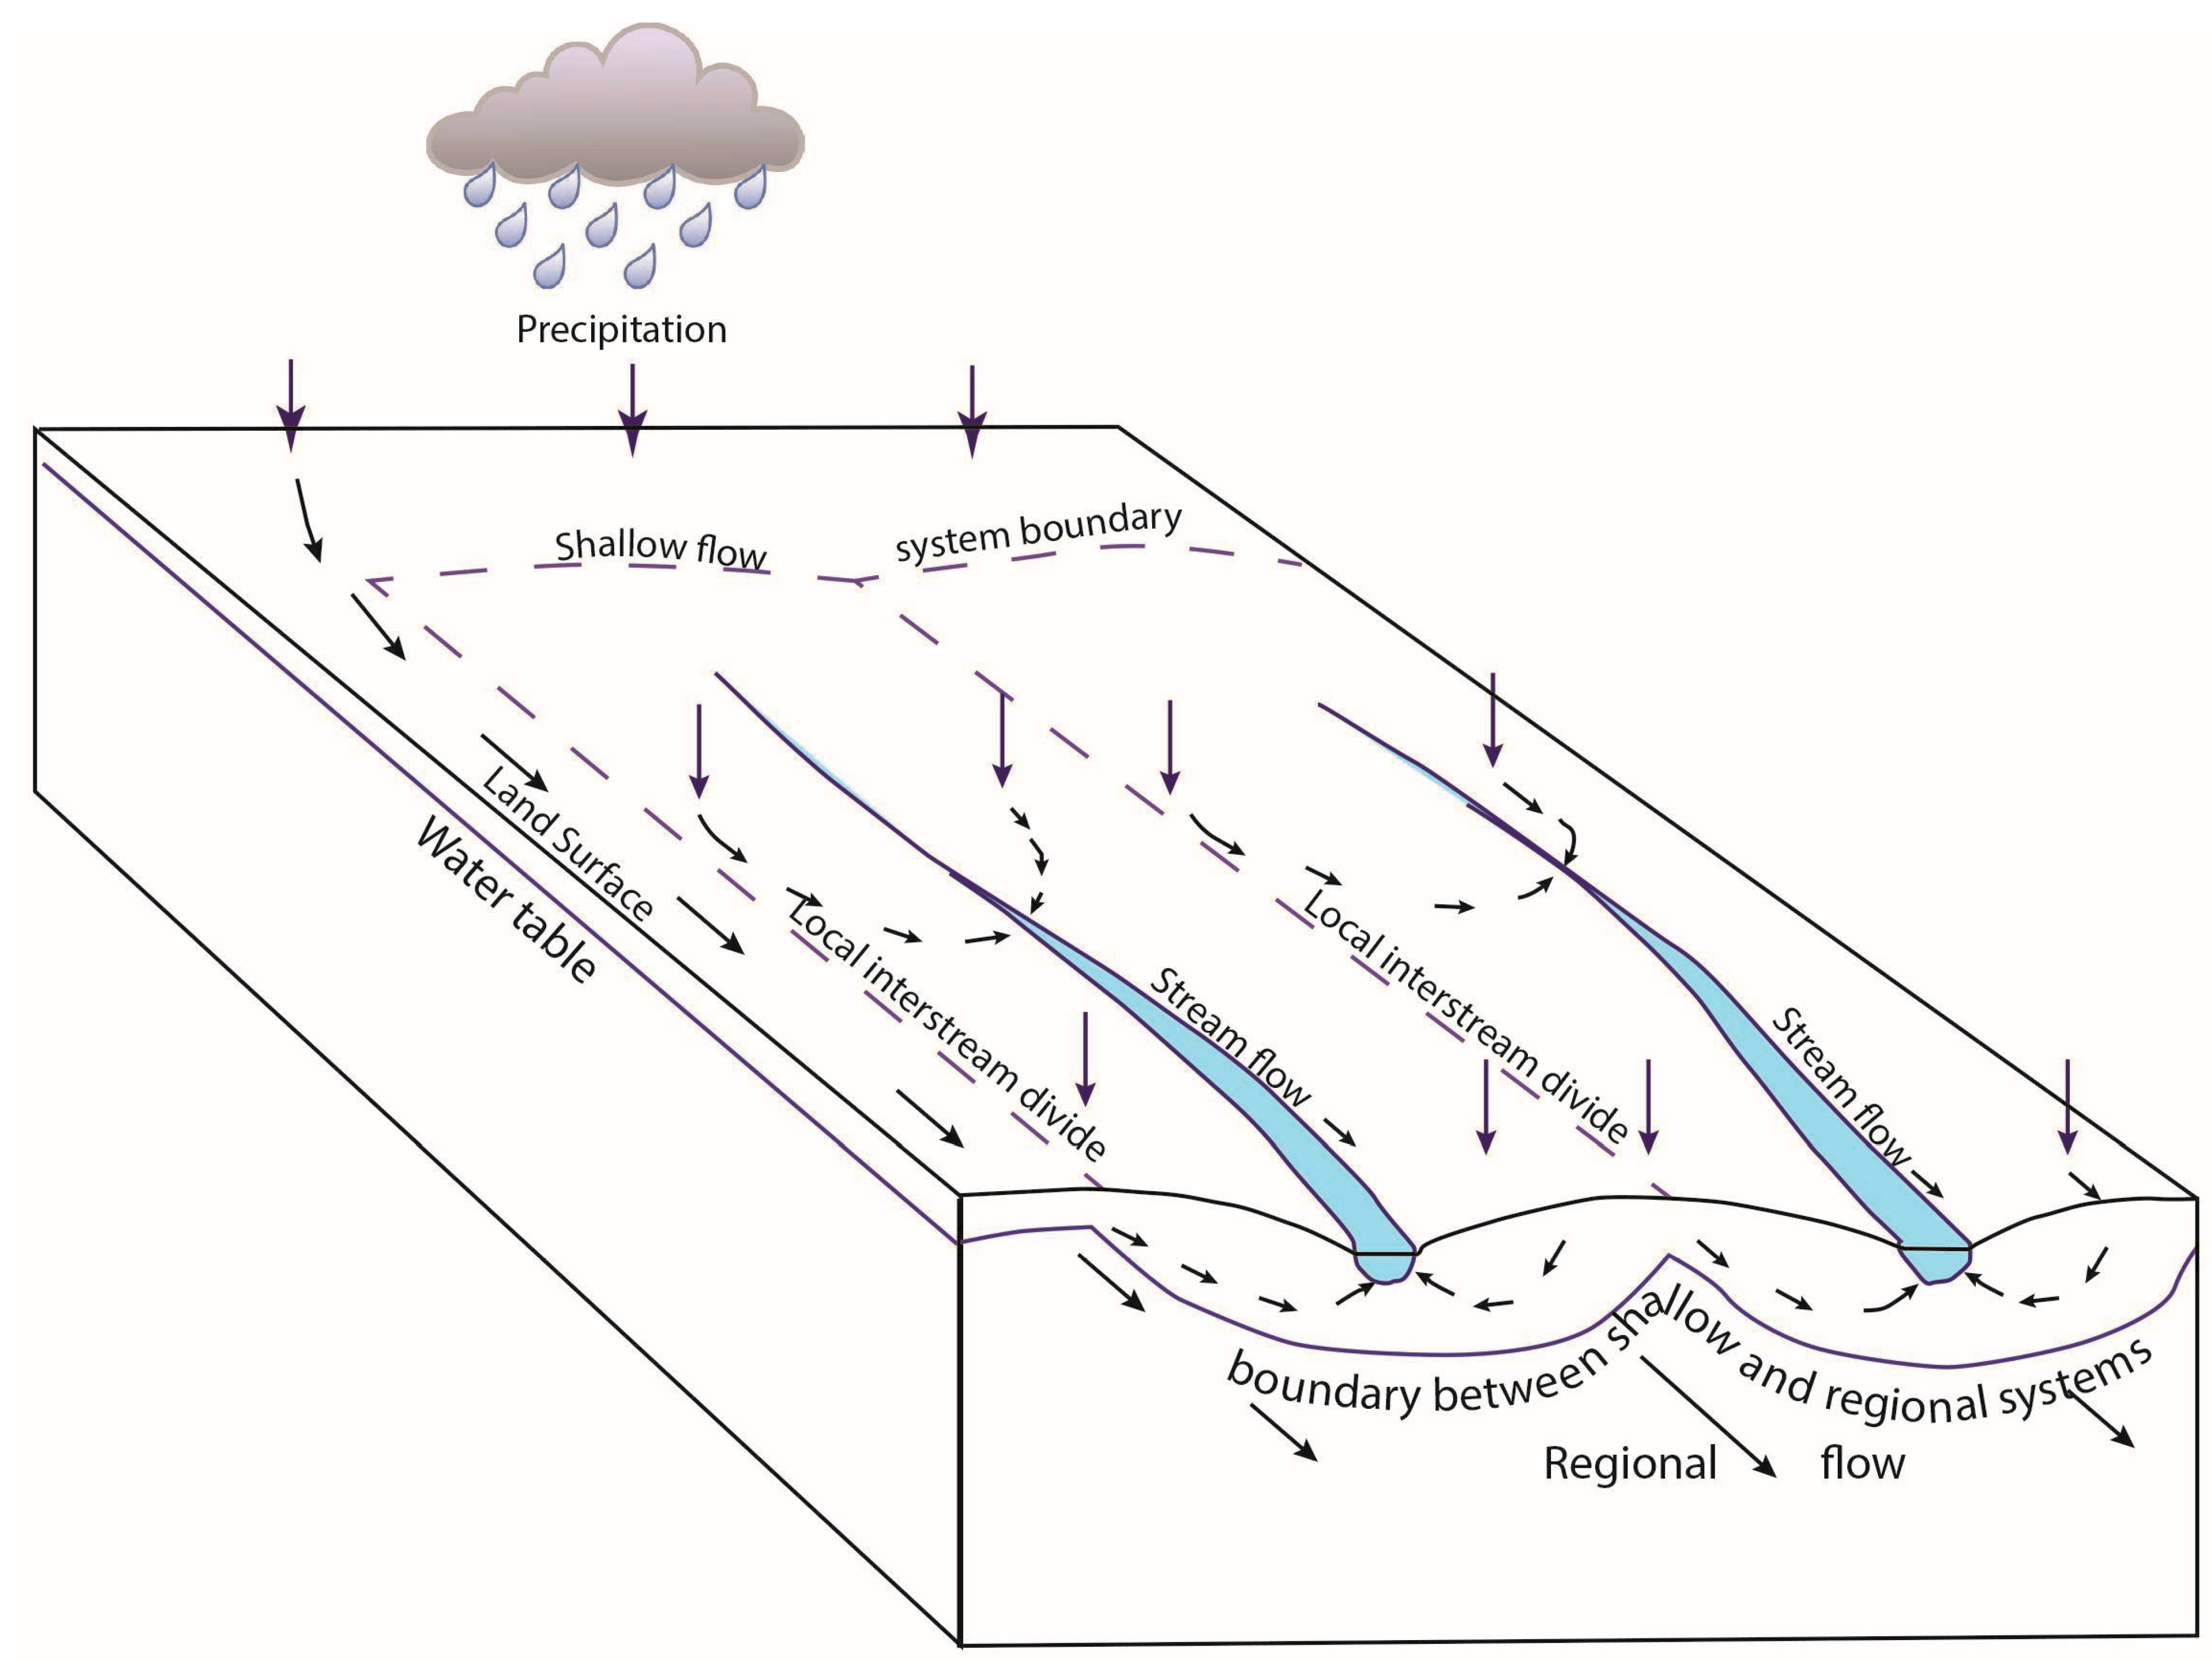
2.2. Upper Glacial Aquifer
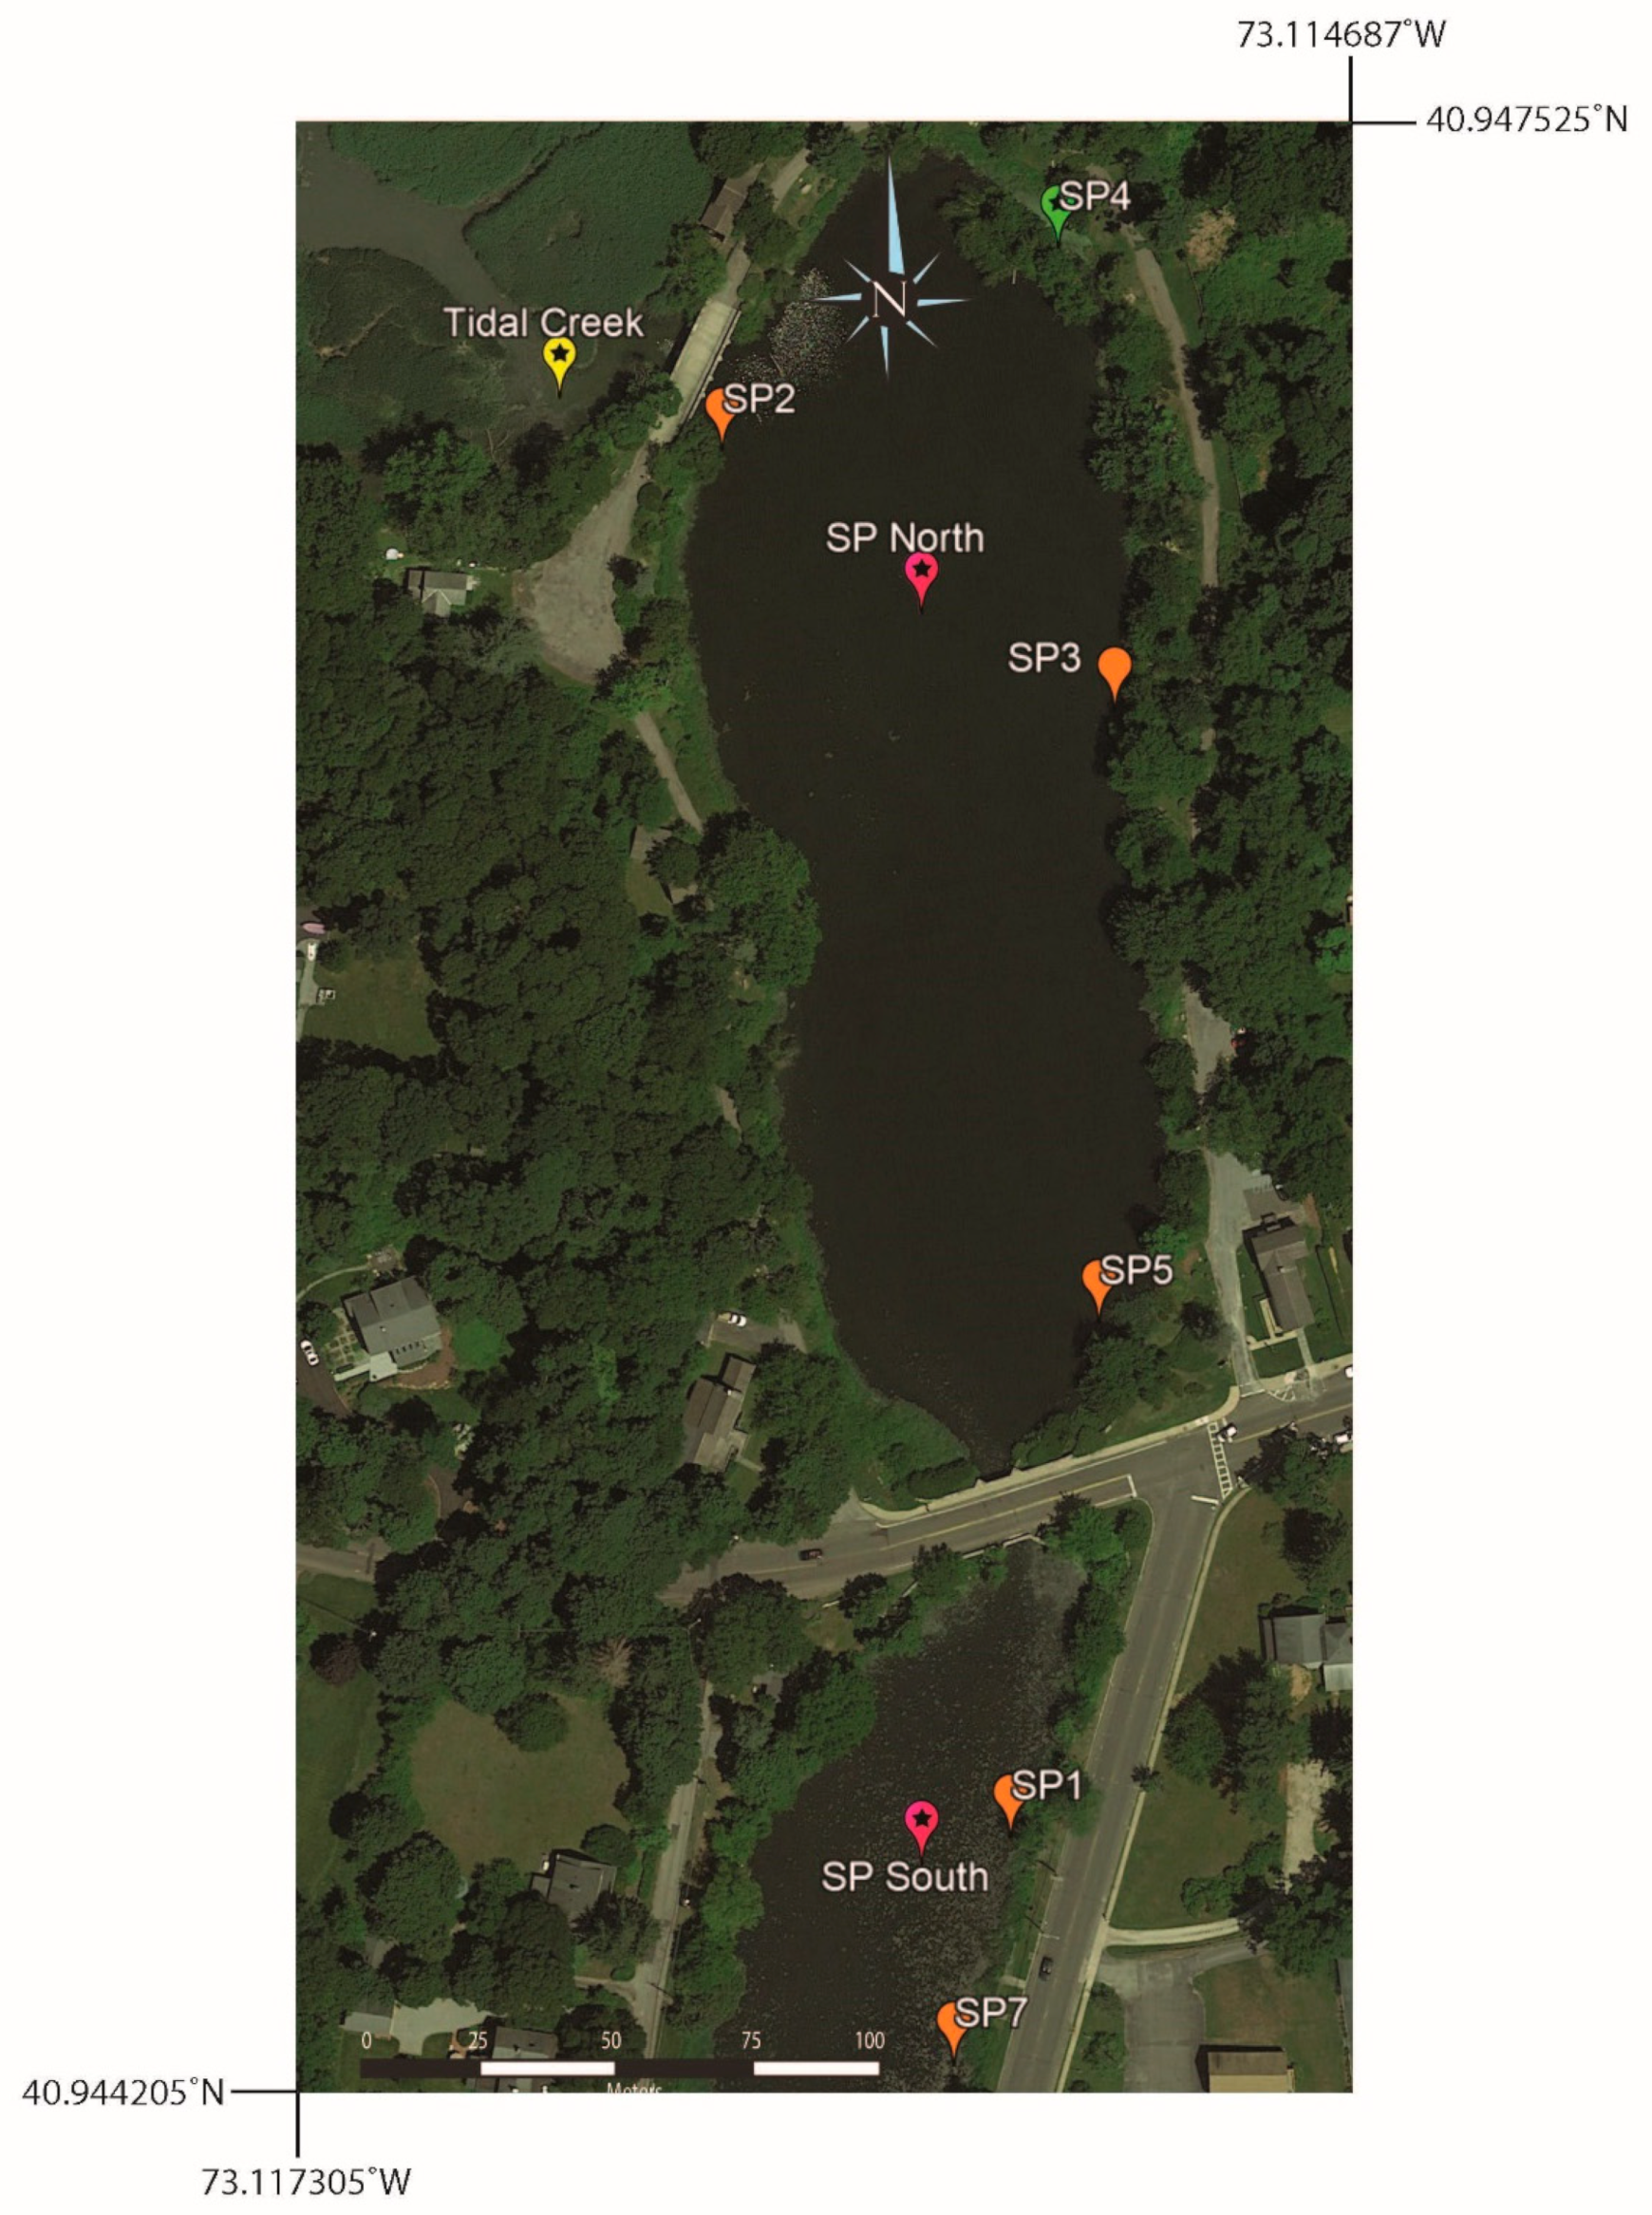
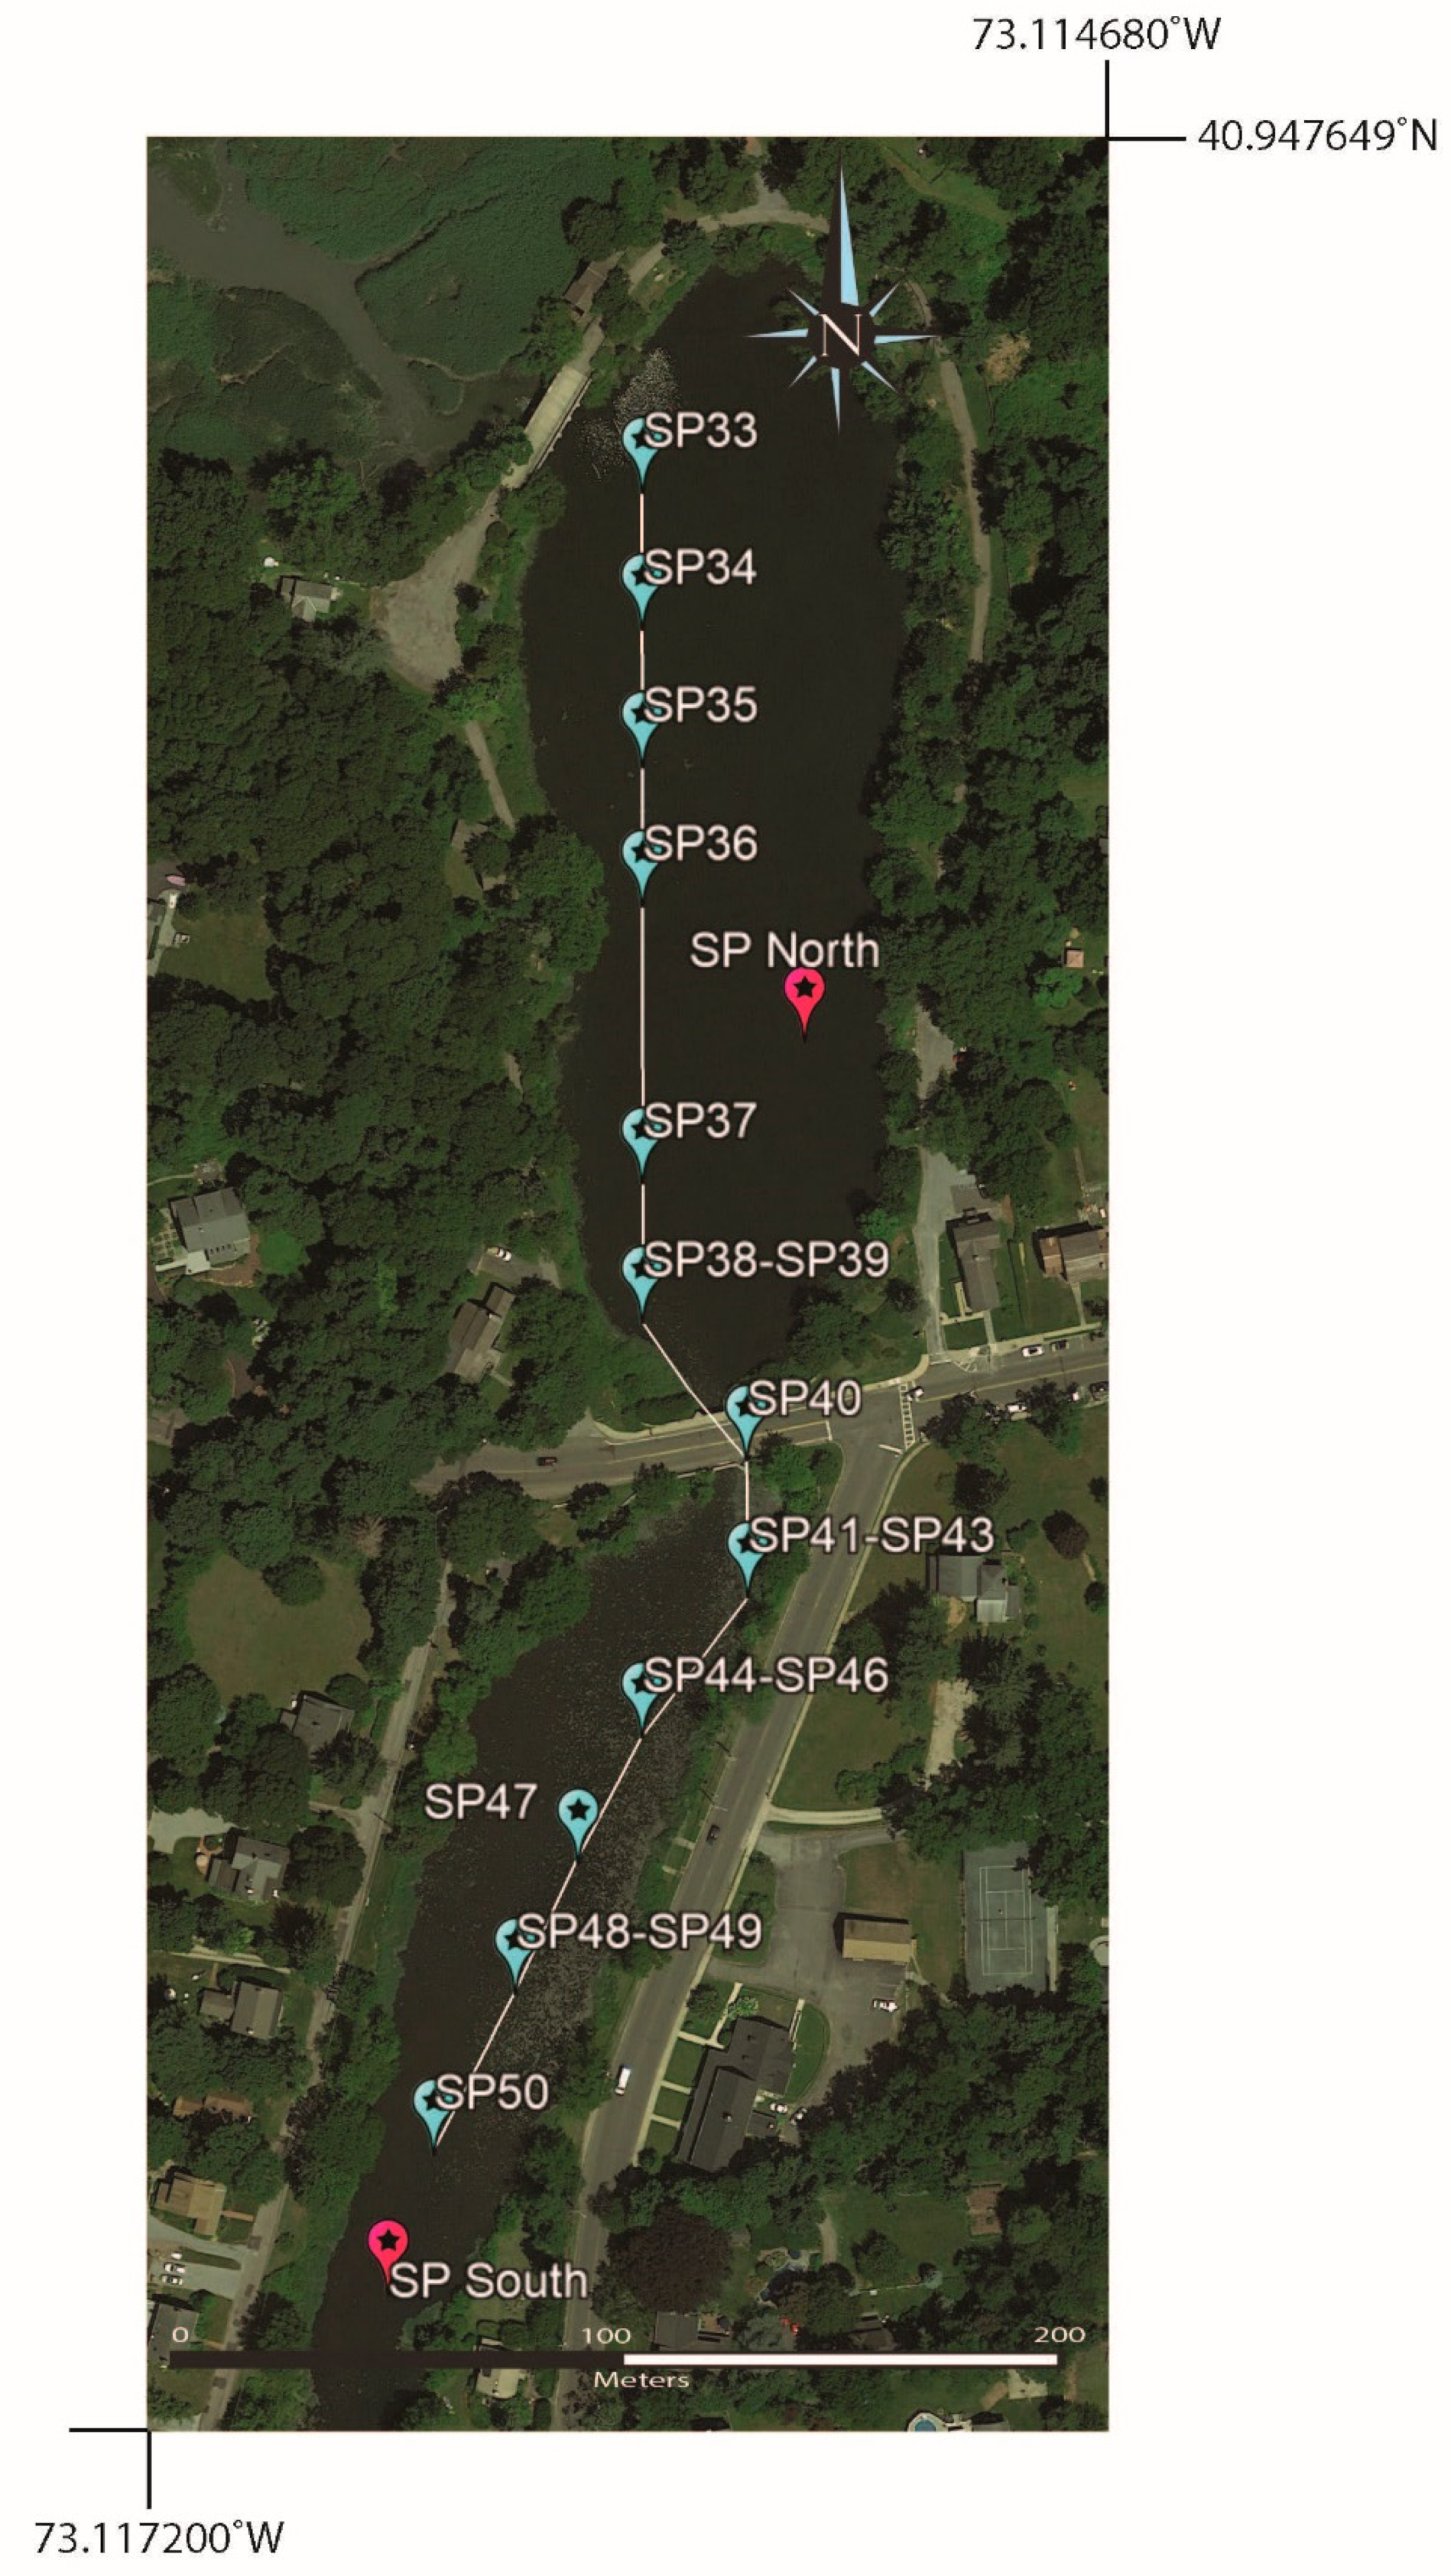
Setauket Pond Natural Laboratory
3. Methods
3.1. Sampling
3.2. Analysis
4. Results
4.1. Precipitation
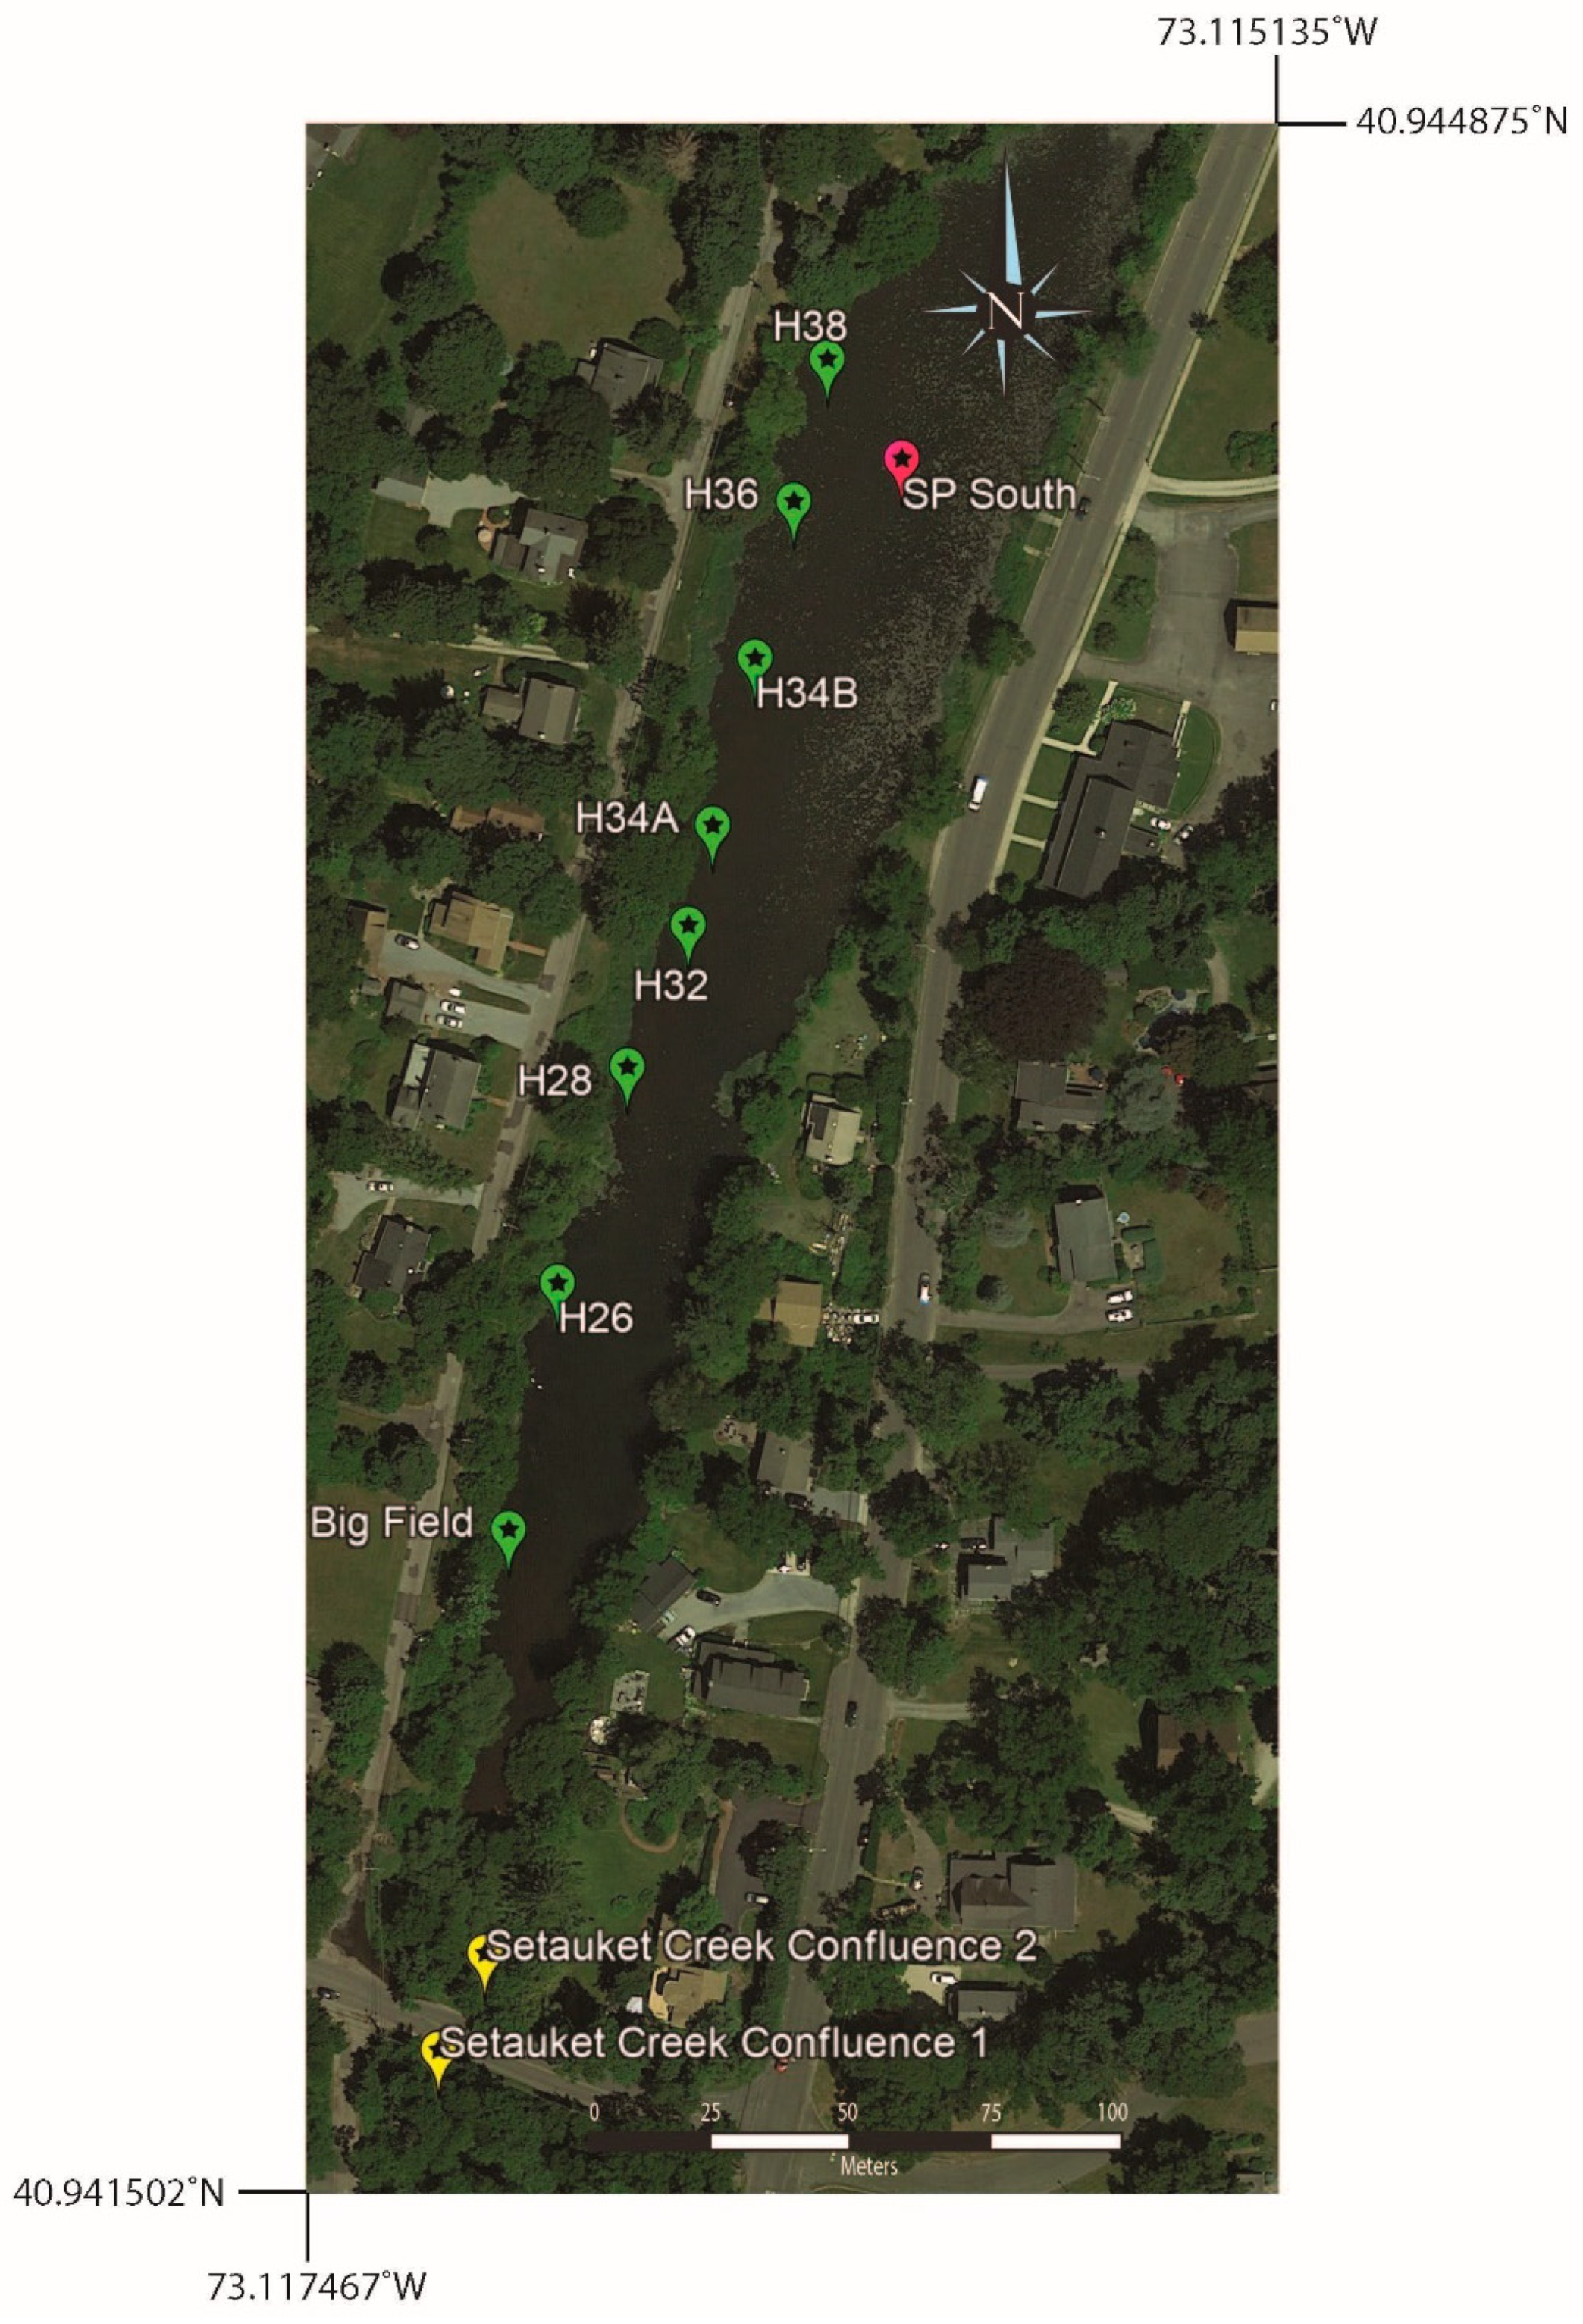
4.2. Setauket Pond and Peripheral Water Samples
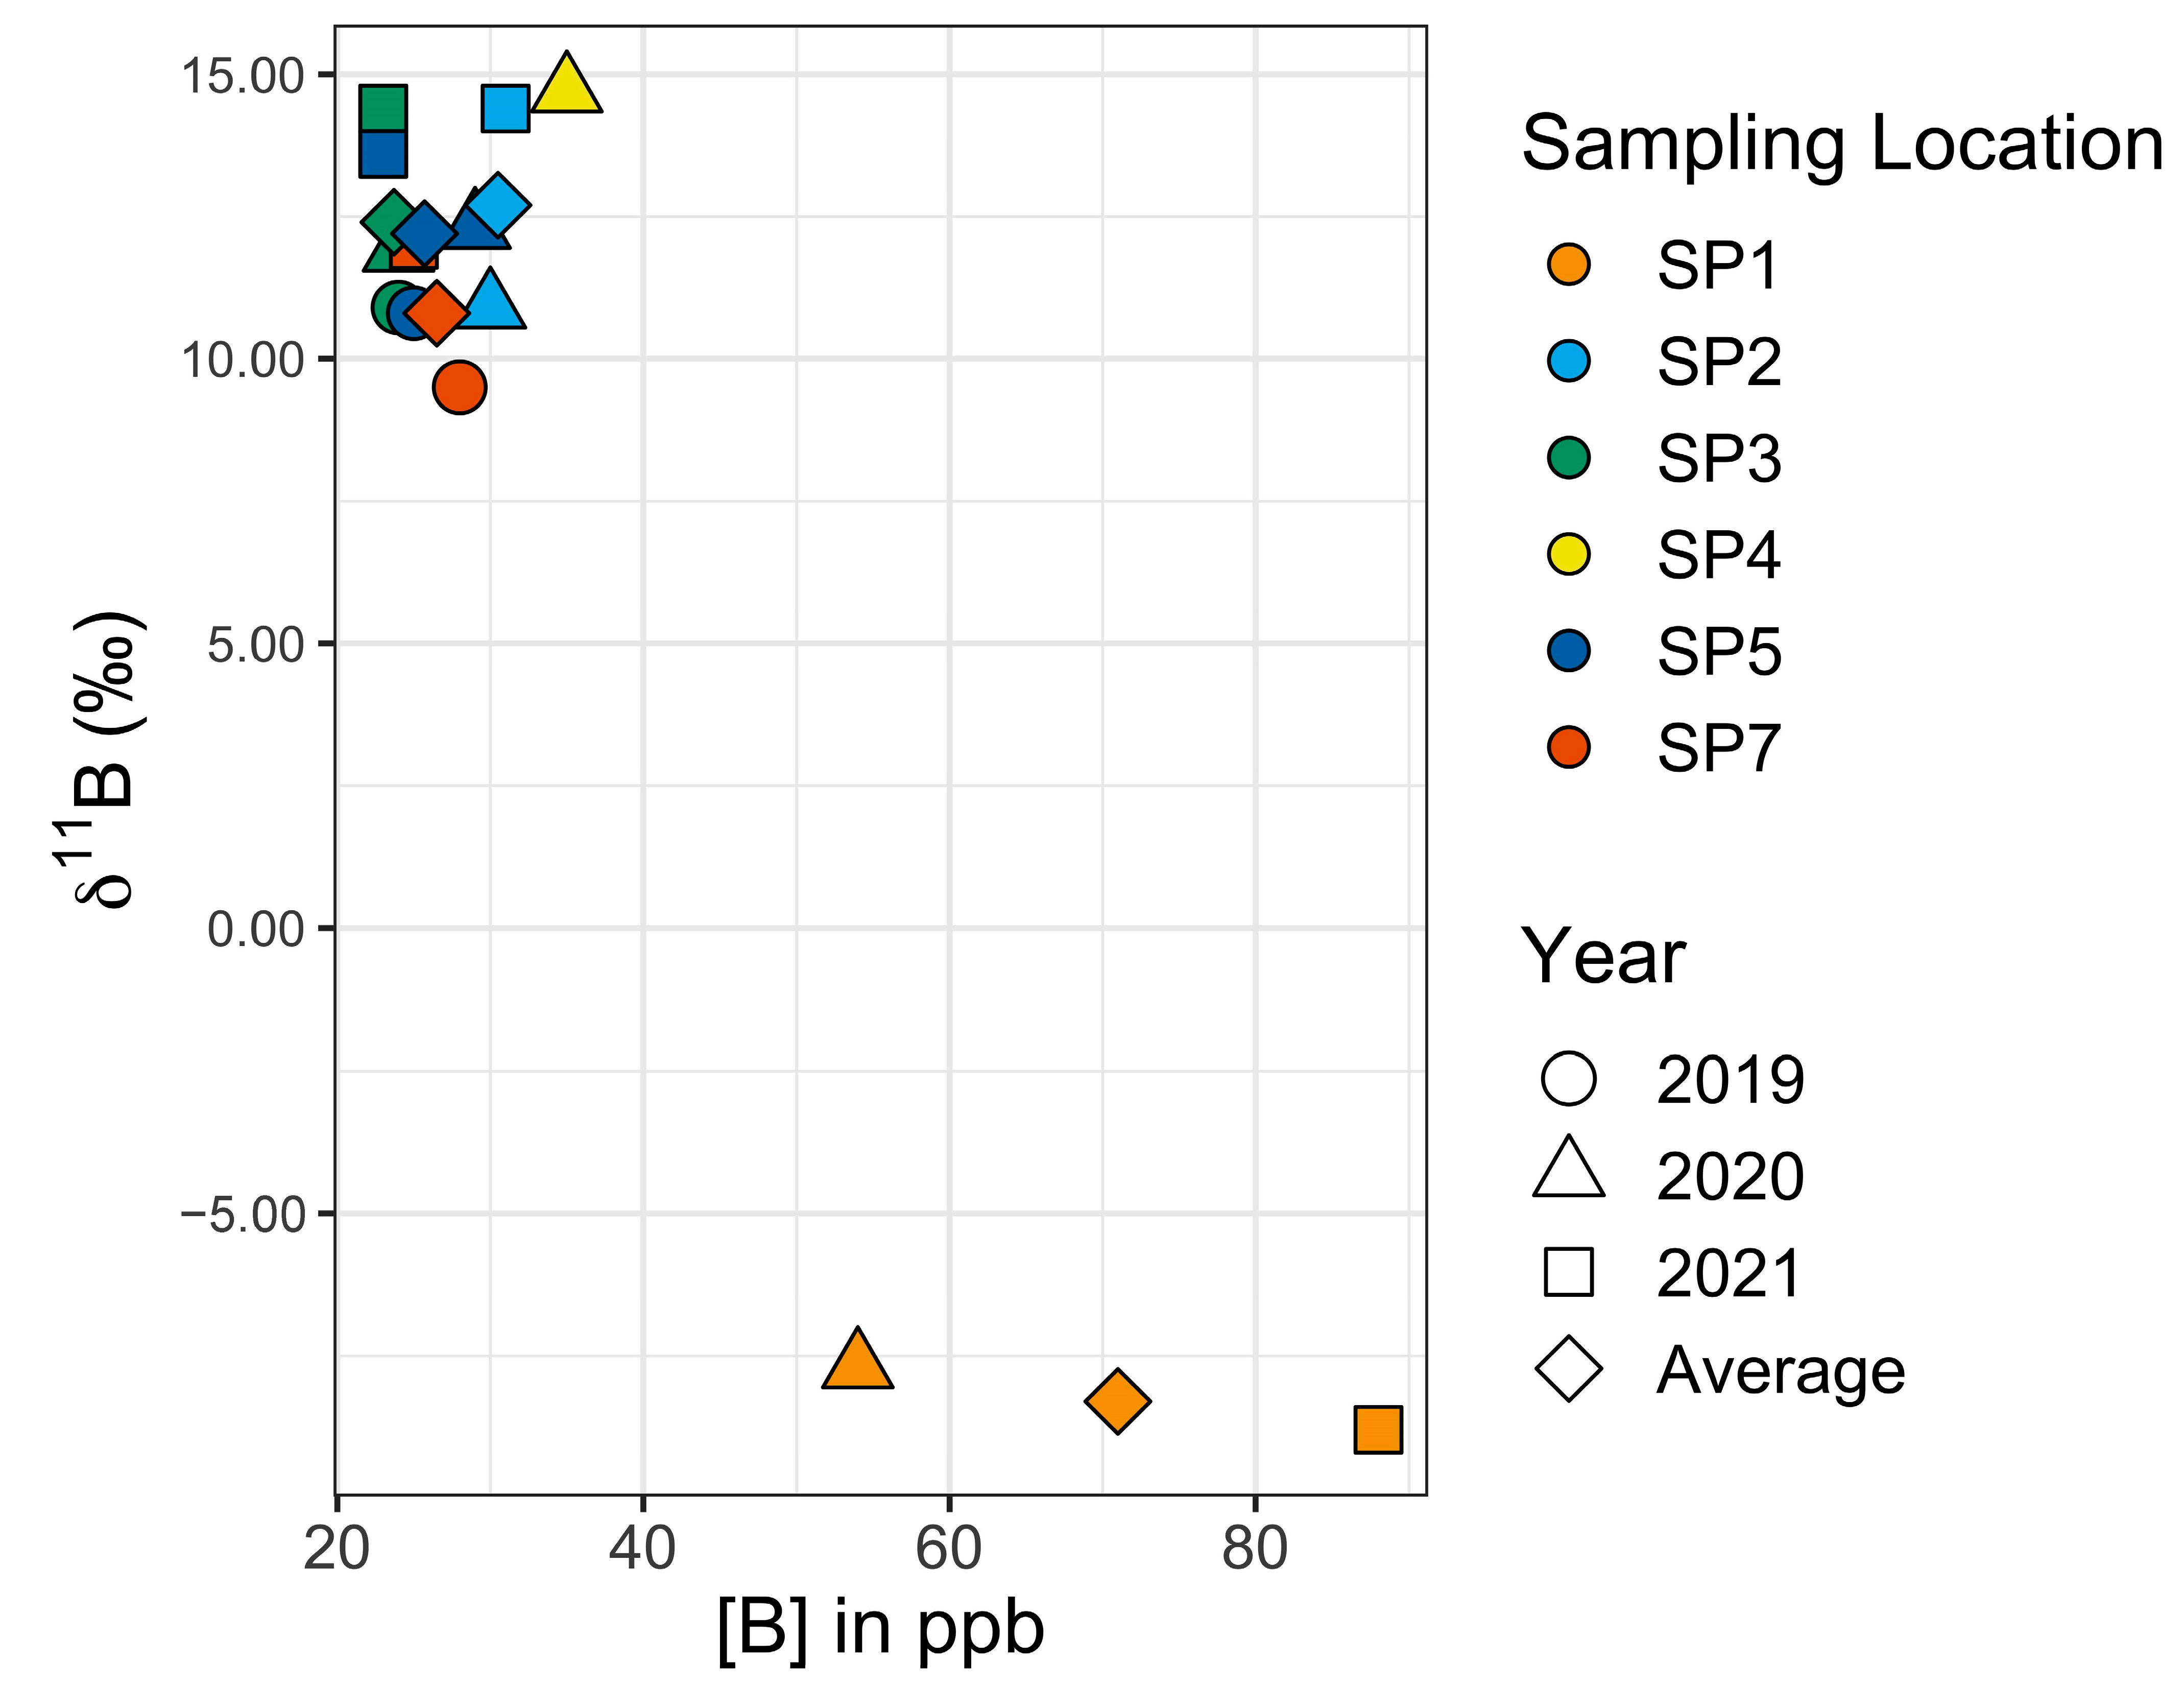
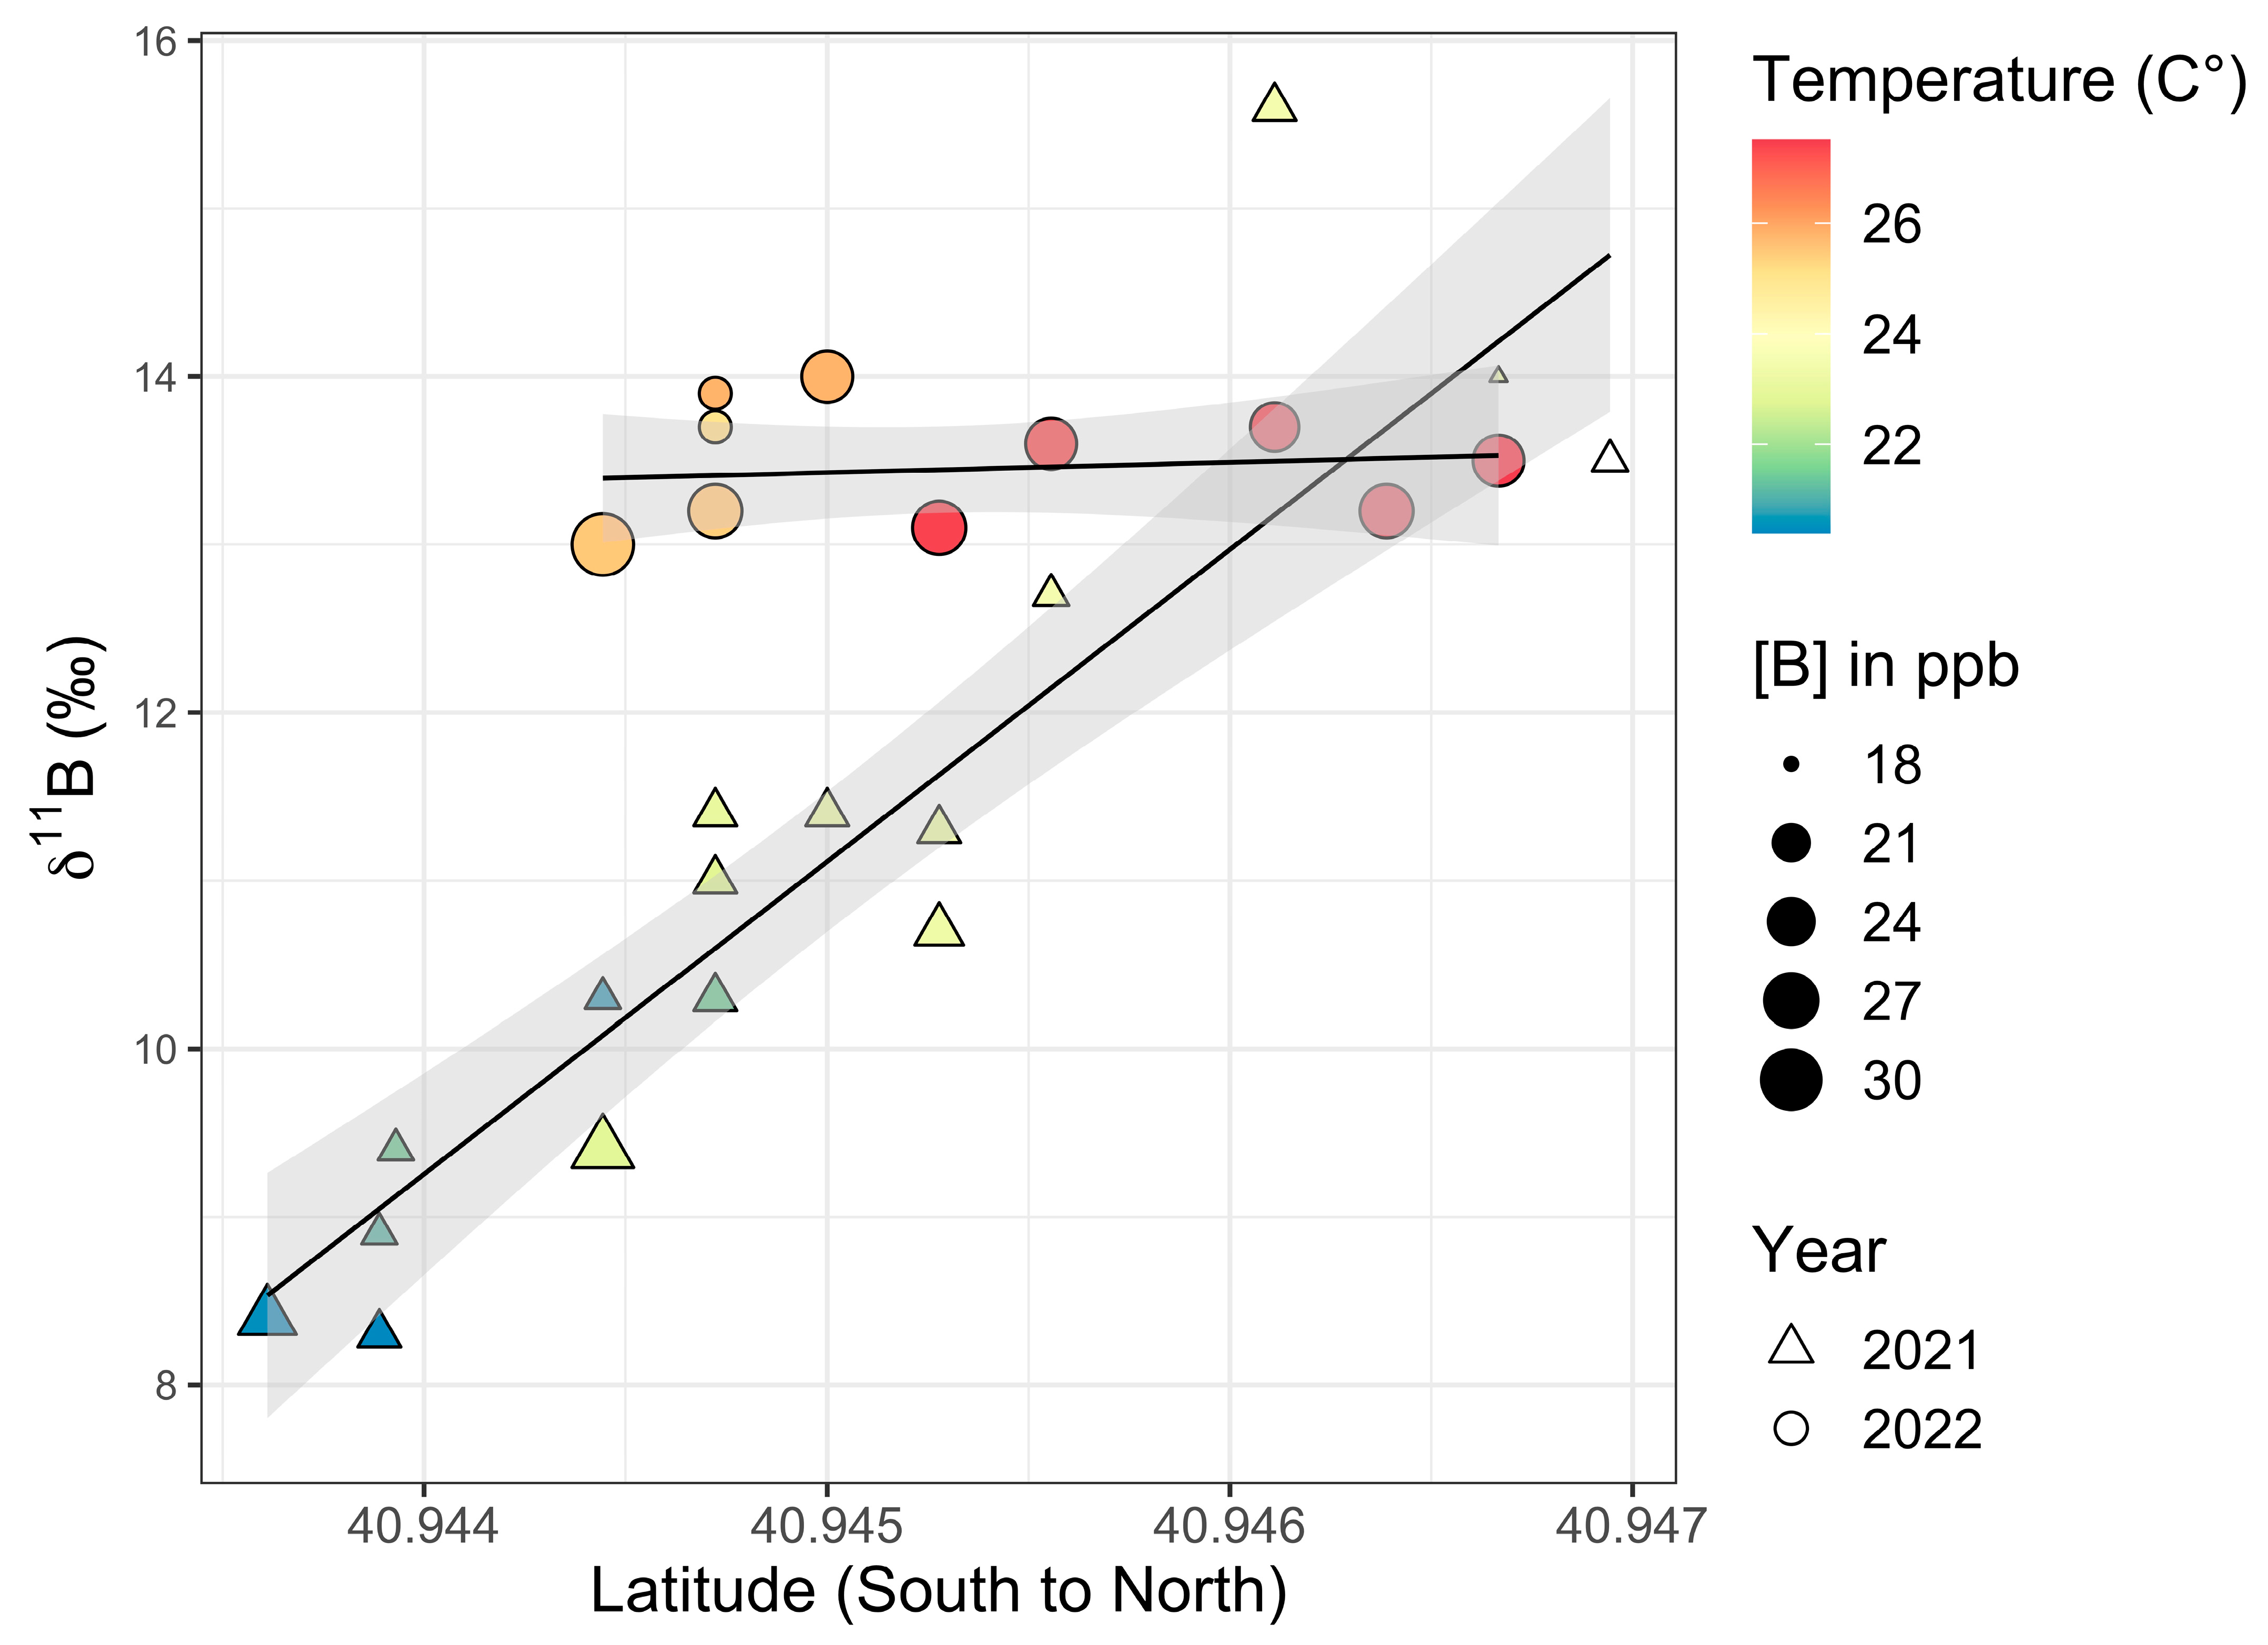
4.3. Multiyear Sampling of Setauket Pond

| Sample Name | δ11B (‰) | 2SD | B (ppb) | Latitude | Longitude |
|---|---|---|---|---|---|
| Setauket Creek Confluence 1 | 10.1 | 0.3 | 27 | 40.941534 | −73.117105 |
| Setauket Creek Confluence 2 | 10.6 | 0.3 | 44 | 40.941700 | −73.117000 |
| Big Field | 5.5 | 0.4 | 32 | 40.942420 | −73.116947 |
| H26 | 11.8 | 0.0 | 26 | 40.942841 | −73.116836 |
| H28 | 13.2 | 0.2 | 24 | 40.943210 | −73.116679 |
| H32 | 9.1 | 0.1 | 27 | 40.943453 | −73.116541 |
| H34A | 11.6 | 0.3 | 33 | 40.943624 | −73.116486 |
| H34B | 14.2 | 0.1 | 24 | 40.943910 | −73.116390 |
| H36 | 17.1 | 0.1 | 31 | 40.944179 | −73.116302 |
| H38 | 11.8 | 0.5 | 42 | 40.944422 | −73.116226 |
4.4. Confluence and Western Near-Shore Samples
| Sample Name | δ11B (‰) | 2SD | B (ppb) | Mean B (ppb), δ11B (‰) | Latitude | Longitude |
|---|---|---|---|---|---|---|
| SP1 (2020) | −7.7 | 0.2 | 54 | 71.0, −8.4 | 40.944481 | −73.115694 |
| SP1 (2021) | −8.8 | 0.8 | 88 | |||
| SP2 (2020) | 10.9 | 1.0 | 30 | 30.5, 12.7 | 40.946931 | −73.116042 |
| SP2 (2021) | 14.4 | 0.2 | 31 | |||
| SP3 (2019) | 10.9 | 0.6 | 24 | 23.7, 12.4 | 40.946400 | −73.115200 |
| SP3 (2020) | 11.9 | 0.8 | 24 | |||
| SP3 (2021) | 14.4 | 0.2 | 23 | |||
| SP5 (2019) | 10.8 | 0.4 | 25 | 25.7, 12.2 | 40.945347 | −73.115375 |
| SP5 (2020) | 12.3 | 0.0 | 29 | |||
| SP5 (2021) | 13.6 | 2.1 | 23 | |||
| SP7 (2019) | 9.5 | 0.3 | 28 | 26.5, 10.8 | 40.944100 | −73.115875 |
| SP7 (2021) | 12.0 | 0.1 | 25 | |||
| SP4 (2020) | 14.7 | 1.7 | 35 | - | 40.947222 | −73.115220 |
4.5. Culverts and Eastern Near-Shore Samples
4.6. Kayak Transects (2021 and 2022)
4.7. Possible B Sources
5. Discussion
Setauket Pond Boron Budget
6. Conclusions
Author Contributions
Funding
Data Availability Statement
Acknowledgments
Conflicts of Interest
References
- Vengosh, A.; Weinthal, E.; Kloppmann, W.; Team, B. Natural Boron Contamination. Geotimes 2004, 49, 20–25. [Google Scholar]
- Vengosh, A.; Kloppmann, W.; Marei, A.; Livshitz, Y.; Gutierrez, A.; Banna, M.; Guerrot, C.; Pankratov, I.; Raanan, H. Sources of Salinity and Boron in the Gaza Strip: Natural Contaminant Flow in the Southern Mediterranean Coastal Aquifer: Salinity in Gaza and Coastal Aquifer. Water Resour. Res. 2005, 41, W01013. [Google Scholar] [CrossRef]
- Xu, R.; Gale, S.A.; Kim, H.; Lott, R.; Spreadbury, C.J.; Laux, S.; Townsend, T.G. Boron as a Contaminant at Construction and Demolition (C&D) Debris Landfills. Waste Manag. 2020, 109, 85–93. [Google Scholar] [CrossRef] [PubMed]
- Barth, S. Boron Isotope Variations in Nature- A Synthesis. Geol. Rundsch. 1993, 82, 640–651. [Google Scholar] [CrossRef]
- Vengosh, A. The Isotopic Composition of Anthropogenic Boron and Its Potential Impact on the Environment. Biol. Trace Elem. Res. 1998, 66, 145–151. [Google Scholar] [CrossRef] [PubMed]
- Widory, D.; Petelet-Giraud, E.; Brenot, A.; Bronders, J.; Tirez, K.; Boeckx, P. Improving the Management of Nitrate Pollution in Water by the Use of Isotope Monitoring: The δ15N, δ18O and δ11B Triptych. Isotopes Environ. Health Stud. 2013, 49, 29–47. [Google Scholar] [CrossRef] [PubMed]
- Leenhouts, J.M.; Basset, R.L.; Iii, T.M. Utilization of Intrinsic Boron Isotopes as Co-Migrating Tracers for Identifying Potential Nitrate Contamination Sources. Groundwater 1998, 36, 240–250. [Google Scholar] [CrossRef]
- Bassett, R.L.; Buszka, P.M.; Davidson, G.R.; Chong-Diaz, D. Identification of Groundwater Solute Sources Using Boron Isotopic Composition. Environ. Sci. Technol. 1995, 29, 2915–2922. [Google Scholar] [CrossRef]
- Hogan, J.F.; Blum, J.D. Boron and Lithium Isotopes as Groundwater Tracers: A Study at the Fresh Kills Landfill, Staten Island, New York, USA. Appl. Geochem. 2003, 18, 615–627. [Google Scholar] [CrossRef]
- Demetriou, A.; Pashalidis, I. Adsorption of Boron on Iron-Oxide in Aqueous Solutions. Desalination Water Treat. 2012, 37, 315–320. [Google Scholar] [CrossRef]
- Hershey, J.P.; Fernandez, M.; Milne, P.J.; Millero, F.J. The Ionization of Boric Acid in NaCl, Na-Ca-Cl and Na-Mg-Cl Solutions at 25 °C. Geochim. Cosmochim. Acta 1986, 50, 143–148. [Google Scholar] [CrossRef]
- Klochko, K.; Kaufman, A.J.; Yao, W.; Byrne, R.H.; Tossell, J.A. Experimental Measurement of Boron Isotope Fractionation in Seawater. Earth Planet. Sci. Lett. 2006, 248, 276–285. [Google Scholar] [CrossRef]
- Lemarchand, D.; Gaillardet, J.; Lewin, É.; Allègre, C.J. The Influence of Rivers on Marine Boron Isotopes and Implications for Reconstructing Past Ocean PH. Nature 2000, 408, 951–954. [Google Scholar] [CrossRef] [PubMed]
- Lemarchand, D.; Gaillardet, J.; Lewin, É.; Allègre, C.J. Boron Isotope Systematics in Large Rivers: Implications for the Marine Boron Budget and Paleo-PH Reconstruction over the Cenozoic. Chem. Geol. 2002, 190, 123–140. [Google Scholar] [CrossRef]
- Tamborski, J.; Brown, C.; Bokuniewicz, H.; Cochran, J.K.; Rasbury, E.T. Investigating Boron Isotopes for Identifying Nitrogen Sources Supplied by Submarine Groundwater Discharge to Coastal Waters. Front. Environ. Sci. 2020, 8, 126. [Google Scholar] [CrossRef]
- National Oceanic and Atmospheric Administration (NOAA). Climate Normals Quick Access. Available online: https://www.ncei.noaa.gov/access/us-climate-normals/ (accessed on 8 September 2023).
- National Weather Service What Is a Nor’easter? Available online: https://www.weather.gov/safety/winter-noreaster (accessed on 8 September 2023).
- Cohen, P.; Franke, O.L.; Foxworthy, B.L. An Atlas of Long Island’s Water Resources; New York State Water Resources Bulletin; United States Geological Survey (USGS): Long Island, NY, USA, 1968; p. 117.
- Prince, K.R.; Reilly, T.E.; Franke, O.L. Analysis of the Shallow Groundwater Flow System near Connetqout Brook, Long Island, New York. J. Hydrol. 1989, 107, 223–250. [Google Scholar] [CrossRef]
- Peritore, B.; Downs, D.; Wooton, K.; Rasbury, T. Isotopic Evidence in Rainwater for Boron Contribution in Long Island Groundwaters. In Proceedings of the Geology of Long Island and Metropolitan New York, Stony Brook, NY, USA, April 2020. [Google Scholar]
- Como, M.D.; Noll, M.L.; Finkelstein, J.S.; Monti, J.; Busciolano, R. Water-Table and Potentiometric-Surface Altitudes in the Upper Glacial, Magothy, and Lloyd Aquifers of Long Island, New York; United States Geological Survey (USGS): Long Island, NY, USA, 2015; p. 6.
- Peritore, B.; Gonzalez, H.; Wooton, K.; Letscher, S.; Hudson, J.; Rasbury, T. Boron Isotopes as a Tracer for Nitrate in Coastal Settings. In Proceedings of the AGU Fall Meeting Abstracts, Chicago, IL, USA, 12–16 December 2022. [Google Scholar]
- Peritore, B.; Cook, A.; Pant, H.K.; Glotch, T.D. CUNY-SUNY Speedway: Connecting Lehman College Faculty and Students to Opportunities in Stony Brook University’s Department of Geosciences. In Proceedings of the AGU Fall Meeting Abstracts, Chicago, IL, USA, 12–16 December 2022. [Google Scholar]
- Downs, D.; Peritore, B.; Wooton, K.; Rasbury, T. Boron Isotopic Evidence for Compartmentalization of the Upper Glacial Aquifer. In Proceedings of the Geology of Long Island and Metropolitan New York, Stony Brook, NY, USA, April 2020. [Google Scholar]
- Hemming, N.G.; Hanson, G.N. A Procedure for the Isotopic Analysis of Boron by Negative Thermal Ionization Mass Spectrometry. Chem. Geol. 1994, 114, 147–156. [Google Scholar] [CrossRef]
- Foster, G.L.; Pogge von Strandmann, P.A.E.; Rae, J.W.B. Boron and Magnesium Isotopic Composition of Seawater: DATA BRIEF. Geochem. Geophys. Geosystems 2010, 11. [Google Scholar] [CrossRef]
- Zhou, L. Annual Precipitation Pattern over Long Island Based on Radar Data. Ph.D. Thesis, Stony Brook University, Stony Brook, NY, USA, 2008. [Google Scholar]
- Miller, J.F.; Frederick, R.H. The Precipitation Regime of Long Island, New York. Prof. Pap. 1969, A1–A21. [Google Scholar] [CrossRef]
- González-Fontes, A. Why Boron Is an Essential Element for Vascular Plants: A Comment on Lewis (2019) ‘Boron: The Essential Element for Vascular Plants That Never Was’. New Phytol. 2020, 226, 1228–1230. [Google Scholar] [CrossRef]
- Wright, C.C.; Wooton, K.M.; Twiss, K.C.; Newman, E.T.; Rasbury, E.T. Boron Isotope Analysis Reveals Borate Selectivity in Seaweeds. Environ. Sci. Technol. 2021, 55, 12724–12730. [Google Scholar] [CrossRef]
- Rasbury, T.; Wooton, K.; Peritore, B.; Wright, C.; Passik, M.; Wooton, R.; Letscher, S.; Wong, C.; Clarke, A.; Doall, M. Boron Isotopes Reveal Differences in Boron Uptake in Tomato Plants from Different Sources. In Proceedings of the Long Island Geologists, Stony Brook, NY, USA, 9 April 2022. [Google Scholar]
- Peritore, B.; Downs, D.; Wright, C.; Wooton, K.; Doall, M.; Rasbury, T. Boron in Soils, Fertilizers and Plants in a Pilot Garden Study. In Proceedings of the 28th Conference on the Geology of Long Island and Metropolitan New York, Stony Brook, NY, USA, 10 April 2021. [Google Scholar]


| Sample Name | δ11B (‰) | 2SD | B (ppb) | Latitude | Longitude |
|---|---|---|---|---|---|
| Blydenburg Pond A, Smithtown | 10.4 | 1.2 | 48 | 40.8428618 | −73.2277239 |
| Blydenburg Pond B, Smithtown | 17.9 | 0.9 | 40 | 40.8429112 | −73.2278610 |
| Blydenburg Pond C, Smithtown | 12.8 | 0.6 | 39 | 40.8419654 | −73.2281765 |
| Blydenburg Pond D, Smithtown | 14.1 | 0.0 | 53 | 40.8381946 | −73.2298402 |
| Blydenburg Pond E, Smithtown | 12.9 | 0.5 | 45 | 40.8364809 | −73.2259872 |
| Grassy Pond, Calverton | 31.5 | 0.1 | 9 | 40.8932991 | −72.8371785 |
| Sandy Pond, Calverton | 32.3 | 1.5 | 5 | 40.8959775 | −72.8374258 |
| T. Bayles Minuse Mill Pond A, Stony Brook | 15.8 | 0.4 | 24 | 40.913765 | −73.146406 |
| T. Bayles Minuse Mill Pond B, Stony Brook | 14.2 | 0.3 | 25 | 40.913652 | −73.147568 |
| Sample Type | Date | Wind Direction | Average Temperature (°C) | δ11B (‰) | 2SD | B (ppb) |
|---|---|---|---|---|---|---|
| Rainwater | 6/9//19 | NE | 17 | 15.6 | 0.3 | 7 |
| 27/10/20 | SE | 16 | 33.4 | 0.3 | 6 | |
| 12/11/19 * | NW | 5 | 21.3 | 0.3 | 9 | |
| 29/10/20 | E/NE | 10 | 31.5 | 0.4 | 4 | |
| 30/10/20 | N/NE | 5 | 34.0 | 1.0 | 4 | |
| 1/11/20 | S | 10 | 4.7 | 0.4 | 5 | |
| 23/11/20 + | SW | 12 | 26.5 | 0.4 | 5 | |
| 4/12/20 | W/SW | 9 | ^ | - | ^ | |
| 14/12/20 | N | 3 | 13.9 | 0.4 | 2 | |
| 1/1/21 | E/NE | 2 | 27.6 | 0.4 | 1 | |
| 16/1/21 | N/mixed | 7 | 30.8 | 0.4 | 5 | |
| 26/1/21 * | E/NE | 1 | 25.3 | 0.4 | 5 | |
| 16/2/21 | S/mixed | 6 | 12.3 | 0.4 | 5 | |
| Snow | 15/12/20 | NE | −2 | 21.8 | 0.4 | 1 |
| 20/12/20 | Calm/N | 0 | 10.4 | 0.4 | 1 | |
| 2/1/21 | NE | −1 | 27.0 | 0.4 | 1 | |
| 1/2/21 | NE | −1 | 19.0 | 0.4 | 1 | |
| 2/2/21 | N | 1 | 30.4 | 0.4 | 1 | |
| 7/2/21 | N/NE | 0 | ^ | - | ^ | |
| 11/2/21 | N/NE | −3 | 25.1 | 0.4 | 1 |
| Sample Name | δ11B (‰) | 2SD | B (ppb) | Latitude | Longitude |
|---|---|---|---|---|---|
| Detmer Farm Pond | 9.8 | 0.8 | 14 | 40.933050 | −73.117200 |
| Detmer Farm Creek | 12.1 | 1.0 | 14 | 40.934100 | −73.117700 |
| Tidal Creek | 38.9 | 0.9 | 2027 | 40.947060 | −73.116410 |
| Sample Name | δ11B (‰) | 2SD | B (ppb) | Latitude | Longitude |
|---|---|---|---|---|---|
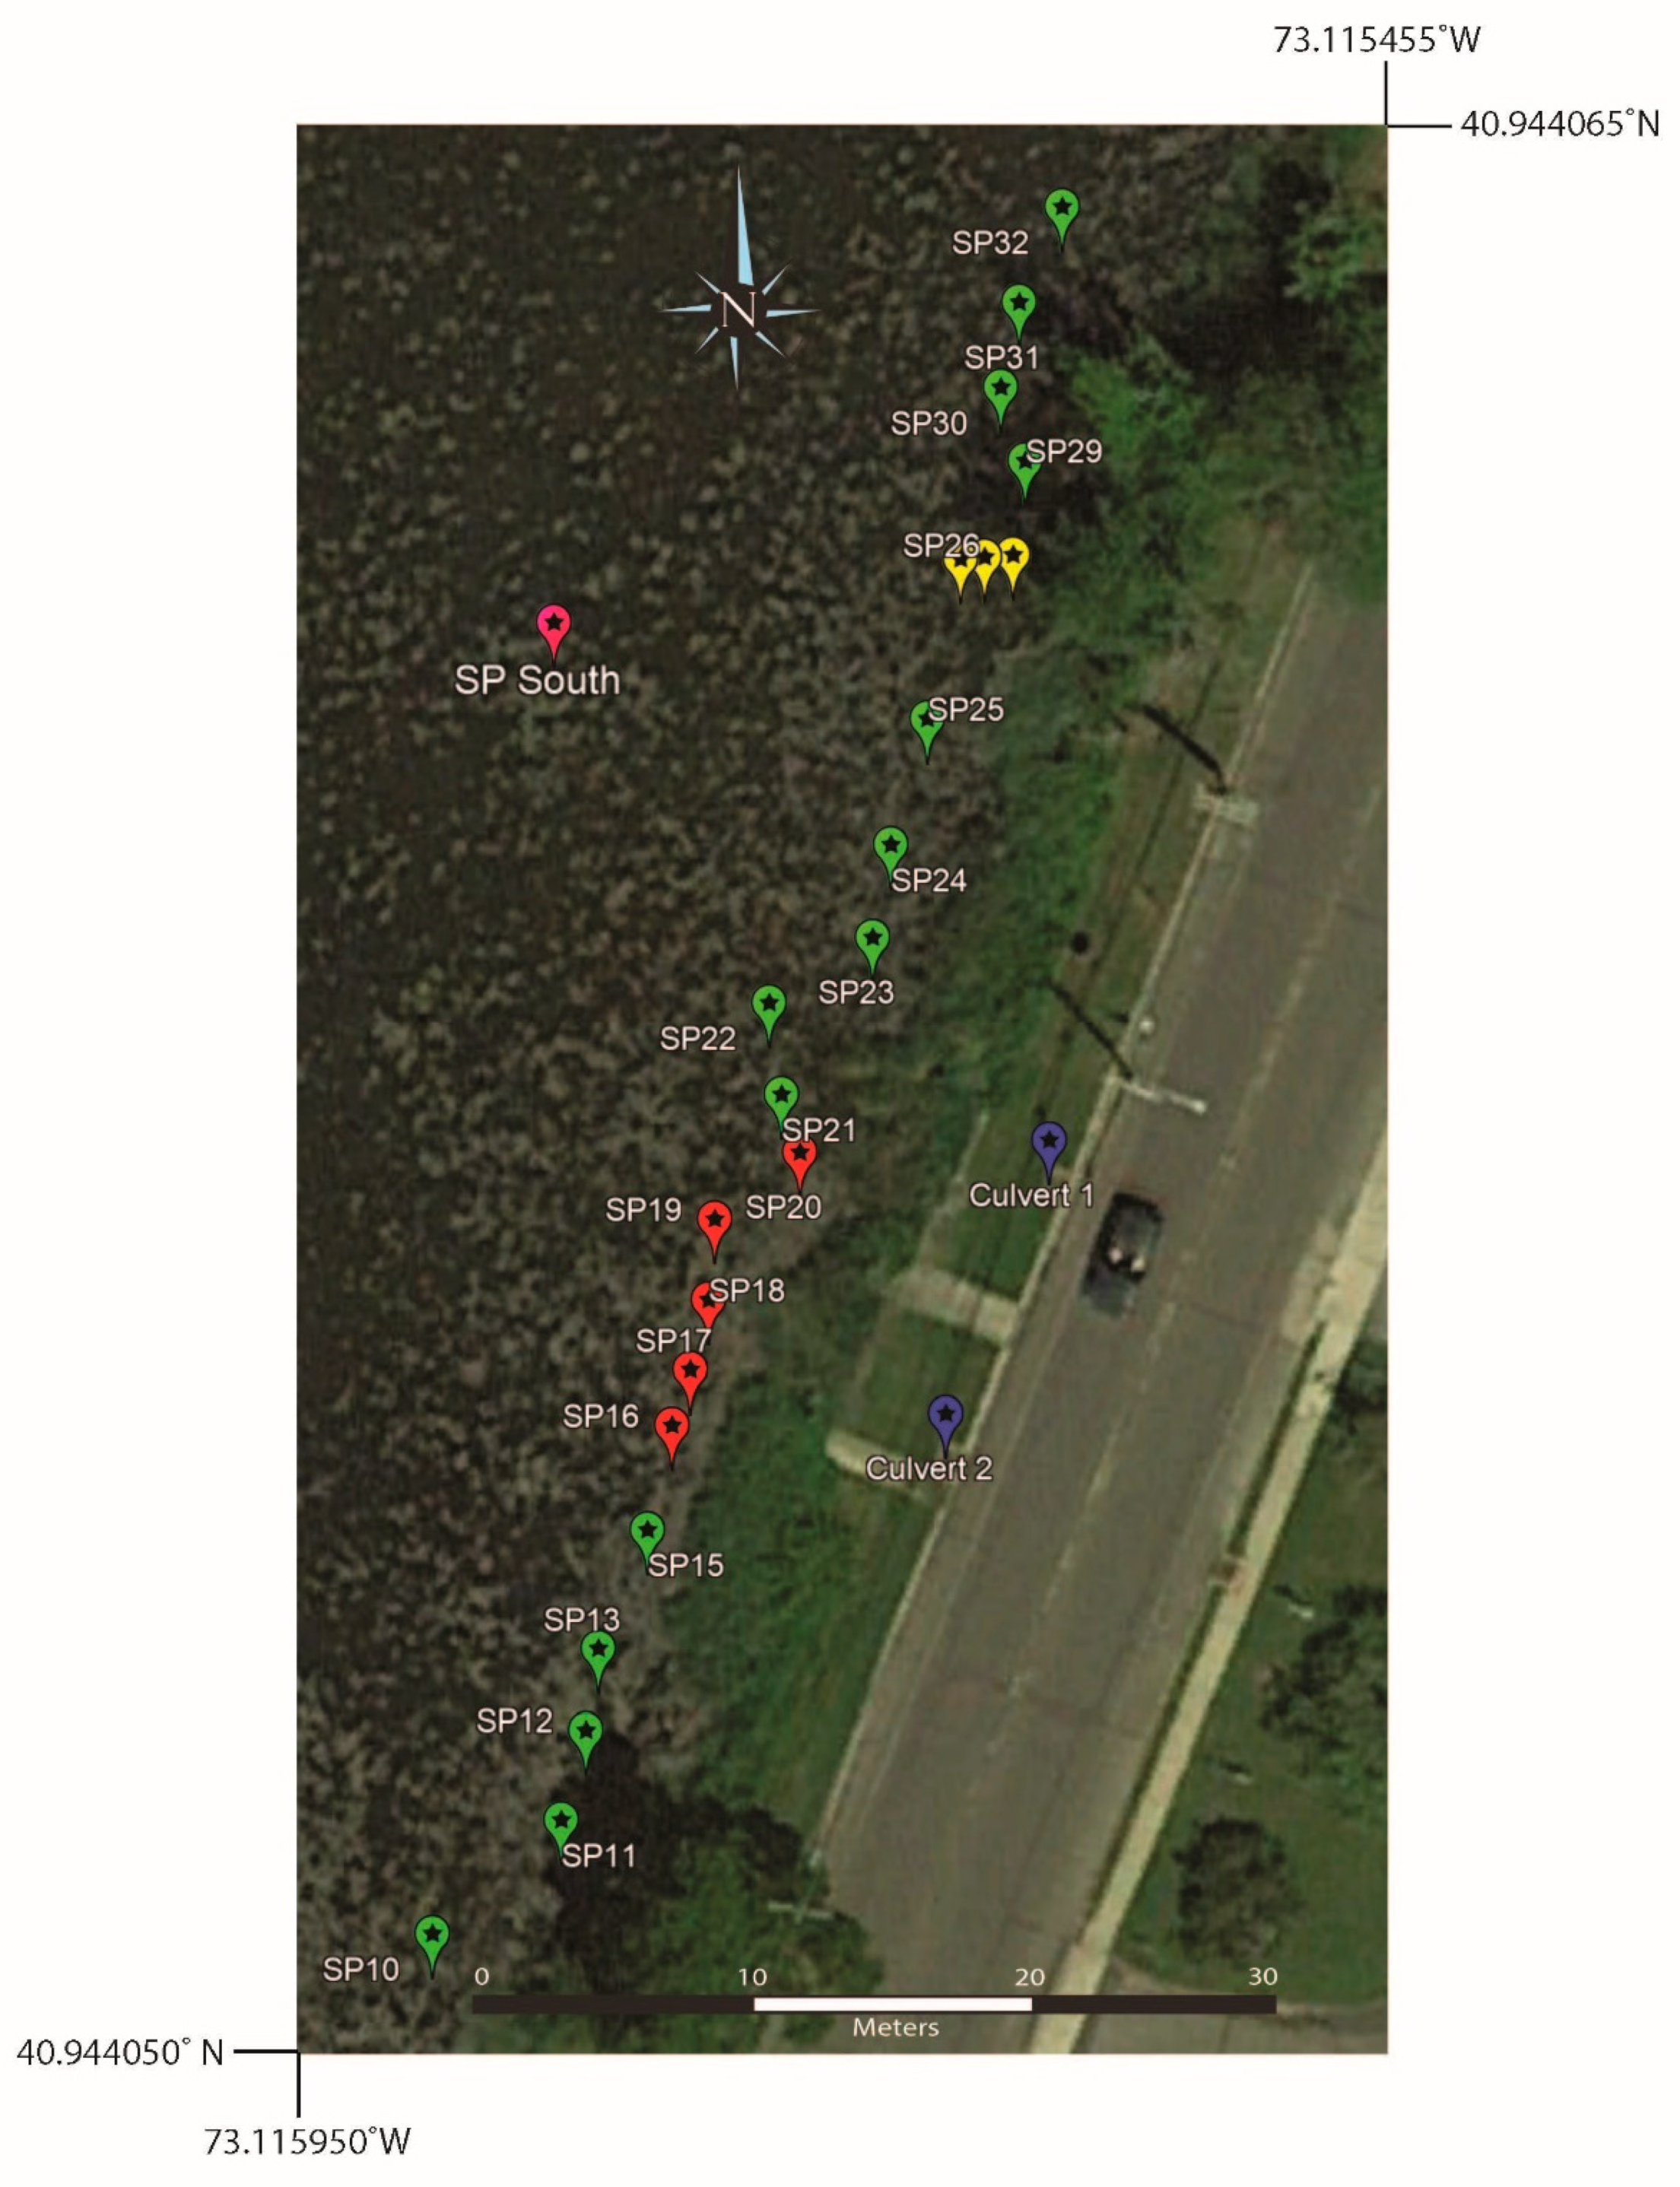
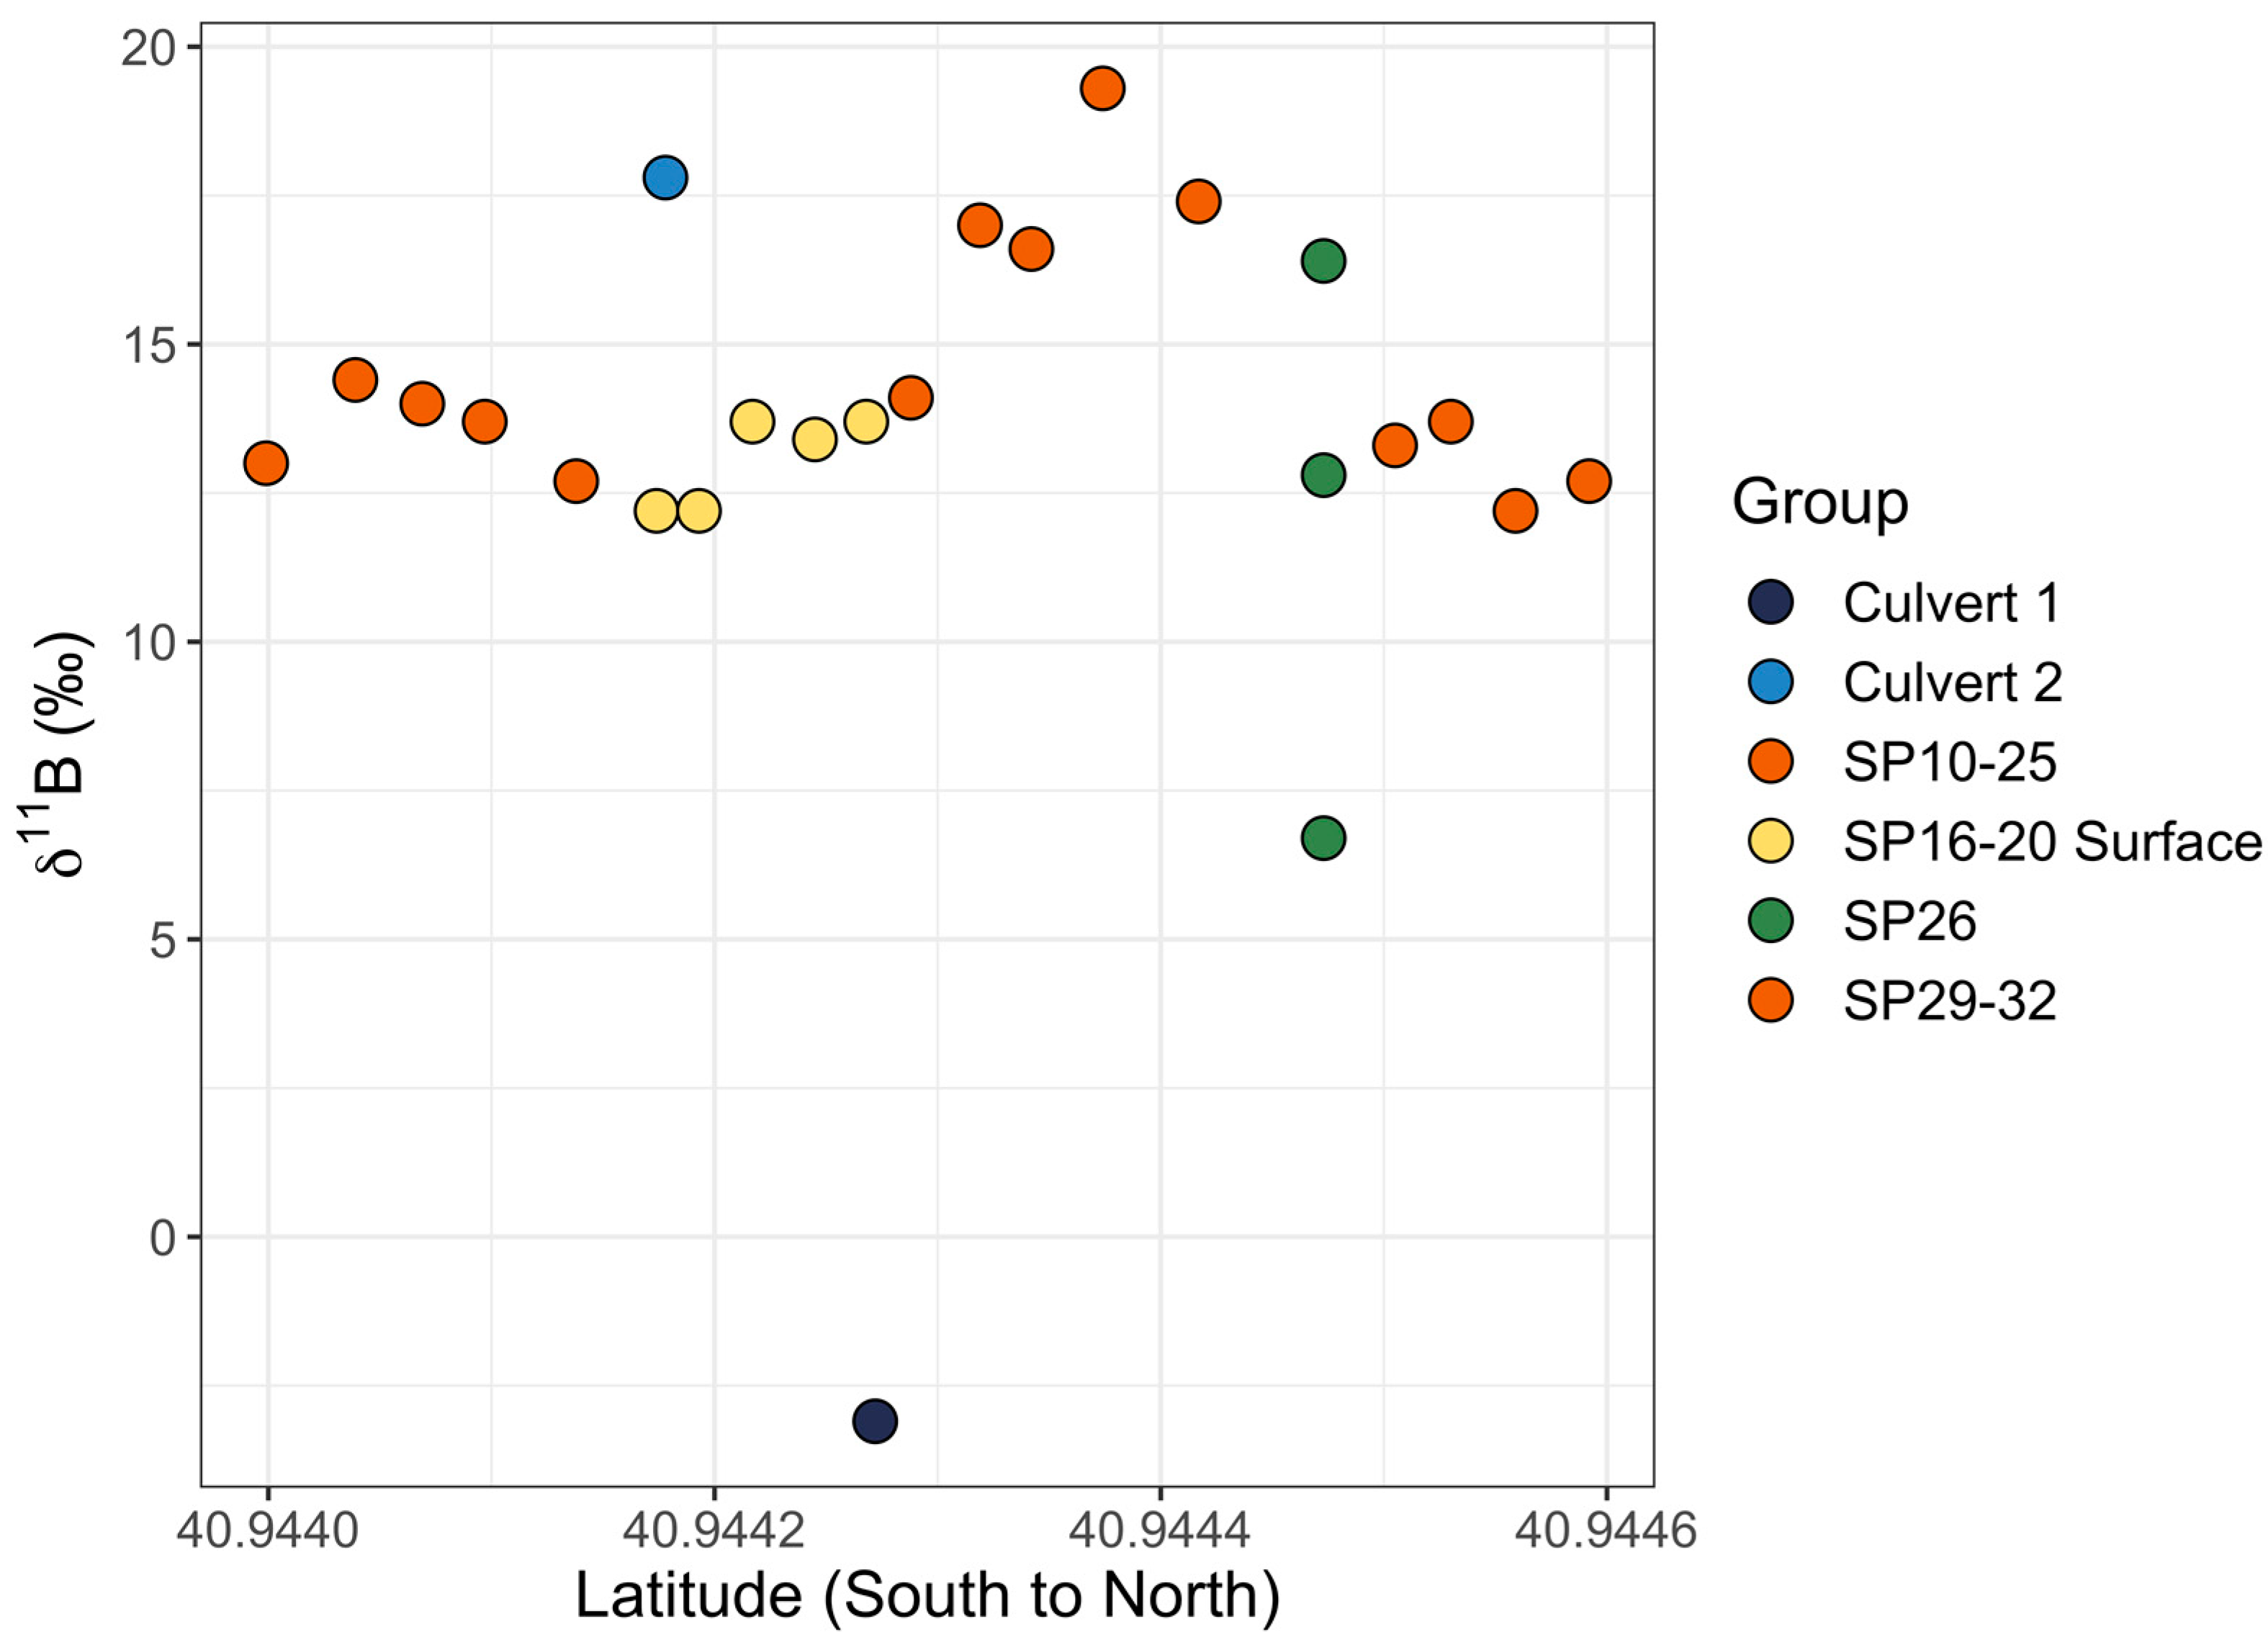
| Culvert 1 | −3.1 | 1.2 | 61 | 40.944272 | −73.115678 |
| Culvert 2 | 17.8 | 0.1 | 17 | 40.944178 | −73.115725 |
| SP10 | 13.0 | 0.4 | 23 | 40.943999 | −73.115990 |
| SP11 | 14.4 | 0.4 | 24 | 40.944039 | −73.115900 |
| SP12 | 14.0 | 0.2 | 25 | 40.944069 | −73.115889 |
| SP13 | 13.7 | 0.4 | 25 | 40.944097 | −73.115883 |
| SP15 | 12.7 | 1.0 | 22 | 40.944138 | −73.115861 |
| SP21 | 14.1 | 0.0 | 24 | 40.944288 | −73.115800 |
| SP22 | 17.0 | 0.6 | 26 | 40.944319 | −73.115806 |
| SP23 | 16.6 | 1.4 | 26 | 40.944342 | −73.115758 |
| SP24 | 19.3 | 0.3 | 29 | 40.944374 | −73.115750 |
| SP25 | 17.4 | 0.7 | 27 | 40.944417 | −73.115733 |
| SP26 ~1 m | 6.7 | 0.5 | 48 | 40.944473 | −73.115694 |
| SP26 ~2 m | 12.8 | 3.2 | 44 | ||
| SP26 ~3 m | 16.4 | 2.6 | 28 | ||
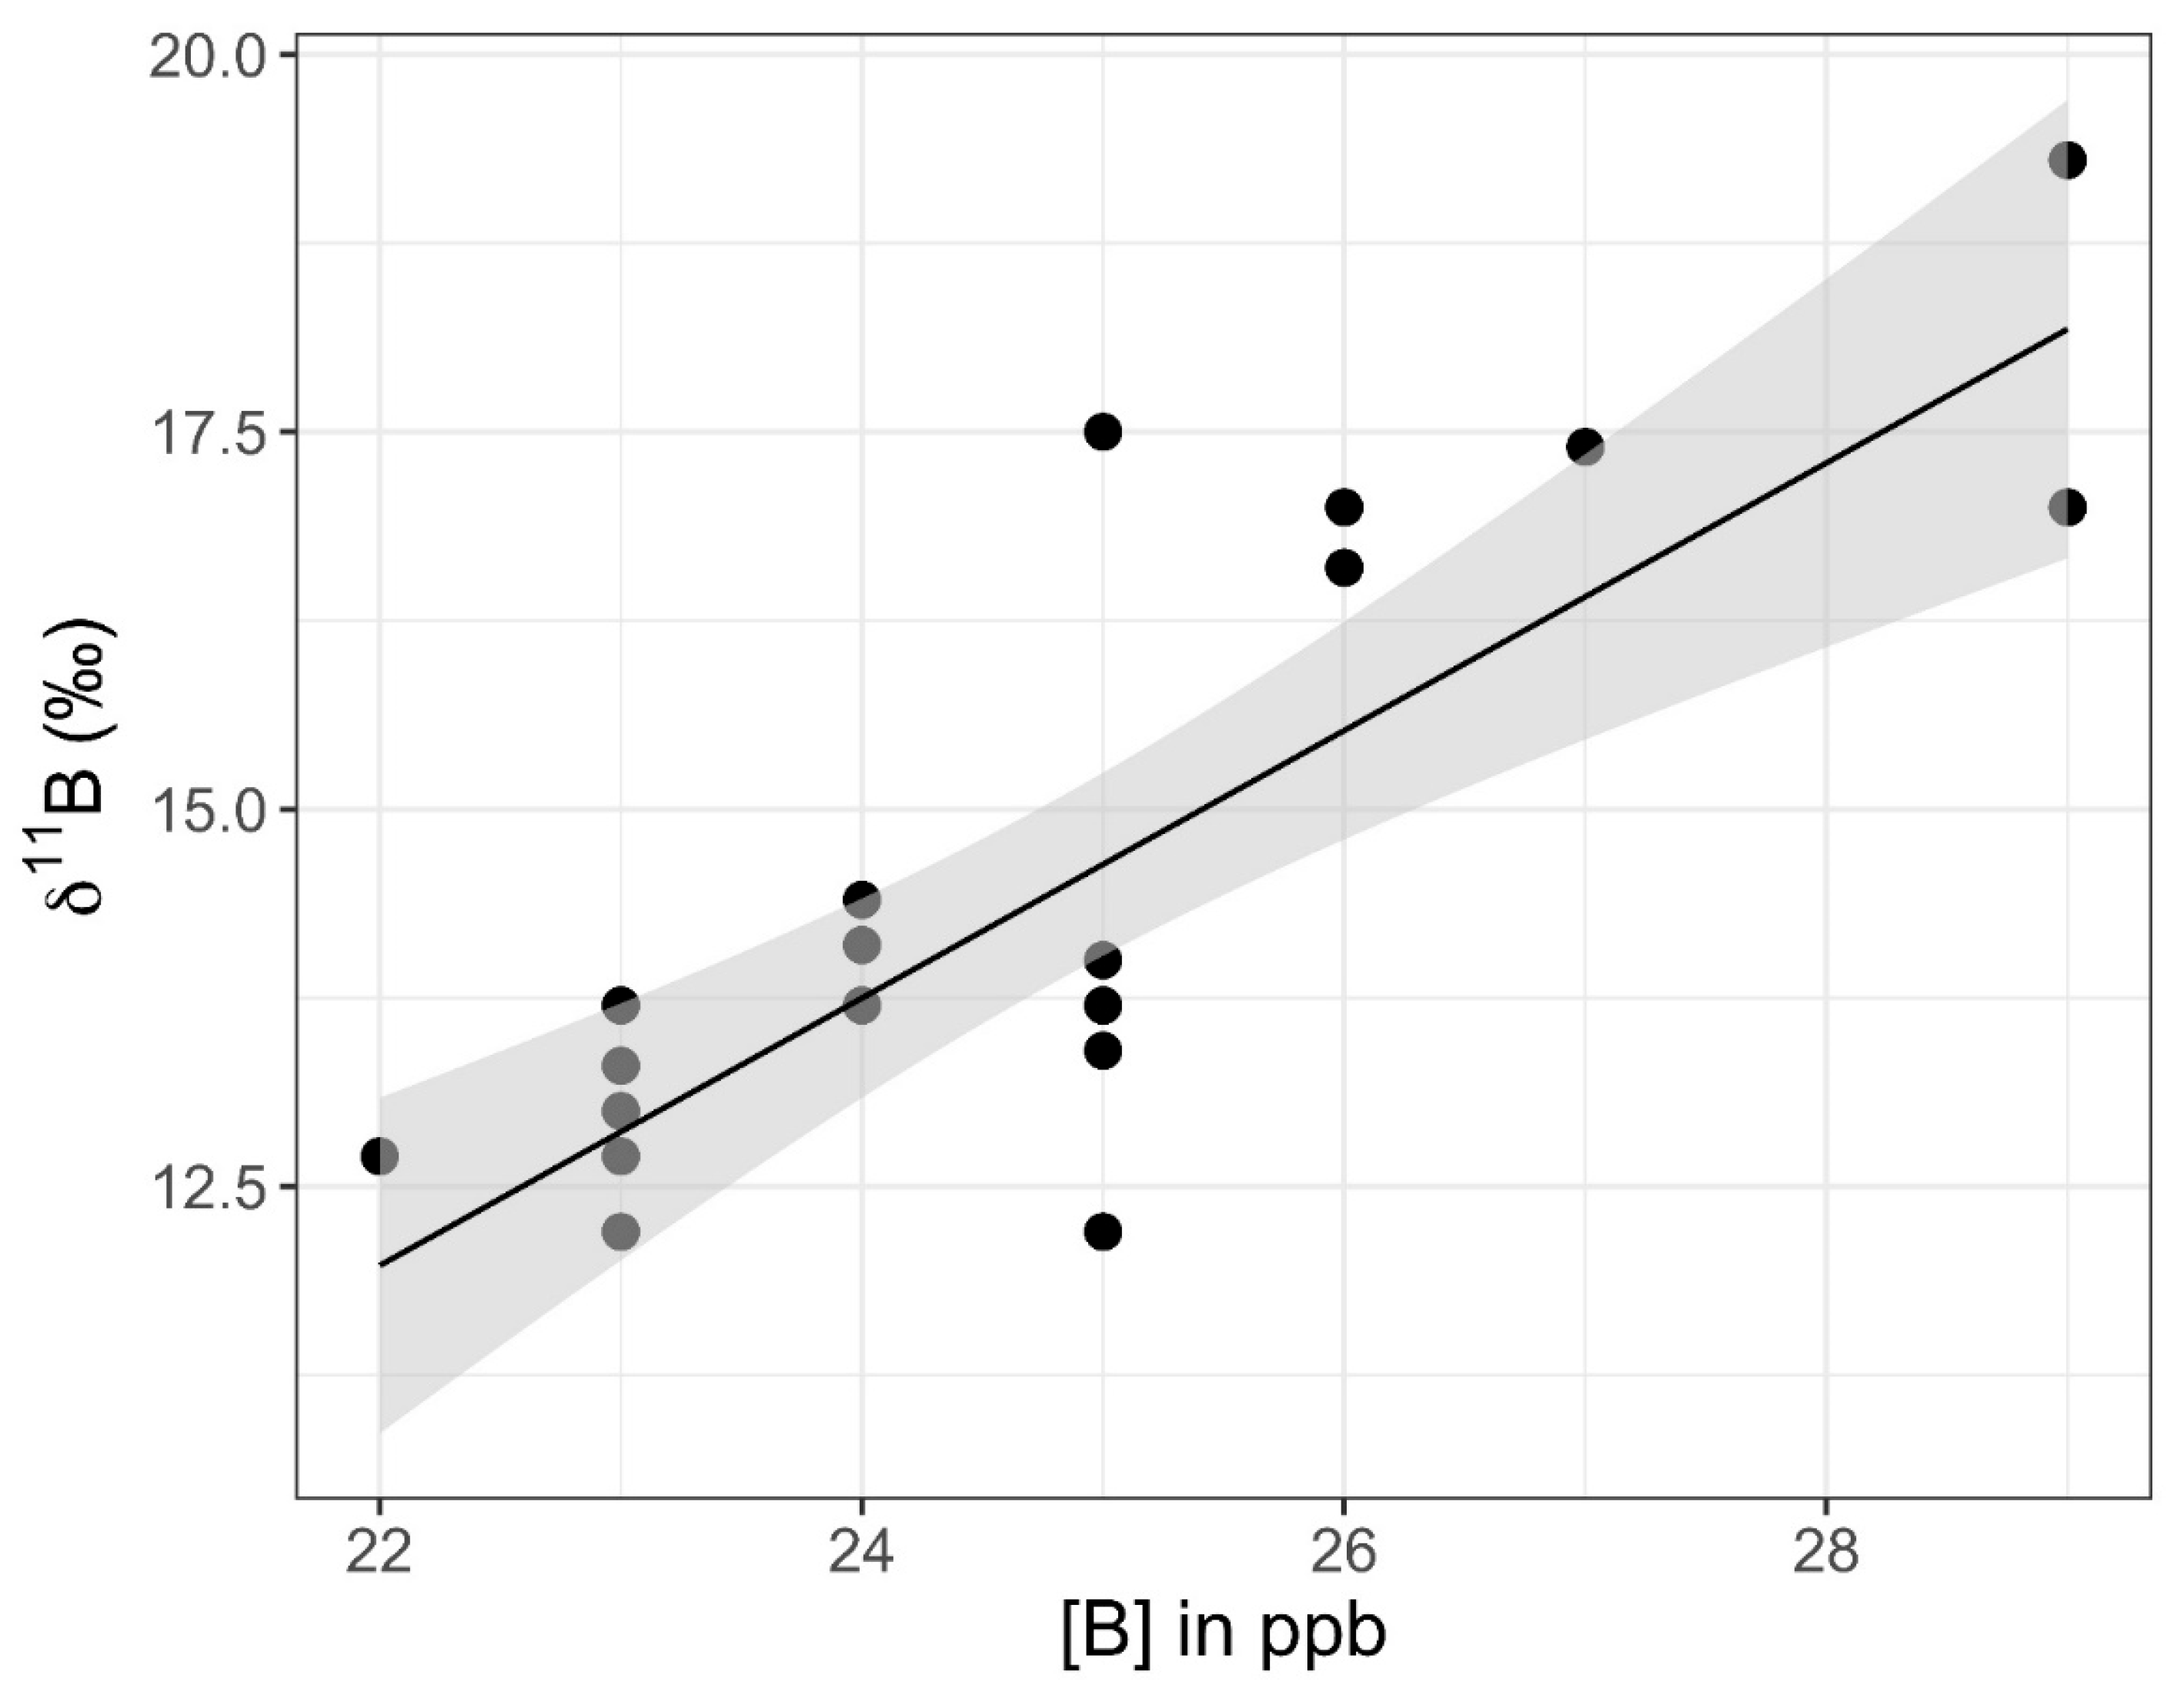
| SP27 | 17.5 | 0.8 | 25 | N/A | N/A |
| SP28 | 17.0 | 0.9 | 29 | N/A | N/A |
| SP29 | 13.3 | 4.0 | 23 | 40.944505 | −73.115689 |
| SP30 | 13.7 | 0.5 | 23 | 40.944530 | −73.115700 |
| SP31 | 12.2 | 0.4 | 23 | 40.944559 | −73.115692 |
| SP32 | 12.7 | 3.3 | 23 | 40.944592 | −73.115672 |
| Sample Name | δ11B (‰) | 2SD | B (ppb) | Latitude | Longitude |
|---|---|---|---|---|---|
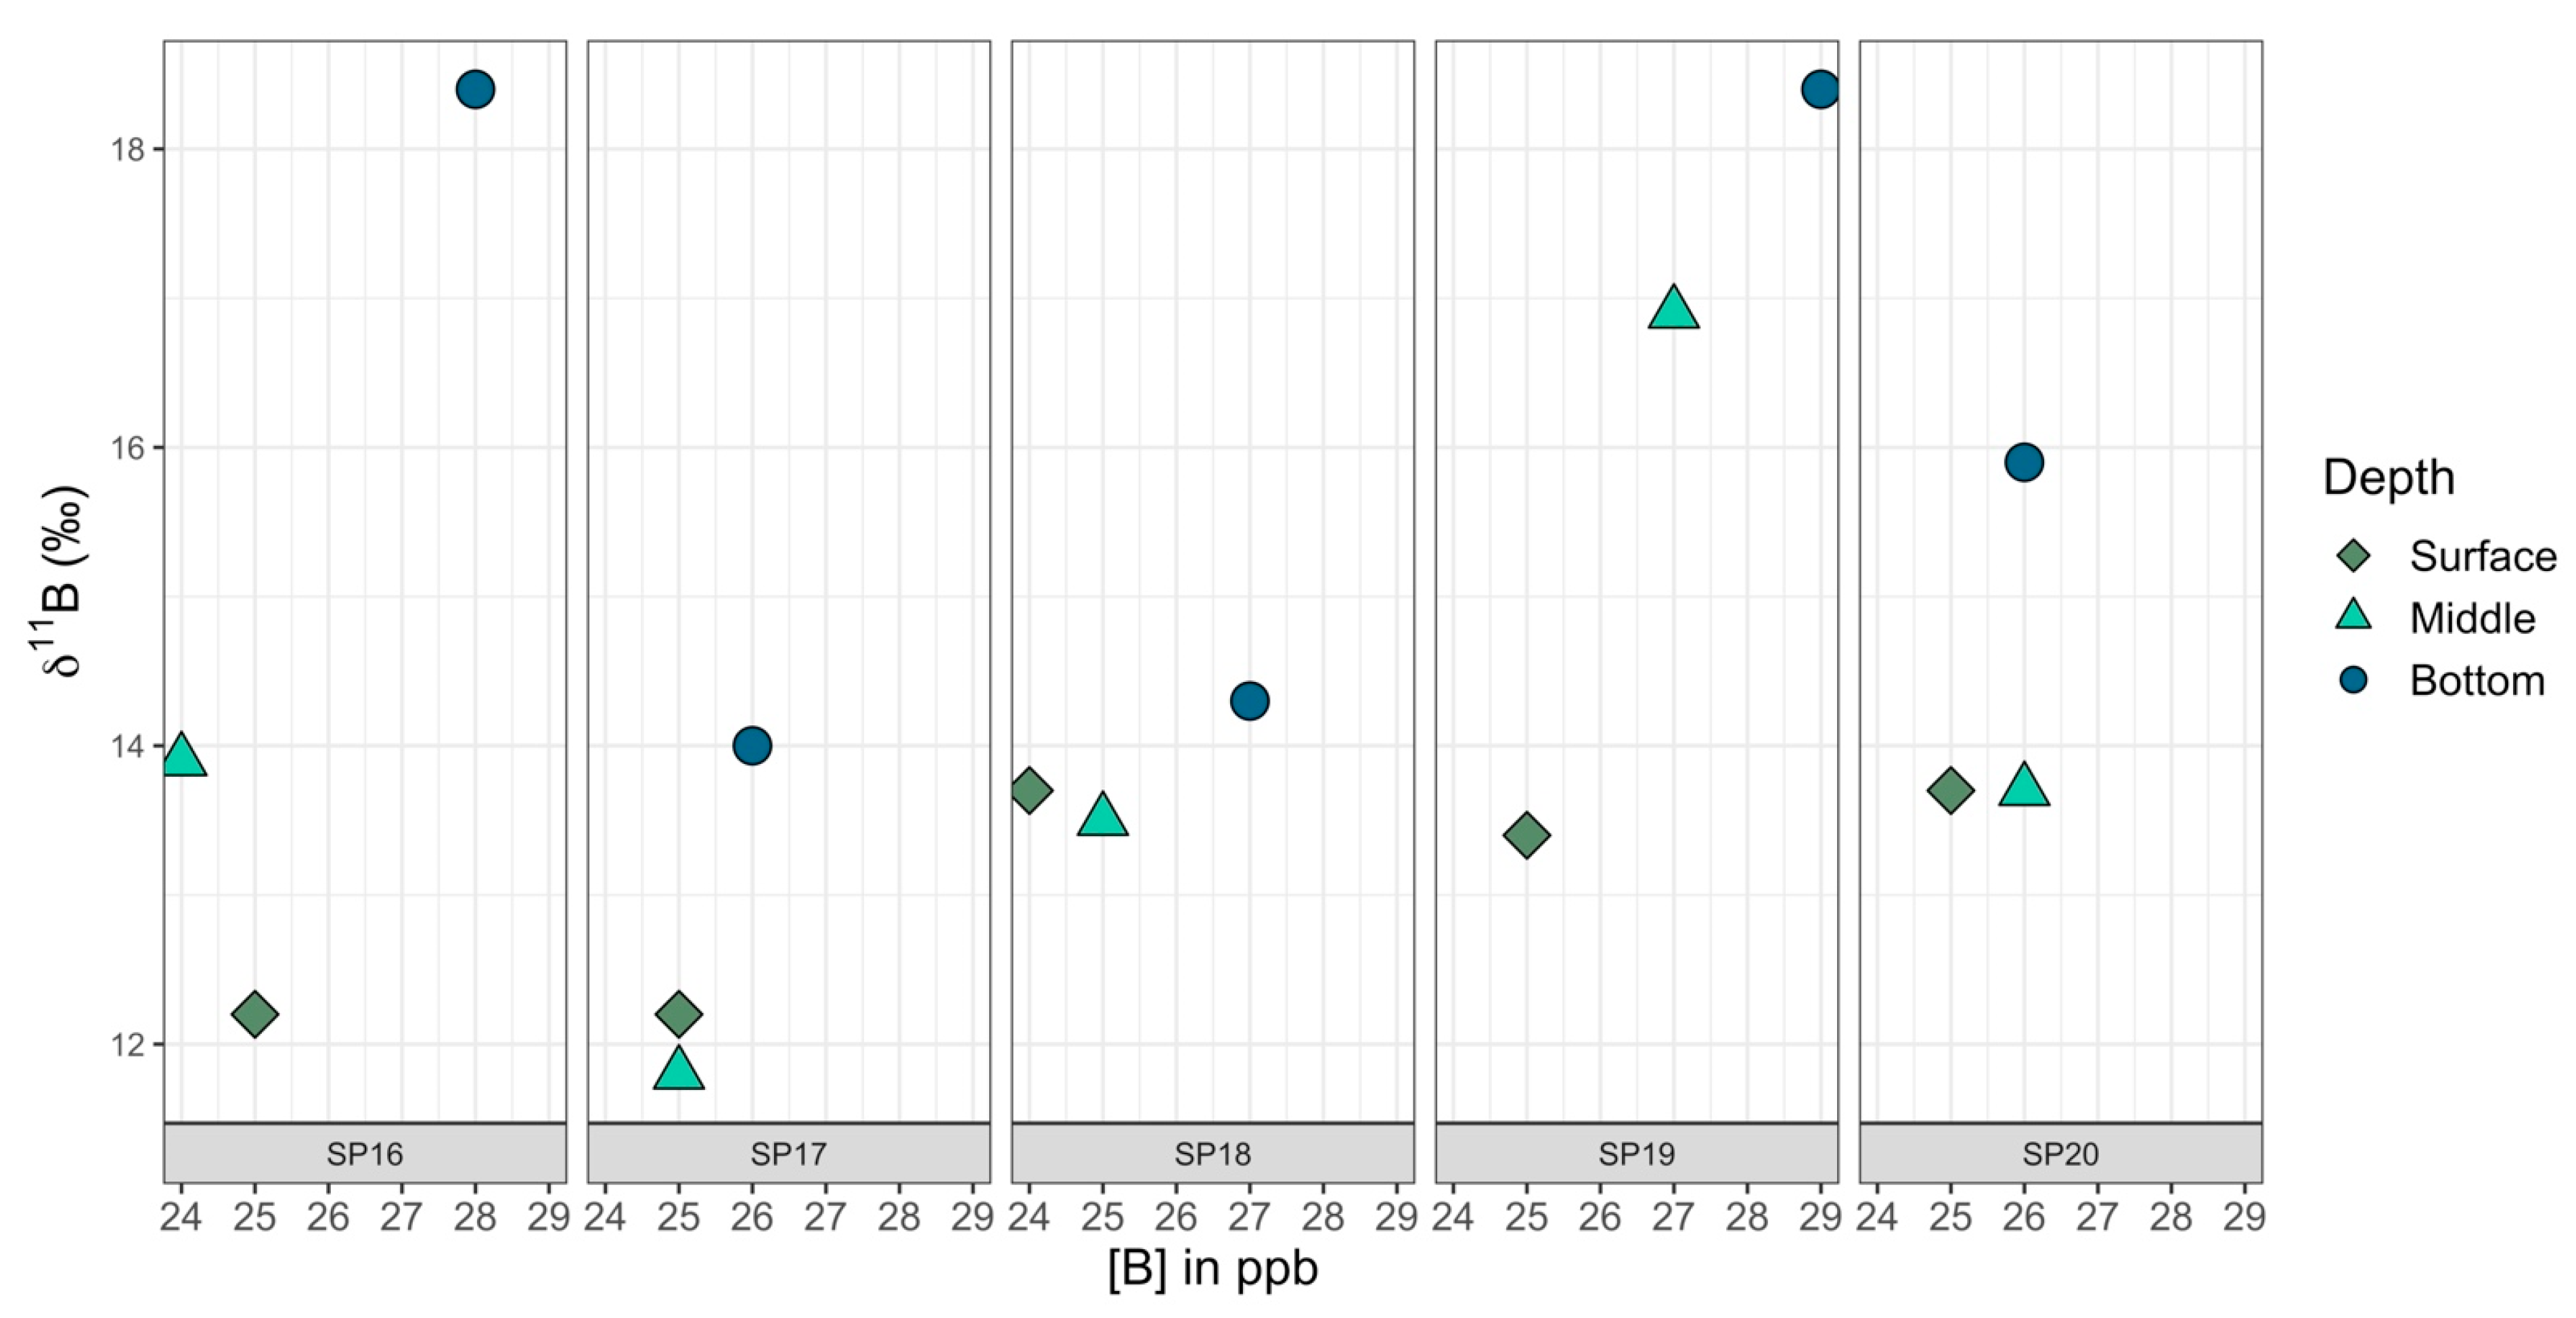
| SP16S | 12.2 | 0.6 | 25 | 40.944174 | −73.115850 |
| SP16M | 13.9 | 0.7 | 24 | ||
| SP16B | 18.4 | 0.4 | 28 | ||
| SP17S | 12.2 | 0.1 | 25 | 40.944193 | −73.115842 |
| SP17M | 11.8 | 2.7 | 25 | ||
| SP17B | 14.0 | 0.8 | 26 | ||
| SP18S | 13.7 | 0.3 | 24 | 40.944217 | −73.115833 |
| SP18M | 13.5 | 1.1 | 25 | ||
| SP18B | 14.3 | 2.6 | 27 | ||
| SP19S | 13.4 | 0.2 | 25 | 40.944245 | −73.115831 |
| SP19M | 16.9 | 0.0 | 27 | ||
| SP19B | 18.4 | 1.0 | 29 | ||
| SP20S | 13.7 | 0.1 | 25 | 40.944268 | −73.115792 |
| SP20M | 13.7 | 0.7 | 26 | ||
| SP20B | 15.9 | 1.4 | 26 |
| Sample Name | δ11B (‰) | 2SD | B (ppb) | Latitude | Longitude | Temp. (°C) |
|---|---|---|---|---|---|---|
| SP33 | 13.5 | 1.8 | 19 | 40.946942 | −73.115832 | N/A |
| SP34 | 14.0 | 1.0 | 18 | 40.946667 | −73.115833 | 23.4 |
| SP35 | 13.2 | 1.9 | 19 | 40.946389 | −73.115833 | 23.5 |
| SP36 | 15.6 | 2.5 | 20 | 40.946111 | −73.115833 | 23.5 |
| SP37 | 12.7 | 1.7 | 19 | 40.945556 | −73.115833 | 23.5 |
| SP38 | 11.3 | 0.3 | 20 | 40.945278 * | −73.115833 * | 23.4 |
| SP39 | 10.7 | 0.4 | 21 | 40.945278 * | −73.115833 * | 23.3 |
| SP40 | 11.4 | 0.7 | 20 | 40.945000 | −73.115556 | 23.4 |
| SP41 | 11.4 | 0.4 | 20 | 40.944724 * | −73.115552 * | 23.1 |
| SP42 | 11.0 | 0.4 | 20 | 40.944724 * | −73.115552 * | 22.8 |
| SP43 | 10.3 | 0.9 | 20 | 40.944724 * | −73.115552 * | 21.4 |
| SP44 | 10.3 | 0.8 | 18 | 40.944444 * | −73.115833 * | 20.7 |
| SP45 | 10.3 | 0.2 | 19 | 40.944444 * | −73.115833 | 20.7 |
| SP46 | 9.4 | 0.2 | 24 | 40.944444 * | −73.115833 * | 22.9 |
| SP47 | 9.4 | 0.8 | 19 | 40.944191 | −73.116003 | 21.4 |
| SP48 | 8.9 | 1.4 | 19 | 40.943930 * | −73.116170 * | 21.1 |
| SP49 | 8.3 | 0.1 | 20 | 40.943930 * | −73.116170 * | 20.4 |
| SP50 | 8.4 | 0.5 | 23 | 40.943611 | −73.116387 | 20.5 |
| Sample Name | δ11B (‰) | 2SD | B (ppb) | Latitude | Longitude | Temp. (°C) | Nitrate (mg/L) |
|---|---|---|---|---|---|---|---|
| SP34 | 13.5 | 2.0 | 26 | 40.946667 | −73.115833 | 27.5 | 2.8 |
| SP35 | 13.2 | 0.1 | 27 | 40.946389 | −73.115833 | 27.4 | 2.6 |
| SP36 | 13.7 | 0.9 | 25 | 40.946111 | −73.115833 | 27.4 | 3.0 |
| SP37 | 13.6 | 1.6 | 26 | 40.945556 | −73.115833 | 27.3 | 3.2 |
| SP38 | 13.1 | 2.1 | 27 | 40.945278 * | −73.115833 * | 27.4 | 3.1 |
| SP40 | 14.0 | 0.5 | 26 | 40.945000 | −73.115556 | 25.8 | 3.6 |
| SP41 | 13.9 | 0.9 | 20 | 40.944724 * | −73.115552 * | 25.8 | 4.0 |
| SP42 | 13.2 | 0.3 | 27 | 40.944724 * | −73.115552 * | 25.4 | 4.6 |
| SP43 | 13.7 | 0.5 | 20 | 40.944724 * | −73.115552 * | 25.0 | 4.6 |
| SP45 | 13.0 | 0.3 | 28 | 40.944444 * | −73.115833 | 24.6 | 4.6 |
| SP46 | 13.0 | 2.6 | 31 | 40.944444 * | −73.115833 * | 25.5 | 4.7 |
| Sample Name | δ11B (‰) | 2SD | B (ppb) | |
|---|---|---|---|---|
| Pond algae | −4.6 | 2.6 | 366 | |
| Har Tru Tennis Court clay | 11.5 | 2.9 | 19 | |
| Goose feces | 25.8 | 0.9 | 264 | |
| Swan feces | 0.1 | 1.7 | 1445 | |
| Bovung manure | 19.7 | 0.8 | 519 | |
| Fertilizers | Scott’s Grass Mix | 12.6 | 0.6 | 349 |
| Hollytone | 7.4 | 0.8 | 4000 | |
| 10-10-10 | 11.8 | 0.2 | 1310 | |
| Milorganite | −4.4 | 0.8 | 405 | |
| 5-10-5 | 4.9 | 0.2 | 2500 | |
| Septic | 9P | 2.0 | 0.5 | 250 |
| 59R | 0.1 | 0.4 | 1275 | |
| CSH | 2.11 | 0.4 | 105 | |
Disclaimer/Publisher’s Note: The statements, opinions and data contained in all publications are solely those of the individual author(s) and contributor(s) and not of MDPI and/or the editor(s). MDPI and/or the editor(s) disclaim responsibility for any injury to people or property resulting from any ideas, methods, instructions or products referred to in the content. |
© 2023 by the authors. Licensee MDPI, Basel, Switzerland. This article is an open access article distributed under the terms and conditions of the Creative Commons Attribution (CC BY) license (https://creativecommons.org/licenses/by/4.0/).
Share and Cite
Peritore, B.N.; Rasbury, E.T.; Wooton, K.M.; Wright, C.C.; Downs, D.M.; Iorga, A.; Letscher, S.L. Boron Isotopes in Fresh Surface Waters in a Temperate Coastal Setting. Hydrology 2023, 10, 186. https://doi.org/10.3390/hydrology10090186
Peritore BN, Rasbury ET, Wooton KM, Wright CC, Downs DM, Iorga A, Letscher SL. Boron Isotopes in Fresh Surface Waters in a Temperate Coastal Setting. Hydrology. 2023; 10(9):186. https://doi.org/10.3390/hydrology10090186
Chicago/Turabian StylePeritore, Brooke N., E. Troy Rasbury, Kathleen M. Wooton, Carrie C. Wright, Deanna M. Downs, Anastasia Iorga, and Shannon L. Letscher. 2023. "Boron Isotopes in Fresh Surface Waters in a Temperate Coastal Setting" Hydrology 10, no. 9: 186. https://doi.org/10.3390/hydrology10090186
APA StylePeritore, B. N., Rasbury, E. T., Wooton, K. M., Wright, C. C., Downs, D. M., Iorga, A., & Letscher, S. L. (2023). Boron Isotopes in Fresh Surface Waters in a Temperate Coastal Setting. Hydrology, 10(9), 186. https://doi.org/10.3390/hydrology10090186