Article

Characterization of HFE 7500 Refrigerant Suspensions Containing Oxide and Nitride Nanoparticles: Thermal, Rheological, and Electrokinetic Insights

Chemical and Biomolecular Engineering Program, Physics and Chemistry Department, Milwaukee School of Engineering, 1025 N Broadway, Milwaukee, WI 53202, USA
*
Author to whom correspondence should be addressed.
ChemEngineering 2025, 9(4), 65; https://doi.org/10.3390/chemengineering9040065
Submission received: 19 March 2025 / Revised: 14 May 2025 / Accepted: 3 June 2025 / Published: 24 June 2025

Abstract

Nanofluids—engineered suspensions of nanometer-sized particles—have attracted significant attention due to their reportedly enhanced thermal properties, making them promising candidates for advanced heat transfer applications. However, despite extensive studies, uncertainties remain regarding the magnitude and origin of these effects, limiting their practical implementation. To address this, we present a comprehensive study on nanofluid formulations based on the commercial refrigerant HFE-7500, incorporating surfactant-stabilized dispersions of several metal oxide and nitride nanoparticles. We measured key physicochemical properties, including zeta potential, particle size, viscosity, and thermal conductivity. Our results show that while the nanofluids exhibited high stability, their particle sizes in suspension were significantly larger than the primary nanoparticle sizes measured by TEM. Notably, alumina-based suspensions demonstrated the greatest enhancement, exhibiting approximately 10–15% increases in thermal conductivity as a function of volume percentage. These surpassed the 5–10% improvements observed with other metal oxides, an effect that may be linked to their comparatively larger particle sizes. However, the observed enhancements were lower than some previously reported values that claimed anomalously high thermal conductivity increases. Furthermore, steady shear viscosity increased with particle concentration, showing enhancements of 10–20%, which suggests a potential trade-off for practical implementation. Our findings refine the understanding of nanofluid behavior in refrigerants and establish a foundation for optimizing their performance in thermal management applications. However, viscosity increases must be carefully considered when designing next-generation nanofluids for real-world use.

1. Introduction

The great potential for improving transport performance has made nanofluids compelling candidates in heat and mass transfer applications compared to conventional fluids [1,2,3,4,5,6]. Nanorefrigerants, which consist of highly thermally conductive nano-sized solid particles suspended in refrigerants, represent a promising yet relatively unexplored subset of cooling technologies. As demand grows for more efficient, compact, and environmentally responsible cooling technologies, there is increasing interest in enhancing the thermophysical properties of existing refrigerants beyond their current capabilities.
Experimental studies on the fundamental properties of nanorefrigerants, including thermal conductivity, viscosity, and stability, are currently limited, while prior literature has reported anomalous enhancements in thermal conductivity with coolants like water and ethylene glycol systems [3,7,8]. Jiang et al. studied the thermal conductivity of directly dispersed nanomaterials into R113, finding a two-fold enhancement in the thermal conductivity of this refrigerant with altered aspect ratio of carbon nanotubes [9]. On the other hand, Jwo et al. reported up to a 5% enhancement in thermal conductivity with alumina nanoparticle loading in the lubricant of a R134a refrigeration system [10]. Recent studies have expanded the understanding of nanorefrigerants by investigating the influence of particle concentration and temperature on their thermal characteristics. For instance, Mahbubul et al. studied the Al2O3/R141b nanorefrigerant and found that increasing the volume fraction of nanoparticles and temperature significantly enhanced its thermal conductivity. The thermal conductivity was observed to be 1.626 times greater than the base fluid at 20 °C with a 2% volume fraction of nanoparticles. However, the viscosity also increased substantially, reaching up to 179 times higher than the base fluid at 5 °C with the same particle concentration. This highlights the need for optimal particle dispersion to balance thermal conductivity and viscosity for practical applications [11]. Moreover, mixed nanorefrigerants, such as those combining R290 and R600a with CuO nanoparticles, have shown improved thermophysical properties, including enhanced density and specific heat, which contribute to better overall system performance [12]. These findings highlight the potential of nanorefrigerants to significantly improve heat transfer efficiency in refrigeration systems while also presenting challenges in maintaining manageable flow properties that require rectification prior to wider implementation. Our research provides essential information on the fundamental properties of various nanorefrigerants, helping to resolve disparities in reported benefits.
In this paper, we present a comprehensive study on refrigerant suspensions of metal oxide and nitride nanoparticles using various bulk characterization techniques. We employed transmission electron microscopy to analyze the morphology, particle size distribution, and crystallinity of the nanoparticles. We systematically prepared nanoparticle suspensions, including TiO2, Al2O3, ZnO, CuO, and AlN, in our host refrigerant, HFE-7500 (3M™ Novec™ 7500 Engineered Fluid, Saint Paul, MN, USA), stabilized with Krytox 157-FSL (DuPont Chemicals, Deepwater, NJ, USA). We focused on low particle loadings (below 1 vol%) to minimize viscosity and enhance long-term stability. Although we may not achieve the extreme thermal conductivity enhancements observed at higher loadings, the practical utility of our formulations is significantly greater, as they can be directly integrated into existing refrigeration systems. Recognizing that suspension stability is closely related to the surface charge density of particles, which generates strong repulsive forces, we evaluated the colloidal stability and electrophoretic behavior of our suspensions. To do so, we began by analyzing zeta potential values and particle size using dynamic light scattering (DLS). Next, we examined the effects of particle type and concentration on the thermal conductivity of nanorefrigerants and assessed variations. To conclude our characterization study, we measured the steady shear viscosity of the suspensions to gain insight into their flow behaviors in cooling systems.

2. Materials and Methods

2.1. Preparation of Nanorefrigerants

Our host refrigerant, HFE-7500 (3MTM NovecTM 7500 Engineered Fluid, 2-trifluoromethyl-3-ethoxydodecafluorohexane distributed by 3M (I.D. No. 98-0212-2932-85, Saint Paul, MN, USA)) has a viscosity of 1.2 cp (Table 1) and a boiling point of 128 °C, ensuring that it remains liquid under ambient conditions. The manufacturer provides data on the refrigerant’s temperature dependence of thermal conductivity and viscosity. However, it is important to note that the conductivity data are derived from a single-point measurement using the transient hot wire method and extrapolated based on data from a chemically similar fluid [13]. The properties of the nanoparticles, dispersant, and refrigerant used in suspension preparation are summarized in Table 2. Our dispersant, Krytox 157-FSL (CAS #60164-51-4, DuPont Chemicals, Deepwater, NJ, USA), is a low-molecular-weight (~2500 g/mole), monofunctional carboxylic acid-terminated perfluoropolyether with a density of 1.9 g/cm3. Metal oxide and nitride nanoparticles in dry powder form were suspended in the refrigerant with 1 vol% Krytox 157-FSL in all suspensions. The volume concentration of nanoparticles was determined as follows [4]:
ϕ v = 1 ( ρ p ρ f ) ( 100 ϕ m ) + 1 × 100 ( % ) ,
where ρ p and ρ f are the densities of the particle and host fluid, respectively; and ϕ v and ϕ m are the suspension volume and weight percentages, respectively.
Nanoparticle suspensions were prepared at a final volume of 300 mL, followed by mixing for 5 h using a magnetic stirrer, another 5 h of agitation in an ultrasonic bath (Model 3510DTH, Branson Ultrasonics Corp., Danbury, CT, USA), and a final 30 min of agitation using a probe sonicator (Vibracell VCX 750, Sonics & Materials Inc., Newtown, CT, USA). The surfactant and refrigerant were mixed first (the most chemically miscible components), followed by the addition of the nanomaterials. Ice was periodically added to the ultrasonic bath to counteract the temperature increase during the sonication period. This protocol consistently yielded highly stable suspensions.

2.2. Dynamic Light Scattering (DLS) Measurements

Particle size distributions were characterized by DLS using a ZetaPALS instrument with a BI-9000AT correlator (Brookhaven Instruments Corp., Holtsville, NY, USA). Samples containing 0.25 vol% nanoparticles were diluted to a concentration of 0.02 vol%. During this process, surfactant (1 vol%) was also diluted by the same amount (~1/12). Time-averaged particle size distributions were collected over an analysis period of at least 5 min at room temperature. Six separate measurements were acquired for each freshly prepared solution. The wavelength of the incident laser beam (λ) was 660 nm, and the detector angle (θ) was 90°. The refractive index and dynamic viscosity of the refrigerant and the refractive index of the particle were entered into the system software as parameters (Table 1).
The autocorrelation functions were deconvoluted using the built-in non-negativity-constrained least squares-multiple pass (NNLS) algorithm to obtain particle size distribution.

2.3. Zeta Potential Measurements

Zeta potential measurements were performed using phase analysis light scattering with a ZetaPALS analyzer. The analyzer was equipped with a 35 mW red diode laser operating at 660 nm. Default settings (dielectric constant, refractive index, and viscosity) were adjusted according to the refrigerant properties given in Table 1. High voltage (50 mV) was applied during the measurements due to the low dielectric constant of the refrigerant. The Smoluchowski approximation was used for the calculations. The concentrations of nanoparticles were diluted to 0.02 vol% solution, except CuO and TiO2 (0.004 vol%). The surfactant concentration in samples was reduced to ~0.1 vol% during the dilution process. Before testing our solutions, a standard solution (10 wt%) of Ludox TM-50 (Cat. No. 420778, Sigma Aldrich, St. Louis, MO, USA), a colloidal silica suspension, was prepared to check the sensitivity of the electrode; its ionic strength was adjusted with 0.01 M KCl solution. The corresponding zeta potential values were within a good range and in agreement with the literature [14]. After confirming the reliability of the probe, samples containing nanoparticles were placed in an acrylic cuvette, and ten measurements, including thirty cycles, with three replicates were performed at 25 °C.

2.4. Transmission Electron Microscopy (TEM)

The morphology, particle size distribution, and crystallinity of the nanoparticles were determined by transmission electron microscopy (TEM). High-resolution TEM images of our samples of metal oxide and nitride nanoparticles were captured using a FEI Tecnai G2 F20ST (FEI, Hillsboro, OR, USA), equipped with a field emission gun at a working voltage of 200 kV. Dilute nanopowder suspensions were prepared with ethanol and ultrasonicated for approximately 5 min. Carbon film-coated square mesh copper grids (3 mm, 300 mesh, Pelco) were glow-discharged using a Pelco easiGlow (Ted Pella Inc., Redding, CA, USA). A small volume of sample was then dropped onto a holey carbon film-coated grid and allowed to dry by evaporation under ambient conditions overnight. The images were taken in high vacuum (10−5–10−6 bar). Electron diffraction patterns were analyzed to determine the crystal structure.

2.5. Thermal Conductivity Measurements

Thermal conductivity measurements were conducted using a handheld thermal property analyzer (Model KD2 Pro, Decagon Devices, Inc., Pullman, WA, USA). This device is widely and conveniently used for measuring the thermal conductivities of liquids, solids, and nanofluids [4,15,16,17,18,19]. It operates according to the transient hot wire method and is capable of measuring conductivities in the range from 0.02 to 2.00 W/mK with an accuracy of ±5% or 0.01 W/mK over a span of 0 to 50 °C. Thermal conductivity was measured by applying a parameter-corrected version of the transient temperature model of Carslaw and Jaeger for an infinite line heat source with constant heat output in a homogeneous, isotropic, and infinite medium [20]. The temperature response during heating can be defined as follows:
Δ T = T T 0 = q 4 π k Ei ( r 2 4 D t ) , 0 < t < t 1 ,
where q is the heat dissipated per unit length (W/m), k is the thermal conductivity (W/mK), r is the radial distance from the heat source (m), D is the thermal diffusivity (m2/s), t1 is the heating time (s), and Ei is the exponential integral. The temperature rise after turning off the heat source can be described as follows:
Δ T = T T 0 = q 4 π k [ Ei ( r 2 4 D t ) + Ei ( r 2 4 D ( t t 1 ) ) ] , t > t 1 .
Each 90 s measurement cycle included an initial 30 s temperature equilibration stage, followed by 30 s of heating and 30 s of cooling. The temperature versus time response during the heating and cooling periods was recorded at 1 s intervals, and the data were fit by applying Equations (2) and (3) to obtain the suspension thermal conductivity. The probe response was calibrated to account for finite length and diameter effects [4].
In the thermal conductivity measurements at specified temperatures, we applied a standard measurement protocol to obtain consistent results. All refrigerant suspensions were prepared in large quantities (300 mL) to permit sufficient fluid volume between the sensor and sidewall of the container (at least 1.5 cm in all directions). They were placed in glass jars with open-top polypropylene screw caps (250 mL, Cat. No. S121-0250, I-Chem, Rockwood, TN, USA). Evaporation during measurements was prevented by using special caps bonded with Teflon/silicone septa. Free convection was minimized by forming a hole in the center of the septum through which the thermal probe was inserted vertically into the suspension without touching the sidewalls of the jar. The minimum allowable read time (1 min) was used due to the relatively low viscosity of most refrigerant-based suspensions. Measurements were performed using a stainless-steel KS-1 probe (60 mm long, 1.3 mm diameter) to avoid excessive heating, which can introduce errors due to local free convection. The probe was calibrated using glycerin and water standards and reliably yielding results in good agreement with the literature [21]. Moreover, hydrofluoroether (HFE) fluid is a highly wetting liquid with low surface tension and contact angles on most surfaces [22]. No issues have been reported regarding the wetting of the KS-1 probe with any of the studied fluids. The details of the wire–liquid interface and its corresponding effect on the measured thermal conductivities are beyond our scope.
The sample temperature was controlled by fully immersing each jar in a circulating water bath (Lauda Model RE106, LAUDA-Brinkmann, Delran, NJ, USA) and allowing it to equilibrate at the measurement temperature (2 °C, 12 °C, and 22 °C) for at least 20 min. All measurements were performed on an optical table, and the water bath was switched off during data acquisition to eliminate vibrations. Adherence to this protocol enabled us to obtain highly reproducible thermal conductivity measurements of the refrigerant-based nanosuspensions. Measurement variability was greatly reduced by performing a complete series of experiments in one session. For example, a typical series of experiments included measurements on control samples of the pure refrigerant, refrigerant-surfactant mixture, as well as the dispersions of interest. All conductivity data reported here (Figure 1, Figure 2b, Figure 3b, Figure 4b, Figure 5b and Figure 6b) were therefore normalized by the pure refrigerant values acquired during the same measurement session to minimize systematic variations between experiments performed at different times. All measurements were replicated at least 3 times, with 20 min elapsing between successive measurements.

2.6. Viscosity Measurements

The steady shear viscosities of the refrigerant suspensions were measured over a wide range of shear rates using a Physica MCR 300 Modular Compact Rheometer (Anton Paar, Ashland, VA, USA). The measuring system geometry was a parallel plate setup (CP 50-1, 50 mm diameter, 0.05 mm gap, 0.987 angle, ~0.5 mL sample volume) [4]. The instrument was programmed for constant temperature and equilibration, followed by a two-step shear ramp in which the shear rate was increased from 10 to 500 s−1 and immediately decreased from 500 to 10 s−1. A solvent trap was used to minimize the evaporation of suspensions during measurements. All rheological tests were performed in triplicate at specified temperatures (2 °C, 12 °C, and 22 °C). The temperature was controlled using a circulating water bath (Lauda Model RE106, LAUDA-Brinkmann, LP, Delran, NJ, USA).

3. Results and Discussion

3.1. Surfactant-Mediated Particle Dispersion Approach

Our suspensions of nanoparticles were prepared at concentrations of 0.25, 0.5, and 1 vol% using the fluorocarbon stabilizer Krytox 157-FSL (DuPont Chemicals). We selected the hydrofluoroether (HFE) refrigerant (3MTM NovecTM 7500 Engineered Fluid) as the host fluid for our studies due to its wide range of applications, from microelectronics to chemical process operations, and its liquid form at room temperature [13]. Krytox 157-FSL, our chosen surfactant, is a perfluoropolyether with a carboxylic acid group located on the terminal fluoromethylene group of poly(hexafluoropropylene oxide). HFE-7500 dissolves Krytox 157-FSL easily due to the chemical compatibility between its monofunctional carboxylic acid-terminated perfluoropolyether moiety and the fluorinated refrigerant (Figure S1 in Supporting Information). Perfluoropolyethers (PFPEs) are soluble in Freon or other fluorous compounds. This results in similar low-energy intermolecular interactions and cohesive energy densities. The chain flexibility provided by the ether oxygen in the surfactant further enhances their solubility [23,24].
The stabilization mechanism in our nanorefrigerants was expected to be a combination of electrostatic and steric stabilization. The electrostatic stability is maintained through the surface attachment of the surfactant via its functional group, with its fluoroalkylether tail presented to the surrounding refrigerant. Additionally, the steric layer formed by surface-adsorbed molecules with long chains enhances the stabilization process. Our stabilization approach can be broadly applied to disperse other nanomaterials in refrigerant host fluids.

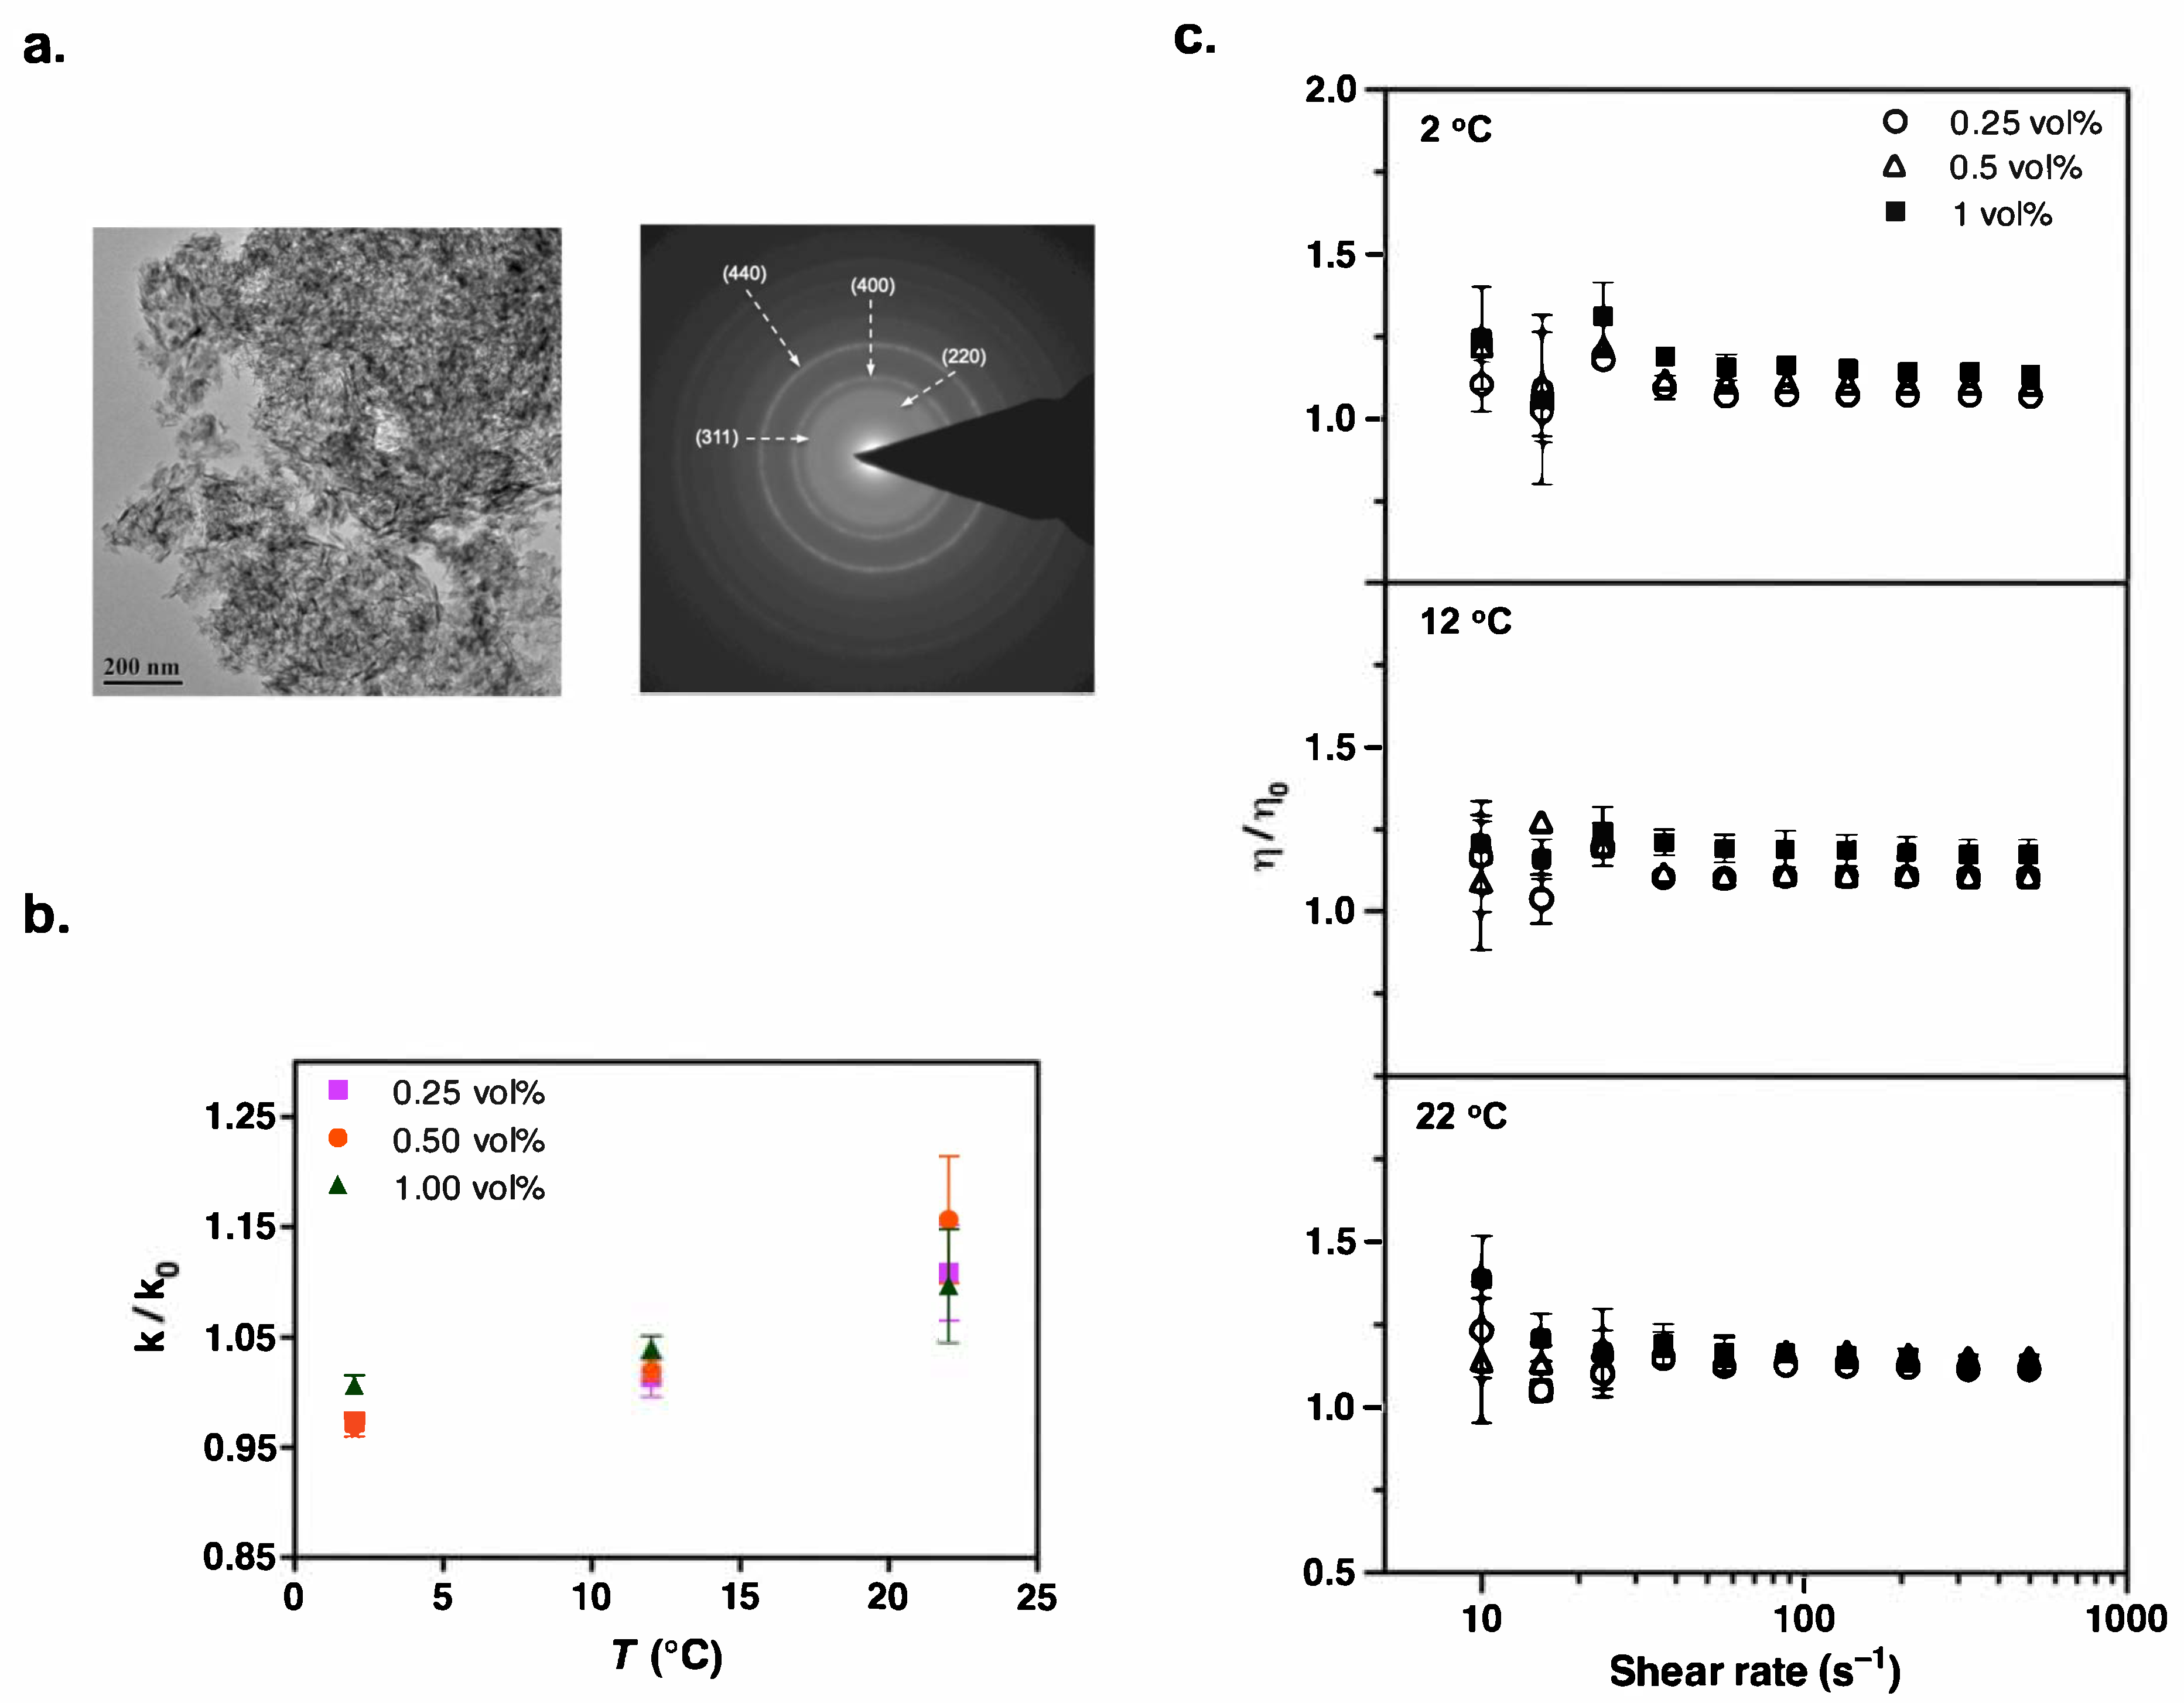
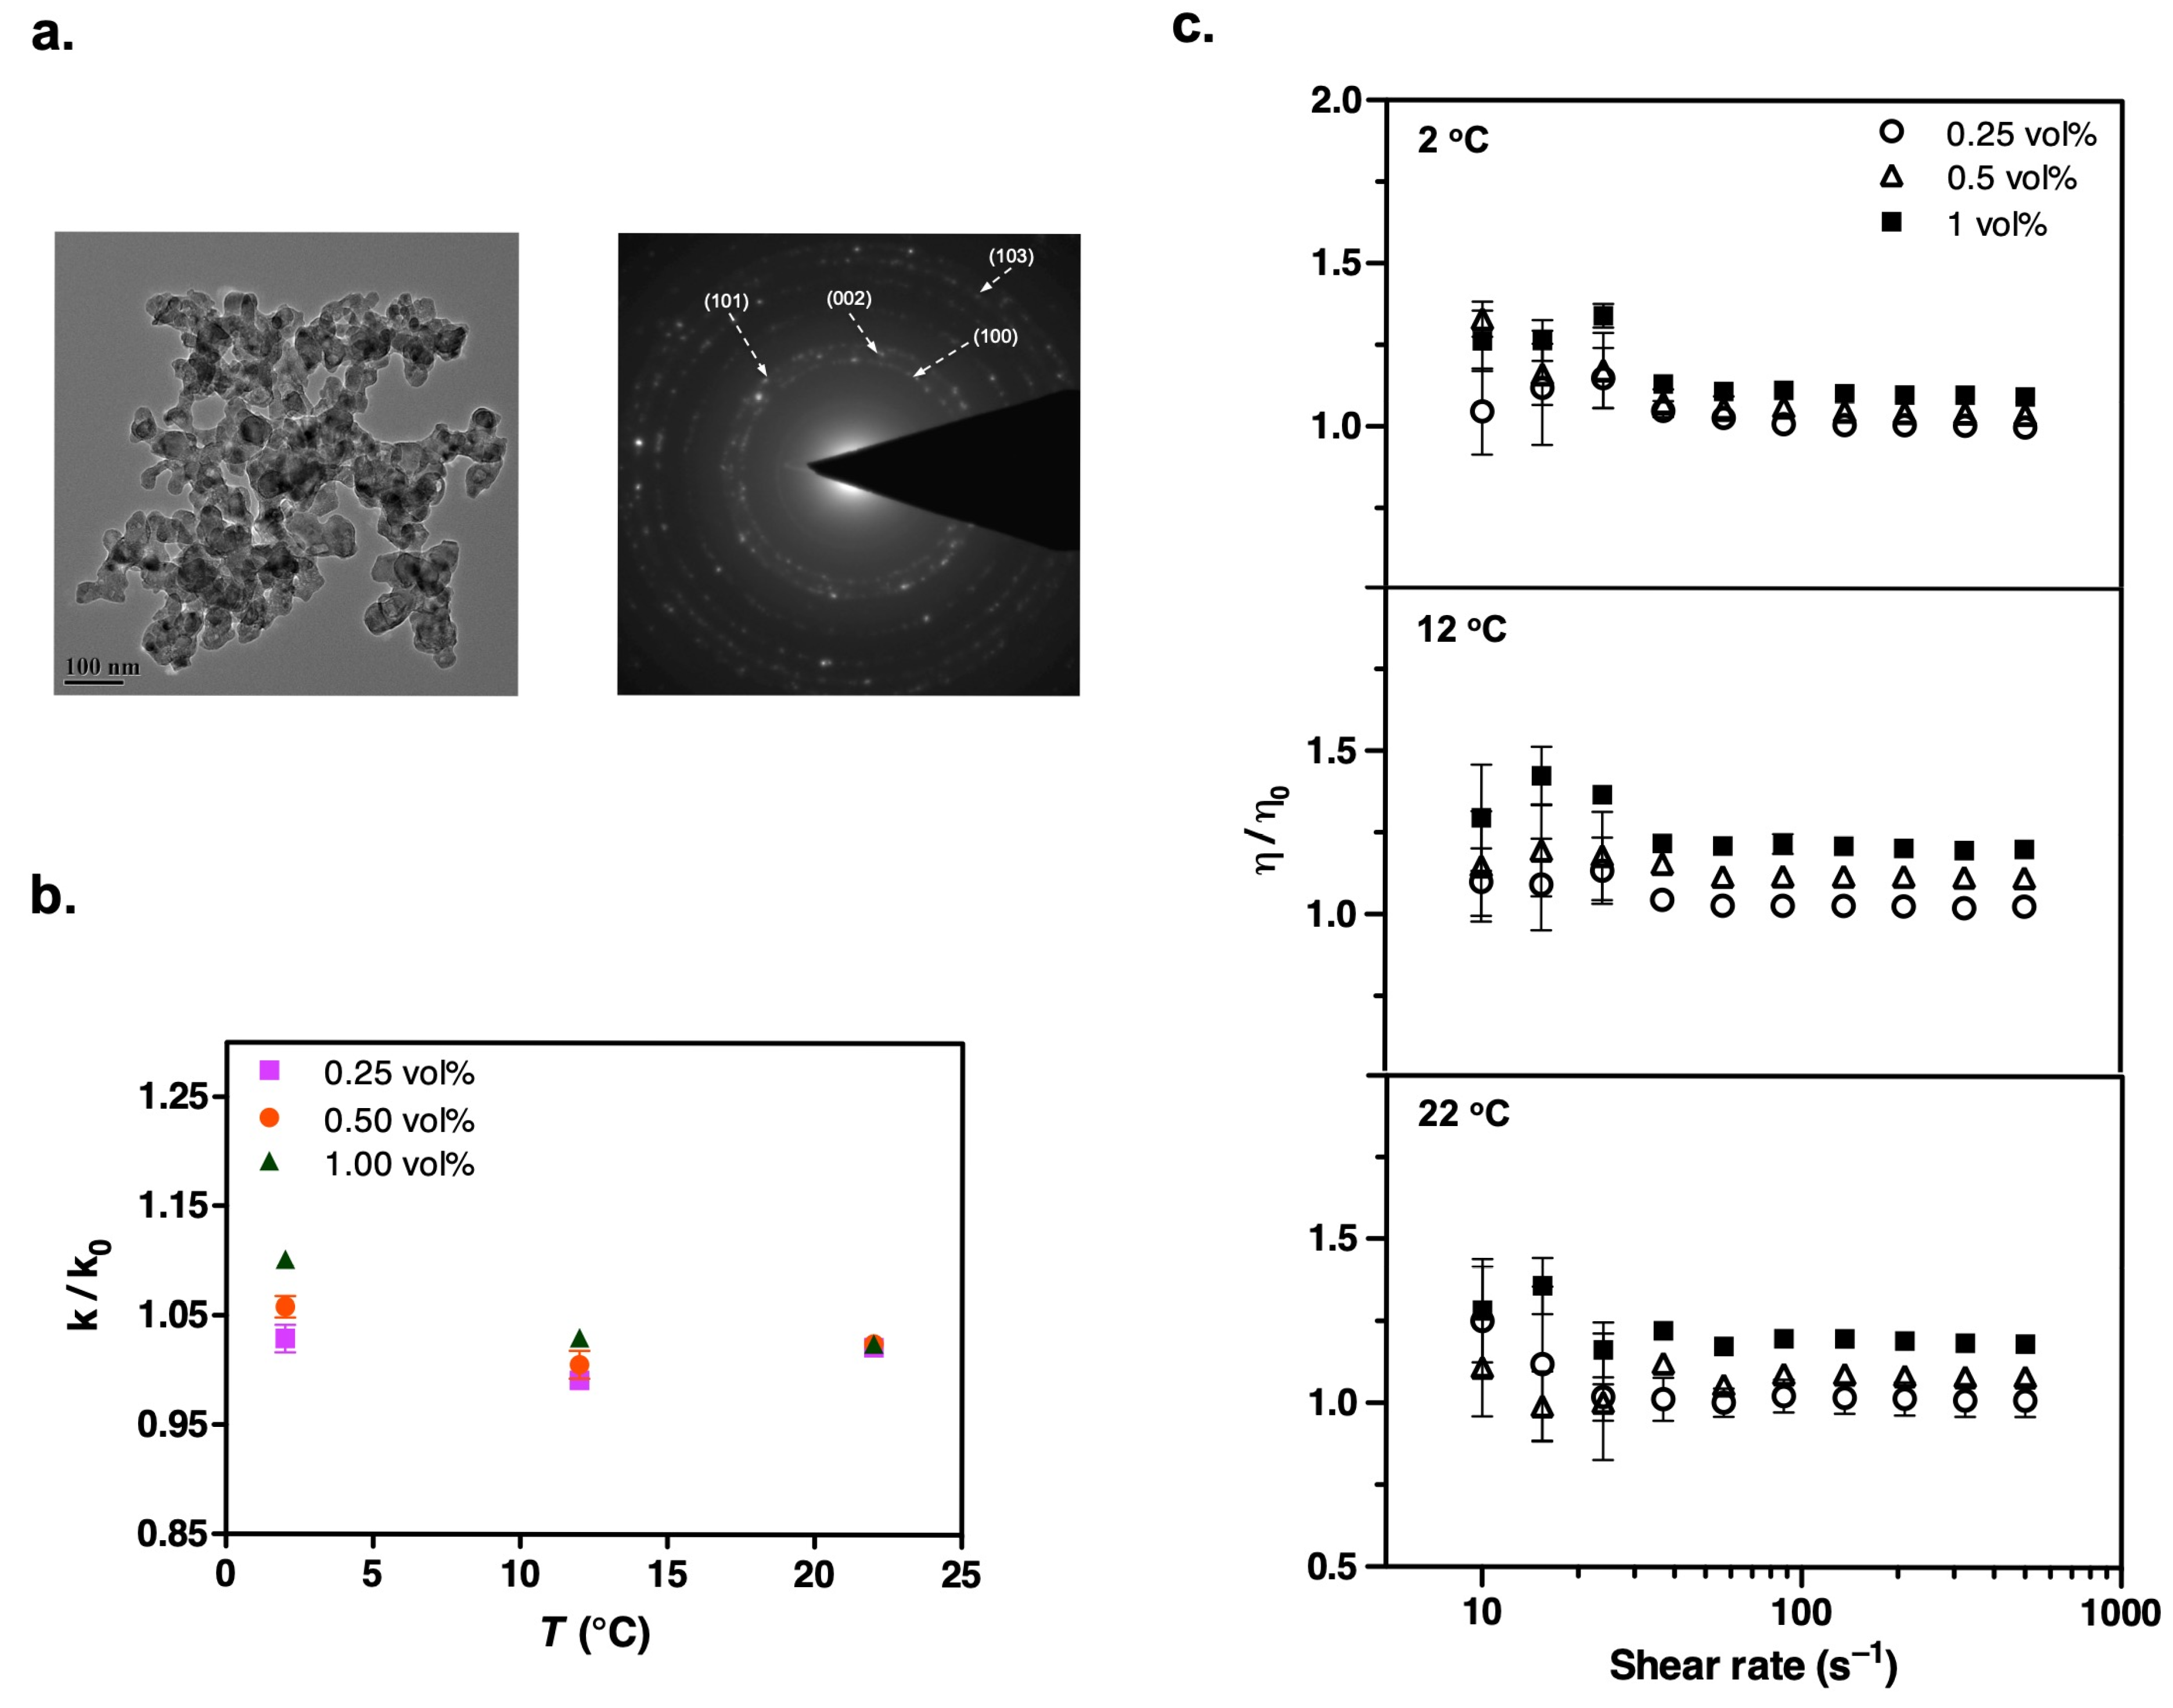
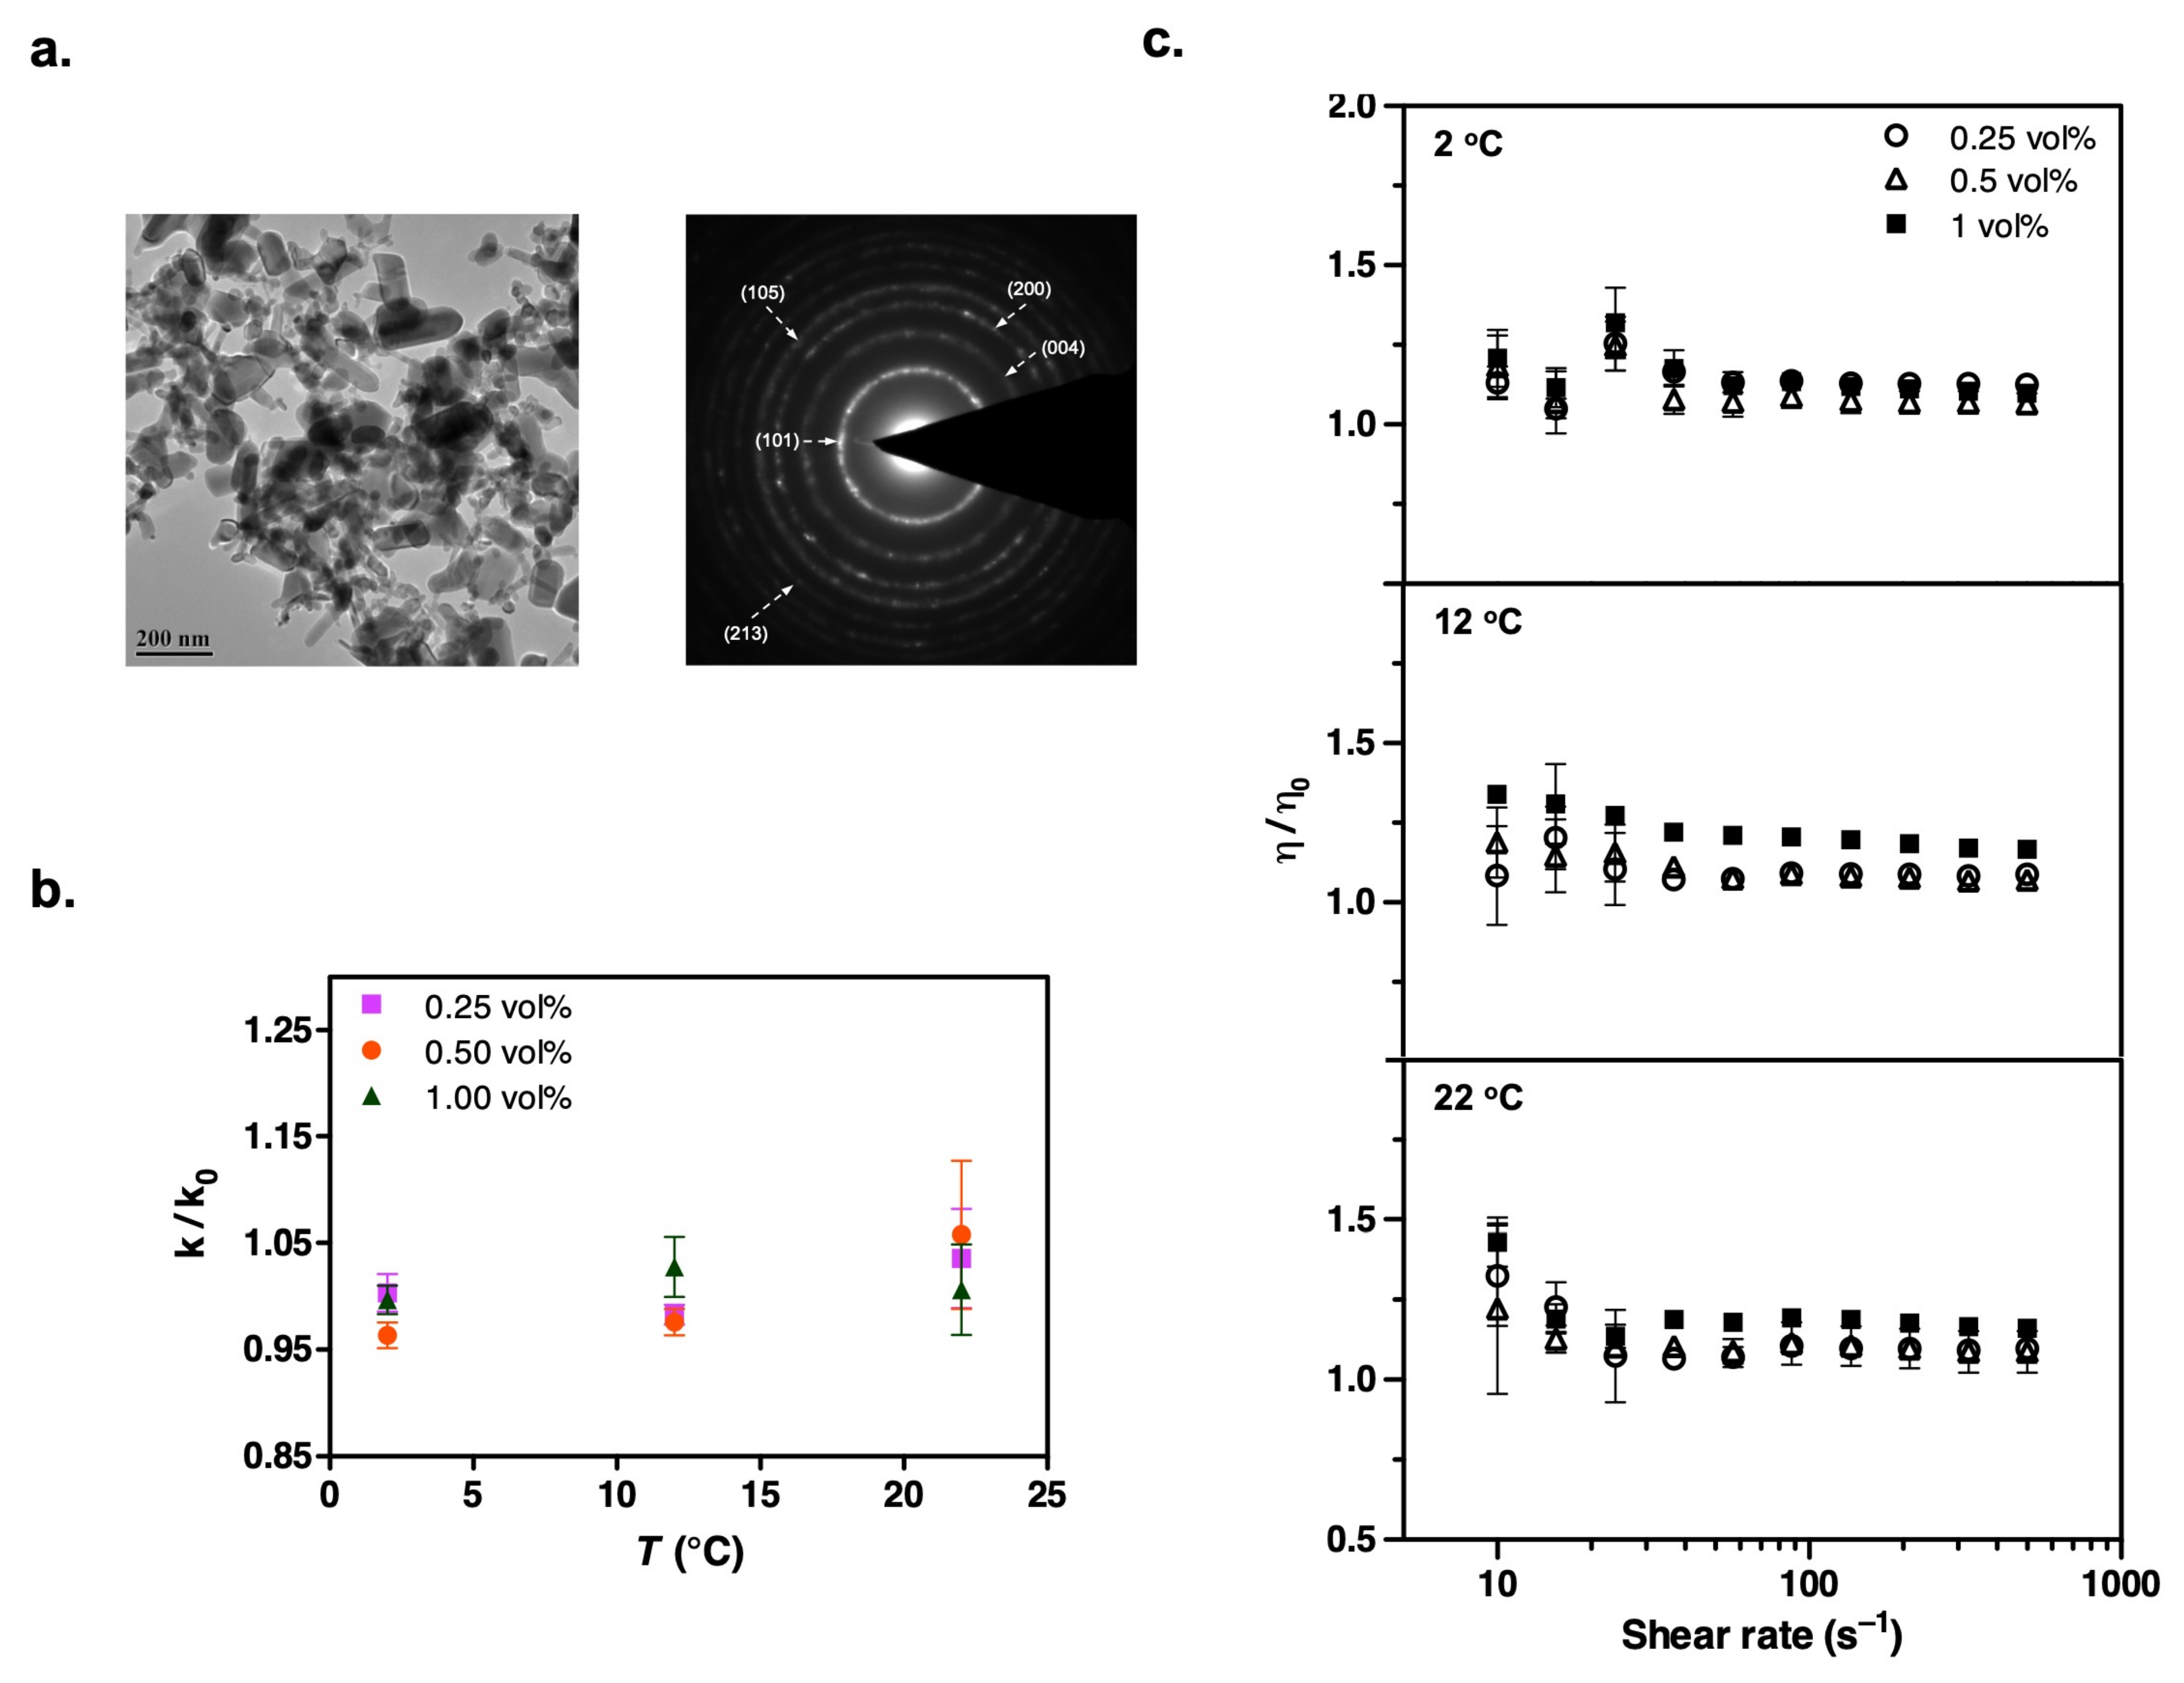
3.2. Particle Characterization by Transmission Electron Microscopy (TEM)

We characterized our dry nanoparticles, obtained from commercial vendors, using transmission electron microscopy (TEM). Figure 2a, Figure 3a, Figure 4a, Figure 5a and Figure 6a present the TEM images and diffraction patterns (DPs) of each nanomaterial. These micrographs reveal that the nanoparticles are highly agglomerated in their dry form. For example, Al2O3 nanoparticles have a disk-shaped morphology with characteristic particle sizes in the range of 5–50 nm. The morphology, particle size range, and corresponding crystal structures of all other nanoparticles are detailed in Table 2.
Table 2. Summary of materials used in nanorefrigerant preparation.
MaterialVendorDensity (g/cm3)
@ 25 °C
Thermal Conductivity (W/m·K)
@ 25 °C
Particle Size (nm) and
Purity
[from
Vendor]
Particle Size (nm)
[Measured]
MorphologyCrystal
Structure
HFE-7500Novec, 3M Corp. Saint Paul, MN1.6140.065 [13]
Krytox
157-FSL
Krytox Performance Lubricants
(CAS #60164-51-4),
DuPont Chemicals,
Deepwater, NJ, USA
1.9
Al2O3Sigma-Aldrich
(Cat. No. 544833),
St. Louis, MO, USA
4~33 [25]<505–50Diskγ (Gamma)
AlNSigma-Aldrich
(Cat. No. 593044),
St. Louis, MO, USA
3.26~319 [26]<10050–100Spherical and irregularWurtizite
ZnOSigma-Aldrich
(Cat. No. 544906),
St. Louis, MO, USA
5.6154 [27]<100
(~80% Zn basis)
50–200Rod-likeWurtizite
CuONanoArc, Alfa Aesar (Cat. No. 44928),
Ward Hill, MA, USA
~6.476.5 [28]23–3725–50Spherical and irregularMonoclinic
TiO2Sigma-Aldrich
(Cat. No.637254),
St. Louis, MO, USA
3.98.37 [29]<25
(99.7% trace metals basis)
<25SphericalAnatase
The selected-area diffraction pattern of our Al2O3 nanoparticles had labeled spots corresponding to the (311), (440), (220), and (400) planes. These planes are characteristic of the gamma phase of alumina (γ-Al2O3), further supporting the information provided by the vendor website.

3.3. Particle Size Measurements by Dynamic Light Scattering (DLS)

To connect these observations with the structure in the fluid samples, we measured the sizes of the particles in our suspensions using the dynamic light scattering (DLS) technique. Our results revealed polydisperse systems, with alumina exhibiting the largest particle size at 390 nm (Table 3).
The apparent increase in the diameter of particles, as determined by DLS compared to TEM results and the primary particle size data provided by the manufacturers, reflected the agglomeration of particles despite the application of ultrasonication and vigorous stirring. Moreover, the presence of the polymeric stabilizer around the particles may have increased the hydrodynamic size of the nanoparticles.

3.4. Stability Assessment via Zeta Potential

We employed zeta potential measurements to study the stability characteristics of our refrigerant suspensions. A high surface charge density produces a strong repulsive force, which can help formulate well-dispersed suspensions. To assess the surface charge of the selected nanoparticles, we used a ZetaPALS analyzer (Brookhaven Instruments Corp.). This instrument calculates the zeta potential from measured electrophoretic mobility using the Smoluchowski or Huckel equation.
The measurements revealed that the nanorefrigerant prepared from ZnO had the highest zeta potential value and therefore displayed the best stability. The absolute values of the zeta potentials could be arranged in the order of ZnO > CuO~AlN > Al2O3~TiO2. All zeta potential values of our suspensions were less than −35 mV, suggesting good dispersion capabilities (Table 3). The interaction of nanoparticle surfaces with the polar head groups of Krytox 157-FSL may have caused the formation of negatively charged particle complexes. The electrostatic repulsion force in such a system would be sufficient to prevent attraction among the particles. However, the relatively low zeta potential of alumina and titania suspensions did not lead to a particle agglomeration problem due to existing steric effects.

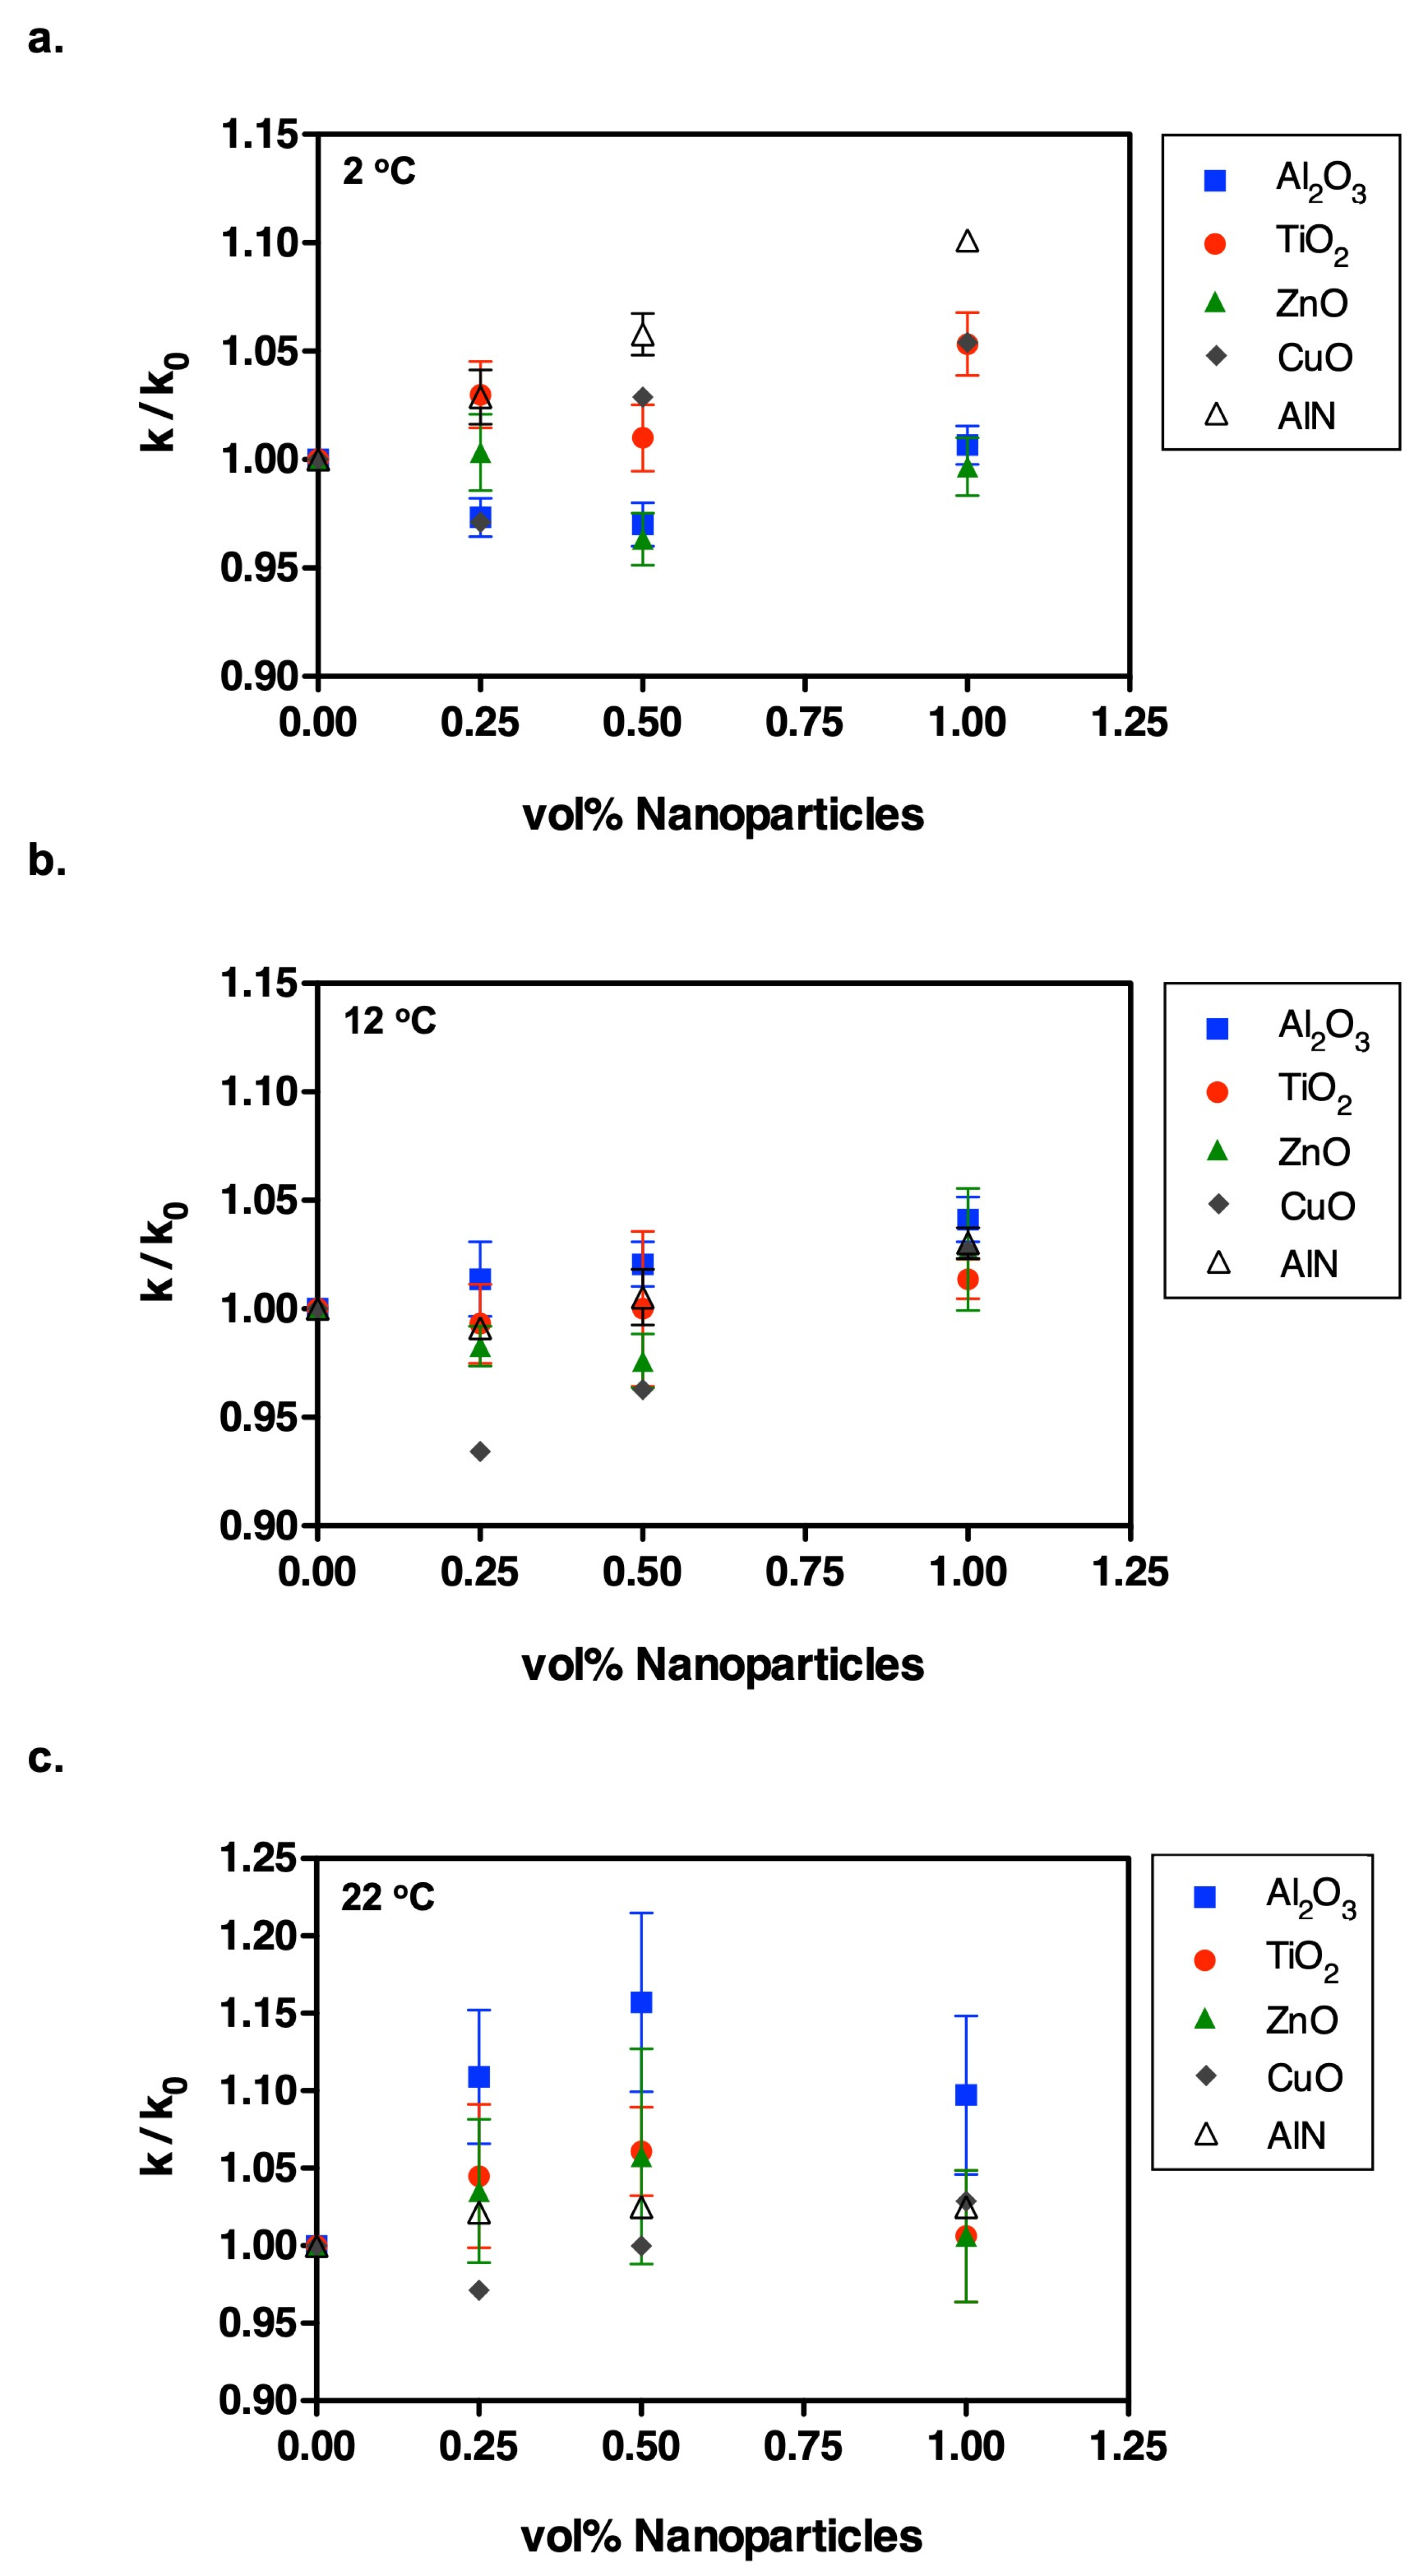
3.5. Thermal Conductivity Measurements by Transient Hot Wire

We performed a series of transient hot wire measurements on the suspensions containing TiO2, Al2O3, ZnO, CuO, and AlN nanoparticles at temperatures of 2 °C, 12 °C, and 22 °C to assess the influence of the nanoparticles on the thermal conductivity properties of HFE-7500. Figure 1 compares the thermal conductivity values of all nanoparticles with respect to particle concentration at each temperature. Moreover, Figure 2b, Figure 3b, Figure 4b, Figure 5b and Figure 6b provide thermal conductivity data specific to the corresponding nanoparticle as a function of temperature.
All of these graphs indicated that the conductivity changes in these refrigerant suspensions were particle-specific and temperature-dependent. For example, Al2O3, AlN, and ZnO nanoparticles appreciably altered the conductivity. However, minimal thermal conductivity enhancements were observed in TiO2- and CuO-based refrigerant suspensions, even though CuO has the highest bulk thermal conductivity after AlN [28]. According to our dynamic light scattering (DLS) measurements, Al2O3 formed the largest agglomerates in suspension, approximately 390 nm (see Table 3), while also delivering the highest thermal conductivity enhancement (k/k0 ≈ 1.1 at 22 °C). This correlation suggested that particle (or agglomerate) size may influence heat transport; similar size-dependent trends have been reported for oxide nanofluids in other base fluids [30]. As particle size increases, the effect of Brownian motion is expected to decrease, leading to severe clustering of nanoparticles in the associated samples, which would be the responsible mechanism for enhanced conductivity.
Moreover, the TEM results in Table 2 demonstrated that the nanoparticles used in the refrigerant suspensions had diverse particle shapes, with the potential to influence the results. There are previous studies that investigated the effects of particle shape on thermal conductivity. Maheswary et al. examined the thermal conductivity of water-based nanofluids containing cubic, rod, and spherical nanoparticles (CuO, MgO, TiO2, ZrO2, Al2O3) [31]. Their findings indicated that cubic-shaped nanoparticles enhanced thermal conductivity more effectively than spherical and rod-shaped nanoparticles. Mursheed et al. reported a greater enhancement in thermal conductivity with TiO2 nanoparticles (rod-shape) having a high aspect ratio compared to spherical ones [32]. Timofeeva et al. studied the thermal conductivity enhancement performance of alumina suspensions using nanoparticles in the shapes of platelets, blades, cylinders, and bricks [33]. Their findings were compared with the predictions of the Hamilton–Crosser model, revealing that particle shape significantly influences thermal conductivity enhancement. A recent study performed by Vallejo et al. found that the thermal conductivity of nanofluids is significantly influenced by the crystal structure of nanoparticles [34]. Nanofluids with β-SiC nanoparticles exhibited the highest increase in thermal conductivity, showing an enhancement of up to 12%, which was attributed to its simpler cubic crystal structure than α-SiC, which is hexagonal. Considering these previous studies, the size, shape, or crystallinity of nanoparticles can also influence the thermal performance of nanorefrigerants, but definitive conclusions are challenging to draw with our currently available data due to the absence of materials and data for a single type of particle across various sizes, shapes, and crystallinity levels.
As previously mentioned, some conductivity enhancements were temperature-dependent and observed at low temperature (2 °C) with the addition of AlN and CuO, which are particles with high bulk thermal conductivities. Conversely, only Al2O3 and ZnO suspensions exhibited significantly enhanced thermal conductivity at room temperature, showing an increase of approximately 10–15%. The effect of surfactant on the measurements was minimal (less than 1%), as detailed in Table S1 in the Supporting Information. We summarize our results in Table 4 and compare them with previous related findings involving the same type of nanoparticle suspensions.
Although there are no comparable data in the literature regarding nanoparticle–refrigerant suspension systems, our observations align with some of the conductivity enhancements observed in aqueous suspensions. Given the low thermal conductivity of the base fluid (HFE-7500), the thermal conductivity ratio was expected to be higher than in aqueous suspensions, consistent with Maxwell model predictions [41].
Our experimental thermal conductivity data exceeded the predictions of existing theoretical models for solid–liquid systems. Maxwell’s equation [42], which considers only the volume fraction of particles, and the Hamilton and Crosser model [43], which includes an empirical shape factor, both underestimated the enhancements observed in our experiments. The Koo and Kleinstreuer model [44,45], which accounts for the physical properties of components, predicted less than a 5% enhancement (Table 5). The empirical expression proposed by Li and Peterson even yielded values less than 1 for keff/kf [46]. The model proposed by Nair et al. for R718-based nanorefrigerants, derived from analyzing several existing models combined with experimental data, showed up to a 29% increase in thermal conductivity [47]. Finally, the water-based model proposed by Kundan et al., based on experimental trials, predicted 1–7% conductivity enhancements [48].
Therefore, the predictions of these models were found to be approximate estimations of the thermal conductivity enhancements in TiO2 and CuO suspensions, but they did not account for the higher conductivities observed with ZnO, Al2O3, and AlN nanoparticles. This highlights the need for more accurate theoretical models to predict the anomalous thermal conductivities of nanorefrigerants. A more comprehensive model that incorporates the combined effects of various mechanisms could better align with experimental results.

3.6. Rheological Behavior of Refrigerant-Based Nanoparticle Suspensions

After observing changes in thermal conductivity with the addition of nanoparticles, we measured the steady shear viscosities of the suspensions over shear rates ranging from 500 to 10 s−1. Despite its polymeric chemical structure, the addition of surfactant did not significantly increase the refrigerant viscosity (Table S2 in Supporting Information). We focused on low percentage loadings of nanoparticles in the refrigerant to avoid excessive viscosity enhancement, which could adversely affect fluid properties and hinder practical applications [49,50,51]. Our results showed that the relative viscosity of all the nanorefrigerants, defined as the ratio of the nanofluid viscosity (μ) to the viscosity of the particle-free pure refrigerant (HFE-7500), gradually increased with the volume fraction of nanoparticles (Figure 2c, Figure 3c, Figure 4c, Figure 5c and Figure 6c). This increasing trend was most evident at high shear rates. The fluctuating viscosity values at low shear rates might have been due to the strengthened interparticle interactions at higher concentrations. Interestingly, we observed similar behavior at low shear rates for pure refrigerant as well. Therefore, we believe that these effects are diminished when ratios are considered, but there could still be an unavoidable impact on the measurements.
Moreover, the suspensions exhibited similar viscosity behavior as a function of temperature, but we did not observe any decreasing trend in viscosity values at elevated temperatures. The shear thinning behavior of nanorefrigerants became more pronounced with particle loading at high temperatures. The non-Newtonian characteristics of nanofluids containing Al2O3, TiO2, AlN, ZnO, and CuO have been previously reported when nanoparticle concentrations exceeded 1 vol% [8,37,52,53,54]. We could not isolate the effect of particle shape on the viscosity of nanofluids from other factors, although elongated particles like platelets and cylinders have been reported to have higher viscosity values at the same volume fractions [33]. For example, ZnO with a rod-like shape did not show significant differences in viscosity behavior. Although there are no available literature data on nanorefrigerants for direct comparison of rheological behaviors, we compiled a table from previous research results obtained with these nanoparticles (Table 6).
It was also found that the magnitude of the viscosity enhancements was significantly higher than the predictions by the Einstein [58], Brinkman [59], and Batchelor [60] models since these models are formulated for dilute suspension systems with uniform particle size and shape (Table 7).
The relative viscosity values estimated from the modification of the Krieger and Dougherty model, developed by Chen et al. [51], which accounts for aggregates and particle size, aligned with our experimental values if the related parameters were adjusted for each nanoparticle. The models developed by Maiga et al., Rea et al., and Lundgren accurately predicted the viscosity for AlN but were less accurate for other mixtures [61,62,63].

4. Conclusions

Our study provides a systematic analysis of the physical and thermal properties of nanofluids containing nanoparticles dispersed in a commercial refrigerant host fluid. We hypothesize that the electrosteric stabilization mechanism present in colloidal systems could enable the formation of well-dispersed nanorefrigerants. All of the conducted measurements were instrumental in assessing the potential for nanorefrigerants prepared from commercially available constituents to function as advanced heat transfer fluids. Our findings, obtained using an accessible standardized experimental methodology, indicate that the thermal conductivity values of nanoparticle suspensions depend on the particle type, concentration, and temperature of the base fluid. This unified approach can be readily adopted in any research lab and may help to improve reproducibility, allowing for more meaningful comparisons among data in the published literature. While the alumina suspension—with the largest hydrodynamic diameter—demonstrated the greatest increase in thermal conductivity, our current data does not isolate the effects of particle size. Further research is recommended to vary particle size systematically within a single composition to establish whether the observed correlation is general. The steady shear viscosity measurements also showed significant enhancements due to the presence of particles in the system, especially at low shear rates. This perceived increase in viscosity may limit the potential applications of these nanorefrigerants in related heat transfer systems.

Supplementary Materials

The following supporting information can be downloaded at: https://www.mdpi.com/article/10.3390/chemengineering9040065/s1, Table S1. Thermal conductivity variations induced by surfactant (Krytox 157-FSL) addition across a temperature range. The ratio values represent average results obtained from the full set of experimental trials [64]. Table S2. Steady-shear viscosity variation of the refrigerant (HFE 7500) induced by surfactant (Krytox 157-FSL) addition across a temperature range. Viscosity ratio data are presented as a function of shear rate, with each point representing the average of 5–10 experimental replicates per temperature [64]. Table S3. Particle sizes measured using the dynamic light scattering (DLS) technique [64]. Table S4. Zeta potential measurements of the nanoparticle suspensions [64]. Figure S1. Chemical structures of (a) HFE 7500 and (b) Krytox 157 FSL (n~14-17). (c) Stabilization process of nanoparticles [64].

Author Contributions

Conceptualization, S.O.; Methodology, S.O.; Validation, S.O.; Formal analysis, S.O. and K.S.; Investigation, S.O.; Data curation, S.O.; Writing—original draft, S.O. and K.S.; Writing—review & editing, S.O. and K.S.; Visualization, S.O. and K.S. All authors have read and agreed to the published version of the manuscript.

Funding

This research received no external funding.

Data Availability Statement

The data that support the findings of this study are available from the corresponding author upon reasonable request. This paper is based on Chapter 7 of the first author’s PhD dissertation [64].

Acknowledgments

S.O. gratefully acknowledges the invaluable supervision, support, and guidance from Victor Ugaz (Artie McFerrin Department of Chemical Engineering, Texas A&M University).

Conflicts of Interest

The authors declare no conflict of interest.

References

  1. Eastman, J.A.; Choi, S.U.S.; Li, S.; Yu, W.; Thompson, L.J. Anomalously increased effective thermal conductivities of ethylene glycol-based nanofluids containing copper nanoparticles. Appl. Phys. Lett. 2001, 78, 718–720. [Google Scholar] [CrossRef]
  2. Jang, S.P.; Choi, S.U.S. Cooling performance of a microchannel heat sink with nanofluids. Appl. Therm. Eng. 2006, 26, 2457–2463. [Google Scholar] [CrossRef]
  3. Das, S.K.; Putra, N.; Roetzel, W. Pool boiling characteristics of nano-fluids. Int. J. Heat Mass Transf. 2003, 46, 851–862. [Google Scholar] [CrossRef]
  4. Ozturk, S.; Hassan, Y.A.; Ugaz, V.M. Graphene-enhanced nanorefrigerants. Nanoscale 2013, 5, 541–547. [Google Scholar] [CrossRef] [PubMed]
  5. Ozturk, S.; Hassan, Y.A.; Ugaz, V.M. A simple microfluidic probe of nanoparticle suspension stability. Lab A Chip 2012, 12, 3467–3473. [Google Scholar] [CrossRef] [PubMed]
  6. Ozturk, S.; Hassan, Y.A.; Ugaz, V.M. Interfacial Complexation Explains Anomalous Diffusion in Nanofluids. Nano Lett. 2010, 10, 665–671. [Google Scholar] [CrossRef]
  7. Murshed, S.M.S.; Leong, K.C.; Yang, C. Thermal conductivity of nanoparticle suspensions (nanofluids). In Proceedings of the 2006 IEEE Conference on Emerging Technologies—Nanoelectronics, Singapore, 10–13 January 2006; pp. 155–158. [Google Scholar]
  8. Yu, W.; Xie, H.Q.; Chen, L.F.; Li, Y. Investigation of thermal conductivity and viscosity of ethylene glycol based ZnO nanofluid. Thermochim. Acta 2009, 491, 92–96. [Google Scholar] [CrossRef]
  9. Jiang, W.; Ding, G.; Peng, H. Measurement and model on thermal conductivities of carbon nanotube nanorefrigerants. Int. J. Therm. Sci. 2009, 48, 1108–1115. [Google Scholar] [CrossRef]
  10. Jwo, C.S.; Jeng, L.Y.; Chang, H.; Teng, T.P. Experimental Study on Thermal Conductivity of Lubricant Containing Nanoparticles. Rev. Adv. Mater. Sci 2008, 18, 660–666. [Google Scholar]
  11. Mahbubul, I.M.; Saidur, R.; Amalina, M.A. Influence of particle concentration and temperature on thermal conductivity and viscosity of Al2O3/R141b nanorefrigerant. Int. Commun. Heat Mass Transf. 2013, 43, 100–104. [Google Scholar] [CrossRef]
  12. Jaffri, A.J.; Dondapati, R.S.; Bhat, M.W.; Vyas, G. Investigation on Thermo-Physical Properties of Mixed Nano-Refrigerant with CuO based nanoparticles. Mater. Today Proc. 2018, 5 Pt 2, 27795–27800. [Google Scholar] [CrossRef]
  13. Division, E.M.M. (Ed.) 3M Novec 7500 Engineered Fluid; 3M: St Paul, MN, USA, 2010. [Google Scholar]
  14. Tantra, R.; Schulze, P.; Quincey, P. Effect of nanoparticle concentration on zeta-potential measurement results and reproducibility. Particuology 2010, 8, 279–285. [Google Scholar] [CrossRef]
  15. Buongiorno, J.; Venerus, D.C.; Prabhat, N.; McKrell, T.; Townsend, J.; Christianson, R.; Tolmachev, Y.V.; Keblinski, P.; Hu, L.-w.; Alvarado, J.L.; et al. A benchmark study on the thermal conductivity of nanofluids. J. Appl. Phys. 2009, 106, 094312. [Google Scholar] [CrossRef]
  16. Ding, Y.; Alias, H.; Wen, D.; Williams, R.A. Heat transfer of aqueous suspensions of carbon nanotubes (CNT nanofluids). Int. J. Heat Mass Transf. 2006, 49, 240–250. [Google Scholar] [CrossRef]
  17. Tang, A.-M.; Cui, Y.-J.; Le, T.-T. A study on the thermal conductivity of compacted bentonites. Appl. Clay Sci. 2008, 41, 181–189. [Google Scholar] [CrossRef]
  18. Ge, R.; Hardacre, C.; Nancarrow, P.; Rooney, D.W. Thermal Conductivities of Ionic Liquids over the Temperature Range from 293 K to 353 K. J. Chem. Eng. Data 2007, 52, 1819–1823. [Google Scholar] [CrossRef]
  19. Taha-Tijerina, J.; Narayanan, T.N.; Gao, G.; Rohde, M.; Tsentalovich, D.A.; Pasquali, M.; Ajayan, P.M. Electrically Insulating Thermal Nano-Oils Using 2D Fillers. ACS Nano 2012, 6, 1214–1220. [Google Scholar] [CrossRef]
  20. Carslaw, H.S.; Jaeger, J.C. Conduction of Heat in Solids, 2nd ed.; Clarendon Press, Oxford: London, UK, 1959. [Google Scholar]
  21. Vargaftik, N.B.; Filippov, L.P.; Tarzimanov, A.A.; Totskii, E.E. Handbook of Thermal Conductivity of Liquids and Gases; CRC Press: Boca Raton, FL, USA, 1994. [Google Scholar]
  22. Tuma, P.E. Using segregated HFEs as heat transfer fluids. Chem. Process. 2001, 64, 47–50. [Google Scholar]
  23. Doan, V.; Köppe, R.; Kasai, P.H. Dimerization of Carboxylic Acids and Salts:  An IR Study in Perfluoropolyether Media. J. Am. Chem. Soc. 1997, 119, 9810–9815. [Google Scholar] [CrossRef]
  24. Yang, Y. Fluorous Membrane-Based Separations and Reactions; University of Pittsburgh: Pittsburgh, PA, USA, 2011. [Google Scholar]
  25. Munro, M. Evaluated Material Properties for a Sintered alpha Alumina. J. Am. Ceram. Soc. 1997, 80, 1919–1928. [Google Scholar] [CrossRef]
  26. Slack, R.; Glen, A.; Vandersande, J. The intrinsic thermal conductivity of AIN* 1. J. Phys. Chem. Solids 1987, 48, 641–647. [Google Scholar] [CrossRef]
  27. Slack, G. Thermal Conductivity of II-VI Compounds and Phonon Scattering by Fe^{2+} Impurities. Phys. Rev. B 1972, 6, 3791–3800. [Google Scholar] [CrossRef]
  28. Hwang, Y.; Lee, J.K.; Lee, C.H.; Jung, Y.M.; Cheong, S.I.; Lee, C.G.; Ku, B.C.; Jang, S.P. Stability and thermal conductivity characteristics of nanofluids. Thermochim. Acta 2007, 455, 70–74. [Google Scholar] [CrossRef]
  29. Kim, S.H.; Choi, S.R.; Kim, D. Thermal Conductivity of Metal-Oxide Nanofluids: Particle Size Dependence and Effect of Laser Irradiation. J. Heat Transf. 2007, 129, 298–307. [Google Scholar] [CrossRef]
  30. Xie, H.Q.; Wang, J.C.; Xi, T.G.; Liu, Y.; Ai, F.; Wu, Q.R. Thermal conductivity enhancement of suspensions containing nanosized alumina particles. J. Appl. Phys. 2002, 91, 4568–4572. [Google Scholar] [CrossRef]
  31. Maheshwary, P.B.; Handa, C.C.; Nemade, K.R.; Chaudhary, S.R. Role of nanoparticle shape in enhancing the thermal conductivity of nanofluids. Mater. Today Proc. 2020, 28, 873–878. [Google Scholar] [CrossRef]
  32. Murshed, S.M.S.; Leong, K.C.; Yang, C. Enhanced thermal conductivity of TiO2--water based nanofluids. Int. J. Therm. Sci. 2005, 44, 367–373. [Google Scholar] [CrossRef]
  33. Timofeeva, E.V.; Routbort, J.L.; Singh, D. Particle shape effects on thermophysical properties of alumina nanofluids. J. Appl. Phys. 2009, 106, 014304. [Google Scholar] [CrossRef]
  34. Vallejo, J.P.; Febrero-Garrido, L.; Cacabelos, A.; González-Gil, A.; Lugo, L. Influence of crystal structure on the thermophysical properties and figures-of-merit of propylene glycol: Water-based SiC nanofluids. Powder Technol. 2024, 433, 119299. [Google Scholar] [CrossRef]
  35. Krishnamurthy, S.; Bhattacharya, P.; Phelan, P.E.; Prasher, R.S. Enhanced Mass Transport in Nanofluids. Nano Lett. 2006, 6, 419–423. [Google Scholar] [CrossRef]
  36. Hu, P.; Shan, W.L.; Yu, F.; Chen, Z.S. Thermal Conductivity of AlN-Ethanol Nanofluids. Int. J. Thermophys. 2008, 29, 1968–1973. [Google Scholar] [CrossRef]
  37. Kwak, K.; Kim, C. Viscosity and thermal conductivity of copper oxide nanofluid dispersed in ethylene glycol. Korea-Aust. Rheol. J. 2005, 17, 35–40. [Google Scholar]
  38. Das, S.K.; Putra, N.; Thiesen, P.; Roetzel, W. Temperature Dependence of Thermal Conductivity Enhancement for Nanofluids. J. Heat Transf. 2003, 125, 567–574. [Google Scholar] [CrossRef]
  39. Duangthongsuk, W.; Wongwises, S. Measurement of temperature-dependent thermal conductivity and viscosity of TiO2-water nanofluids. Exp. Therm. Fluid Sci. 2009, 33, 706–714. [Google Scholar] [CrossRef]
  40. Turgut, A.; Tavman, I.; Chirtoc, M.; Schuchmann, H.P.; Sauter, C.; Tavman, S. Thermal Conductivity and Viscosity Measurements of Water-Based TiO2 Nanofluids. Int. J. Thermophys. 2009, 30, 1213–1226. [Google Scholar] [CrossRef]
  41. Wang, X.; Xu, X.; Choi, S. Thermal conductivity of nanoparticle-fluid mixture. J. Thermophys. Heat Transf. 1999, 13, 474–480. [Google Scholar] [CrossRef]
  42. Maxwell, J.C. A Treatise on Electricity and Magnetism, 2nd ed.; Clarendon Press: Oxford, UK, 1881. [Google Scholar]
  43. Hamilton, R.; Crosser, O. Thermal conductivity of heterogeneous two-component systems. Ind. Eng. Chem. Fundam. 1962, 1, 187–191. [Google Scholar] [CrossRef]
  44. Koo, J.; Kleinstreuer, C. A new thermal conductivity model for nanofluids. J. Nanoparticle Res. 2004, 6, 577–588. [Google Scholar] [CrossRef]
  45. Koo, J.; Kleinstreuer, C. Laminar nanofluid flow in microheat-sinks. Int. J. Heat Mass Transf. 2005, 48, 2652–2661. [Google Scholar] [CrossRef]
  46. Li, C.; Peterson, G. Experimental investigation of temperature and volume fraction variations on the effective thermal conductivity of nanoparticle suspensions (nanofluids). J. Appl. Phys. 2006, 99, 084314. [Google Scholar] [CrossRef]
  47. Nair, V.; Parekh, A.D.; Tailor, P.R. Water-based Al2O3, CuO and TiO2 nanofluids as secondary fluids for refrigeration systems: A thermal conductivity study. J. Braz. Soc. Mech. Sci. Eng. 2018, 40, 262. [Google Scholar] [CrossRef]
  48. Kundan, L.; Mallick, S.S.; Pal, B. An investigation into the effect of nanoclusters growth on perikinetic heat conduction mechanism in an oxide based nanofluid. Powder Technol. 2017, 311, 273–286. [Google Scholar] [CrossRef]
  49. Zhi, C.Y.; Xu, Y.B.; Bando, Y.; Golberg, D. Highly Thermo-conductive Fluid with Boron Nitride Nanofillers. Acs Nano 2011, 5, 6571–6577. [Google Scholar] [CrossRef]
  50. Chen, H.; Yang, W.; He, Y.; Ding, Y.; Zhang, L.; Tan, C.; Lapkin, A.; Bavykin, D. Heat transfer and flow behaviour of aqueous suspensions of titanate nanotubes (nanofluids). Powder Technol. 2008, 183, 63–72. [Google Scholar] [CrossRef]
  51. Chen, H.S.; Ding, Y.L.; Tan, C.Q. Rheological behaviour of nanofluids. New J. Phys. 2007, 9, 367. [Google Scholar] [CrossRef]
  52. Kole, M.; Dey, T. Thermal conductivity and viscosity of Al2O3 nanofluid based on car engine coolant. J. Phys. D Appl. Phys. 2010, 43, 315501. [Google Scholar] [CrossRef]
  53. Yu, W.; Xie, H.Q.; Li, Y.; Chen, L.F. Experimental investigation on thermal conductivity and viscosity of aluminum nitride nanofluid. Particuology 2011, 9, 187–191. [Google Scholar] [CrossRef]
  54. He, Y.; Jin, Y.; Chen, H.; Ding, Y.; Cang, D.; Lu, H. Heat transfer and flow behaviour of aqueous suspensions of TiO2 nanoparticles (nanofluids) flowing upward through a vertical pipe. Int. J. Heat Mass Transf. 2007, 50, 2272–2281. [Google Scholar] [CrossRef]
  55. Schmidt, A.J.; Chiesa, M.; Torchinsky, D.H.; Johnson, J.A.; Boustani, A.; McKinley, G.H.; Nelson, K.A.; Chen, G. Experimental investigation of nanofluid shear and longitudinal viscosities. Appl. Phys. Lett. 2008, 92, 244107. [Google Scholar] [CrossRef]
  56. Moosavi, M.; Goharshadi, E.K.; Youssefi, A. Fabrication, characterization, and measurement of some physicochemical properties of ZnO nanofluids. Int. J. Heat Fluid Flow 2010, 31, 599–605. [Google Scholar] [CrossRef]
  57. Namburu, P.K.; Kulkarni, D.P.; Misra, D.; Das, D.K. Viscosity of copper oxide nanoparticles dispersed in ethylene glycol and water mixture. Exp. Therm. Fluid Sci. 2007, 32, 397–402. [Google Scholar] [CrossRef]
  58. Einstein, A. A new determination of the molecular dimensions. Ann. Phys. 1906, 19, 289–306. [Google Scholar] [CrossRef]
  59. Brinkman, H. The viscosity of concentrated suspensions and solutions. J. Chem. Phys. 1952, 20, 571. [Google Scholar] [CrossRef]
  60. Batchelor, G. The effect of Brownian motion on the bulk stress in a suspension of spherical particles. J. Fluid Mech. 1977, 83, 97–117. [Google Scholar] [CrossRef]
  61. Rea, U.; McKrell, T.; Hu, L.-w.; Buongiorno, J. Laminar convective heat transfer and viscous pressure loss of alumina–water and zirconia–water nanofluids. Int. J. Heat Mass Transf. 2009, 52, 2042–2048. [Google Scholar] [CrossRef]
  62. Lundgren, T.S. Slow flow through stationary random beds and suspensions of spheres. J. Fluid Mech. 1972, 51, 273–299. [Google Scholar] [CrossRef]
  63. Maiga, S.; Nguyen, C.; Galanis, N.; Roy, G. Heat transfer behaviours of nanofluids in a uniformly heated tube. Superlattices Microstruct. 2004, 35, 543–557. [Google Scholar] [CrossRef]
  64. Ozturk, S. Microfluidic Investigation of Tracer Dye Diffusion in Alumina Nanofluids. Ph.D. Thesis, Texas A&M University, College Station, TX, USA, 2012. [Google Scholar]
Figure 1. The concentration dependence of thermal conductivity enhancement in refrigerant suspensions containing various nanoparticles is expressed relative to the pure refrigerant by k/k0 (particle- and surfactant-free). Data are shown for dispersions at (a) 2 °C, (b) 12 °C, and (c) 22 °C. The Krytox 157-FSL concentration was 1 vol% in all refrigerant suspensions.
Chemengineering 09 00065 g001
Figure 2. (a) TEM image and the corresponding electron diffraction pattern of Al2O3 nanoparticles used to formulate the suspensions. (b) Temperature dependence of thermal conductivity enhancement in refrigerant suspensions containing Al2O3 nanoparticles, with data expressed relative to the particle-free case, k/k0. (c) Steady shear viscosity measurements show a slight increase at low shear rates. Data shown are obtained over a shear rate sweep from 500 to 10 s−1 after first ramping up from 10 to 500 s−1 to generate reproducible initial conditions. Results are plotted relative to the particle-free case, η/η0. Experiments were carried out at constant temperatures (2 °C, 12 °C, and 22 °C). All refrigerant solutions contained 1 vol% Krytox 157-FSL.
Chemengineering 09 00065 g002
Figure 3. (a) TEM image and the corresponding electron diffraction pattern of dry AlN nanoparticles. (b) Small change in thermal conductivity enhancements at high temperatures. (c) Steady shear viscosity measurements of refrigerant suspensions containing AlN nanoparticles, with data expressed relative to the particle-free case, η/η0. The experimental conditions are the same as those in the Al2O3 measurements.
Chemengineering 09 00065 g003
Figure 4. (a) TEM image and the corresponding electron diffraction pattern of dry ZnO nanoparticles. (b) Thermal conductivity of suspensions shows appreciable enhancement only at high temperatures. (c) A similar viscosity enhancement trend is observed in steady shear measurements. The experimental conditions are the same as those in the Al2O3 measurements.
Chemengineering 09 00065 g004
Figure 5. (a) TEM image and the corresponding electron diffraction pattern of dry CuO nanoparticles. (b) The refrigerant suspensions of CuO display less than 5% enhancement in thermal conductivity. (c) The remarkable increase in steady shear viscosity is easily noticed again at low shear rates. The experimental conditions are the same as those in the Al2O3 measurements.
Chemengineering 09 00065 g005
Figure 6. (a) TEM image and the corresponding electron diffraction pattern of dry TiO2 nanoparticles used to formulate the suspensions. (b) Temperature dependence of thermal conductivity enhancement in refrigerant suspensions containing TiO2 nanoparticles, with data expressed relative to the particle-free case, k/k0. (c) Steady shear viscosity measurements show a slight increase at low shear rates (data shown are obtained over a shear rate sweep from 500 to 10 s−1 after first ramping up from 10 to 500 s−1 to generate a reproducible initial condition; results are plotted relative to the particle-free case, η/η0). Experimental conditions are the same as those for the Al2O3 measurements.
Chemengineering 09 00065 g006
Table 1. Typical physical properties of HFE-7500 used in DLS and zeta potential measurements.
MaterialViscosity (cP)Dielectric ConstantRefractive Index
HFE-75001.31 *5.8 **1.298 ***
* Obtained from our viscosity measurements. ** Provided by 3M catalog [13]. *** Measured using an Abbe Refractometer-C10.
Table 3. Bulk characterization of nanoparticle suspensions (complete dataset is provided in (Tables S3 and S4 in Supporting Information).
Suspension Composition *Zeta Potential ** (mV)Particle Size *** (nm)
Al2O3−35.69 ± 1.78390.45 ± 28.04
AlN−42.72 ± 1.43281.27 ± 18.99
ZnO−54.37 ± 2.04212.30 ± 11.77
CuO−43.22 ± 4.51143.47 ± 8.33
TiO2−36.63 ± 3.4477.75 ± 15.16
* All suspensions contain nanoparticles at 0.02 vol% solution, except CuO and TiO2 (0.004 vol%). The Krytox 157-FSL concentration was 0.09 vol%. ** Mean ± sd (n = 10). *** Mean ± sd (n = 6).
Table 4. Summary of thermal characterization studies involving nanoparticles.
MaterialLoadingHost FluidTemperature (°C)DispersantMeasurement MethodObservationsReference
Al2O3,
AlN,
ZnO,
CuO,
TiO2,
0.25–1 vol%HFE-75002, 12, 22Krytox 157-FSLTransient hot wire (KD2)Up to ~10–15% increase at 22 °C, ~10% increase at 2 °C, ~5–10% increase at 22 °C, ~5% increase at 2 °C, ~5% increases at 2 °C and 22 °C in thermal conductivity, respectively.This work
Al2O3 1 vol%Water27Tween 80Up to ~7% increase at 27 °C in thermal conductivity.[35]
Al2O3 1 vol%Water25CTABTransient hot wireUp to ~12% increase at 25 °C in thermal conductivity.[7]
AlN1 vol%Ethanol0, 24Castor oilTransient plane sourceUp to ~3% increase at 0 °C, ~8% increase at 24 °C
in thermal conductivity.
[36]
ZnO1 vol%Ethylene glycol20, 30, 40, 50, 60Transient hot wireUp to ~8–9% increase at 20 °C in thermal conductivity.[8]
ZnO, TiO21 vol%Ethylene glycol20SDSTransient hot wireUp to ~6% increase at 20 °C, ~4–5% increase at 20 °C in thermal conductivity.[29]
CuO1 vol%Ethylene glycol25Transient hot wireUp to ~5% increase at 25 °C in thermal conductivity.[37]
CuO1 vol%Water21, 36, 51Temperature oscillationUp to ~6% increase at 21 °C in thermal conductivity.[38]
TiO21 vol%Water15, 25, 35Transient hot wireUp to ~4–5% increase at 15 °C and 25 °C in thermal conductivity.[39]
TiO21 vol%Water13, 23, 40, 553w wireUp to ~3% increase at 13 °C and 23 °C in thermal conductivity.[40]
Table 5. Theoretical models used for predicting thermal conductivity of nanorefrigerants.
ModelSuggested FormulaDescription
Maxwell * [42] k eff k f = k p + 2 k f + 2 ( k p k f ) ϕ k p + 2 k f 2 ( k p k f ) ϕ For large, spherical, and non-interacting particles in dilute systems
Hamilton and Crosser ** [43] k eff k f = k p + k f ( n 1 ) + ( k p k f ) ( n 1 ) ϕ k p + k f ( n 1 ) ( k p k f ) ϕ Applicable to cylindrical particles with empirical shape factor
Koo and Kleinstreuer *** [44,45] k eff k f = k p + 2 k f + 2 ( k p k f ) ϕ k p + 2 k f 2 ( k p k f ) ϕ + 5 · 10 4 β ρ f C f ϕ ( k B T ρ p D ) ( f ( T , ϕ ) k f ) Inclusion of physical properties
Li and Peterson [46] k eff k f = 0.764481464 ϕ + 0.018688867 T 0.462147175 Empirical equation with temperature variable
Nair et al. [47] k eff k f = 0.86449 + 0.029556 ϕ + ( 1.1730 · 10 3 · k p ) ( 4.01862 · 10 4 · D ) + ( 5.56584 · 10 4 · T ) + ( 3.93950 · 10 4 · ϕ · k p ) Equation formulated through experimental trial
Kundan et al. [48] k eff k f = 1 + 7.47 ϕ Assumes volume fraction is responsible for thermal conductivity increases
* Where keff, kp, and kf are the thermal conductivities of the suspension, nanoparticle, and base fluid, respectively; ϕ is the suspension volume percentage; and ** n is the empirical shape factor, defined as n = 3/ϕ. The particle sphericity, ϕ, is the ratio of the surface area of a sphere to the surface area of the particle, and its values for a sphere and a cylinder are equal to 1 and 0.5, respectively. *** T is the temperature; ρf and Cf are the density and heat capacity of the fluid, respectively; ρp is the particle density; kB is the Boltzmann constant (1.381 × 10⁻²³ J/K); D is the particle diameter; T is the temperature, f as a function of volume fraction and temperature and can be defined as f ( T , ϕ ) = ( 0.4705 6.04 ϕ ) T + 1722.3 ϕ 134.63 ; and β is an empirically determined parameter with β = [ 0.0137 ( 100 ϕ ) 0.8229 , ϕ < 0.01 |   and   | 0.0011 ( 100 ϕ ) 0.7272 , ϕ > 0.01 ] .
Table 6. Summary of rheological studies involving nanoparticle suspensions.
MaterialLoadingHost FluidTemperature (°C)DispersantMeasurement MethodObservationsReference
Al2O3,
AlN,
ZnO,
CuO,
TiO2,
0.25–1 vol%HFE-75002, 12, 22Krytox 157-FSLParallel plate CP 50-1Up to ~10–15% increase, ~10–18% increase, ~10–16% increase, ~15–18% increase, ~15–20% increase in viscosity, respectively. (Enhancement as a function of concentration, shear thinning behavior at elevated temperatures and high loadings)This work
Al2O3 1 vol%Decane
polyalphaolefin
22Sorbitan monolaurateUp to ~10% increase in viscosity.[55]
Al2O3 1 vol%Engine coolant (HP KOOLGARD)10, 20, 30Oleic acidRotational type
Spindle
Up to ~65–70% increase in viscosity. (Shear thinning behavior)[52]
AlN5 vol%Ethylene glycol and propylene lycol20Rotational type
Spindle SC-18
Up to ~65–70% increase in viscosity. (Shear thinning behavior)[53]
ZnO0.6 vol%Ethylene glycol25Ammonium citrateOstwald ViscometerUp to ~26% increase in viscosity.[56]
ZnO2 vol%Ethylene glycol20, 30, 40, 50, 60Rotational type
Spindle SC-18
Up to ~22% increase in viscosity.
(Shear thinning behavior when f v > 0.02 )
[8]
CuO1 vol%Ethylene glycol25Rotational type
Couette fixture
Up to ~90% increase in viscosity. (Shear thinning behavior)[37]
CuO1 vol%Ethylene glycol and water−35, −30, −20, −10, 0, 10, 20, 30, 40, 50Rotational type
Spindle SC-18
Up to ~20–25% increase in viscosity. (Newtonian behavior)[57]
TiO21 vol%Water15, 25, 35Parallel plateUp to ~17% increase in viscosity.[39]
TiO21 vol%Water13Vibration Viscometer SV-10Up to ~19% increase in viscosity.[40]
TiO21.2 vol%Water22Rotational type
Couette fixture
(Mooney cell)
Up to ~11% increase in viscosity. (Shear thinning behavior)[54]
Table 7. Theoretical models used for predicting viscosity variation.
Model Suggested Formulas *Description
Einstein [58] μ eff μ f = 1 + 2.5 ϕ Spherical and non-interacting particles for ϕ < 0.02
Brinkman [59] μ eff μ f = 1 ( 1 ϕ ) 2.5 Extension of Einstein equation for ϕ < 0.04
Batchelor [60] μ eff μ f = 1 + 2.5 ϕ + 6.2 ϕ 2 Spherical particles with interaction of pair particles considering Brownian motion for ϕ < 0.1
Modified Krieger and Dougherty [51] μ eff μ f = ( 1 ϕ a ϕ m ) 2.5 ϕ m , ϕ a = ϕ ( a a a ) 3 D Aggregation of particles, full range of ϕ
Maiga et al. [48] μ e f f μ f = 1 + 7.3 ϕ 123 ϕ 2 Found through experimental trial
Rea et al. [61] μ e f f μ f = e ( 4.91 ϕ 0.2092 ϕ ) Developed through regression analysis
Lundgren [62] μ e f f μ f = 1 + 2.5 ϕ + 25 4 ϕ 2 + ϕ 3 Applied Taylor series expansion to Einstein model
* Where μeff and μf are the viscosities of the suspension and base fluid, respectively; ϕ is the suspension volume percentage; and aa and am are the radii of aggregates and primary particles, respectively. ϕm is the maximum particle packing fraction, which varies from 0.495 to 0.54 under quiescent conditions and is approximately 0.605 at high shear rates. D is the fractal index having a typical value of 1.8 for nanofluids.
Disclaimer/Publisher’s Note: The statements, opinions and data contained in all publications are solely those of the individual author(s) and contributor(s) and not of MDPI and/or the editor(s). MDPI and/or the editor(s) disclaim responsibility for any injury to people or property resulting from any ideas, methods, instructions or products referred to in the content.

